Article

A Simplified Model for Substrate-Cultivated Pepper in a Hexi Corridor Greenhouse

College of Horticulture, Gansu Agricultural University, Lanzhou 730070, China
*
Author to whom correspondence should be addressed.
Agronomy 2025, 15(8), 1921; https://doi.org/10.3390/agronomy15081921
Submission received: 19 June 2025 / Revised: 5 August 2025 / Accepted: 7 August 2025 / Published: 8 August 2025
(This article belongs to the Section Water Use and Irrigation)

Abstract

The aim of this study was to investigate the method of estimating actual crop evapotranspiration (ETc act) in a greenhouse using other measured meteorological parameters when solar radiation (Rs) data are missing. The study estimated ETc act of greenhouse green peppers by combining solar radiation estimation models with the Penman–Monteith (PM) model and evaluated model performance. The results showed that the prediction accuracy of the temperature-based solar radiation model was higher than the model based on sunshine hours in the Hexi Corridor region. The effect of the insulation cover on the incident solar radiation in the greenhouse is modeled by introducing a ramp function. In terms of crop coefficients (Kcb), the initial Kcb value of green peppers in the 2023 growing season was generally consistent with the updated FAO-56 standard values, whereas the initial Kcb values (0.17) were higher than the standard values in the 2023–2024 growing season. During the two growing seasons, the mid-stage Kcb values were 1.01 in the 2023 growing season and 0.82 in the 2023–2024 growing season. The study also found that PM–RT4, PM–RT5, and PM–RT6 models were all able to accurately predict the ETc act of greenhouse green peppers during the 2023 growing season. The PM–RT4 model performed well in both growing seasons, with R2 = 0.8101 in the 2023 growing season and R2 = 0.7561 in the 2023–2024 growing season. Our research supports the PM–RT4 model as appropriate to estimate green pepper actual evapotranspiration in Gobi solar greenhouses (GSGs) and may be further used to improve irrigation scheduling for green peppers grown in GSGs.

1. Introduction

Rapid population increase and economic development have negatively impacted the natural environment. Industrialization and urbanization have led to the reduction of arable land in developing countries, while existing lands face desertification and salinization [1,2,3]. The fundamental difficulty facing human society at this time is how to generate enough food to meet expanding social requirements while also advancing sustainable development in an era of increasing natural resource scarcity. In this environment, agricultural development in non-cultivated areas such as deserts, including the Gobi Desert, and salty plains has emerged as a potential source of both economic and ecological value [4].
In many dry and semi-arid climate zones, significant tracts of land unsuited for cultivation (designated as non-arable land) exist, such as the Gobi Desert, which has a non-arable area of 1.95 million hectares in China’s six northwestern provinces [5]. The development and utilization of these non-cultivated lands for agricultural production constitutes a pivotal strategy for addressing the discrepancy between population growth and food production [4,6,7]. However, severe water scarcity in Northwest China imposes significant irrigation constraints on local agriculture. Compared to open-field systems, Gobi solar greenhouses (GSGs) demonstrate superior water conservation efficiency through three integrated mechanisms: (1) As enclosed systems with self-contained microenvironments, GSGs rely exclusively on irrigation as the crop water source, where internal humidity derives solely from soil evaporation and plant transpiration, and water loss occurs primarily through restricted air exchange via limited vents; (2) Furthermore, given the unsuitability of native Gobi soils for cultivation, GSGs employ substrate-based cultivation (e.g., substrate tanks or substrate pots) while physically isolating substrate from Gobi soils via plastic membranes, thereby eliminating irrigation percolation losses; (3) Finally, the high-humidity conditions maintained within GSGs suppress transpiration rates, collectively reducing overall water consumption. On this basis, the application of water-saving technologies such as drip irrigation and mulching further reduces water loss due to soil evaporation. The advancement of GSGs is critical to the development of water-saving agriculture, better water utilization, and the scientific management and optimization of water resources in dry regions. However, in actual production, farmers lack a comprehensive understanding of the water balance of the facility system, and irrigation is determined on the basis of experience and lacks scientific and quantitative guidance. This has led to inefficient use of water resources and higher production costs.
In order to further improve water utilization and optimize the irrigation system, it is necessary to clarify the water demand pattern of substrate cultivation crops grown in GSGs. The crop evapotranspiration (ETc) is an important indicator for determining the water demand pattern of crops, which is obtained by calculating the product of the reference evapotranspiration (ETo) and the crop coefficient (Kc) [8]. The Penman–Monteith (PM) model was endorsed by the Food and Agriculture Organization (FAO) in 1998 as a standard method for reference evapotranspiration (ETo) and has been extensively utilized globally [9]. However, the model requires numerous input parameters, including solar radiation, maximum and minimum air temperature, relative humidity, and wind speed. While ambient temperature observations are simple and data are readily available, solar radiation data are more difficult to test, and data are prone to being missing or of poor quality, making ETo calculations difficult [10]. Based on field-cultivated crops, several simple models have been devised to determine ETo [11,12,13]. However, the microenvironment in a greenhouse is significantly different from that in a field, characterized by high humidity and low wind speed [14], as well as the unique substrate cultivation pattern of the GSGs.
The actual crop evapotranspiration in greenhouse cultivation is mainly influenced by crop variety characteristics, soil moisture, and micrometeorological factors [15]. There are many reports on the simulation of actual crop evapotranspiration, such as FAO-56 Penman–Monteith [9], Hargreaves et al. [16], and Priestley–Taylor [17] models. However, these models are based on specific climatic conditions, requiring localized calibration parameters that are difficult to obtain, primarily due to challenges in acquiring solar radiation data, thus limiting their popularization and application in production practice. As mentioned earlier, methods for estimating ETc act using limited meteorological data have been widely used for field crops. We attempted to apply such methods to the estimation of crop transpiration in solar greenhouses. A solar greenhouse is characterized by low and stable wind speed, and temperature and relative humidity data are readily obtainable using low-cost, high-precision sensors. The difficulty lies in the accurate estimation of incident solar radiation in solar greenhouses.
For estimates of solar radiation, researchers created a variety of models for calculating solar radiation using other meteorological data [18,19]. These include neural network models [20,21], remote sensing inversion models [22], physical radiative transfer models [23], and empirical models based on meteorological data [24]. Meteorological data-based models are the most commonly and widely used models in the world for hydrological and agricultural research because the model inputs are freely accessible and computationally inexpensive [25,26]. For example, Hargreaves et al. [16] proposed a temperature-based model to estimate solar radiation; however, the model is affected by site humidity, wind speed, and climatic environment. Allen et al. [9] provided an elevation parameter on this basis, which is used to improve the estimation accuracy of the model. Annandale et al. [27] introduced a tuning parameter for reducing the effect of large bodies of water on air quality, thereby improving the model’s applicability. Samani [28] proposed a method to estimate solar radiation based on latitude and daily temperature difference, and the results showed that the model estimation error has a maximum of 15%. Chen et al. [29] proposed a novel model for estimating solar radiation, based on the daily difference in temperature, by analyzing data from 48 stations in China. Hassan et al. [30] proposed a novel model for estimating solar radiation using air temperature and verified the accuracy of the model for application in desert areas. These models have the advantage of simple input parameters and are also widely used in solar radiation estimation [9,11]. However, applications in greenhouses are very rare.
This study aims to develop an improved evapotranspiration model for substrate-cultivated green peppers in solar greenhouses in the Hexi Corridor. We have attempted to develop a model that can be operated without excessive equipment and personnel requirements, without compromising the accuracy of ETc act estimation. The results of this study are expected to provide practical guidance for production and to assist farmers in the management of solar greenhouses.

2. Materials and Methods

2.1. Study Area

The study region is situated in Zongzhai Town, Suzhou District, Jiuquan City (central western part of the Hexi Corridor), Gansu Province (39°10′ N, 98°20′ E; elevation: 1477 m) (Figure 1). The Hexi Corridor is dominated by the Gobi Desert, with sparse vegetation and species of perennials supplemented by annuals. This region has a typical continental desert climate, with an average annual temperature of 9.3 °C and 158 days of frost-free weather. It is a typical dry region in Northwest China (82 mm annually). The area receives considerable solar radiation, with an average of 3100 h of sunshine annually (corresponding to total solar radiation of 6300 MJ·m−2).

2.2. Growing Conditions

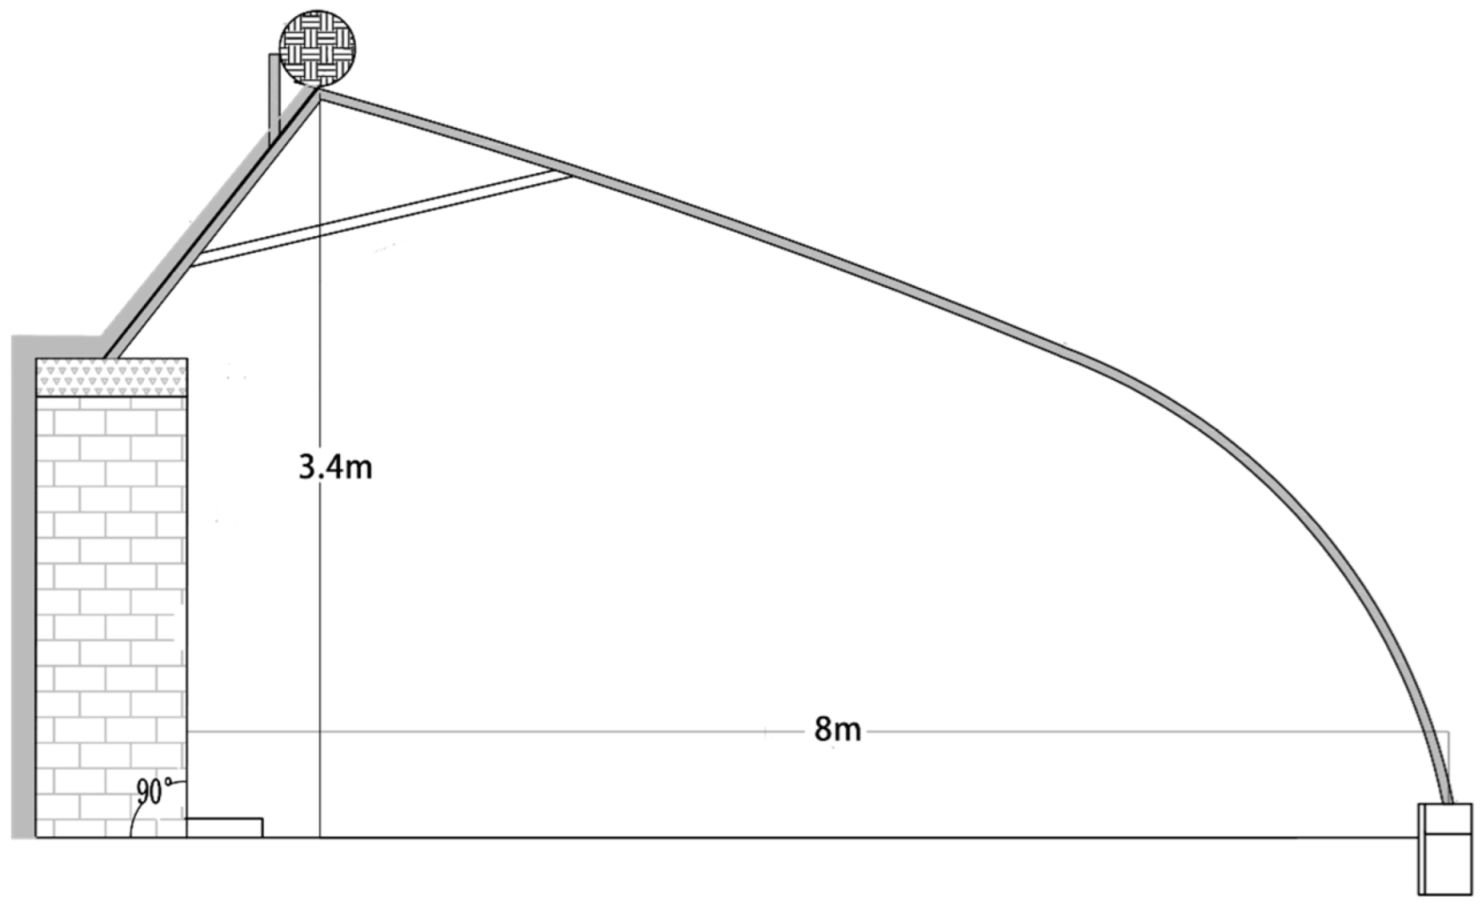
The greenhouse was oriented east-west and constructed of brick walls and steel frame with a length of 50.0 m and a span of 8.0 m (Figure 2). The south roofing material is 0.12 mm polyolefin (PO) film with a light transmittance of 90%. No additional heating system was installed. From November to May, insulation curtains are used overnight to maintain temperatures. Daytime temperature and humidity inside the greenhouse are controlled through a roof vent with a maximum opening of 0.5 m.
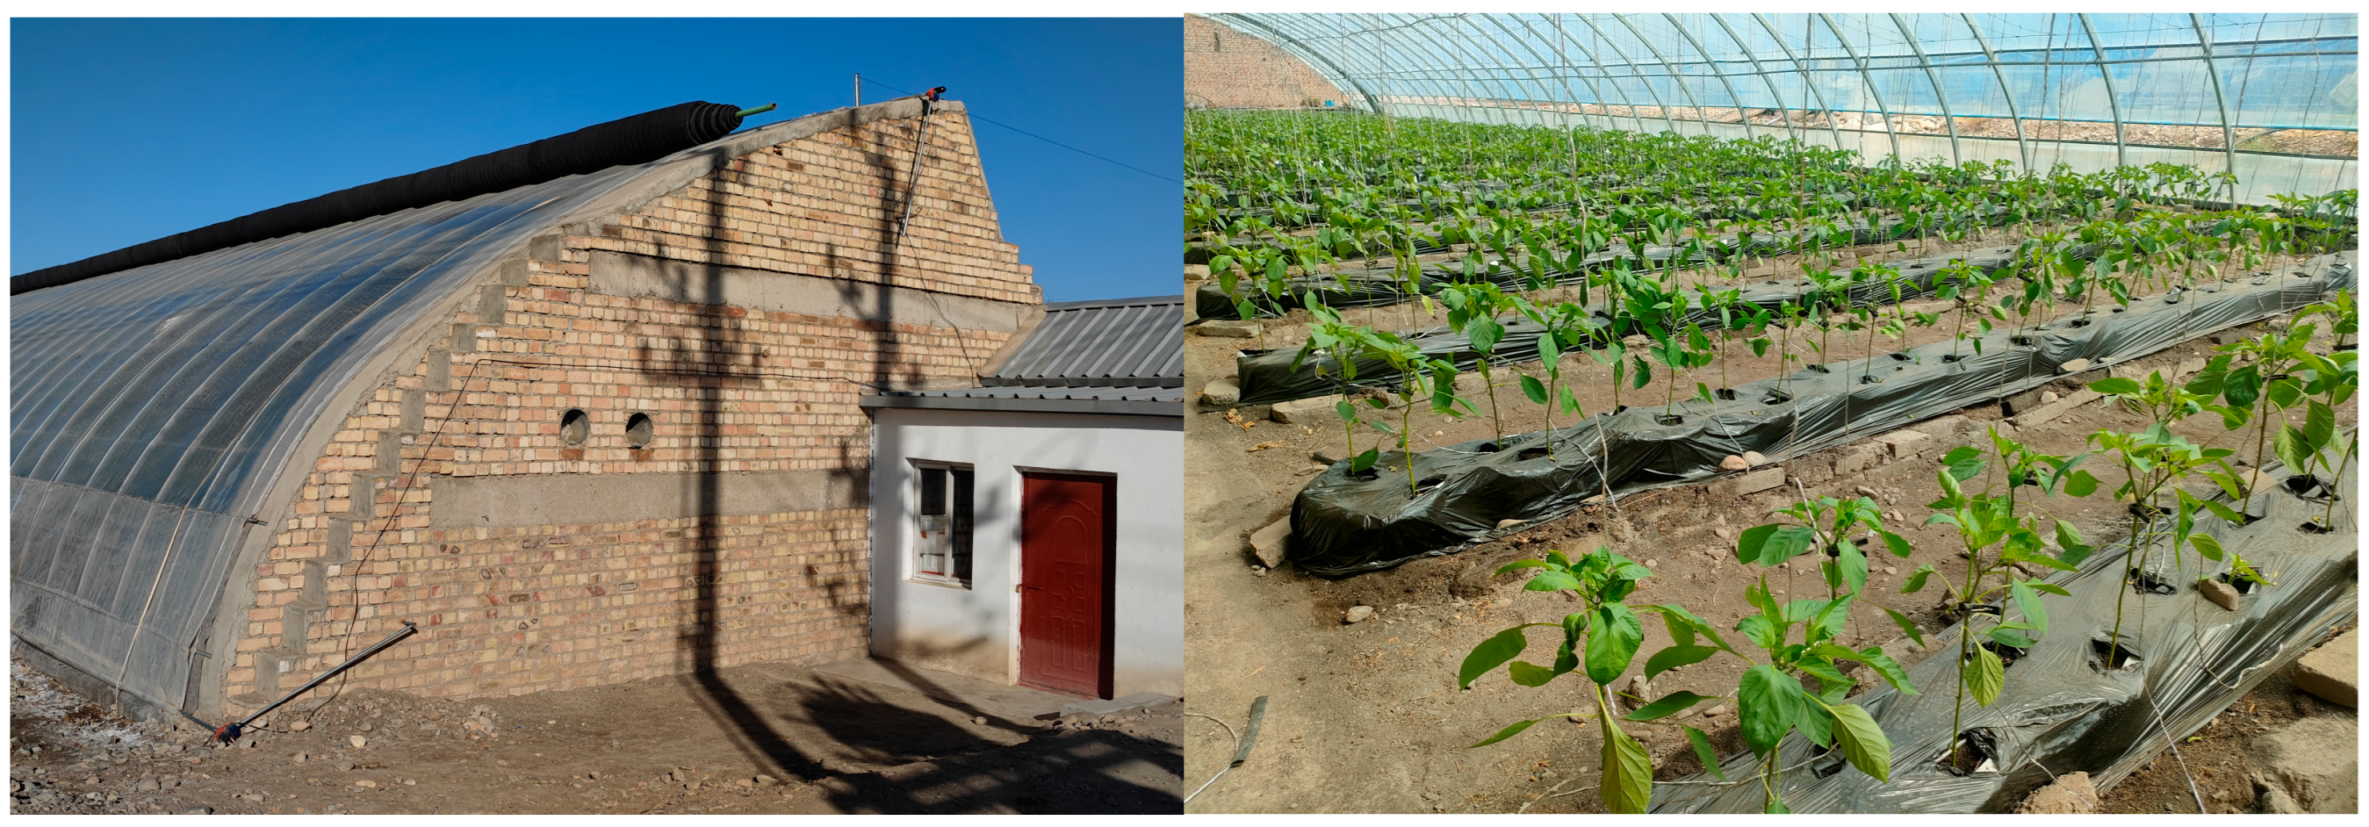
Substrate cultivation patterns are used in the greenhouse (Figure 3): substrate pots (volume: 20.1 L) oriented north-south were filled with a substrate comprising slag, corn stover, and livestock manure compound and laid on the surface of Gobi land. The physical properties of the substrate were determined using the oven-drying method. The mean bulk density of the substrate was 0.6 g·cm−3, the field water capacity was 0.459 (cm3·cm−3), and the mean wilting point was 0.080 (cm3·cm−3), as determined by the standardized oven-drying methods [31] and centrifugation method [32]. To determine field capacity, three substrate-filled pots were saturated to excess and allowed to drain naturally for 12 h in an inverted position while cheesecloth-covered. Triplicate samples per pot were collected using aluminum containers (Vb = 79 cm3), weighed (msat), oven-dried at 80 °C for 120 h, and reweighed (mdry) to calculate field capacity. The wilting point was determined through the centrifugation method [32] using a high-speed refrigerated centrifuge (Shanghai Lu Xiangyi Centrifuge Instrument Co., Ltd., Shanghai, China). The sample was placed in three centrifuge tubes (Vc = 50 mL) with small holes at the bottom and centrifuged at 9100 rpm (equivalent to 1500 kPa) for two hours at 4 °C, followed by gravimetric measurement of the moist mass (mwet). The sample was then oven-dried at 80 °C for 120 h and reweighed (mdry,WP) to calculate the wilting point.
The method calculated the bulk density (ρb), field capacity (θFC), and wilting point (θWP) of the substrate according to the following equations [31,32]:
ρ b = m d r y V b
θ F C = m s a t m d r y V b
θ W P = m w e t m d r y , W P V c
There were 31 rows throughout the greenhouse with 16 substrate pots per row. Two green pepper seedlings were transplanted per substrate pot, with rows spaced 0.6 m apart and plants within each row spaced 0.2 m apart. Drip irrigation was employed using local groundwater (pH 7.5, electrical conductivity 0.48 dS·m−1). Pepper plants were irrigated to 90% of field capacity when the average volumetric water content of the substrate in the pots decreased to 70% of field capacity. Water-soluble fertilizers were applied via the drip irrigation system at scheduled intervals throughout the growing period to ensure adequate nutrient supply.
The green pepper variety used was Huamei 105. Seedlings were transplanted at the four-true-leaf plus one-apical-bud stage. The first growing season commenced with transplanting on 20 April 2023, to avoid low-temperature damage to seedlings. High temperatures and intense solar radiation caused sunscald injury on green pepper fruits, resulting in the completion of harvest by 1 August 2023, and a total growing season duration of 104 days. Transplanting for the second season occurred on 22 September 2023. This timing served the dual purpose of protecting seedlings from heat stress while allowing pepper plants sufficient time to develop tolerance prior to exposure to cold winter conditions. The harvest concluded on 12 March 2024, with the entire growing season lasting 173 days. This was due to the growth suppression under low-temperature and low-light conditions within the winter greenhouse environment that extended the growth cycle. The surface of the substrate pots were covered with black plastic film to avoid soil evaporation of moisture from the substrate surface (Figure 3). Other agronomic management was conducted during the experimental period, such as fertilization, pollination, and pest control.

2.3. Measurement Items

Green pepper transpiration was calculated using both the water balance method and the weighing method according to Equation (4):
T d = W i + I i W i + 1 / 2
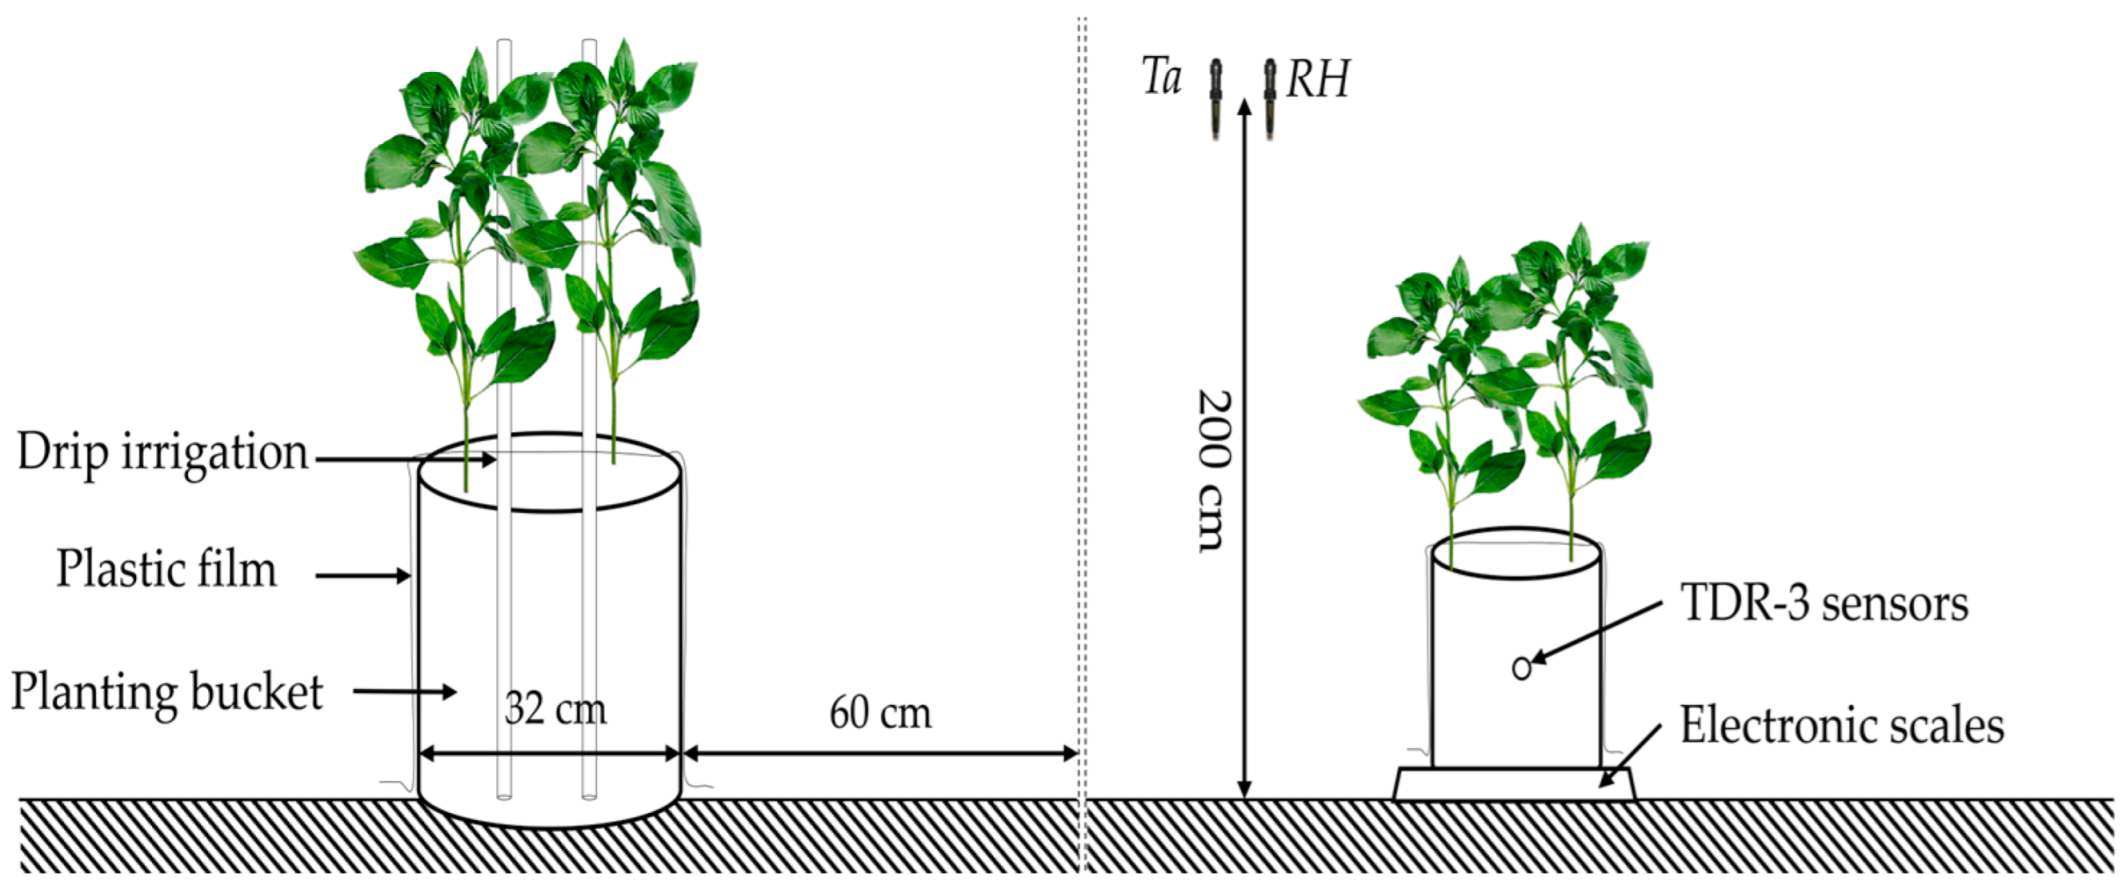
where Td represents daily transpiration per pepper plant (kg), Wi represents the sum of the weight of the substrate pot and the substrate and plant weights (kg), Ii represents the amount of irrigation on day i (kg), and Wi+1 represents the sum of the weight of the substrate pot and the substrate and plant weights on day i + 1 (kg). Water irrigation volumes were recorded using water meters (accuracy ± 0.1 L). Moisture content was measured using TDR-3 soil moisture sensors (Jinzhou Sunshine Weather Co. Ltd., Jingzhou, China) with an accuracy of ± 2%. Readings were logged using PC-2SQ soil moisture recorders (Jinzhou Sunshine Weather Co. Ltd., Jingzhou, China) at 10-min intervals. Daily, at 8:00 a.m., five labeled substrate pots containing pepper plants were weighed using an electronic scale (capacity 30 kg, accuracy ±1 g). Air temperature and humidity at a height of 2 m (Figure 4) inside the greenhouse and at the same height outside the greenhouse were monitored using an EL-USB-2+ temperature and humidity data logger (Lascar Electronics, Britain, UK). Solar radiation was monitored using the PC-2R Meteorological and Ecological Monitoring System (Jinzhou Sunshine Weather Co. Ltd., Jingzhou, China) at 10-min intervals, with the sensor 2 m above the ground.
After 15 days of transplanting, six plants were randomly selected every seven days for destructive sampling to measure plant height (PH, in cm) and leaf area (LA, in cm2). Each sampling consisted of all plants (six plants) from three replacement pots with uniform growth consistent with those of the monitored pots. PH was measured using a graduated ruler (precision: 0.1 cm) and LA was measured using a scanner (EPSON Canada Ltd., Markham, ON, Canada). Leaf area index (LAI) was calculated by the ratio of LA to ground area occupied by a single plant.

2.4. Estimation, Calculation, and Validation of Transpiration

2.4.1. FAO 56 PM Model

The crop coefficient approach in the FAO 56 PM model calculates daily crop evapotranspiration (ETc, mm·day−1) by considering both crop transpiration and soil evaporation. ETc is calculated according to Equation (5) [9,33]:
E T c = K c b + K e E T o
where Kcb is the basal crop coefficient, Ke is the soil evaporation coefficient, and ETo is the reference evapotranspiration (mm·day−1).
The actual crop coefficient (Kc act) is calculated as the sum of Kcb and Ke, reduced by occurrence of soil water stress. The effects of soil water stress are described by multiplying the Kcb by the water stress coefficient (Ks) [9]:
K c   a c t = K s K c b + K e
In the present study, due to the use of mulching, the requirements for crop water do not encompass soil evaporation. Consequently, the term for soil evaporation should be excluded. Thus, the actual crop evapotranspiration (ETc act, mm·day−1) can be calculated as follows [9]:
E T c   a c t = K c   a c t E T o
The soil water stress coefficient is calculated according to Equation (8) [9]:
K s = T A W D r T A W R A W = T A W D r 1 p T A W D r > R A W 1 D r R A W
where TAW and RAW are the total and readily available water (mm), respectively. Dr is the root zone depletion (mm) and p is the depletion fraction at the initiation of stress (dimensionless). The total and readily available water in the root zone are calculated as follows [8]:
T A W = 1000 θ F C θ W P Z r
R A W = p × T A W
where θFC is the field capacity (0.459 cm3·cm−3), θWP is the wilting point (0.08 cm3·cm−3), Zr is the effective rooting depth (0.25 m), Dr is the root zone depletion (mm), and p is the depletion fraction at the initiation of stress (for pepper, the p is 0.3 during the total growing season) [9].
The soil water balance in the root zone, expressed in terms of depletion at the end of the day, is calculated according to Equation (10) [9]:
D r , i = D r , i 1 P R O i I i C R i + E T c , i + D P i
where Dr,i is the root zone depletion at the end of day i (mm), Dr,i−1 is the root zone depletion at the end of the previous day i − 1 (mm), Pi is the precipitation on day i (mm), ROi is the runoff from the soil surface on day i (mm), Ii is the net irrigation depth on day i that infiltrates the soil (mm), CRi is the capillary rise from the groundwater table on day i (mm), ETc,i is the crop evapotranspiration on day i (mm), and DPi is the water flowing out from the root zone by deep percolation on day i (mm). Dr is solely influenced by irrigation and evapotranspiration in the greenhouse. Calculations determined that DrRAW, resulting in the Ks value of 1 throughout the entire growing season.
An improved method proposed by [8] was used to calculate Kcb:
K c b = 1 f s K c b , min + K c c K c b , f u l l K c b , min
where fs is the leaf senescence factor. In this study, the test varieties were infinite-growth peppers, and the end of harvest was earlier than the natural senescence time, with the value set as 0. Kcb,min is the minimum basal crop coefficient for bare soil (0.1 here) [34]. Canopy cover coefficient (Kcc) can be calculated by the ratio of radiation intercepted by canopy according to Equation (13) [34]:
K c c = 1 e k x L A I
where kx is the extinction coefficient of light attenuation. The basal crop coefficient (Kcb,full) can be approximated as a function of crop height and adjusted for local climatic conditions when the crop nearly has full ground cover according to Equation (14) [8]:
K c b , f u l l = min 1 + 0.1 h c + 0.004 u 2 2 0.004 R H min 45 h c 3 0.3
where hc is the crop height (m), u2 is the air velocity at a height of 2 m (m·s−1), and RHmin is the minimum relative humidity (%).
Fernández et al. [14] suggests using the PM equation with a fixed aerodynamic resistance ra of 295 s·m−1 for better ETo estimation under low wind speeds typical in solar greenhouses. This equation has also been applied to solar greenhouses in Northwest China’s arid desert region [8]. ETo is calculated according to Equation (15):
E T o = 0.408 Δ R n G + γ V P D 628 / T + 273 Δ + 1.24 γ
where Δ is the ramp of the saturation vapor pressure curve (kPa·K−1), Rn is the net radiation (MJ·m−2·day−1), G is the soil heat flux (MJ·m−2·day−1), VPD is the vapor pressure deficit (kPa), and γ is the psychrometric constant (kPa·K−1).
Given the limited temperature range inside the greenhouse, daytime net radiation exchange due to thermal radiation can be ignored, and net radiation intercepted by the crop canopy can be obtained according to Equation (16) [35,36]:
R n = a 1 e k x L A I R s
where a is the inability of plants to absorb all incident radiation. Both pepper and tomato belong to the Solanaceae family and share comparable growth architecture and radiation interception characteristics. As indicated by Katsoulas et al. [35], the parameters a = 0.86 and kx = 0.7 proposed by Bontsema et al. [36] are applicable to the typical geometry of tall greenhouse crops. The model parameters are summarized in Table 1.

2.4.2. Solar Radiation Estimation Model

As indicated by Equation (7), air temperature (Tₐ), vapor pressure deficit (VPD), and solar radiation (Rₛ) constitute fundamental parameters for ETo calculation. In greenhouse production systems, while Tₐ is readily obtainable and VPD can be calculated from air temperature and relative humidity data, the direct measurement of Rₛ presents both economic and technical constraints. To enhance the accessibility of crop transpiration rate data, this study conducted an accuracy evaluation of eight meteorological data-driven solar radiation estimation models. These eight models were chosen based on their widespread use in a wide range of climates across the globe, having simple relationships, basic methodologies, and taking into account commonly measured meteorological variables [37]. These models estimate outdoor solar radiation and serve as the outdoor radiation term in equations estimating incident solar radiation inside the greenhouse. The selected models can be broadly classified into two types (Table 2).
The Ra is estimated based on latitude and solar constant and was calculated from Equations (17)–(20) [9,40]:
R a = 24 × 3600 G s c π k π ω 180 sin L sin δ + cos L cos δ cos ω
k = 1 + 0.033 cos 360 N i 365
δ = 23.45 sin 360 365 284 + N i
ω = cos 1 tan L tan δ
where Gsc is the solar constant (1367 W·m−2), k is the eccentricity correlation factor of the earth’s orbit, Ni is the day number of the year starting from 1 January, δ is the hour angle at sunset (°), L is the latitude angle (°), and ω is the declination angle (°).

2.4.3. Forecasting Incoming and Greenhouse Solar Radiation

The incident solar radiation within the greenhouse is calculated as the product of the external solar radiation and the transmittance coefficient [41]. Incident solar radiation in solar greenhouses is mainly influenced by the light transmittance of the plastic film and the enclosure structure. During winter, it is additionally affected by the coverage time of the thermal blanket. According to Zhang et al.’s [42] solar radiation allocation and spatial distribution in Chinese solar greenhouses, the calculated incident solar radiation transmitted through the south roof surface accounts for 70% of external solar radiation. Throughout the year, the light environment in Gobi greenhouses in the Hexi Corridor region exhibits two distinct changing phases. In Phase I (April–October), incident solar radiation inside the greenhouse is only influenced by the plastic film and enclosure structure.
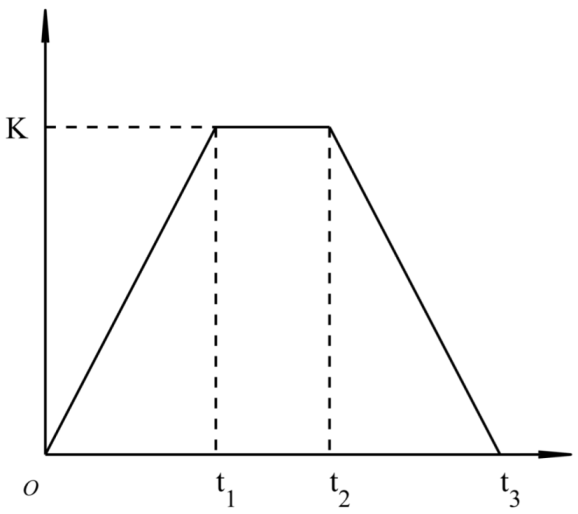
In Phase II (November–March of the following year), the length of time the thermal insulation covered gradually increases from November as the weather gets colder. the thermal insulation cover of the GSGs will gradually extend the covering time in winter and spring. The thermal insulation is opened no earlier than 10:00 a.m. and closed no later than 17:00 p.m. in sunny weather (December and January). The duration of the thermal insulation cover begins to decrease in February as the weather warms up. Therefore, we introduced a ramp function (Table 3 and Figure 5) into the solar radiation estimation model, which was used to improve the prediction accuracy of incident solar radiation in the GSGs during winter and spring seasons. The specific equations are as follows:
l R = K t 1 t 0 t < t 1 K t 1 t t 2 t 3 t 2 K t t 2 t 2 < t < t 3
where lR is the ratio of incident solar radiation to total solar radiation lost as a result of thermal insulation cover, K is the maximum percentage of solar radiation lost by the thermal insulation cover, with a value of 0.2 (based on our observations, under sunny conditions from December 2023 to January 2024, the thermal insulation cover would result in a reduction of incident solar radiation in the GSGs by about 20%), t1 is the time at which the loss of incident solar radiation due to the thermal insulation cover is maximized, t2 is the date when the loss of incident solar radiation due to the thermal insulation cover begins to decrease, and t3 is the date when the loss of incident solar radiation due to the thermal insulation cover is zero.
The daily total incident solar radiation in the GSGs was calculated according to Equation (22):
R s , i n = 0.7   × R s Phase   I 0.7 × 1 l R R s Phase   II

2.5. Meteorological Data Collection and Description

The coefficients of eight traditional solar radiation estimation models were corrected. The applicability of the models in the Hexi Corridor region was verified by using 40 years of meteorological measured data of solar radiation and air temperature at the Jiuquan station in China from 1 January 1979, to 31 December 2018. The data were obtained from the National Tibetan Plateau Data Center of China [43,44,45]. The extraterrestrial solar radiation (Ra) and the maximum possible sunshine hours (N) were calculated by computer programs in MATLAB Student R2021a [30,37]. Environmental data within the greenhouse were statistically processed using Microsoft Excel 2019. Computational evaluation of the model and graphical plotting were performed in MATLAB Student R2021a.

2.6. Evaluation of Model Performance

To assess model prediction accuracy, statistical metrics, such as coefficient of determination (R2), mean absolute error (MAE), mean bias error (MBE), root mean square error (RMSE), and normalized root mean square error (NRMSE), were used [46,47,48]:
R 2 = 1 n i = 1 E i M i 2 n i = 1 M i M ¯ 2
M A E = 1 n i = 1 n E i M i
M B E = 1 n i = 1 n E i M i
R M S E = 1 n i = 1 n E i M i 2
N R M S E = 1 n i = 1 n E i M i 2 M max M min
where Ei is the calculated value, Mi is the measured value, M ¯   is the average value of the measured and calculated values, Mmax is the maximum value of the measured values, Mmin is the minimum value of the measured values, and n is the number of observations.
R2 varies between zero and one (0 ≤ R2 ≤ 1); the closer to one, the better the performance. RMSE reveals the actual division between the estimated and measured values. A model shows a better performance when RMSE is closer to zero. MBE denotes whether a model tends to over or under-estimate. A model is more representative when MBE is closer to zero. A lower NRMSE value generally indicates higher model accuracy.

3. Results

3.1. Variation in Environmental Factors

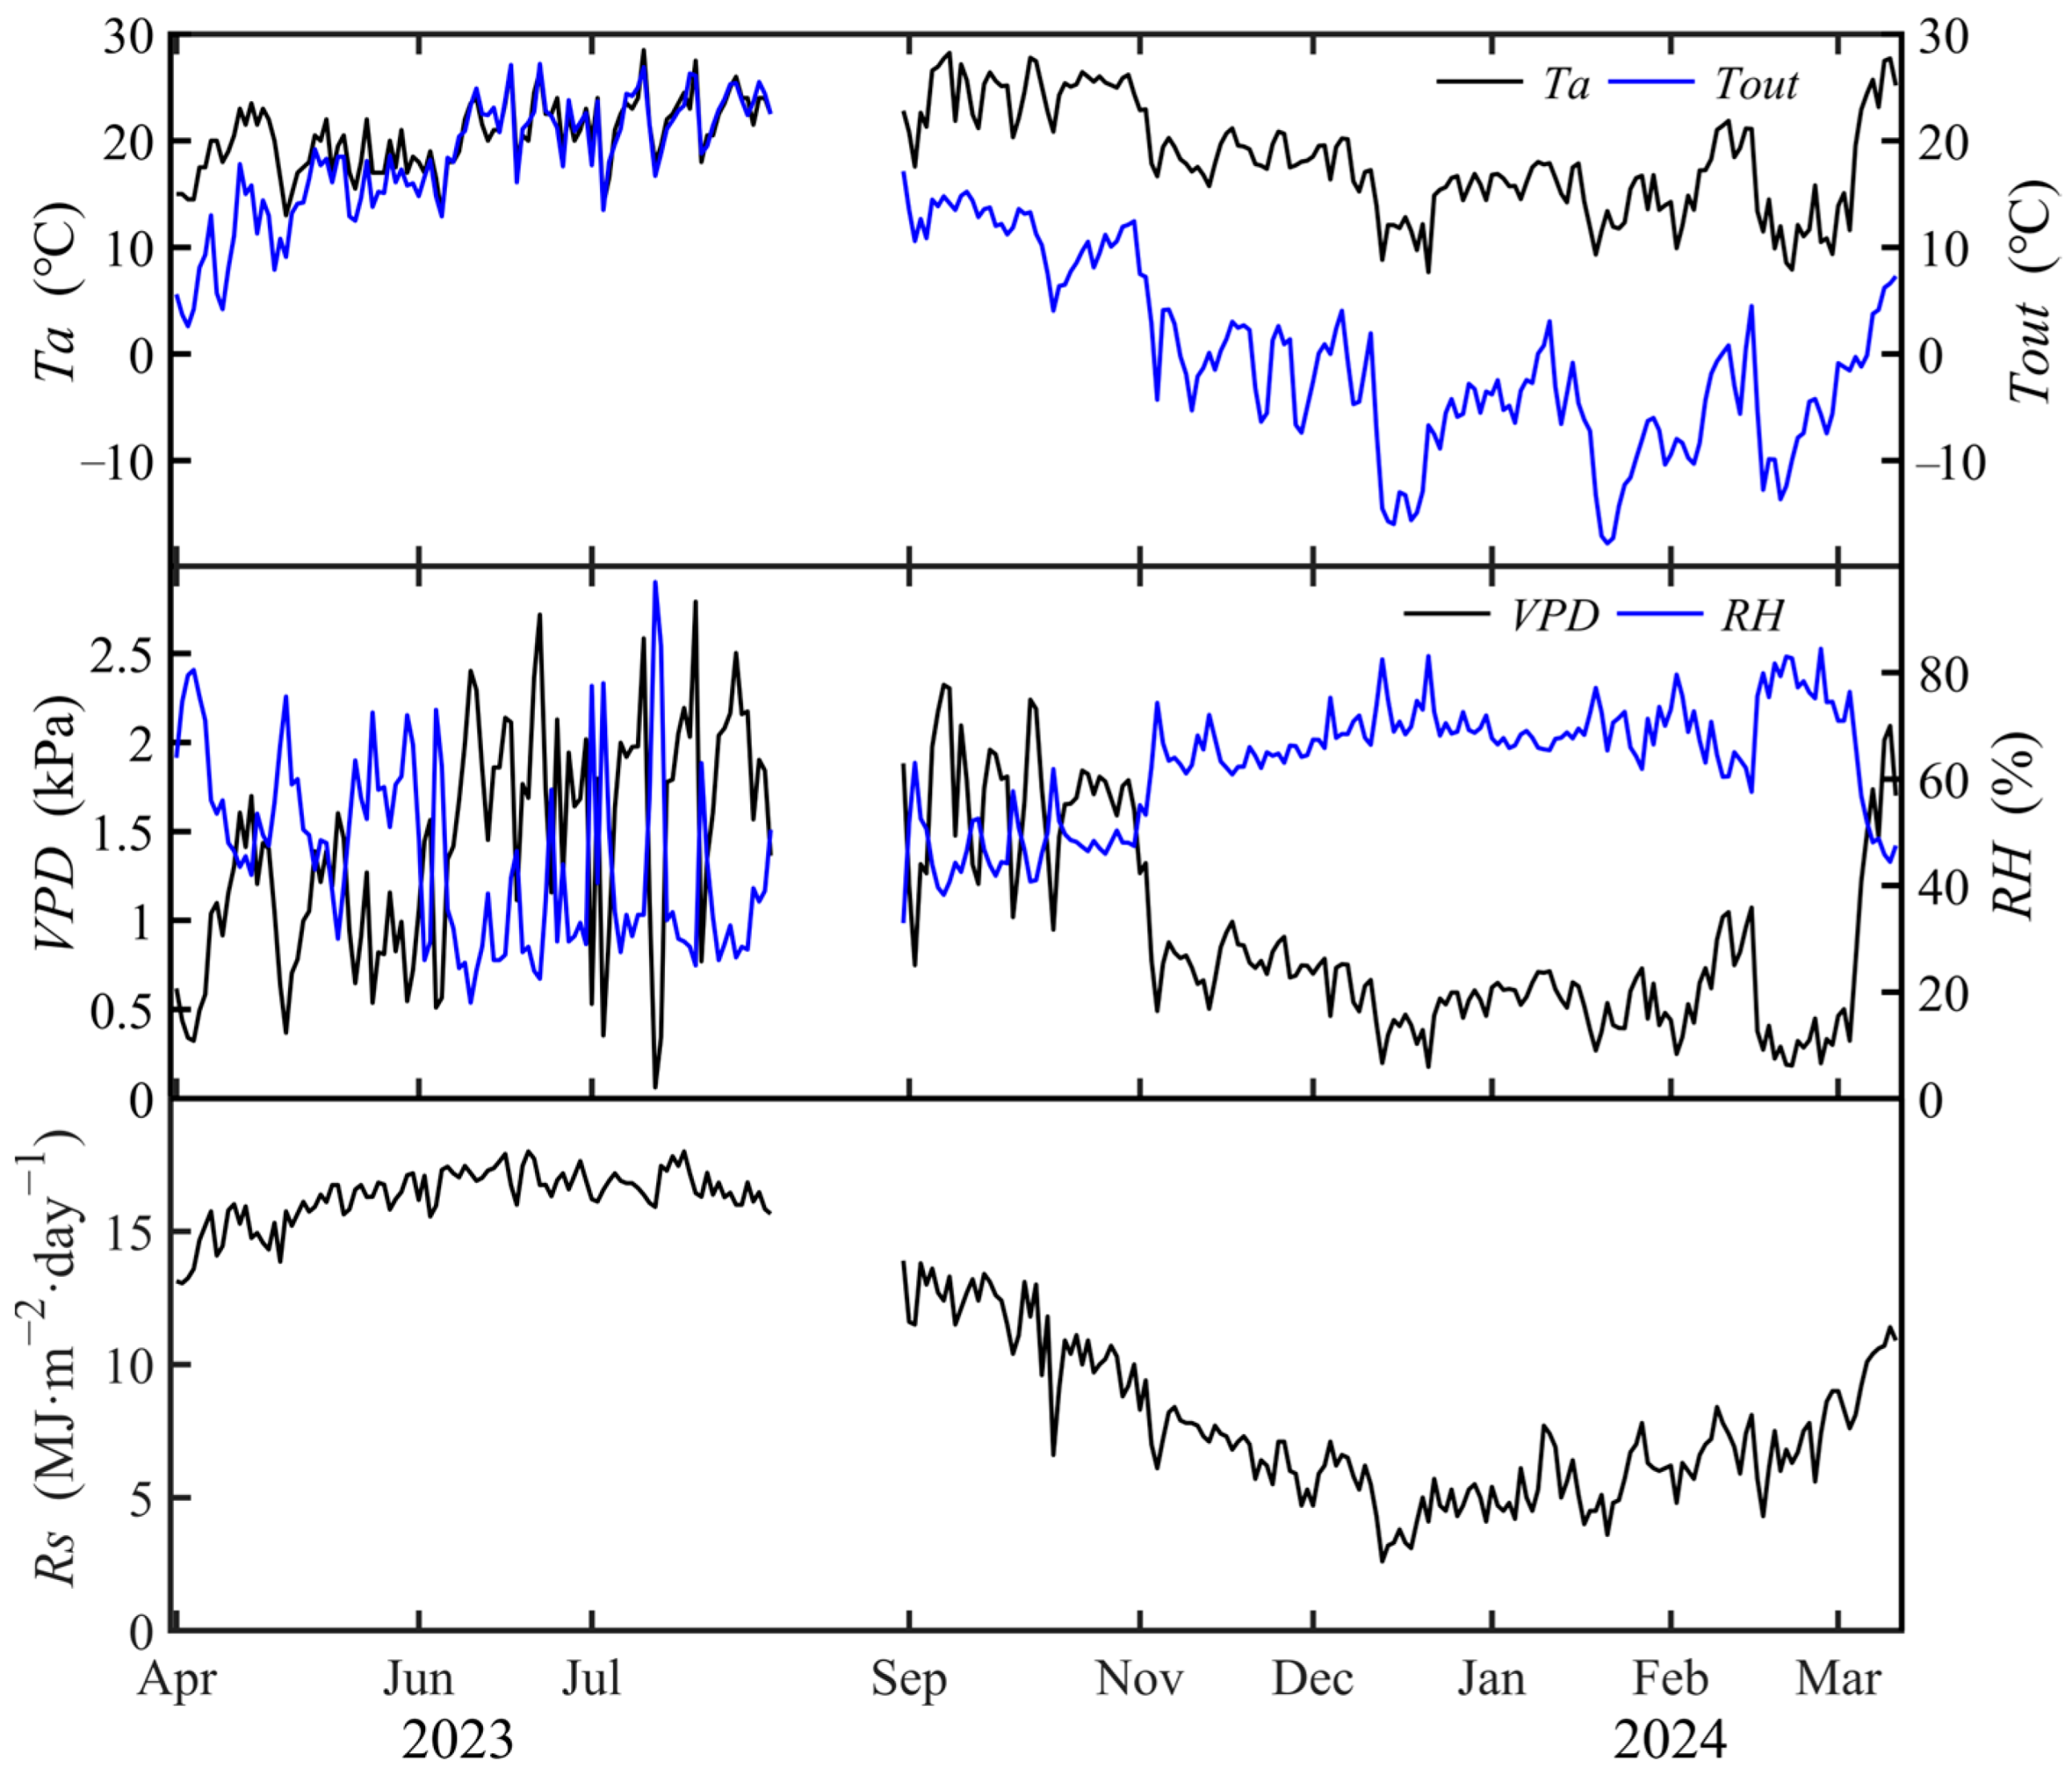
Figure 6 shows the dynamics of vapor pressure deficit (VPD), air temperature inside and outside the GSGs (Ta, Tout), and relative humidity (RH) for green peppers from planting to harvesting in 2023 and 2024. VPD, Ta, and Tout varied between growth seasons. During the 2023 growing season (April–August), the GSGs had an average daily VPD of 1.39 kPa, Ta of 20.43 °C, Tout of 17.84 °C, and solar radiation (Rs) of 16.22 MJ·m−2·day−1. During the 2023–2024 growing season (September–March), the GSGs had an average daily VPD of 1.01 kPa, Ta of 19.21 °C, Tout of 1.49 °C, and Rs of 8.3 MJ·m−2·day−1. The average Tout difference between the two growing seasons was 16.35 °C, whereas the Ta difference was only 1.22 °C. As shown in Figure 6, VPD, Ta, and Tout have similar trends with Rs. In summer, the VPD fluctuation range of GSG is larger.

3.2. Comparison of Estimation Accuracy of Different Rs Models

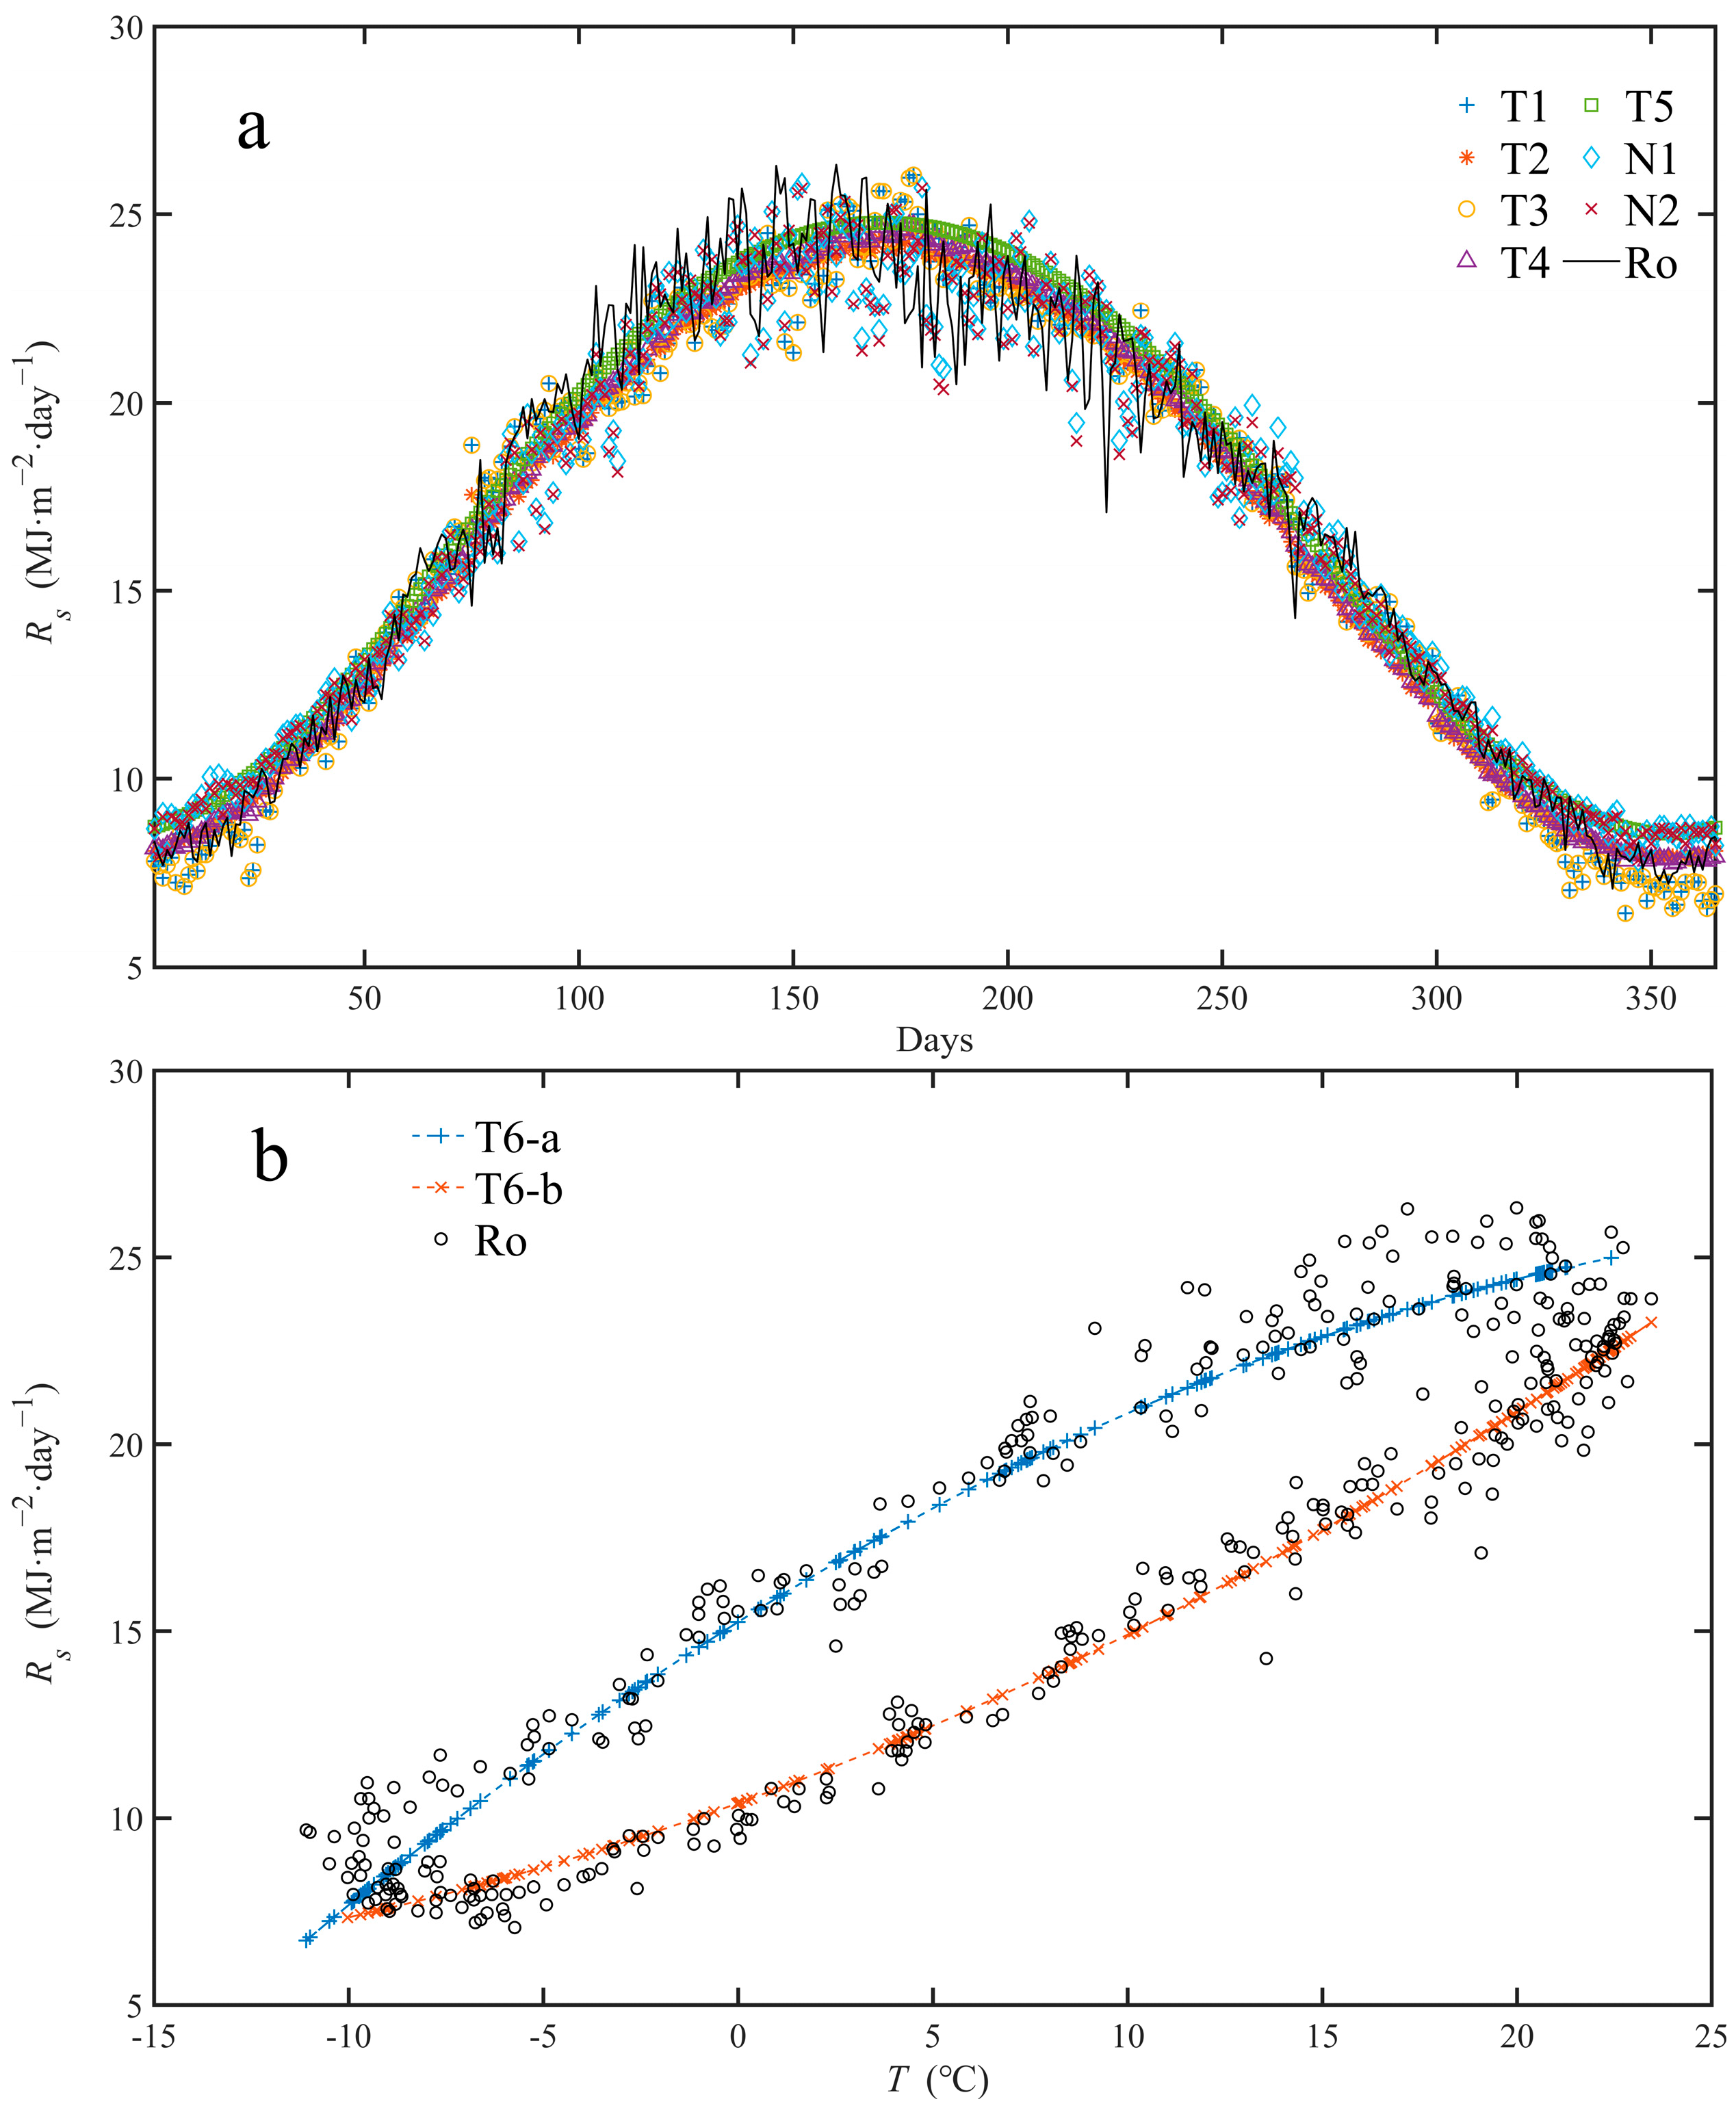
The solar radiation data from the Jiuquan station were separated into two sets. The first dataset was modeled using regression analysis of daily meteorological data for odd-numbered years from 1979 to 2018. The parameters of the eight empirical models were calibrated using the least squares approach to find the best values of the empirical coefficients, which are shown in Table 4. The second data set assesses and validates the models using daily meteorological data from even-numbered years. Figure 7 shows the comparison of predicted and actual solar radiation for various solar radiation estimation models. As can be seen, the solar radiation estimates from all the selected models follow the same trend as the observed values. Table 4 also summarizes the statistical errors (NRMSE, RMSE, MAE, MBE, and R2) and determines the optimal model by comparing the statistical errors associated with each model. The N2 model has the largest deviation between the predicted value and the actual value with lower prediction accuracy, and the T6 model has the best performance.
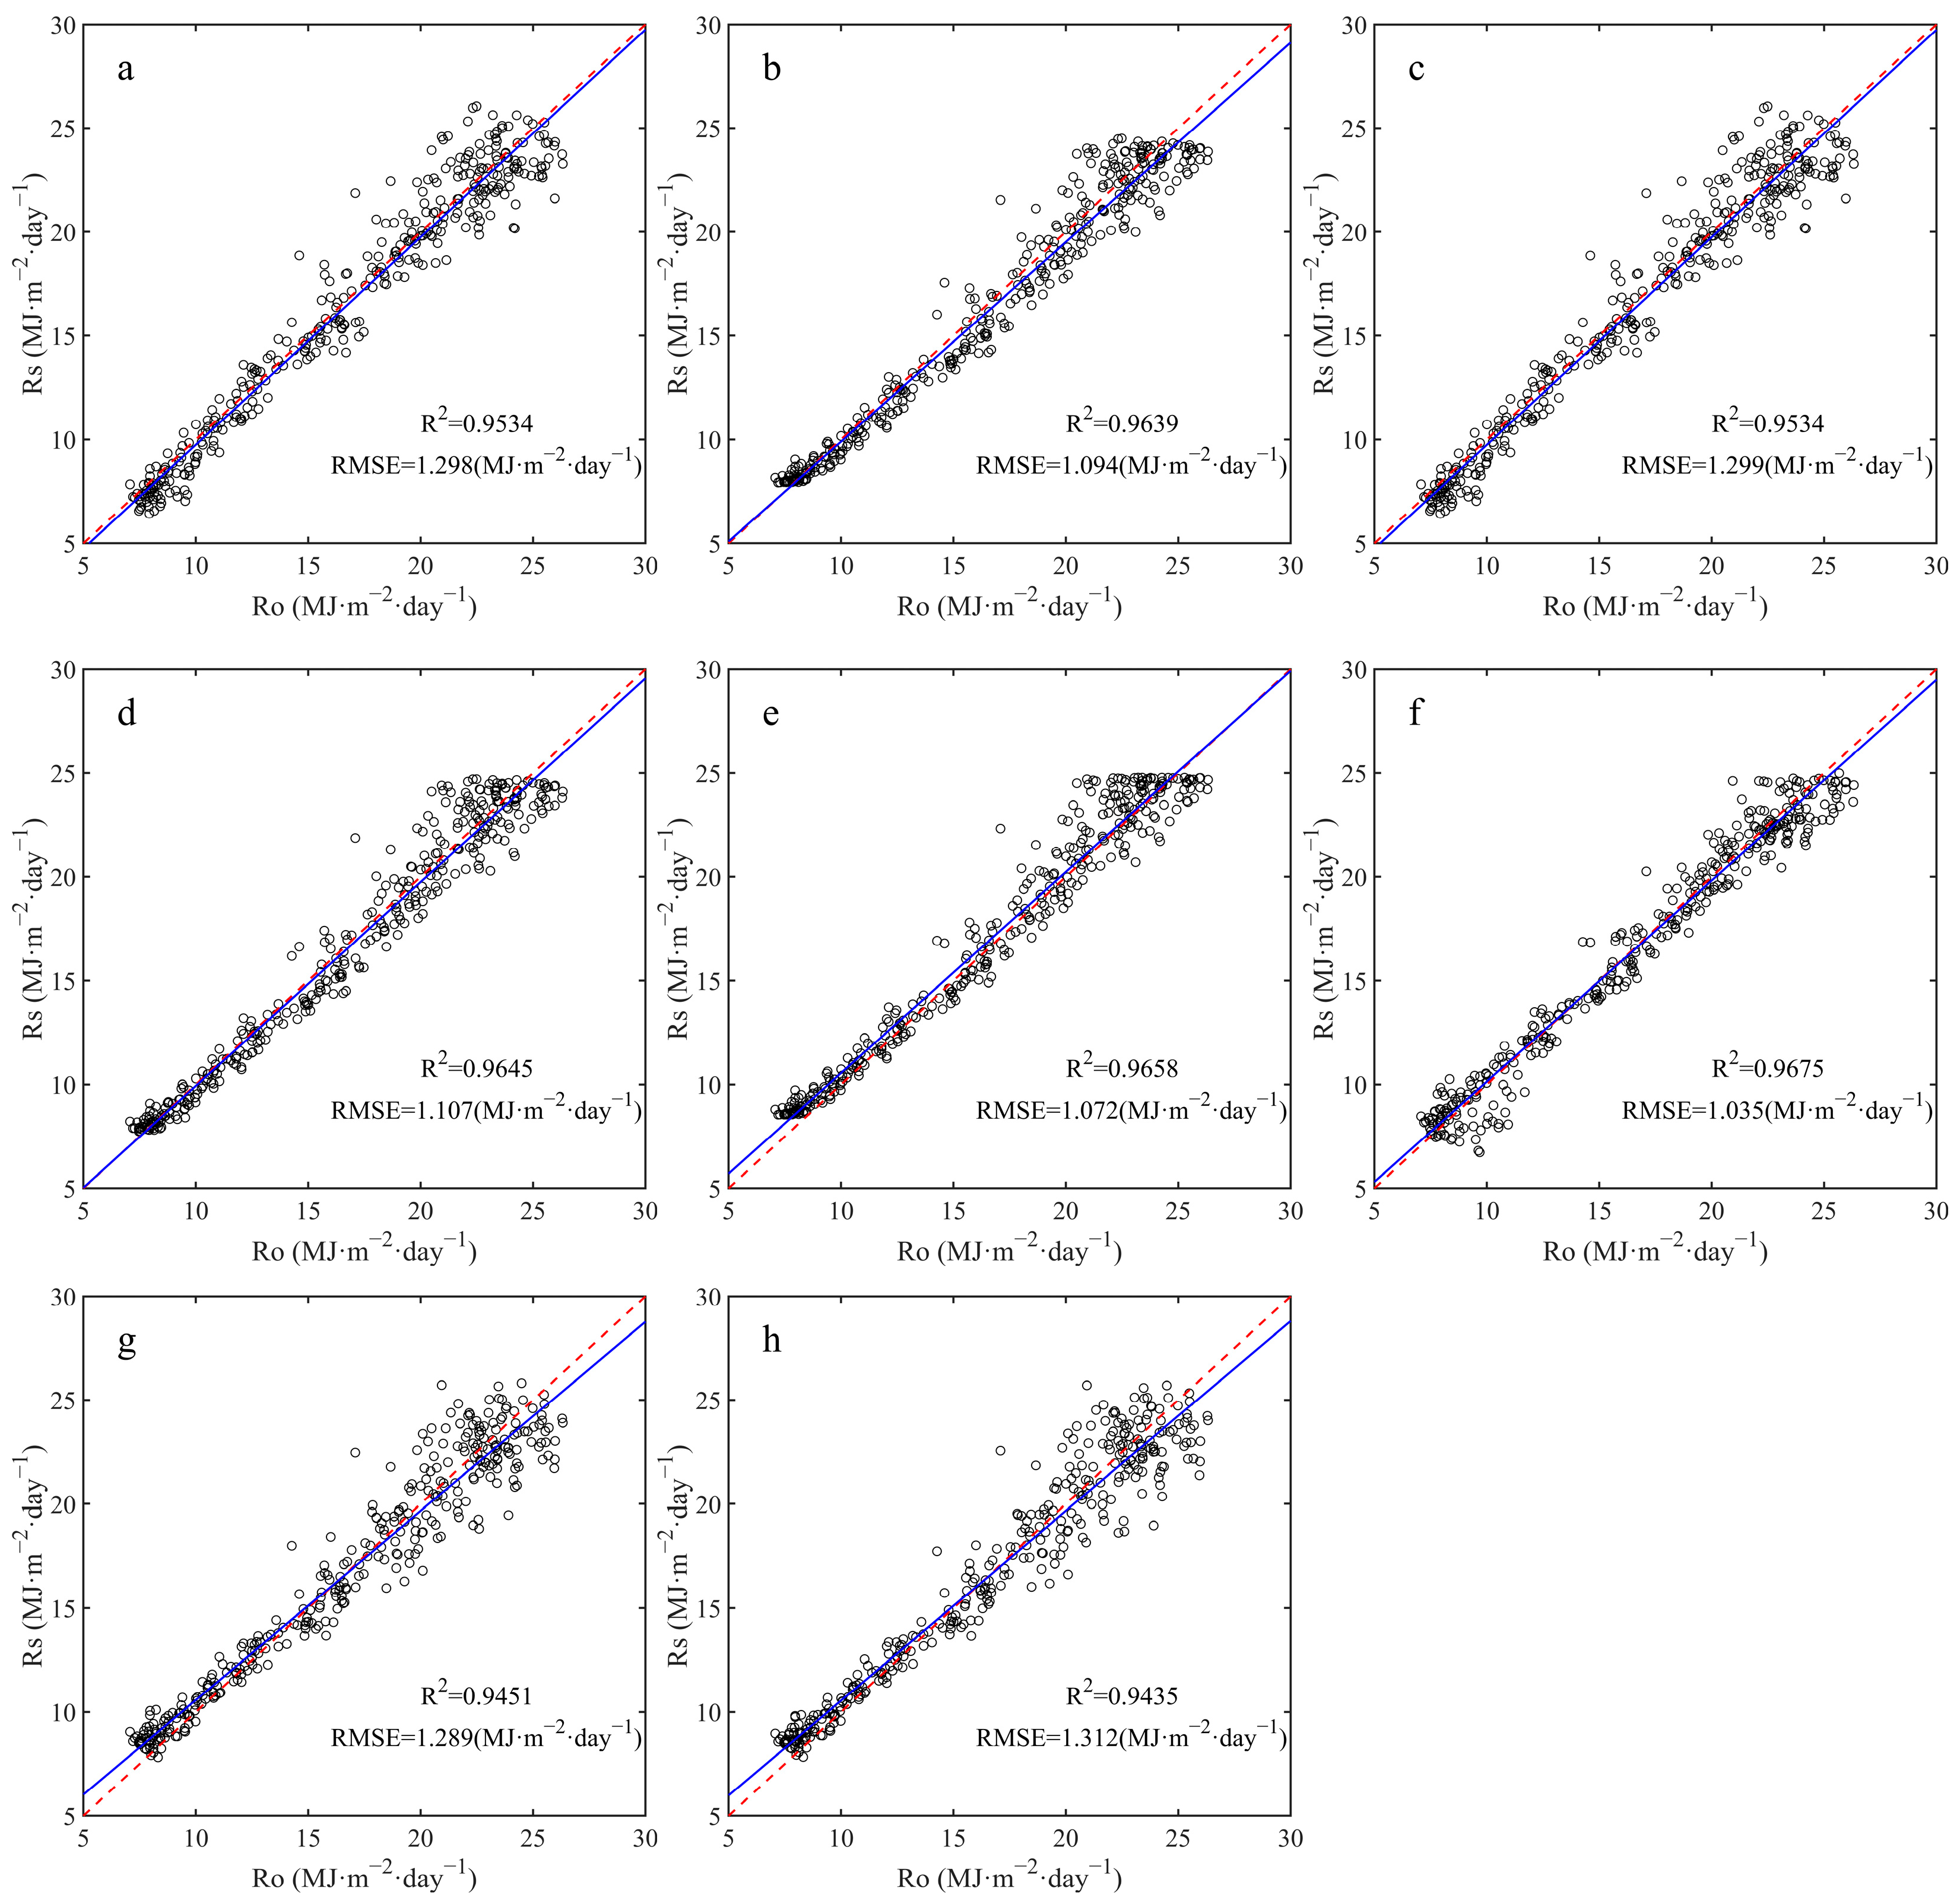
Figure 8 shows that the accuracy of the temperature-based Rs estimation model is better than the Rs estimation model based on sunshine hours in the Hexi Corridor. In terms of R2, the temperature-based models are all above 0.949, but the two sunshine-based models are 0.9437 and 0.9425, respectively. Comparison between the values of RMSE also showed that the RMSE of the temperature-based Rs estimation model ranged from 1.0532 MJ·m−2·day−1 (T6 model) to 1.3213 MJ·m−2·day−1 (T3 model). The temperature-based model had more accurate estimates than the sunshine-based model (RMSE range 1.3908~1.406 MJ·m−2·day−1). In the case of MBE, the T2 model has the lowest value of MBE (MBE = −0.3661 MJ·m−2·day−1), and the highest value of MBE belongs to the T5 model (MBE = 0.3371 MJ·m−2·day−1). The statistical MBE shows only that the T5 model is more than zero (MBE = 0.3371 MJ·m−2·day−1), indicating that other models appear to underestimate the daily value of Rs. In sunshine-based models, the underestimating of Rs is considerably more significant. The MAE ranged from 0.0506 MJ·m−2·day−1 in the T4 model to 0.0649 MJ·m−2·day−1 in the N1 model. The T6 model demonstrates superior accuracy among alternative solar radiation estimation models evaluated in our study for the Hexi Corridor region. In Figure 8, the models’ statistical performance is displayed. According to the findings, the T6 model is the best model for forecasting the daily solar radiation along the Hexi Corridor’s horizontal surface. The T4 model was ranked second (R2 = 0.9631, NRMSE = 5.85%) and the T5 model was ranked third (R2 = 0.9625, NRMSE = 5.9%).

3.3. Forecasting Incoming and GSGs Solar Radiation

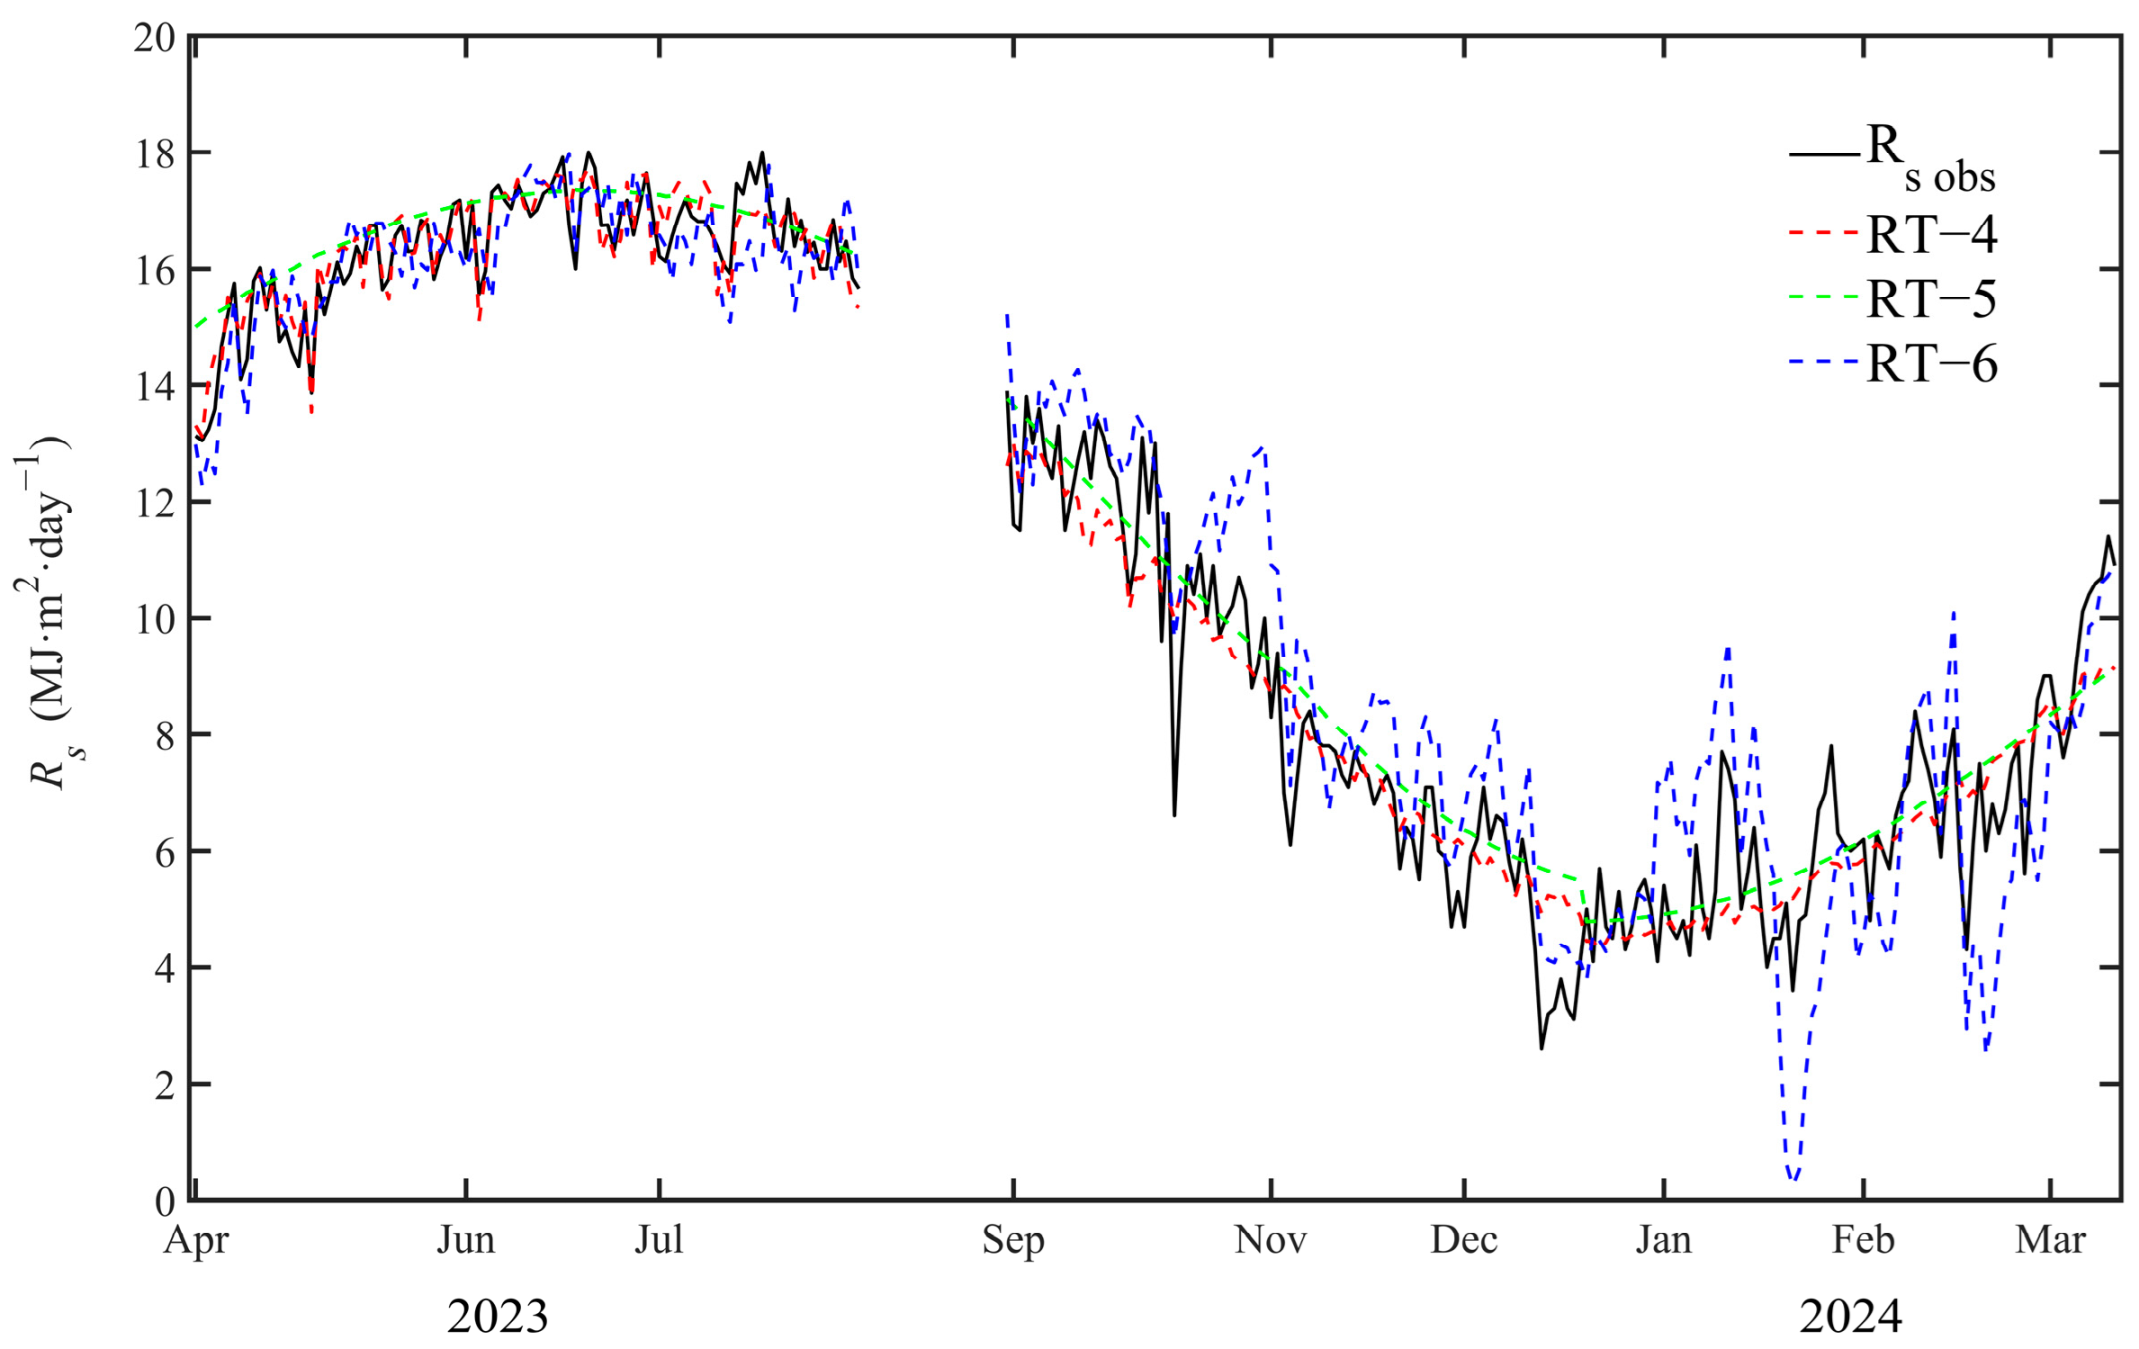
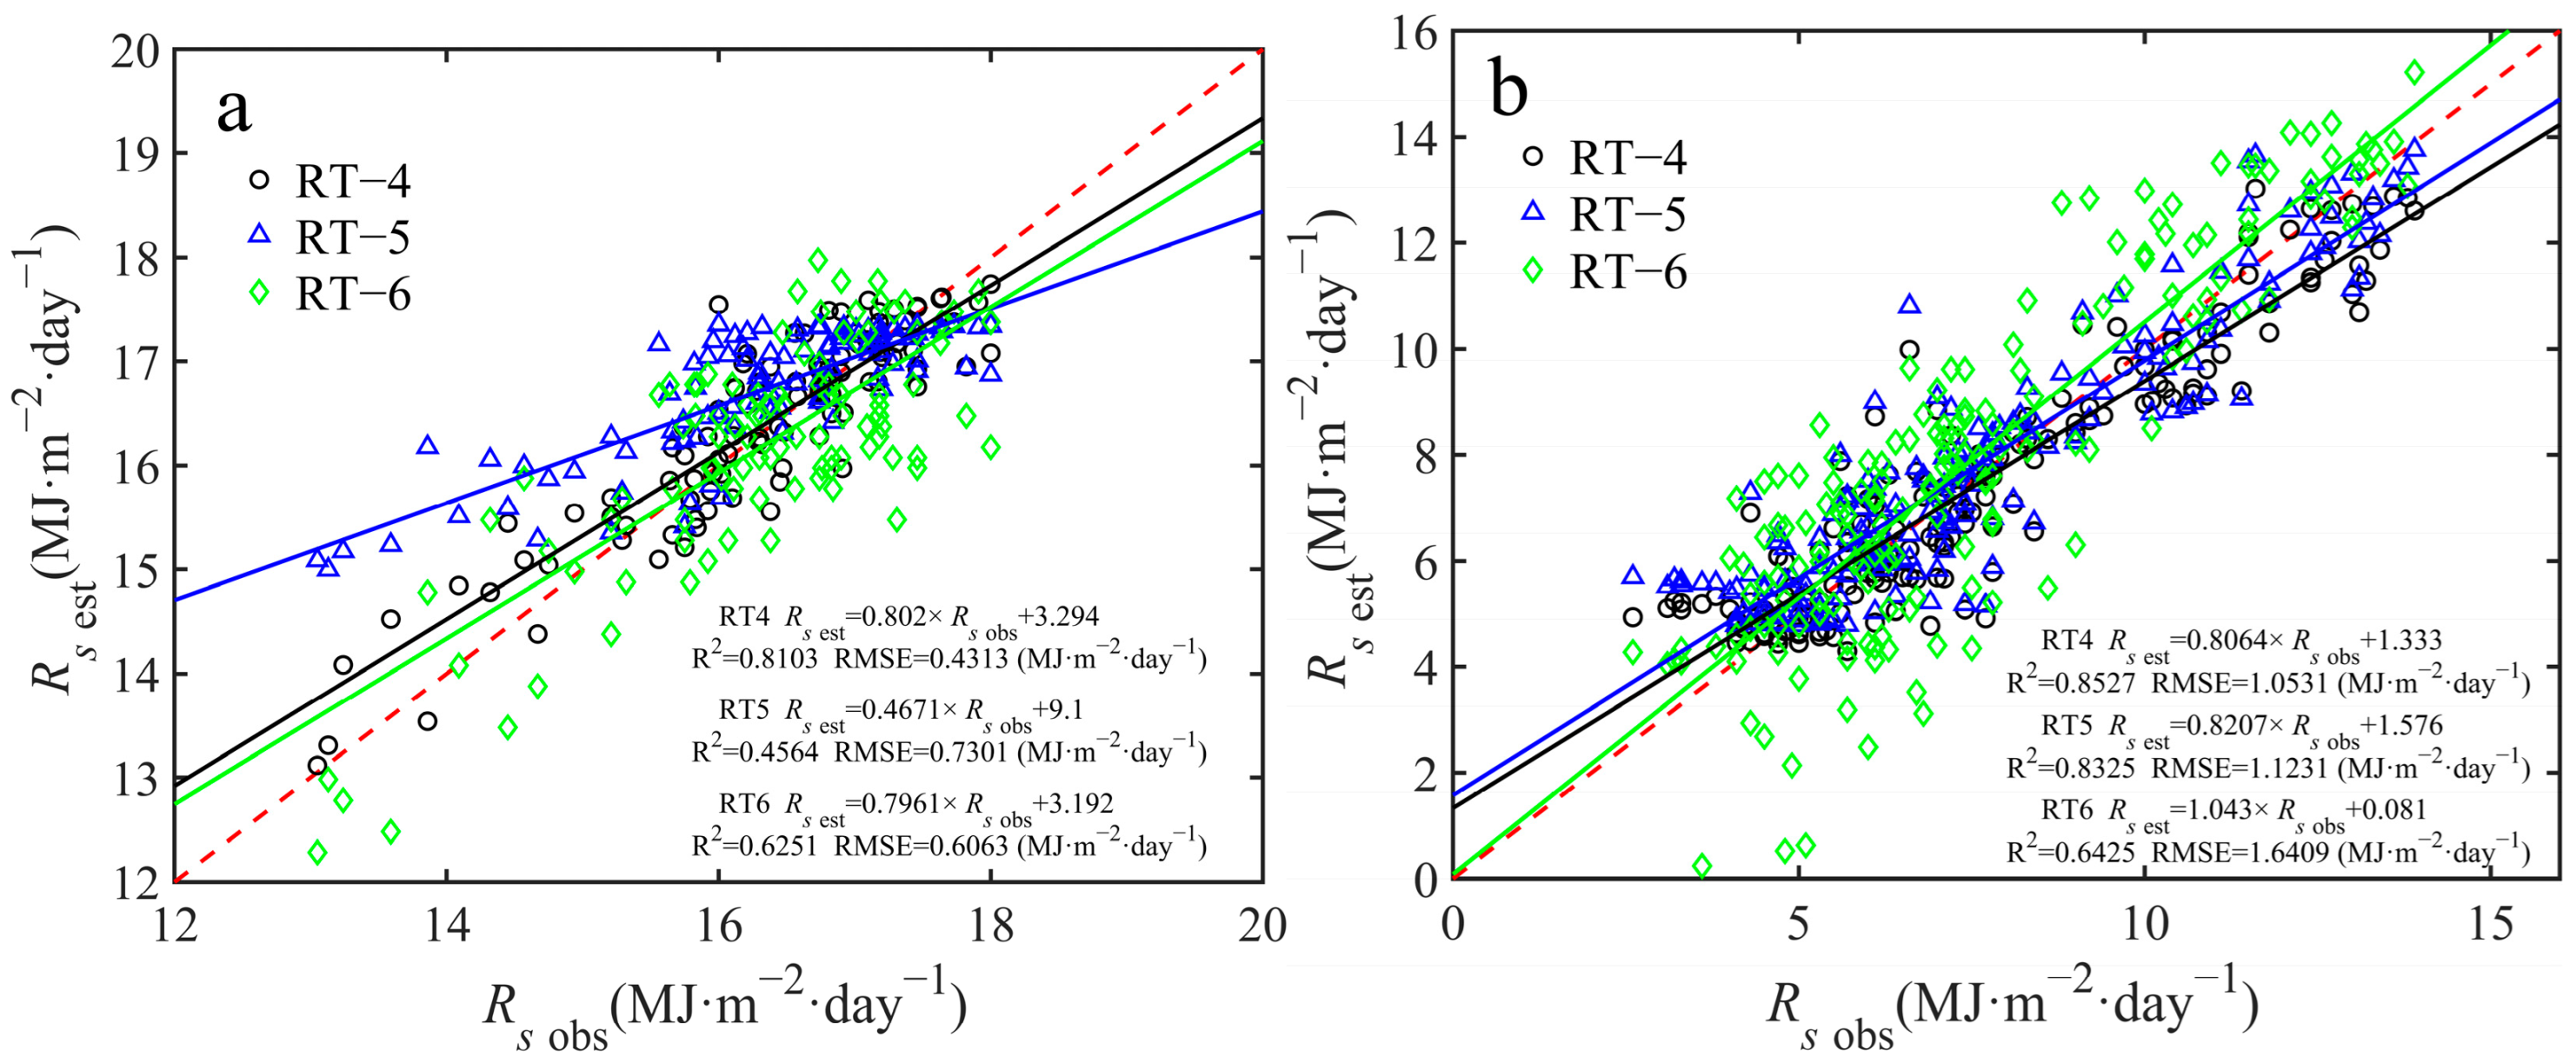
Three models with the highest estimation accuracy were screened from eight candidate solar radiation models as the outdoor radiation terms for the incident solar radiation estimation model in greenhouses (Table 5 and Figure 9). During the 2023 growing season, higher outdoor solar radiation levels and greenhouse incident solar radiation being solely influenced by cladding film transmittance and enclosure structure resulted in an observed average incident solar radiation within the greenhouse of 16.19 MJ·m−2·day−1. In contrast, during the 2023–2024 growing season, due to low local outdoor solar radiation levels combined with reduced daylight hours in the greenhouse caused by thermal blanket deployment, the observed average incident solar radiation was only 7.55 MJ·m−2·day−1. Table 5 shows the values of the statistical parameters used to assess the performance of the GSGs in terms of daily incident solar radiation. They are obtained by comparing estimates using predicted and observed data. As can be seen from Figure 9 and Table 5, the RT-4 model achieved high accuracy in predicting incident solar radiation within the greenhouse during the 2023 growing season (R2 = 0.8103, RMSE = 0.4313 MJ·m−2·day−1). Both RT-4 and RT-5 models showed good predictions during the 2023–2024 growing season. When using the RT-4 model, most of the predicted data were closely distributed around the 1:1 line (Figure 10a,b). The RMSE and NRMSE values for the 2023–2024 growing season were equal to 1.0531 MJ·m−2·day−1 and 9.32%. The RT-6 model performed poorly with NRMSE values of 3.4% and 14.5% for the 2023 and 2023–2024 growing seasons. MBE showed that the RT-6 model underestimated incident solar radiation in the greenhouse during the 2023 growing season and overestimated incident solar radiation during the 2023–2024 growing season. Among the three models, the RT-4 model demonstrated the optimal performance, exhibiting an MBE value closest to 0 and the highest R2 value.

3.4. Crop Coefficient and Transpiration

According to the segmentation approach outlined in FAO-56, the growth stages of green pepper can be classified as follows: the initial and intermediate stages are distinguished by horizontal line segments, while the developmental and late stages are distinguished by ascending and descending line segments. In practical production, Huamei 105 is harvested as fresh green peppers, and harvesting is completed in the middle of the growth period, so only the initial and mid-stage Kcb were considered. As shown in Table 6, the updated FAO-56 assigns Kcb values of 0.15 and 1.10 to pepper crops at the initial and mid-stages, respectively. In the current study, the Kcb values for greenhouse-grown green pepper were 0.15 and 1.01 at the initial and mid-stages, respectively, during the 2023 growing season, and 0.17 and 0.82 during the 2023–2024 growing season. The mid-stage Kcb values for both growing seasons were below the updated FAO-56 standard values. Figure 11 depicts the seasonal changes in Kcb and ETc obs for greenhouse-grown peppers.

3.5. Comparison of the Accuracy of Estimating ETc act Based on Different Rs Models

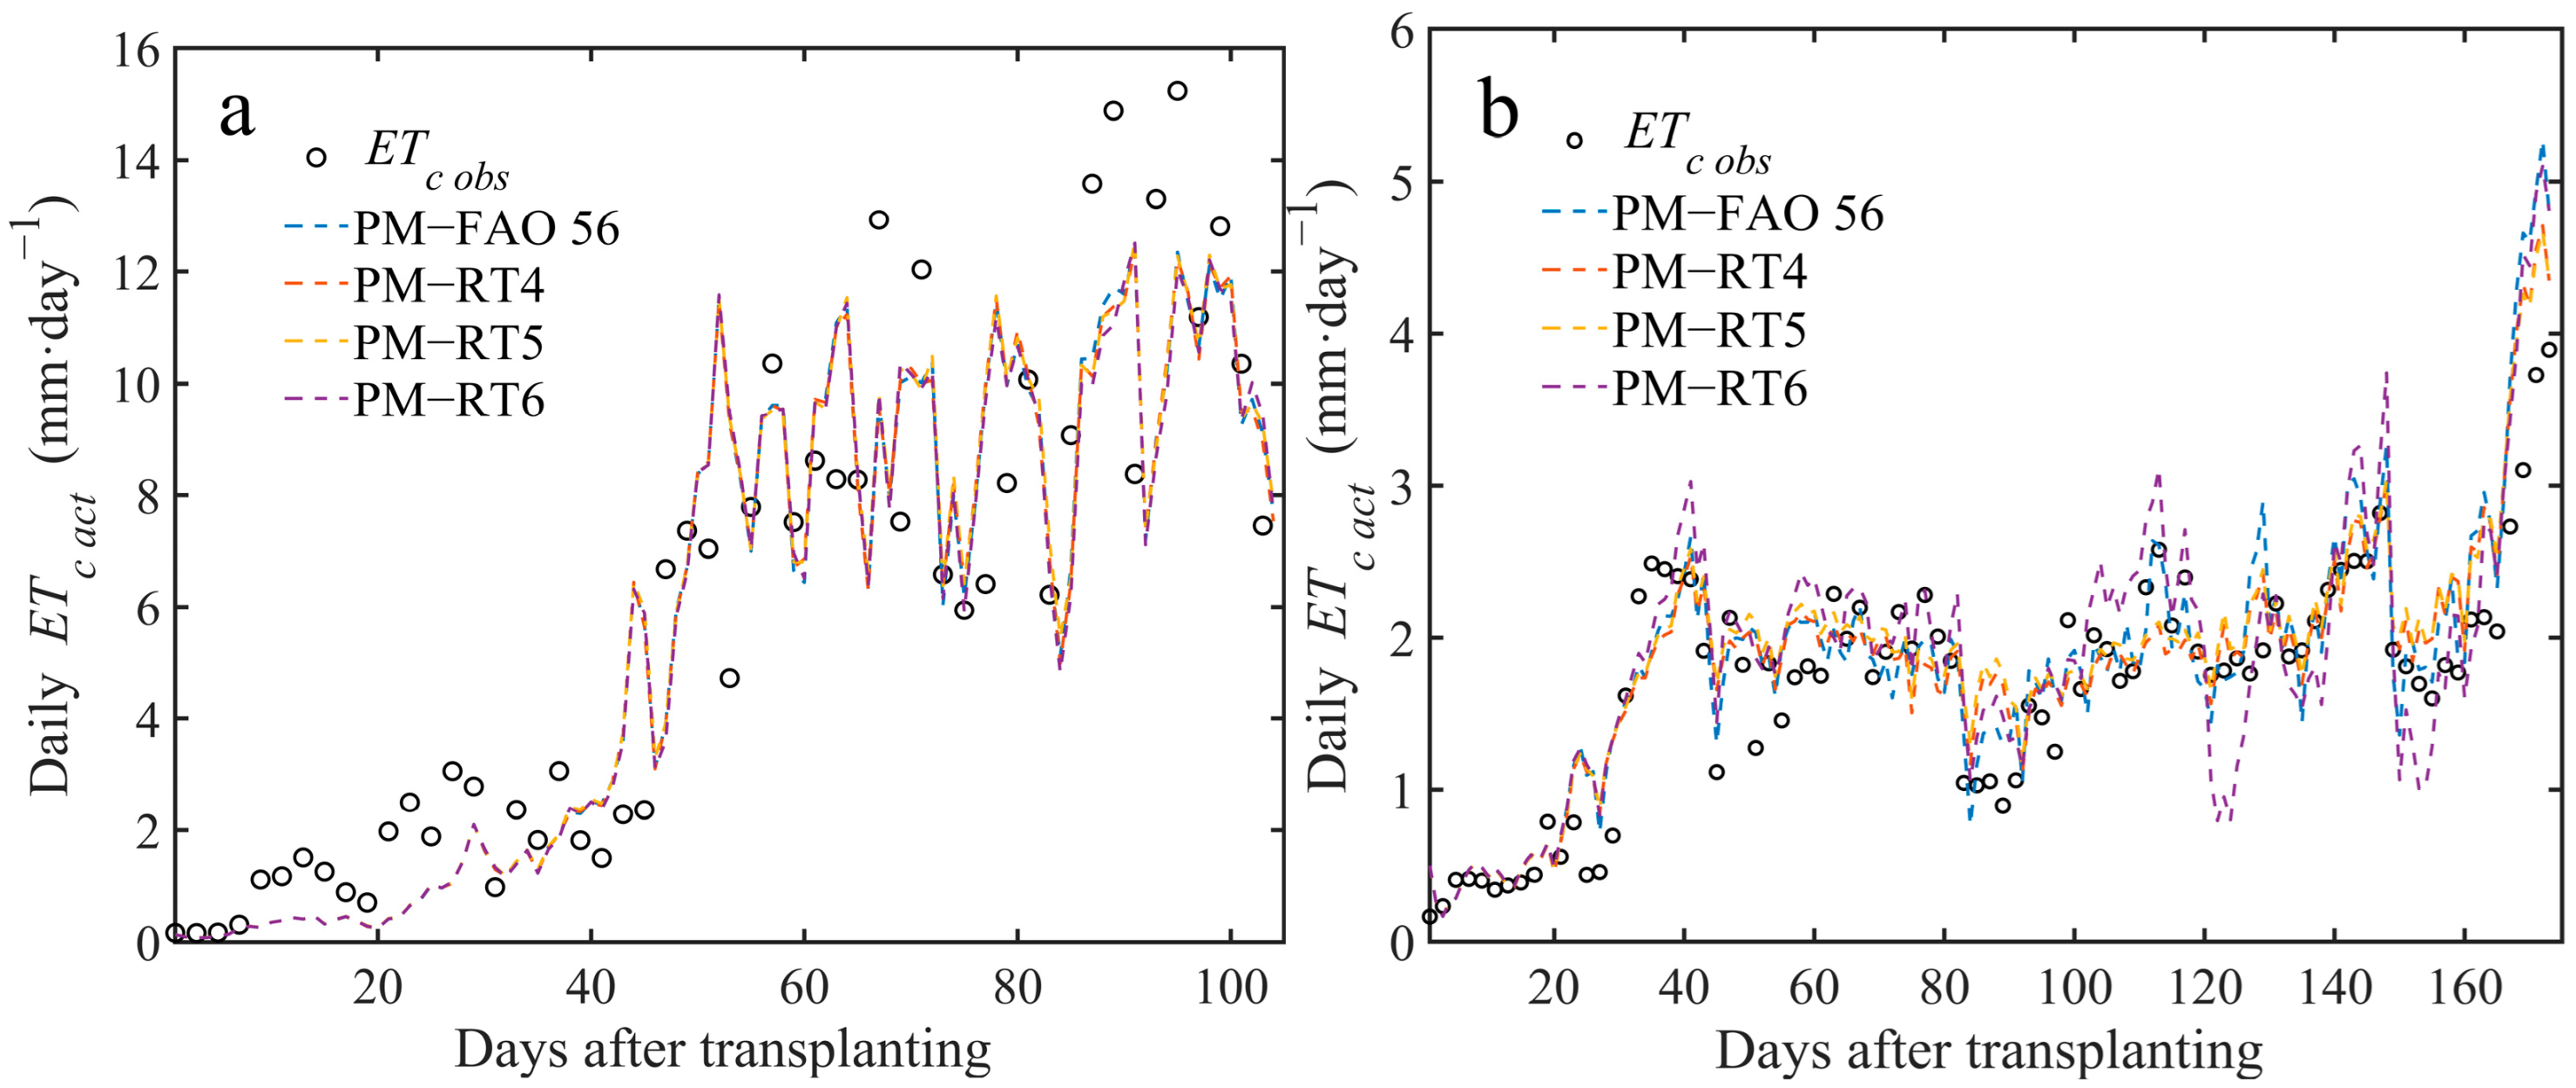
Solar radiation is an important factor in estimating actual crop evapotranspiration. This study modeled actual green pepper evapotranspiration using estimated incident solar radiation from models. Differences between observed and estimated actual evapotranspiration data were utilized to evaluate the actual green pepper evapotranspiration models during two growing seasons in 2023–2024. Figure 12a depicts daily ETc obs data from the first growing season, with values ranging from slightly less than 0.16 mm·day−1 at seedling to slightly more than 15.23 mm·day−1 at harvest, and the average value was 5.89 mm·day−1. During the second season (Figure 12b), the daily ETc obs varied from 0.16 to 3.89 mm·day−1, with an average of 1.72 mm·day−1. The higher values obtained during the first growing season were attributable to the favorable environment for green pepper growth at that time. The projection of actual green pepper evapotranspiration by three incident solar radiation models was underestimated at the start of the growth period in 2023. Overall, there was good agreement between the ETc act dynamics simulated by the PM–RT4 method and the observed data dynamics during the two experimental growing seasons, indicating that the model could predict the actual evapotranspiration of green peppers grown on greenhouse substrates throughout the growing season.
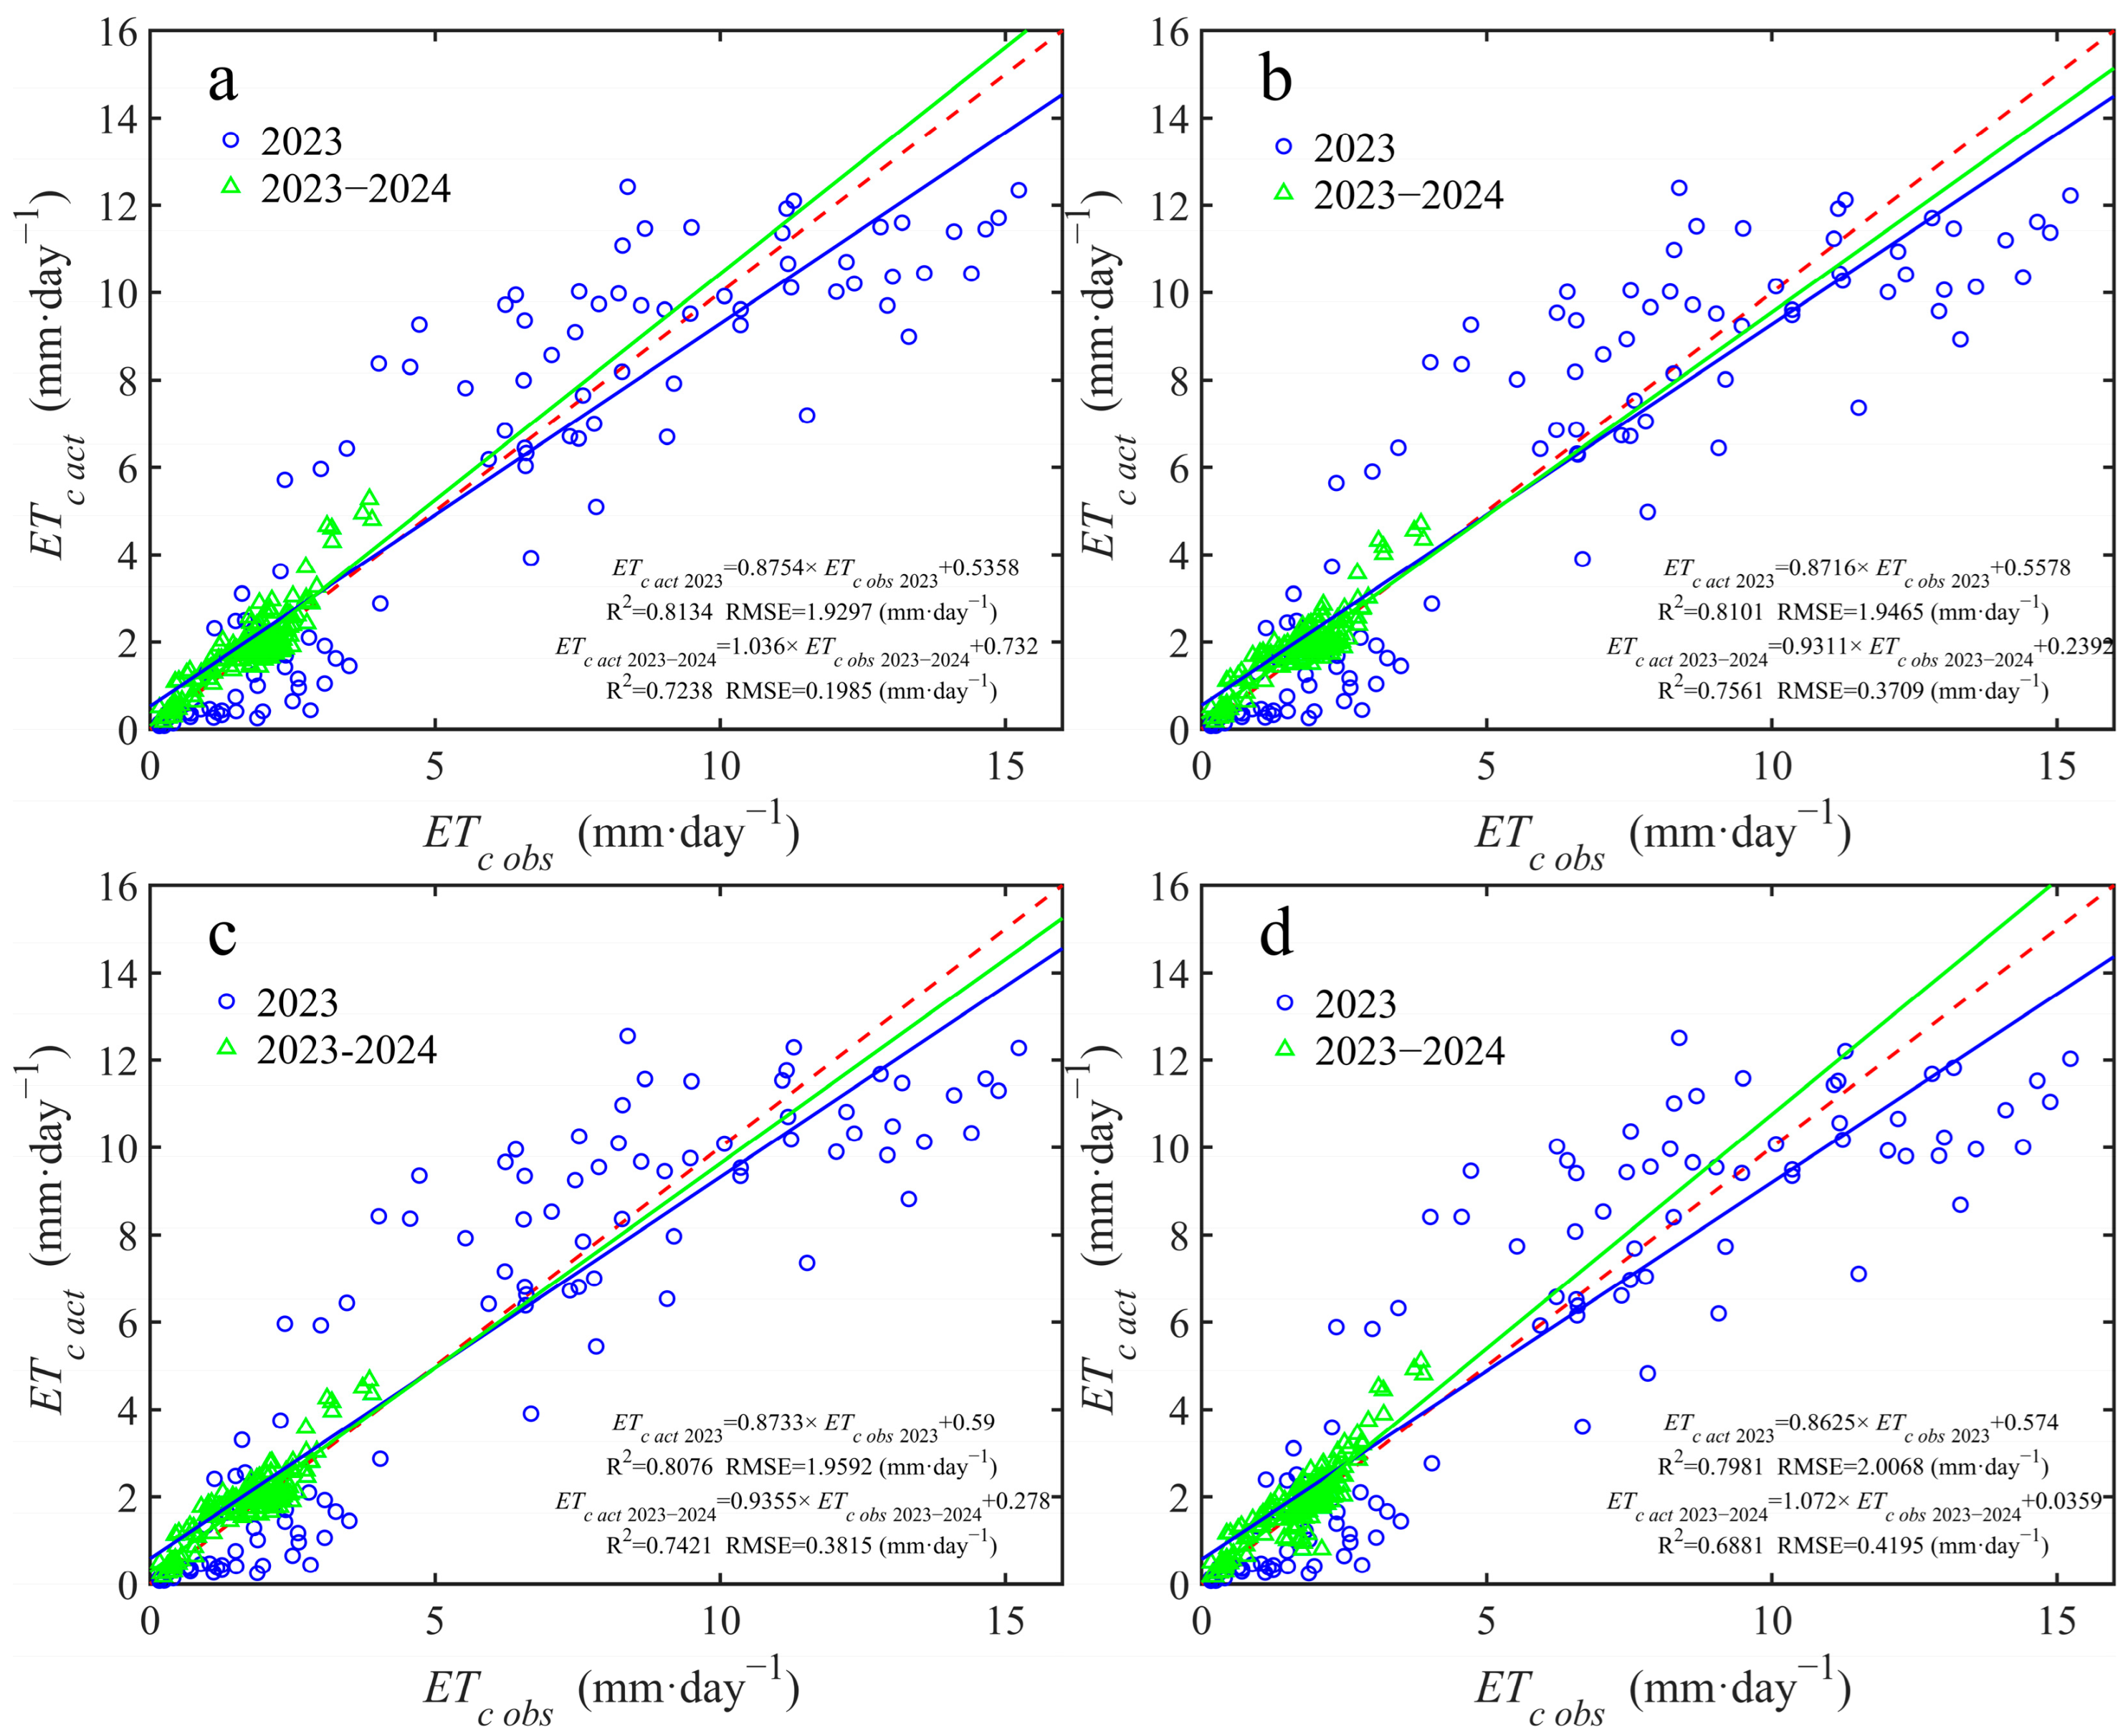
Table 7 and Figure 13 exhibit the different predicted models’ accuracy for actual green pepper evapotranspiration throughout different growth seasons. During the 2023 growing season (April–August), the observed evapotranspiration was highly correlated with the different model predictions, with all R2 values above 0.79. Throughout the growing season, we observed about 612.57 mm of green pepper evapotranspiration, with predictions from different models ranging from 588.1 to 596.3 mm. Since all these models underestimated actual green pepper evapotranspiration, the same result was reflected in MBE (0.15 to 0.24 mm·day−1), with the resulting difference being only about 3–4%. The predicted value of actual green pepper evapotranspiration using the PM–RT5 method was closest to the observations, but it had the highest MAE (0.3859 mm·day−1) with the second-highest RMSE (1.9592 m·day−1). The PM–RT6 model possessed the highest MBE (0.2354 mm·day−1), NRMSE (13.31%), and RMSE (2.0068 mm·day−1), as well as the lowest R2 (0.7981), which resulted in a poor prediction accuracy compared to other methods. The PM–RT4 model exhibited similar prediction accuracy to PM–FAO-56.
During the 2023–2024 growing season (September to March), the evapotranspiration of green pepper was 298.30 mm, which was only 48.7% of the 2023 growing season. Different models overestimated actual green pepper evapotranspiration, and the same result was reflected in MBE (−0.1671 to −0.1204 mm·day−1). The observed evapotranspiration was less correlated with the different model projections than the 2023 growing season predicted actual evapotranspiration, with R2 ranging from 0.68 to 0.75. Among these methods, the PM–RT4 model still showed better simulation results, with MBE (−0.1204 mm·day−1) closest to 0, while possessing the smallest RMSE (0.3709 mm·day−1). The RM-RT6 model had the lowest R2 of 0.6881 and the highest RMSE of 0.4195 mm·day−1 among the three models. Overall, the PM–T4 model performed better in predicting actual evapotranspiration of green peppers during different growing seasons in the absence of solar radiation data.

4. Discussion

4.1. The Solar Radiation Estimation Models

Solar radiation data serves as a fundamental parameter for estimating ETc act. In regions where direct solar radiation measurements are unavailable, researchers have developed various computational approaches encompassing theoretical solar radiation models and empirical models derived from other meteorological parameters (e.g., temperature-based or sunshine-based methodologies). Classical theoretical models of solar radiation can describe light environment changes in GSGs in detail [42]. However, their complexity and user expertise requirements greatly limit widespread application. Temperature-based models offer two advantages over other types: (i) the input data (temperature) for these models is simple to get and record, and (ii) simpler data acquisition [37]. The superiority of empirical temperature-driven models has been validated across diverse regions. For instance, Hassan et al. demonstrated that temperature-based models outperformed sunshine-based approaches in predicting solar radiation across Egypt’s Nile Delta region [30]. This aligns with our comparative analysis, confirming the superior accuracy of temperature-based solar radiation prediction models. Solar radiation has been identified as the primary factor influencing temperature changes [37], particularly within the Gobi region, where temperatures exhibit heightened sensitivity to variations in solar radiation. Changes in cloud thickness, the location of the sun’s blockage, and the duration of the blockage all lead to changes in the solar radiation received by the ground. However, these variables cannot be accurately quantified and are employed as empirical parameters in solar radiation models based on sunshine. This explains the contribution to the superior performance of temperature-based solar radiation models in the Hexi Corridor region.
The assessment of model performance requires adjusting coefficients to align with geographic and climatic conditions. Allen et al. [9] demonstrated significant variations in empirical model parameters across varying altitudes and climatic zones, necessitating localized calibration. In this study, the model coefficients were recalibrated using the least squares method to find the ideal empirical coefficient values applied to the Hexi Corridor area. Chen et al. [29] recommended empirical coefficients 0.2415 and 0.0651 for the T4 model at inland stations. Our results demonstrate that recalibrated values 0.441 and 0.0577 provide superior data fit at the study site. For the T1 model, the mean coefficient 0.1856 exceeds Hargreaves and Samani’s recommended value [16]. Similarly, empirical coefficients for models T2, T3, and T5 deviate from values proposed by Allen et al. [9] and Annandale et al. [27]. The T6 model outperformed the other temperature-based models at the station under investigation among the models assessed in this study because it divides the year into two time periods (January–June and July–December) for estimation, thereby increasing the model’s computational accuracy (Table 4).

4.2. Estimation of Incident Solar Radiation in GSGs

However, our evaluation of model prediction for incident solar radiation in GSGs revealed that the RT-6 model exhibited lower accuracy than the RT-4 model (Table 4). This occurred because the RT-6 model lacks clearly defined constraint boundaries in its solar radiation estimation algorithm. Additionally, the RT-6 model is a segmented function, and the plant growth cycle in this experiment includes several seasons, so the estimation of incident solar radiation in the greenhouse during the transition period is subject to large error. The GSGs are a distinct, specialized structure. During the winter season, the incident solar radiation within the greenhouse is influenced by various factors, including the opening and closing times of the thermal blanket, snowfall accumulation, and roof surface condensation.
In order to accurately predict incident solar radiation in the greenhouse during this time period, it is necessary to take into account the effects of several factors. The duration of coverage of the thermal blanket has been identified as the most significant influence [50]. Consequently, a ramp function was introduced to estimate the incident solar radiation in the GSGs during the winter and spring months. The ramp function was obtained by observing the opening and closing times of the thermal blanket cover in the GSGs. (Table 3 and Figure 5). The estimation results show that with the inclusion of the ramp function, the ratio of estimated to observed values is close to a straight line of 1:1. The RT-4 model demonstrated a high degree of efficacy in estimating solar radiation levels both intra- and extra-greenhouse during across growing seasons.

4.3. Estimation of Kcb

The crop coefficient approach for estimating crop evapotranspiration is well-established in solar greenhouse transpiration research. Qiu et al. [51] and Gong et al. [8] demonstrated its applicability for irrigation scheduling in greenhouse crops by successfully simulating evapotranspiration for peppers and tomatoes, respectively. The basal crop coefficient (Kcb) is affected by multiple factors, including climate conditions, crop species, soil surface cover, and water stress [9,52]. Our analysis shows that the Kcb ini value for green pepper in the 2023 growing season was found to be consistent with the updated FAO-56 standard values (Table 6). The Kcb ini was higher than the Kcb ini standard values in the 2023–2024 growing season, which can be attributed to the favorable greenhouse conditions for plant growth during this period, resulting in higher transpiration rates, which in turn led to higher Kcb than in the open field.
However, the Kcb mid values were lower than both the updated FAO-56 standard [49] and other literature-reported values [8,53,54], with this deviation being particularly pronounced during the 2023-2024 growing season. The underlying factors contributing to this discrepancy are likely attributable to the low temperatures and limited light availability within the greenhouse during January and February, which hindered the optimal growth of green pepper. Additionally, higher humidity levels and reduced wind speeds within the greenhouse were observed, and these environmental factors are also one of the reasons for the lower Kcb mid values [8], and due to the weaker green pepper during the winter and spring seasons, the crop did not completely cover the ground surface, which could also have lowered the Kcb mid [55].
In the Hexi Corridor region, a two-crop-a-year cultivation system is used to grow green peppers. The green peppers are harvested before they start to ripen [56]. In this study, harvesting was completed when the number of fruits on the pepper plants began to decrease significantly, which also marked the end of the entire growing season. Figure 11 also shows that there is no significant trend of decreasing Kcb values at the end of the entire growing season. This indicates that at the end of harvest, the peppers had not yet entered the late growth stage; therefore, the Kcb end value was not considered in this study.

4.4. The Performance of the PM–RT Model

During the 2023 growing season, ETc act values estimated using solar radiation data estimated from PM–RT4, PM–RT5, and PM–RT6 models were 591.97 mm, 596.29 mm, and 588.09 mm, respectively. The ETc act value based on measured solar radiation data was 591.98 mm. Comparative analysis revealed superior accuracy of the PM–RT4 model (R2 = 0.8101, RMSE = 1.9465 mm·day−1), demonstrating deviations < 5% from observed value (Table 7). This performance consistency was maintained during the 2023–2024 growing season, with PM–RT4 achieving optimal metrics (R2 = 0.7561, RMSE = 0.3709 mm·day−1). All models underestimated ETc act during the initial growth stage. Despite plastic mulch covering substrate pots, a certain amount of evaporation persisted due to limited canopy radiation interception by young pepper plants coupled with intense local solar irradiance. Conversely, models overestimated ETc act at mid-growth stages because aerodynamic resistance in the Penman–Monteith (PM) equation approaches infinity under near-zero air velocity [8]. Given low wind speeds in greenhouses, Fernández et al. [14] demonstrated that aerodynamic resistance at 295 s·m−1 enables accurate daily ETc estimation in Mediterranean plastic greenhouses. This approach has been adopted by [34]. However, studies indicate higher aerodynamic resistance values in Northwest China’s greenhouses likely contribute to ETc overestimation [8].
The three PM–RT models’ suboptimal performance in predicting actual evapotranspiration in the green pepper crop during the 2023–2024 growing season may be attributable to the low temperature and low light environment in the greenhouse during the winter and spring seasons, which suppressed the metabolic activities of the green peppers [57], reducing ETc act accuracy. The elevated green pepper evapotranspiration ranges recorded in 2023 exceeded those reported by [52,58] for greenhouse-grown peppers in Northwest China. This discrepancy can be attributed to the following factors: First, the difference between traditional soil cultivation and substrate cultivation systems affected crop evapotranspiration. Second, higher temperatures (average Ta is 20.7 °C) and solar radiation (average Rs is 16.19 MJ·m−2·day−1), combined with decreased relative humidity (average RH is 43.4%) in summer greenhouse conditions, synergistically enhanced pepper transpiration rates. Conversely, during the 2023–2024 growing season, the observed evapotranspiration of pepper plants decreased by 51.3% compared to the 2023 growing season due to elevated relative humidity (average RH is 70.5%), low temperature (average Ta is 15.0 °C), and reduced solar intensity (average Rs is 7.55 MJ·m−2·day−1) in greenhouses caused by thermal blanket coverage during winter.
This study proposes a novel methodology for estimating incident solar radiation within solar greenhouses. The integration of empirical solar radiation models with a ramp function enables effective prediction of daily incident solar radiation levels in solar greenhouses in winter, thereby establishing a new idea for estimating crop transpiration in solar greenhouses. The model has simple input parameters and does not require a high level of expertise compared to traditional models. The estimation of ETc act can be done using a mobile device, which facilitates farmers to adjust their irrigation regime and is more suitable for popularization and application in practical production.

5. Conclusions

This study first evaluated the applicability of temperature- and sunshine-based solar radiation estimation models in the Gobi region of the Hexi Corridor. The results indicate that the RT-4, RT-5, and RT-6 models demonstrated high accuracy. When combined with the incidence coefficient and ramp function, these models can be used to estimate incident solar radiation within greenhouses. The PM–RT model (integrating Penman–Monteith with radiation estimation models), developed based on these findings, performed well during both summer and autumn growing seasons (R2 ranging from 0.79 to 0.81). However, during winter and spring, only the PM–RT4 model exhibited satisfactory predictive performance (R2 = 0.75). Therefore, the PM–RT4 model is recommended for predicting actual crop evapotranspiration in substrate-cultivated crops grown in solar greenhouses within the Hexi Corridor region. A key limitation of this model is that its crop coefficient module and solar radiation estimation module require recalibration for different climatic conditions and regions.

Author Contributions

Conceptualization, J.X.; methodology, Y.C.; supervision, J.Z.; software, J.Z.; Funding acquisition, J.X. and X.Z.; validation, N.M.; formal analysis, J.Z. and Y.C.; investigation, J.Z. and Y.C.; resources, J.X.; data curation, N.M. and X.Z.; writing—original draft preparation, N.M.; writing—review and editing, J.X. and X.Z. All authors have read and agreed to the published version of the manuscript.

Funding

This research was funded by the National Natural Science Foundation of China [grant number 32072657], Special Fund for Science and Technology Innovation and Development Guided by Gansu Province [grant number 2018ZX-02], Excellent Graduate Innovation Star Project Gansu Province, China [grant number 2023CXZX-659], and the Research Start-up Funds of Gansu Agricultural University (grant number GAU-KYQD-2020-9).

Data Availability Statement

The dataset is available upon request from the authors.

Conflicts of Interest

The authors declare no conflicts of interest.

References

  1. Liu, Y.; Yang, Y.; Li, Y.; Li, J. Conversion from rural settlements and arable land under rapid urbanization in Beijing during 1985–2010. J. Rural Stud. 2017, 51, 141–150. [Google Scholar] [CrossRef]
  2. Mueller, N.D.; Gerber, J.S.; Johnston, M.; Ray, D.K.; Ramankutty, N.; Foley, J.A. Closing yield gaps through nutrient and water management. Nature 2012, 490, 254–257. [Google Scholar] [CrossRef]
  3. Panwar, N.; Kaushik, S.; Kothari, S. Solar greenhouse an option for renewable and sustainable farming. Renew. Sustain. Energy Rev. 2011, 15, 3934–3945. [Google Scholar] [CrossRef]
  4. Xie, J.; Yu, J.; Chen, B.; Feng, Z.; Lyu, J.; Hu, L.; Gan, Y.; Siddique, K.H.M. Gobi agriculture: An innovative farming system that increases energy and water use efficiencies. A review. Agron. Sustain. Dev. 2018, 38, 62. [Google Scholar] [CrossRef]
  5. Liu, J.; Zhang, Z.; Xu, X.; Kuang, W.; Zhou, W.; Zhang, S.; Li, R.; Yan, C.; Yu, D.; Wu, S. Spatial patterns and driving forces of land use change in China during the early 21st century. J. Geogr. Sci. 2010, 20, 483–494. [Google Scholar] [CrossRef]
  6. Zhang, Y.; Wang, P.; Wang, L.; Sun, G.; Zhao, J.; Zhang, H.; Du, N. The influence of facility agriculture production on phthalate esters distribution in black soils of northeast China. Sci. Total Environ. 2015, 506, 118–125. [Google Scholar] [CrossRef] [PubMed]
  7. Xie, J.; Yu, J.; Chen, B.; Feng, Z.; Li, J.; Zhao, C.; Lyu, J.; Hu, L.; Gan, Y.; Siddique, K.H. Facility cultivation systems “设施农业”: A Chinese model for the planet. Adv. Agron. 2017, 145, 1–42. [Google Scholar]
  8. Gong, X.; Liu, H.; Sun, J.; Gao, Y.; Zhang, H. Comparison of Shuttleworth-Wallace model and dual crop coefficient method for estimating evapotranspiration of tomato cultivated in a solar greenhouse. Agric. Water Manag. 2019, 217, 141–153. [Google Scholar] [CrossRef]
  9. Allen, R.G.; Pereira, L.S.; Raes, D.; Smith, M. Crop Evapotranspiration: Guidelines for Computing Crop Water Requirements; Irrigation and Drainage Paper No 56; Food and Agriculture Organization of the United Nations (FAO): Rome, Italy, 1998. [Google Scholar]
  10. Paredes, P.; Martins, D.S.; Pereira, L.S.; Cadima, J.; Pires, C. Accuracy of daily estimation of grass reference evapotranspiration using ERA-interim reanalysis products with assessment of alternative bias correction schemes. Agric. Water Manag. 2018, 210, 340–353. [Google Scholar] [CrossRef]
  11. Tabari, H.; Grismer, M.E.; Trajkovic, S. Comparative analysis of 31 reference evapotranspiration methods under humid conditions. Irrig. Sci. 2013, 31, 107–117. [Google Scholar] [CrossRef]
  12. Djaman, K.; O’Neill, M.; Diop, L.; Bodian, A.; Allen, S.; Koudahe, K.; Lombard, K. Evaluation of the Penman-Monteith and other 34 reference evapotranspiration equations under limited data in a semiarid dry climate. Theor. Appl. Climatol. 2019, 137, 729–743. [Google Scholar] [CrossRef]
  13. Song, X.; Lu, F.; Xiao, W.; Zhu, K.; Zhou, Y.; Xie, Z. Performance of 12 reference evapotranspiration estimation methods compared with the Penman–Monteith method and the potential influences in northeast China. Meteorol. Appl. 2019, 26, 83–96. [Google Scholar] [CrossRef]
  14. Fernández, M.; Bonachela, S.; Orgaz, F.; Thompson, R.; López, J.; Granados, M.; Gallardo, M.; Fereres, E. Measurement and estimation of plastic greenhouse reference evapotranspiration in a Mediterranean climate. Irrig. Sci. 2010, 28, 497–509. [Google Scholar] [CrossRef]
  15. Morille, B.; Migeon, C.; Bournet, P.E. Is the Penman–Monteith model adapted to predict crop transpiration under greenhouse conditions? Application to a new guinea impatiens crop. Sci. Hortic. 2013, 152, 80–91. [Google Scholar] [CrossRef]
  16. Hargreaves, G.H.; Samani, Z.A. Estimating potential evapotranspiration. J. Irrig. Drain. Div. 1982, 108, 225–230. [Google Scholar] [CrossRef]
  17. Priestley, C.; Taylor, R. On the assessment of surface heat flux and evaporation using large-scale parameters. Mon. Weather Rev. 1972, 100, 81–92. [Google Scholar] [CrossRef]
  18. Almorox, J.; Hontoria, C.; Benito, M. Models for obtaining daily global solar radiation with measured air temperature data in Madrid (Spain). Appl. Energy 2011, 88, 1703–1709. [Google Scholar] [CrossRef]
  19. Quej, V.H.; Almorox, J.; Ibrakhimov, M.; Saito, L. Estimating daily global solar radiation by day of the year in six cities located in the Yucatán Peninsula, Mexico. J. Clean. Prod. 2016, 141, 75–82. [Google Scholar] [CrossRef]
  20. Mohammadi, K.; Shamshirband, S.; Anisi, M.H.; Alam, K.A.; Petković, D. Support vector regression based prediction of global solar radiation on a horizontal surface. Energy Convers. Manag. 2015, 91, 433–441. [Google Scholar] [CrossRef]
  21. Kumar, R.; Aggarwal, R.K.; Sharma, J.D. Comparison of regression and artificial neural network models for estimation of global solar radiations. Renew. Sustain. Energy Rev. 2015, 52, 1294–1299. [Google Scholar] [CrossRef]
  22. Alonso-Montesinos, J.; Batlles, F.J.; Bosch, J.L. Beam, diffuse and global solar irradiance estimation with satellite imagery. Energy Convers. Manag. 2015, 105, 1205–1212. [Google Scholar] [CrossRef]
  23. Pawlak, D.T.; Clothiaux, E.E.; Modest, M.F.; Cole, J.N.S. Full-spectrum correlated-k distribution for shortwave atmospheric radiative transfer. J. Atmos. Sci. 2004, 61, 2588–2601. [Google Scholar] [CrossRef]
  24. Despotovic, M.; Nedic, V.; Despotovic, D.; Cvetanovic, S. Review and statistical analysis of different global solar radiation sunshine models. Renew. Sustain. Energy Rev. 2015, 52, 1869–1880. [Google Scholar] [CrossRef]
  25. Besharat, F.; Dehghan, A.A.; Faghih, A.R. Empirical models for estimating global solar radiation: A review and case study. Renew. Sustain. Energy Rev. 2013, 21, 798–821. [Google Scholar] [CrossRef]
  26. Yang, K.; Koike, T.; Ye, B. Improving estimation of hourly, daily, and monthly solar radiation by importing global data sets. Agric. For. Meteorol. 2006, 137, 43–55. [Google Scholar] [CrossRef]
  27. Annandale, J.; Jovanovic, N.; Benadé, N.; Allen, R. Software for missing data error analysis of Penman-Monteith reference evapotranspiration. Irrig. Sci. 2002, 21, 57–67. [Google Scholar] [CrossRef]
  28. Samani, Z. Estimating solar radiation and evapotranspiration using minimum climatological data. J. Irrig. Drain. Eng.-ASCE 2000, 126, 265–267. [Google Scholar] [CrossRef]
  29. Chen, R.; Ersi, K.; Yang, J.; Lu, S.; Zhao, W. Validation of five global radiation models with measured daily data in China. Energy Convers. Manag. 2004, 45, 1759–1769. [Google Scholar] [CrossRef]
  30. Hassan, G.E.; Youssef, M.E.; Mohamed, Z.E.; Ali, M.A.; Hanafy, A.A. New temperature-based models for predicting global solar radiation. Appl. Energy 2016, 179, 437–450. [Google Scholar] [CrossRef]
  31. Rooij, G.H.d. Methods of soil analysis: Part 4. Physical methods. Vadose Zone J. 2004, 3, 722–723. [Google Scholar] [CrossRef]
  32. Reatto, A.; Silva, E.M.D.; Bruand, A.; Martins, E.S.; Lima, J.E.F.W. Validity of the centrifuge method for determining the water retention properties of tropical soils. Soil Sci. Soc. Am. J. 2008, 72, 1547–1553. [Google Scholar] [CrossRef]
  33. Allen, R.G.; Pereira, L.S.; Howell, T.A.; Jensen, M.E. Evapotranspiration information reporting: I. Factors governing measurement accuracy. Agric. Water Manag. 2011, 98, 899–920. [Google Scholar] [CrossRef]
  34. Ding, R.; Kang, S.; Zhang, Y.; Hao, X.; Tong, L.; Du, T. Partitioning evapotranspiration into soil evaporation and transpiration using a modified dual crop coefficient model in irrigated maize field with ground-mulching. Agric. Water Manag. 2013, 127, 85–96. [Google Scholar] [CrossRef]
  35. Katsoulas, N.; Stanghellini, C. Modelling crop transpiration in greenhouses: Different models for different applications. Agronomy 2019, 9, 392. [Google Scholar] [CrossRef]
  36. Bontsema, J.; Hemming, J.; Stanghellini, C.; De Visser, P.; Van Henten, E.; Budding, J.; Rieswijk, T.; Nieboer, S. On-line estimation of the transpiration in greenhouse horticulture. In Proceedings of the Agricontrol 2007 2nd IFAC International Conference on Modeling and Design of Control Systems in Agriculture, Osijek, Croatia, 3–5 September 2007; Volume 2008, pp. 29–34. [Google Scholar]
  37. Jahani, B.; Dinpashoh, Y.; Nafchi, R.A. Evaluation and development of empirical models for estimating daily solar radiation. Renew. Sustain. Energy Rev. 2017, 73, 878–891. [Google Scholar] [CrossRef]
  38. Angstrom, A. Solar and terrestrial radiation. Report to the international commission for solar research on actinometric investigations of solar and atmospheric radiation. Q. J. R. Meteorol. Soc. 1924, 50, 121–126. [Google Scholar] [CrossRef]
  39. Bahel, V.; Bakhsh, H.; Srinivasan, R. A correlation for estimation of global solar radiation. Energy 1987, 12, 131–135. [Google Scholar] [CrossRef]
  40. Ayodele, T.R.; Ogunjuyigbe, A.S.O. Prediction of monthly average global solar radiation based on statistical distribution of clearness index. Energy 2015, 90, 1733–1742. [Google Scholar] [CrossRef]
  41. ASHRAE. ASHRAE Handbook of Fundamentals; American Society of Heating, Refrigerating and Air Conditioning Engineers: Atlanta, GA, USA, 1972. [Google Scholar]
  42. Zhang, X.; Lv, J.; Xie, J.; Yu, J.; Zhang, J.; Tang, C.; Li, J.; He, Z.; Wang, C. Solar radiation allocation and spatial distribution in Chinese solar greenhouses: Model development and application. Energies 2020, 13, 1108. [Google Scholar] [CrossRef]
  43. TPDC. China Meteorological Forcing Dataset (1979–2018). Available online: https://data.tpdc.ac.cn/home (accessed on 9 September 2024).
  44. He, J.; Yang, K.; Tang, W.; Lu, H.; Qin, J.; Chen, Y.; Li, X. The first high-resolution meteorological forcing dataset for land process studies over China. Sci. Data 2020, 7, 25. [Google Scholar] [CrossRef]
  45. Yang, K.; He, J.; Tang, W.; Qin, J.; Cheng, C.C.K. On downward shortwave and longwave radiations over high altitude regions: Observation and modeling in the Tibetan Plateau. Agric. For. Meteorol. 2010, 150, 38–46. [Google Scholar] [CrossRef]
  46. Trnka, M.; Žalud, Z.; Eitzinger, J.; Dubrovský, M. Global solar radiation in Central European lowlands estimated by various empirical formulae. Agric. For. Meteorol. 2005, 131, 54–76. [Google Scholar] [CrossRef]
  47. Willmott, C.J. On the validation of models. Phys. Geogr. 1981, 2, 184–194. [Google Scholar] [CrossRef]
  48. Willmott, C.J.; Matsuura, K. Advantages of the mean absolute error (MAE) over the root mean square error (RMSE) in assessing average model performance. Clim. Res. 2005, 30, 79–82. [Google Scholar] [CrossRef]
  49. Pereira, L.S.; Paredes, P.; Lopez-Urrea, R.; Hunsaker, D.J.; Mota, M.; Shad, Z.M. Standard single and basal crop coefficients for vegetable crops, an update of FAO56 crop water requirements approach. Agric. Water Manag. 2020, 243, 106196. [Google Scholar] [CrossRef]
  50. Tong, X.; Sun, Z.; Sigrimis, N.; Li, T.; Yu, X. Energy sustainability performance of a sliding cover solar greenhouse: Solar energy capture aspects. Biosyst. Eng. 2018, 176, 88–102. [Google Scholar] [CrossRef]
  51. Qiu, R.; Du, T.; Wu, L.; Chen, R.; Kang, S. Assessing the SIMDualKc model for estimating evapotranspiration of hot pepper grown in a solar greenhouse in Northwest China. Agric. Syst. 2015, 138, 1–9. [Google Scholar] [CrossRef]
  52. Rosa, R.D.; Paredes, P.; Rodrigues, G.C.; Alves, I.; Fernando, R.M.; Pereira, L.S.; Allen, R.G. Implementing the dual crop coefficient approach in interactive software. 1. Background and computational strategy. Agric. Water Manag. 2012, 103, 8–24. [Google Scholar] [CrossRef]
  53. Alemayehu, Y.A.; Steyn, J.M.; Annandale, J.G. FAO-type crop factor determination for irrigation scheduling of hot pepper (Capsicum annuum L.) cultivars. S. Afr. J. Plant Soil 2009, 26, 186–194. [Google Scholar] [CrossRef]
  54. Shukla, S.; Jaber, F.H.; Goswami, D.; Srivastava, S. Evapotranspiration losses for pepper under plastic mulch and shallow water table conditions. Irrig. Sci. 2013, 31, 523–536. [Google Scholar] [CrossRef]
  55. Allen, R.G.; Pereira, L.S. Estimating crop coefficients from fraction of ground cover and height. Irrig. Sci. 2009, 28, 17–34. [Google Scholar] [CrossRef]
  56. Dobon-Suarez, A.; Gimenez, M.J.; Castillo, S.; Garcia-Pastor, M.E.; Zapata, P.J. Influence of the phenological stage and harvest date on the bioactive compounds content of green pepper fruit. Molecules 2021, 26, 3099. [Google Scholar] [CrossRef]
  57. Rajametov, S.; Lee, K.; Jeong, H.B.; Cho, M.C.; Nam, C.W.; Yang, E.Y. The effect of night low temperature on agronomical traits of thirty-nine pepper accessions (Capsicum annuum L.). Agronomy 2021, 11, 1986. [Google Scholar] [CrossRef]
  58. Qiu, R.; Kang, S.; Li, F.; Du, T.; Tong, L.; Wang, F.; Chen, R.; Liu, J.; Li, S. Energy partitioning and evapotranspiration of hot pepper grown in greenhouse with furrow and drip irrigation methods. Sci. Hortic. 2011, 129, 790–797. [Google Scholar] [CrossRef]
Figure 1. Geographical location of the study area.
Agronomy 15 01921 g001
Figure 2. Cross-sectional schematic diagram of the GSGs.
Agronomy 15 01921 g002
Figure 3. Cross-sectional schematic diagram, internal and external views of the GSGs.
Agronomy 15 01921 g003
Figure 4. Planting pattern of green pepper and arrangement of sensors.
Agronomy 15 01921 g004
Figure 5. Ramp function for calculating incident solar radiation in GSGs.
Agronomy 15 01921 g005
Figure 6. Daily values of Indoor incident solar radiation (Rs), temperature (Ta), relative humidity (RH), water vapor pressure difference (VPD), and outside air temperature (Tout) during 2023–2024.
Agronomy 15 01921 g006
Figure 7. Prediction results of the eight solar radiation models. Results of the T1-T5, N1-N2 solar radiation model fits (a); and segmental fitting results of the T6 model, with T6-a denoting the fitted curve for the first half of the year and T6-b denoting the fitted curve for the second half of the year (b). Ro signifies the observed value.
Agronomy 15 01921 g007
Figure 8. Scatterplots of the Rs values estimated from eight selected models versus corresponding observed values in the Jiuquan station, scatterplots of the T1-T6 model (af), and scatterplots of the N1, N2 model (g,h). (Note: Ro signifies the observed value. The dashed lines represent a 1:1 line and the fine line is the best-fitted line).
Agronomy 15 01921 g008
Figure 9. Trend of observed incident solar radiation and models estimated during 2023–2024.
Agronomy 15 01921 g009
Figure 10. Comparison between estimated and observed incident solar radiation during the 2023 growing season (a), and comparison between estimated and observed GSGs solar radiation during the 2023–2024 growing season (b). Also shown is the 1:1 line.
Agronomy 15 01921 g010
Figure 11. Test variations of basal crop coefficient (Kcb) and observed crop evapotranspiration (ETc obs) in different growing seasons. Changes in basal crop coefficient and crop evapotranspiration of green pepper in the 2023 growing season (a), and changes in basal crop coefficient and crop evapotranspiration of green pepper in the 2023–2024 growing season (b).
Agronomy 15 01921 g011
Figure 12. Comparison between daily actual evapotranspiration (daily ETc act) estimated using the different models based on observed solar radiation data and observed data during the 2023 growing season (a), and comparison between daily actual evapotranspiration estimated using the different models based on observed solar radiation data and observed data during the 2023–2024 growing season (b).
Agronomy 15 01921 g012
Figure 13. Comparison between daily greenhouse ETc act estimated using the PM model based on observed solar radiation data and observed values (a); comparison between daily greenhouse ETc act using the PM–RT4 model and observed values (b); comparison between daily greenhouse ETc act using the PM–RT5 model and observed values (c); and comparison between daily greenhouse ETc act using the PM–RT6 model and observed values (d). Also shown is the 1:1 line, and other symbols are the same as above.
Agronomy 15 01921 g013
Table 1. The main parameters used to calculate crop transpiration.
ParameterValueUnitSource
Soil evaporation coefficient (Ke)0-measured
Water stress coefficient (Ks)1-measured
Leaf senescence factor (fs)0-measured
Field capacity (θFC)0.459cm3·cm−3measured
Wilting point (θWP)0.08cm3·cm−3measured
Effective rooting depth (Zr)0.25mmeasured
Depletion fractions (pini)0.3-[9]
Depletion fractions (pdev)0.3-[9]
Depletion fractions (pmid)0.3-[9]
Minimum basal crop coefficient (Kcb,min)0.1-[34]
Soil heat flux (G)0W·m−2[8]
Extinction coefficient of light attenuation (kx)0.7-[36]
Reflection coefficient of light attenuation (a)0.86-[36]
Table 2. Rs models selected and used in the present study.
Model classModel NameIDModel Formulae
Temperature-basedAllen [9]T1 R s = R a a Q F E / Q F F 0.5 Δ T 0.5
Samani [27]T2 R s = R a a Δ T 2.5 + b Δ T 1.5 + c Δ T 0.5
Annandale [26]T3 R s = R a a 1 + 2.7 × 10 6 Z Δ T 0.5
Chen [28]T4 R s = R a a + b ln Δ T
Hassan [29]T5 R s = R a a T b R a + c
Present studyT6 R s = a T 2 + b T + c
Sunshine-basedAngstrom [38]N1 R s = R a a + b n N
Bahel [39]N2 R s = R a a + b n N + c n N 2 + d n N 3
Note: where QFE and QFF are the mean air pressure at site level (847 mbar) and sea level (almost equal to 1013 mbar), Z is the station altitude (1500 m), T is the daily ambient temperature (°C), Tmax is the maximum temperature (°C), Tmin is the minimum temperature (°C), ΔT is the temperature difference (°C) (ΔT = (TmaxTmin)), Ra is the extraterrestrial solar radiation on a horizontal surface (MJ·m−2·day−1), n is actual sunshine hours (h), and N is maximum possible sunshine hours (h), respectively. a, b, c, and d are the empirical coefficients.
Table 3. Parameter values in the model.
ot1t2t3
Date1 November1 December1 February1 March
N3053353260
Note: N represents the numerical day of the year starting from 1 January (1).
Table 4. Error statistics of the eight empirical models used for estimation of the daily value of solar radiation in the Jiuquan station.
Model ClassIDModel Empirical CoefficientsR2MAE
(MJ·m−2·day−1)
MBE
(MJ·m−2·day−1)
RMSE
(MJ·m−2·day−1)
NRMSE
%
Rank
abcd
Temperature-basedT10.1856 0.94920.0616−0.25471.32086.865
T20.001−0.02730.3641 0.95990.0531−0.36611.17316.094
T30.169 0.94920.0617−0.25851.32136.866
T40.4410.0577 0.96310.0506−0.19131.12555.852
T5−0.0010.04040.6296 0.96250.05590.33711.13575.93
T6−0.0010.657715.25 0.97740.0666−0.32931.25016.491
0.00730.37810.4 0.98920.0456−0.01290.85624.45
Sunshine-basedN10.27610.4512 0.94370.0649−0.03841.39087.228
N20.25080.13391.1086−0.85370.94250.0639−0.04591. 4067.37
R2 is the coefficient of determination; MAE is the mean absolute error; MBE is the mean bias error; RMSE is the root mean square error; and NRMSE is the normalized root mean square error.
Table 5. Error statistics of the models used for the estimation of the daily value of incident solar radiation in the greenhouse.
SeasonModelRs est
(MJ·m−2·Day−1)
Rs obs
(MJ·m−2·Day−1)
R2MAE
(MJ·m−2·Day−1)
MBE
(MJ·m−2·Day−1)
RMSE
(MJ·m−2·Day−1)
NRMSE
%
2023RT-416.3716.190.81030.0205−0.08380.43132.45
RT-516.710.45640.0356−0.42990.73014.14
RT-615.980.62510.0320.09190.60633.44
2023–2024RT-47.437.550.85270.1250.12931.05319.32
RT-57.780.83250.1385−0.22141.12319.94
RT-67.960.64250.2051−0.40311.640914.52
Rs est is the model-estimated incident solar radiation; Rs obs is the observed incident solar radiation; R2 is the coefficient of determination; MAE is the mean absolute error; MBE is the mean bias error; RMSE is the root mean square error; and NRMSE is the normalized root mean square error.
Table 6. Standard and calibrated basal crop coefficients.
StandardCalibrated
2023 Growing Season2023–2024 Growing Season
Kcb ini0.150.150.17
Kcb mid1.101.010.82
Note: Kcb ini is the basal crop coefficient value in the initial stage, and Kcb ini is the basal crop coefficient value in the mid-stage. Standard is the updated FAO-56 values [49]. Calibration values differed between the 2023 growing seasons and the 2023–2024 growing seasons.
Table 7. Error statistics of different solar radiation models for calculating actual green pepper evapotranspiration of substrate cultivated in the greenhouse in the Hexi Corridor.
SeasonModelETc act
(mm·Day−1)
ETc obs
(mm·Day−1)
R2MAE
(mm·Day−1)
MBE
(mm·Day−1)
RMSE
(mm·Day−1)
NRMSE
%
2023PM–FAO-565.69215.89010.81340.38070.19811.929712.8
PM–RT45.69200.81010.38120.19841.946512.91
PM–RT55.73360.80760.38590.15651.959213
PM–RT65.65470.79810.38510.23542.006813.31
2023–2024PM–FAO-563.09321.72430.72380.1985−0.13530.394810.58
PM–RT43.06860.75610.2184−0.12040.37099.94
PM–RT53.14620.74210.2290−0.16710.381510.23
PM–RT63.13410.68810.2274−0.15980.419511.25
ETc act is the model-estimated evapotranspiration; ETc obs is the observed evapotranspiration; R2 is the coefficient of determination; MAE is the mean absolute error; MBE is the mean bias error; RMSE is the root mean square error; and NRMSE is the normalized root mean square error.
Disclaimer/Publisher’s Note: The statements, opinions and data contained in all publications are solely those of the individual author(s) and contributor(s) and not of MDPI and/or the editor(s). MDPI and/or the editor(s) disclaim responsibility for any injury to people or property resulting from any ideas, methods, instructions or products referred to in the content.