Article

Design and Optimization Experiment of a Cam-Swing Link Precision Metering Device for Peanut Based on Simulation

1
School of Intelligent Engineering, Shaoxing University, Shaoxing 312000, China
2
College of Mechanical and Electrical Engineering, Shihezi University, Shihezi 832003, China
3
College of Engineering, Nanjing Agricultural University, Nanjing 210031, China
*
Author to whom correspondence should be addressed.
Agronomy 2025, 15(8), 1917; https://doi.org/10.3390/agronomy15081917
Submission received: 20 July 2025 / Revised: 4 August 2025 / Accepted: 7 August 2025 / Published: 8 August 2025
(This article belongs to the Section Precision and Digital Agriculture)

Abstract

To address the problem of unstable seed filling and low seeding accuracy caused by poor seed flow in conventional peanut seed metering devices, a novel precision metering device based on a cam-swing link was developed. Using EDEM simulations, the capacity of different type hole installation positions to induce seed cluster disturbance was analyzed. A single-factor test and MBD–DEM coupled simulation were conducted to analyze the seeding performance. The simulation results indicate that when the type hole protrusion height was set to half the thickness of the seeding disc, seed cluster kinetic energy remained relatively stable, enhancing the capability to disturb seeds. As the seeding disc rotational speed increased from 10 to 40 rpm, the qualified index initially increased and then declined. Increasing the cluster wrap angle from 20° to 70° similarly led to a peak in the qualified index and a steady decrease in the missed index. Using the JPS-12 computer vision-based test platform, a second-order rotary orthogonal design was applied to evaluate the seeding performance. The experimental results show that when the seeding disc rotational speed was set at 26 rpm and the seed cluster wrap angle at 46°, the qualified index reached 89.95%, and the missed index was 4.04%. The average plant spacing of peanuts in field experiments was 137.82 mm. These results meet the operational requirements for precision peanut planting.

1. Introduction

Peanut is one of the most important oilseed crops in China, ranking among the top plants globally in both cultivation area and total output [1,2]. It is widely grown across various agroecological zones in the country. To enhance soil temperature, maintain soil moisture, promote seed germination and seedling growth, suppress weed emergence, and improve soil physicochemical properties, film-mulched seeding, typically performed using duckbill-type metering devices [3,4], has been widely adopted in China’s major peanut-producing regions. However, due to the large seed size, thin seed coat, high susceptibility to damage, and poor flowability of peanut seeds [5,6], stable seed filling during operation is difficult to achieve. Moreover, seeds that have entered the type holes are susceptible to dislodgement due to the influence of the surrounding seed cluster. This often results in incomplete filling of the type holes, thereby reducing the seeding precision of the duckbill-type metering device and making it difficult to maintain consistent seed spacing in peanut planting.
Currently, peanut planters are mainly divided into two types: mechanical planters and pneumatic planters, both of which are widely used in practical peanut sowing series planters. The mechanical planter adopts a mechanical metering device, and the metering device and transmission system are relatively simple. The pneumatic planter adopts a pneumatic metering device, which uses air flow as a carrier to complete seed suction, carrying, and delivering. It has the characteristics of multiple seeding rows, large width, and high operating speed, which lead to optimization of seeding performance for pneumatic planters. Mechanical planters have a simple structure and lower manufacturing costs. To address these challenges and improve the filling and seeding performance of precision metering devices for peanut seeds, numerous researchers have conducted in-depth studies. Guo et al. [7] developed an air-assisted precision metering device and optimized key structural parameters of the seeding disc, including suction holes, seed guide grooves, and air-assisted blowing holes. To enhance the accuracy and consistency of seed delivery in air-suction roller dibblers, Zhang et al. [8] designed a seed separation disc and utilized DEM–CFD coupled simulations to examine the effects of tooth orientation angle, installation angle, and operating speed on seed-delivery performance. To address the problem of missed seeding and multiple seeding caused by seeds failing to accurately enter the guiding mechanism during the seed delivery process of the air-suction roller dibbler, Kang et al. [9] proposed a method for optimizing seed delivery by adjusting the edge opening position of the dibbler cover and the installation angle of the guiding mechanism in order to determine the optimal seed-delivery trajectory. EDEM simulations were then conducted to evaluate the seed-delivery performance of the dibbler cover and guiding mechanism under different installation angles. Additionally, to improve single-seed precision planting and seed spacing accuracy in small-plot peanut sowing, Hao et al. [10] designed a spoon-clip-type planting unit controlled by an STM32 microcontroller and achieved orderly seed filling and delivering by optimizing the outlet height relative to the ground. Ren et al. [11] designed and optimized a seed discharger for peanut plot breeding. Two single-stroke cylinders were used for seed replacement to avoid confusion between different varieties of seeds. The optimal parameters for the rotational speed of the seed cylinder, the diameter of the seed suction hole, and the working negative pressure were determined using CFD–DEM gas–solid coupling simulation. Xiang et al. [12] analyzed and optimized the peanut seeding process with an air-suction roller dibbler and stabilized the seed trajectory by adjusting the installation angles of the chock block and installation angles of the dibbler cover. Da Costa et al. [13] optimized the in-row seed distribution uniformity performance of a vacuum-type seed metering unit in peanut seeding under different operating conditions. The optimal parameter combination of peripheral speed of the seed plate, hole diameter, and vacuum pressure was determined. The aforementioned studies have enhanced the seeding performance of precision metering devices for peanut; however, limited research has focused on improving seed flowability and enhancing both seed-filling and cleaning performance through the integration of type holes with cam-swinging link.
To address the issues of poor seed flowability during the seed-filling process of peanut precision metering devices, resulting in unstable filling and low seeding precision, a cam-swing link precision metering device for peanut was designed. The key structural parameters of the seeding disc and the cam-swing link mechanism were determined. EDEM simulations were used to comparatively analyze the effects of different type hole installation positions on the ability to disturb the seed cluster. A single-factor experiment, combined with MBD–DEM coupled simulation, was conducted to evaluate the influence of seeding disc rotational speed and seed cluster wrap angle on seeding performance. A bench test was further employed to determine the optimal combination of seeding disc rotational speed and wrap angle and to validate the seeding performance under these optimized parameters. The results aim to provide a theoretical and technical reference for improving the performance of a cam-swing link precision metering device for peanut cultivation.

2. Materials and Methods

2.1. Overall Structure

A cam-swing link precision metering device for peanut primarily consists of a seed inlet pipe, seed chamber, shaft, cam, seeding disc, inner rotating disc, duckbill outlet, seed guiding channel, swing link, swing link shaft, outer rotating disc, and fixed disc. The seeding region is divided into five functional zones: seed-filling zone, seed-cleaning zone, seed-carrying zone, seed-delivering zone, and transition zone. The overall structure and functional zoning of the device are illustrated in Figure 1.

2.2. Working Process

During operation, peanut seeds from the seed box enter the seed chamber through the seed inlet pipe. The inner rotating disc drives the seeding disc to rotate clockwise, while the swing link moves in synchrony with the disc. The cam, fixed to the shaft, remains stationary. When the type hole rotates into the seed-filling zone, the swing link is positioned on the near-dwell arc segment of the cam. At this stage, the seed-guiding surface on the swing link and the guide groove on the seeding disc form a curved guiding channel. The rotation of the type hole stirs the seeds within the chamber, causing some seeds to detach from the seed cluster and enter the guiding channel, where they are orderly guided into the type hole. As the type hole enters the seed-cleaning zone, the swing link moves onto the rising arc segment of the cam. Under cam actuation, the swing link begins to swing, and the guiding surface on the swing link gradually protrudes into the guiding channel, pushing excess seeds out of the type hole and returning them to the seed chamber. When the type hole moves into the seed-carrying zone, the swing link enters the far-dwell arc segment of the cam. Here, the seed-carrying surface on the swing link forms a constrained seed-holding space with the type hole, restricting seed movement to maintain positional stability. As the type hole rotates into the seed-delivering zone, the swing link enters the return arc of the cam. Under the combined action of the spring and cam, the swing link swings back, and the seed-carrying surface gradually retracts from the guiding channel. The seed is released from constraint and, driven by gravity, passes through the seed guiding channel into the duckbill outlet, ultimately falling into the soil to complete single-seed metering.

2.3. Key Component Design

2.3.1. Seeding Disc Design

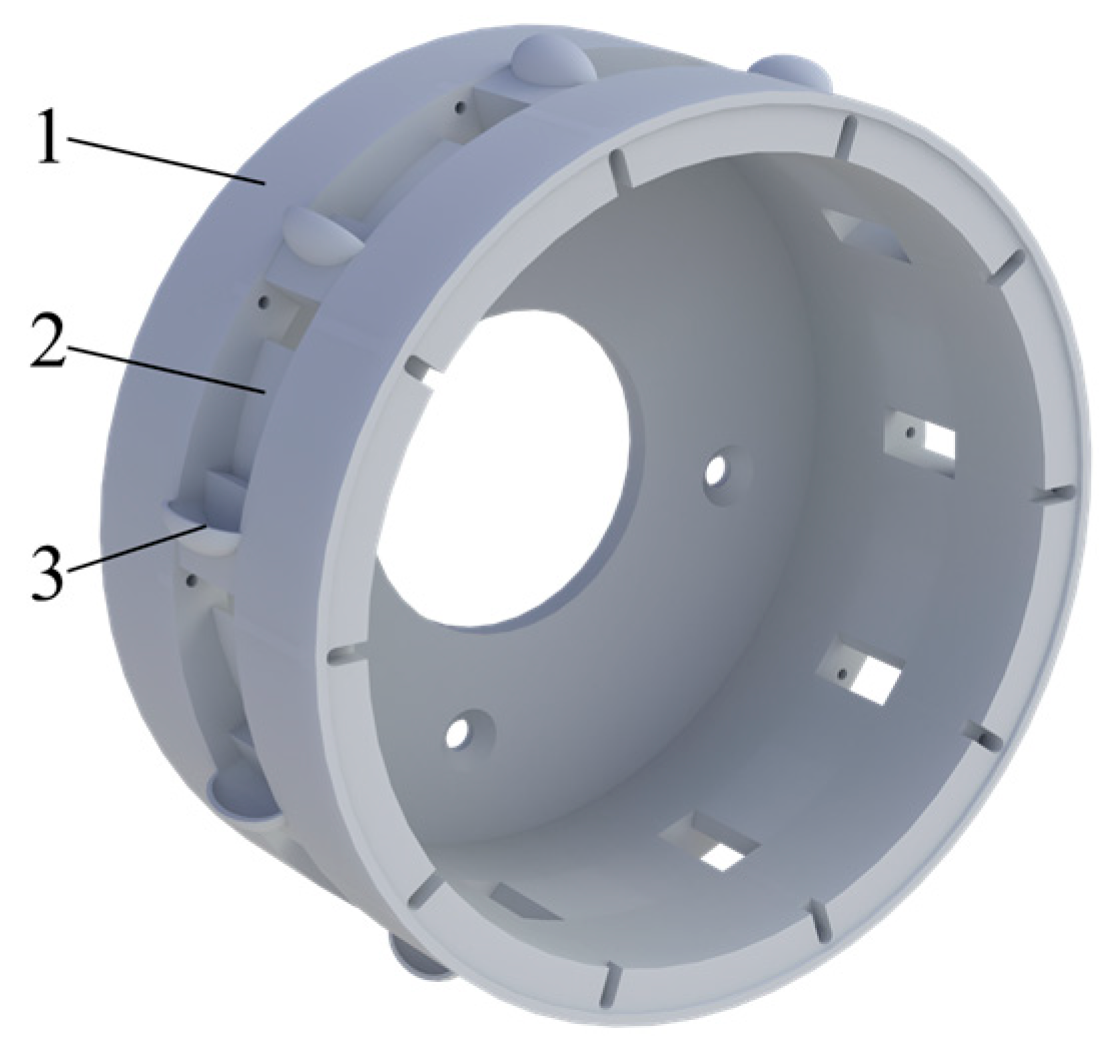
The seeding disc mainly consists of the disc body, guiding groove, and type hole, as shown in Figure 2. As the core component of the metering device, the structural design of the seeding disc has a significant influence on seed detachment from the cluster and on stable seed transport during the filling, cleaning, carrying, and delivering stages.
Type Hole Structure Design
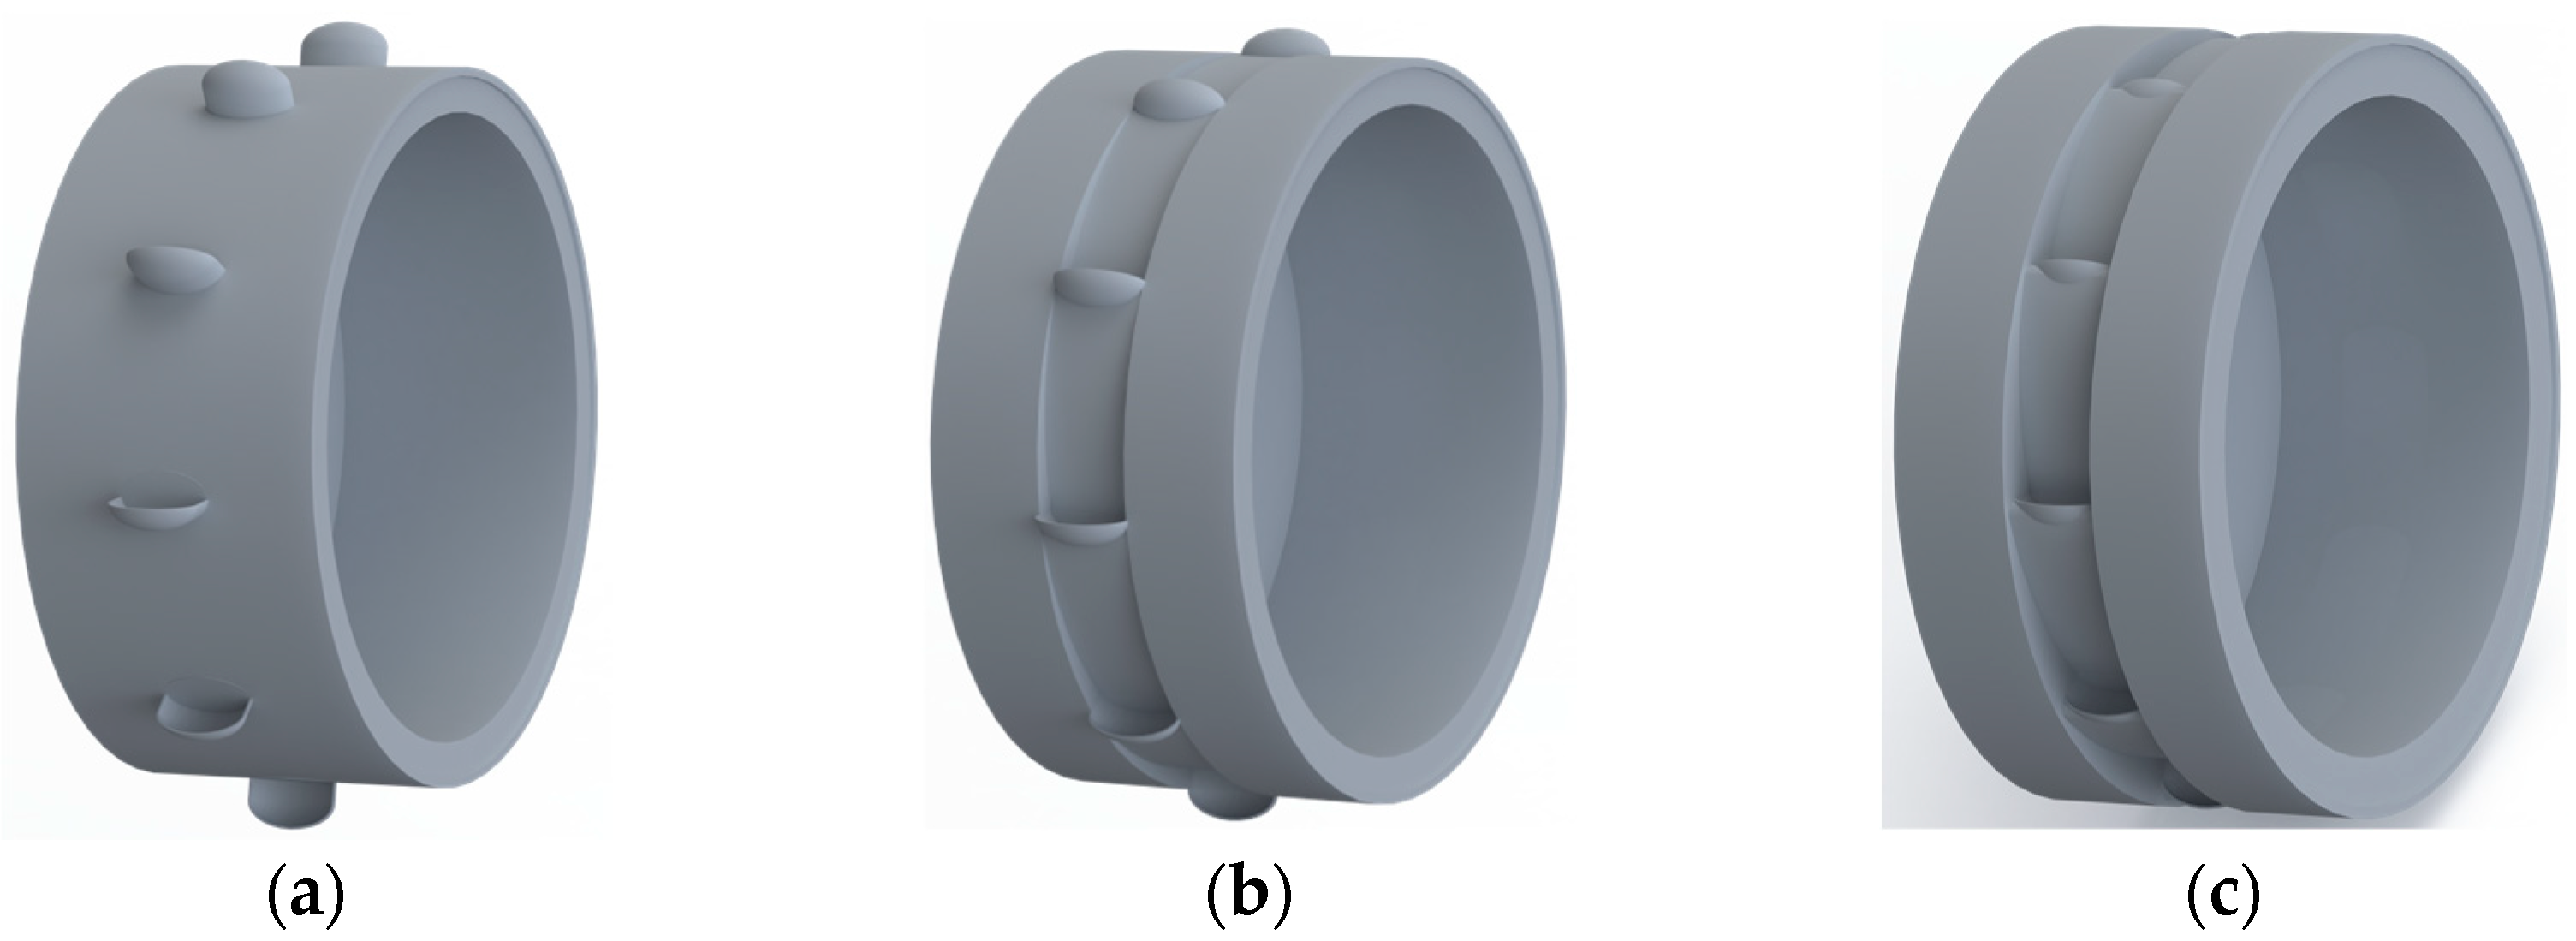
Peanut seeds are approximately ellipsoidal in shape. Due to gravity, inter-seed pressure, and friction within the seed chamber, the seeds tend to form a densely packed cluster, making it difficult for the rotating seeding disc to isolate single seeds from the cluster during operation. To improve the dispersion of the seed cluster and enhance seed flowability, while also enabling the type hole to securely capture individual peanut seeds, the type hole was designed with a semi-ellipsoidal geometry. To comparatively analyze the effect of the protrusion height of semi-ellipsoidal type holes on the capacity to disturb the seed cluster in the seed chamber, three installation configurations of type holes on the seeding disc were designed: fully protruding, partially protruding, and non-protruding. The structures of these configurations are shown in Figure 3.
The size of the type hole affects seed flowability, seed orientation upon entry, and the trajectory of seed motion. To achieve single-seed filling, and taking the partially protruding type hole configuration as an example, the size of the type hole must satisfy the following condition:
L max < R a < 2   L min B max < R b < 2   B min H max < R b < 2   H min
where Ra represents the major axis length of the semi-ellipsoidal type hole (mm), Rb represents the major axis length of the semi-ellipsoidal type hole (mm), Lmax represents the maximum length of peanut seeds (mm), Lmin represents the minimum length of peanut seeds (mm), Bmax represents the maximum width of peanut seeds (mm), Bmin represents the minimum width of peanut seeds (mm), Hmax represents the maximum height of peanut seeds (mm), and Hmin represents the minimum height of peanut seeds (mm).
The size of the type hole should be greater than the maximum size of a single peanut seed but less than twice the minimum size. This ensures that one peanut seed can stably enter the hole while preventing the simultaneous entry of two seeds. Experimental measurements show that the maximum length, width, and height of peanut seeds were 17.81, 9.63, and 9.97 mm, respectively, and the minimum values were 10.20, 6.50, and 6.64 mm, respectively. According to Equation (1), a semi-ellipsoidal type hole with a major axis of 19 mm and a minor axis of 11 mm meets the requirements for single-seed filling. In practice, peanut seeds exhibit irregular semi-ellipsoidal shapes and can be categorized into three types: elongated ellipsoidal (47%), flat ellipsoidal (36%), and near-spherical (17%) [14]. To enhance the type hole’s adaptability to seeds of different shapes and ensure stable filling, adjacent type holes are connected via curved guiding grooves.
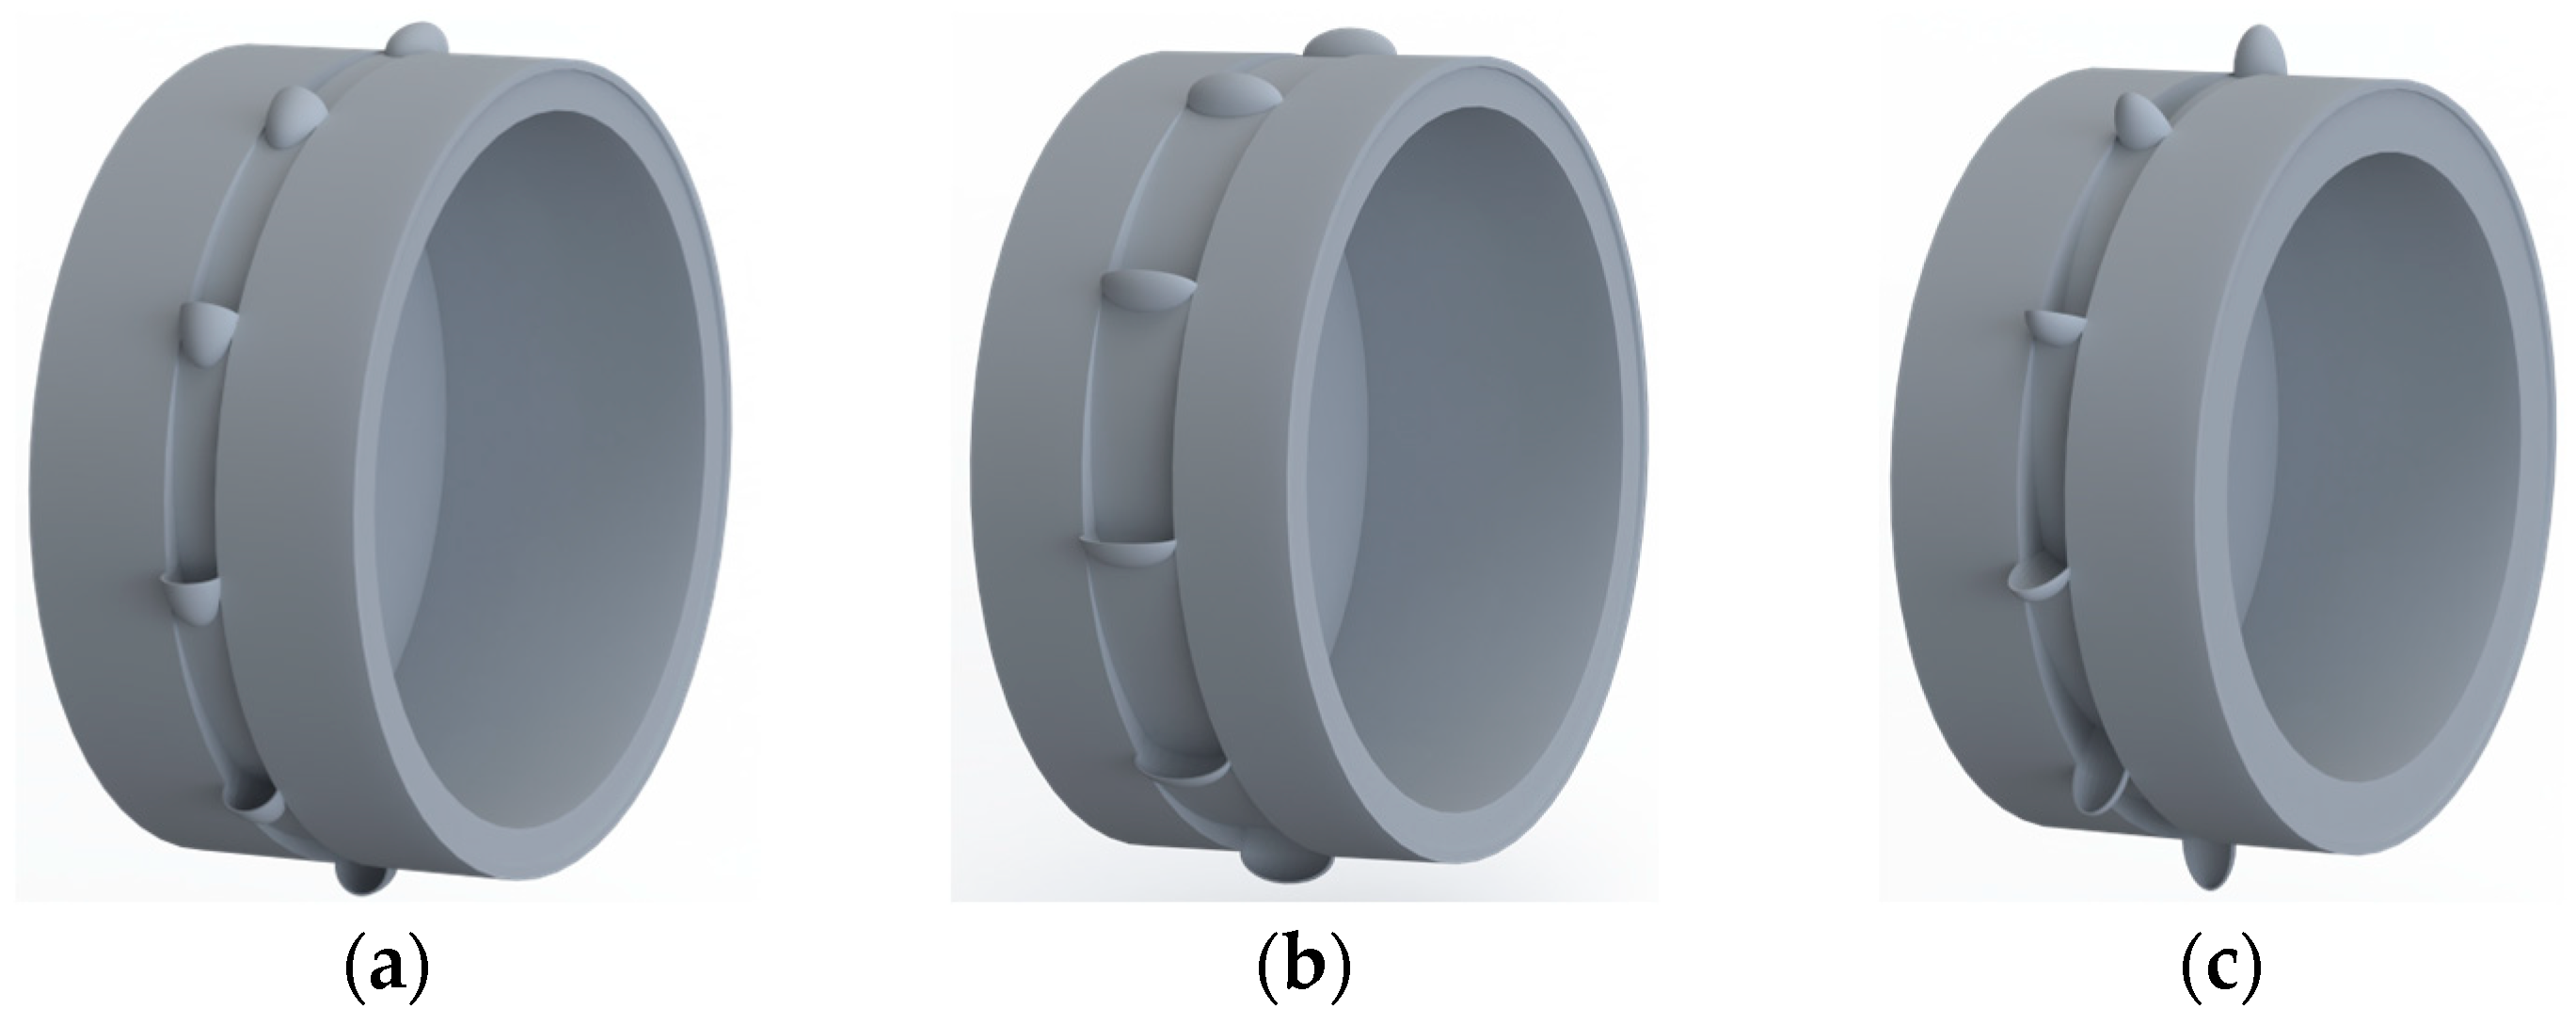
There are three mounting orientations for semi-ellipsoidal type holes on the seeding disc, as shown in Figure 4. In the configuration shown in Figure 4a, a short semi-ellipsoidal type hole is mounted with its short axis aligned with the radial direction of the disc, resulting in a vertically oriented short axis. In Figure 4b, a long semi-ellipsoidal type hole is mounted with its short axis aligned with the radial direction, leading to a horizontally oriented long axis. In Figure 4c, a long semi-ellipsoidal type hole is mounted with its long axis aligned with the radial direction, resulting in a vertically oriented long axis.
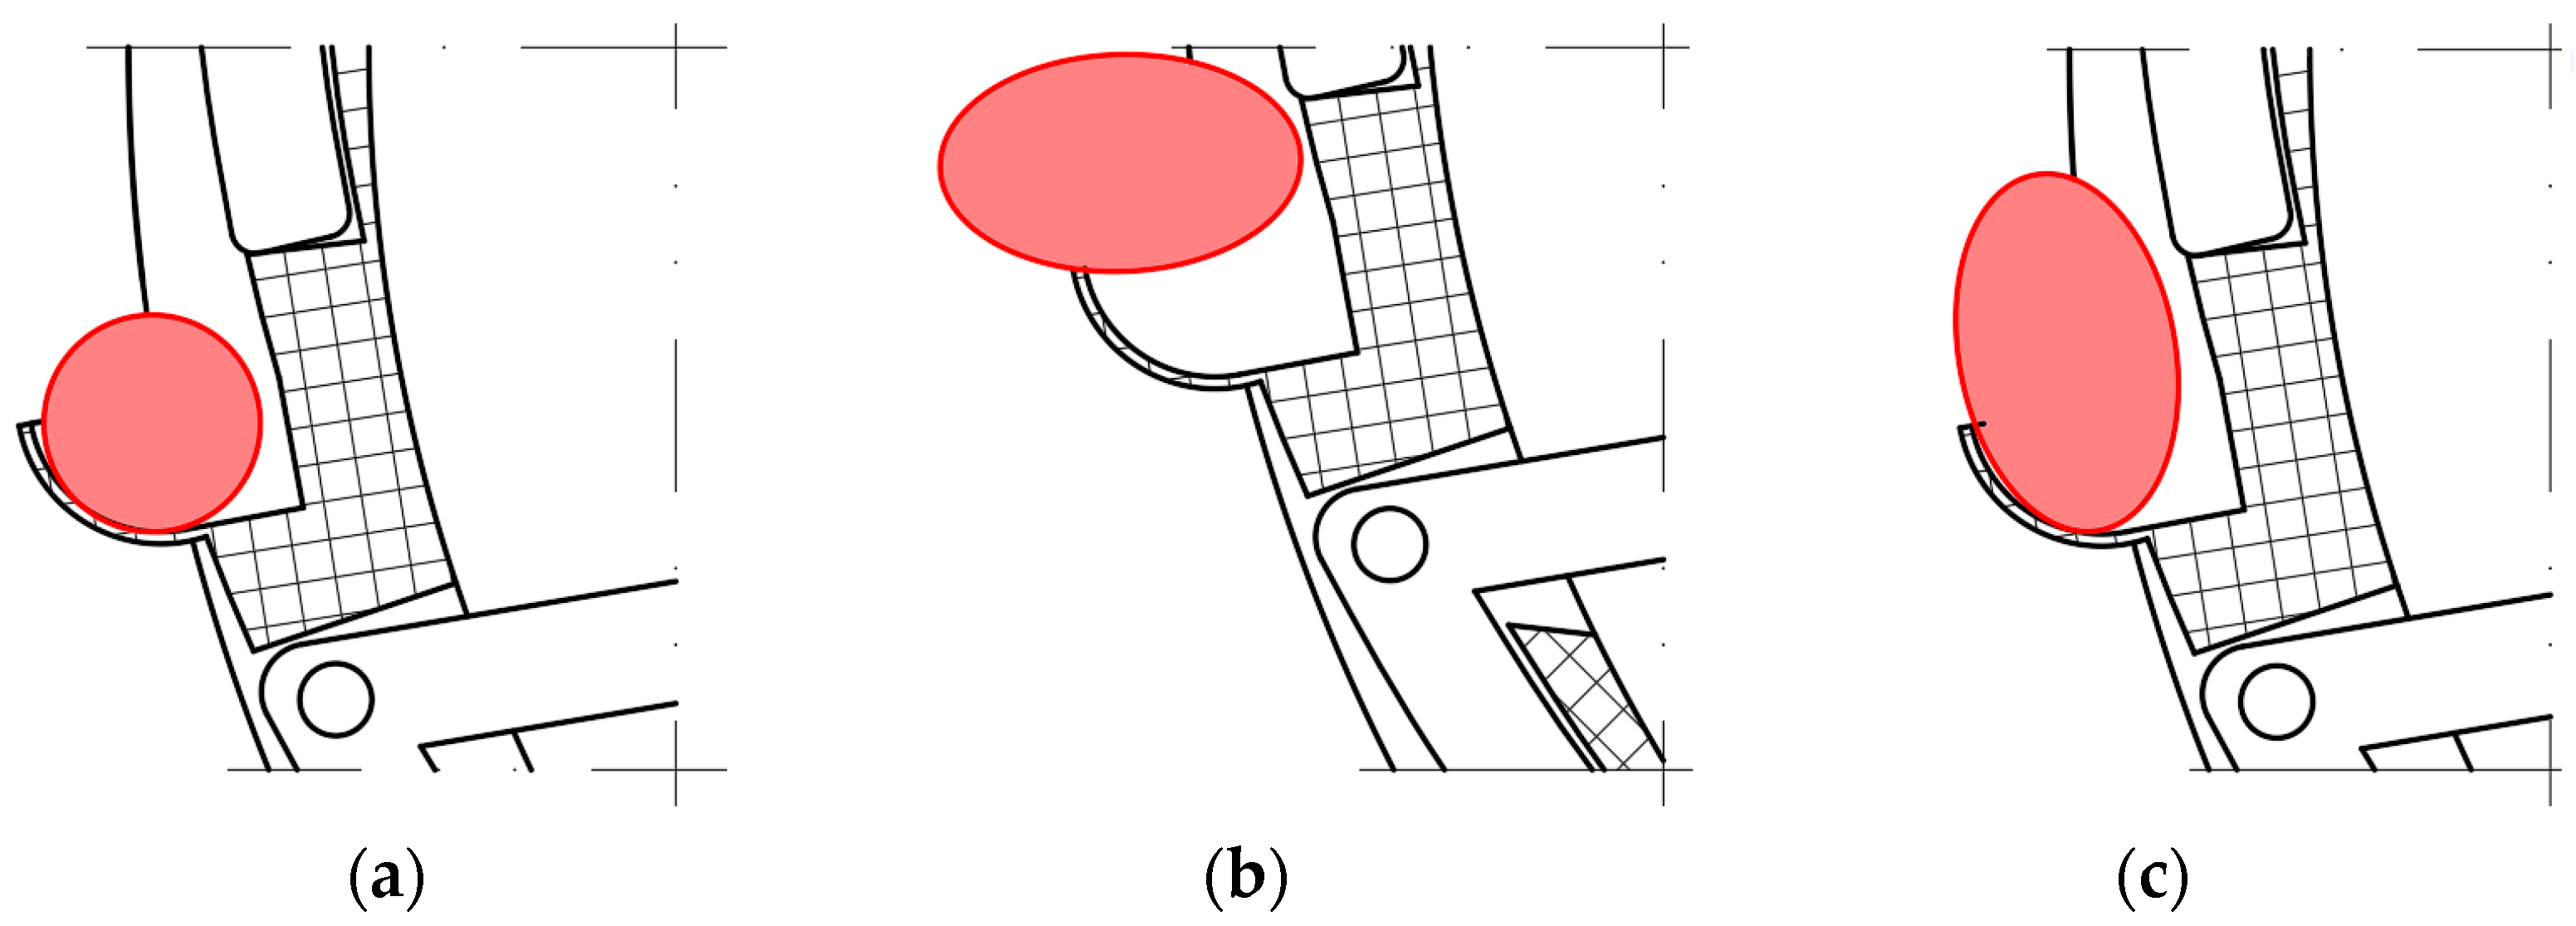
To determine the optimal mounting orientation of the type hole on the seeding disc, it is necessary to analyze the posture of peanut seeds within the type hole. As peanut seeds are predominantly ellipsoidal, they typically assume one of three postures upon entering the type hole: flat-lying, side-lying, or upright [15], as illustrated in Figure 5. According to the principle of minimum potential energy and the postures shown in Figure 5, the flat-lying orientation is the most stable configuration for peanut seeds within the type hole. Furthermore, when a semi-ellipsoid is sectioned along its long axis, the resulting cross-sectional area is significantly larger than that obtained from sectioning along the short axis. A larger cross-sectional area increases the contact probability between the type hole and the surrounding seeds in the seed chamber. Based on this analysis, the type hole is recommended to be oriented such that the long axis of the semi-ellipsoid is aligned with the cutting direction, which corresponds to the configuration shown in Figure 4b, where the short axis of the long semi-ellipsoidal type hole is aligned with the radial direction of the seeding disc.
Analysis of the Number of Type Holes
To ensure that the seeding mass of the cam-swing link precision metering device matches the planting mass required by the planter during operation, a relationship equation between the seeding mass and the planting mass is established as follows:
Q s = B v m a b Q m = q Z N n 60
where Qs represents the planting mass of the planter (seeds/s), B represents the working width of the planter (m), vm represents the operating speed of the planter (m·s−1), a represents the average plant spacing (m), b represents the row spacing (m), Qm represents the seeding mass (seeds/s), q represents the number of seeds filled into a single type hole, Z represents the number of type holes on the seeding disc, N represents the number of metering devices, and n represents the rotational speed of the seeding disc (rpm).
Assuming the planting mass of the planter is equal to the total seeding mass of the metering device, the required number of type holes can be derived from Equation (2) as follows:
Z = 60 B v m a b q N n
According to Equation (3), the number of type holes on the seeding disc is directly proportional to the working width and operating speed of the planter and inversely proportional to the average plant spacing, row spacing, the number of seeds per type hole, and the rotational speed of the seeding disc. Currently, peanut planters in China that support plastic film mulching with hole punching operate at speeds ranging from 2 to 6 km·h−1, with a planting mass of approximately 220–300 kg·ha−1. For a representative scenario where the planter has a working width of 2 m, plants 4 rows per pass with 500 mm average row spacing, an average plant spacing of 135–155 mm [16], one seed per type hole (q = 1), four metering devices (N = 4), and a rotational speed of the seeding disc of 10–40 rpm, the calculated number of type holes using Equation (3) ranges from 5 to 74. To reduce the risk of seed damage caused by excessive continuous agitation from too many type holes, and to avoid difficulties in timely seed clearing, the final number of type holes on the seeding disc is set to 10.
Curve Design of the Seed-Guiding Groove
The seed-guiding groove directs seeds into the type holes, providing a pre-filling effect that enhances the seed-filling performance of the metering device [17]. The motion of peanut seeds entering the type holes is a compound trajectory composed of linear and rotational movements. An Archimedean spiral describes the path of a particle that moves away from a fixed point at a uniform linear speed while simultaneously rotating around the point at a constant angular velocity. Therefore, the seed-guiding groove was designed based on the Archimedean spiral. Its polar coordinate equation is expressed as follows:
r = r o + e β
where ro represents the polar radius when β = 0° (mm), e represents the Archimedean spiral coefficient (mm·rad−1), and β represents the polar angle (rad).
The equation can be converted into cartesian coordinates as follows:
x = r o + e β cos β y = r o + e β sin β
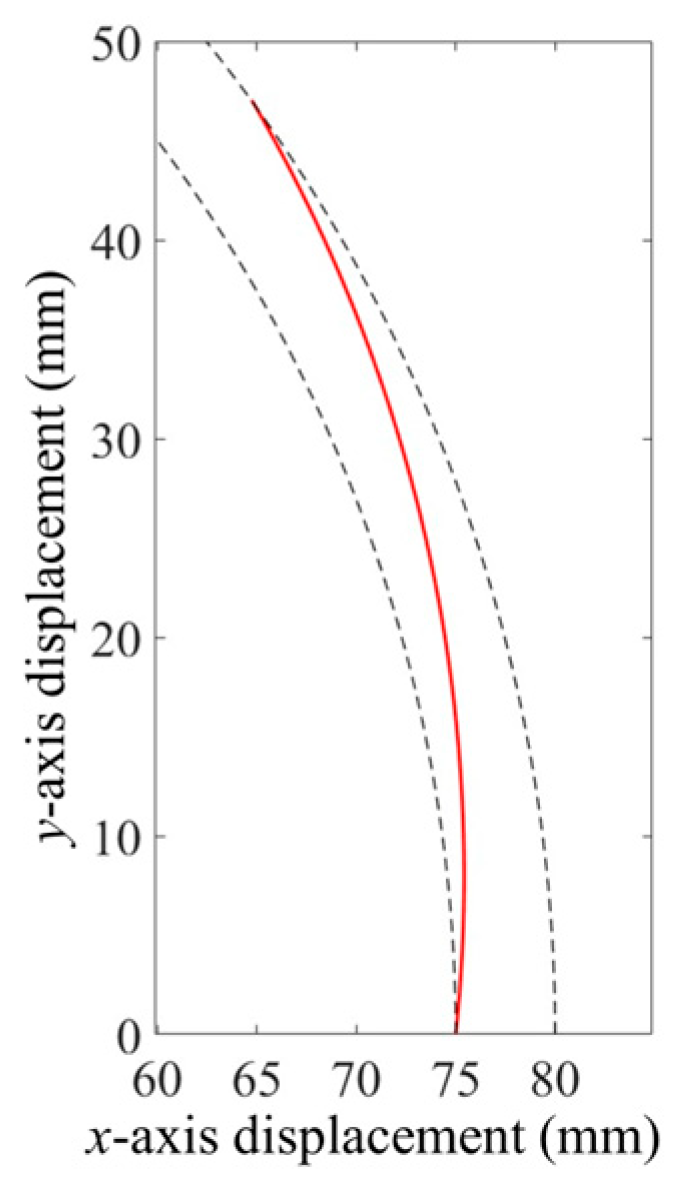
Based on the overall structure and size of the metering device, the groove trajectory was generated in MATLAB R2023b using the following parameters: disc diameter of 160 mm [18], initial polar radius of 75 mm, spiral coefficient e defined as 25·π−1, and polar angle range from 0 to π·5−1. The resulting baseline of the seed-guiding groove is shown in Figure 6, where the dashed lines represent the outer contour of the seeding disc and the circular path at the base of the type holes.

2.3.2. Design of the Cam-Swing Link Mechanism

The cam-swing link mechanism is designed to coordinate with the type holes during the seed clearing phase, forming a seed-holding space, and to release the constraint on the seeds during the seed-delivery phase, ensuring smooth discharge. The cam-swing link mechanism can improve seed flowability and control the movement trajectory of peanut seeds in the stages of seed filling, cleaning, carrying, and delivering. This mechanism primarily consists of the swing link, cam, swing link shaft, and main shaft. Its structural configuration is illustrated in Figure 7.
Analysis of Base Circle Diameter
Once the cam profile and the motion law of the follower are defined, a larger base circle radius results in a smaller pressure angle, thereby improving the force transmission characteristics of the mechanism. However, increasing the base circle radius also leads to a larger overall size and greater mass of the cam-swing link mechanism. Therefore, the selection of the base circle diameter must comprehensively account for the pressure angle and the structural form of the follower, as well as the cam’s structural integrity and strength requirements. Since the cam mechanism is installed inside the seeding disc, its base circle diameter must be compatible with both the seeding disc diameter and shaft diameter. Considering these constraints, the base circle diameter of the cam is set at 60 mm.
Motion Law of the Swing Link and Cam Profile Analysis
During operation, different working zones of the metering device correspond to specific angular segments of the cam: the seed-filling zone corresponds to the near-dwell arc of the cam, the seed-clearing zone corresponds to the rise arc, the seed-carrying zone corresponds to the far-dwell arc, and the seed-delivering zone corresponds to the return arc. The cam’s working zone segmentation is illustrated in Figure 9, where δ4 represents the near-dwell angle, δ1 represents the rise angle, δ2 represents the far-dwell angle, and δ3 represents the return angle.
To ensure that excess seeds can fall back into the seed chamber during the seed-clearing phase, the rise angle δ1 is set to 60°, measured clockwise from the horizontal axis. During the seed-dropping phase, it is necessary to control the seed release position such that the seed enters the guide channel and duckbill mechanism along the shortest possible path. To achieve this, the swing link must move rapidly, which requires the cam return angle to be relatively small. To ensure the continuity of the cam profile and maintain stability during the seed-carrying phase, the return angle δ3 is set to 30°, with 0° defined as the horizontal direction, and angles measured in the counterclockwise direction. The near-dwell angle and far-dwell angle of the cam can be derived based on the rise angle, return angle, and the initial angular position. The calculated results yield a near-dwell angle δ4 of 180° and a far-dwell angle δ2 of 90°. To allow the tip of the swing link to coordinate with the type hole and form a seed-holding space, the maximum swing angle of the rod is set to 15°, based on the swing link position, tip thickness, and upper segment length.
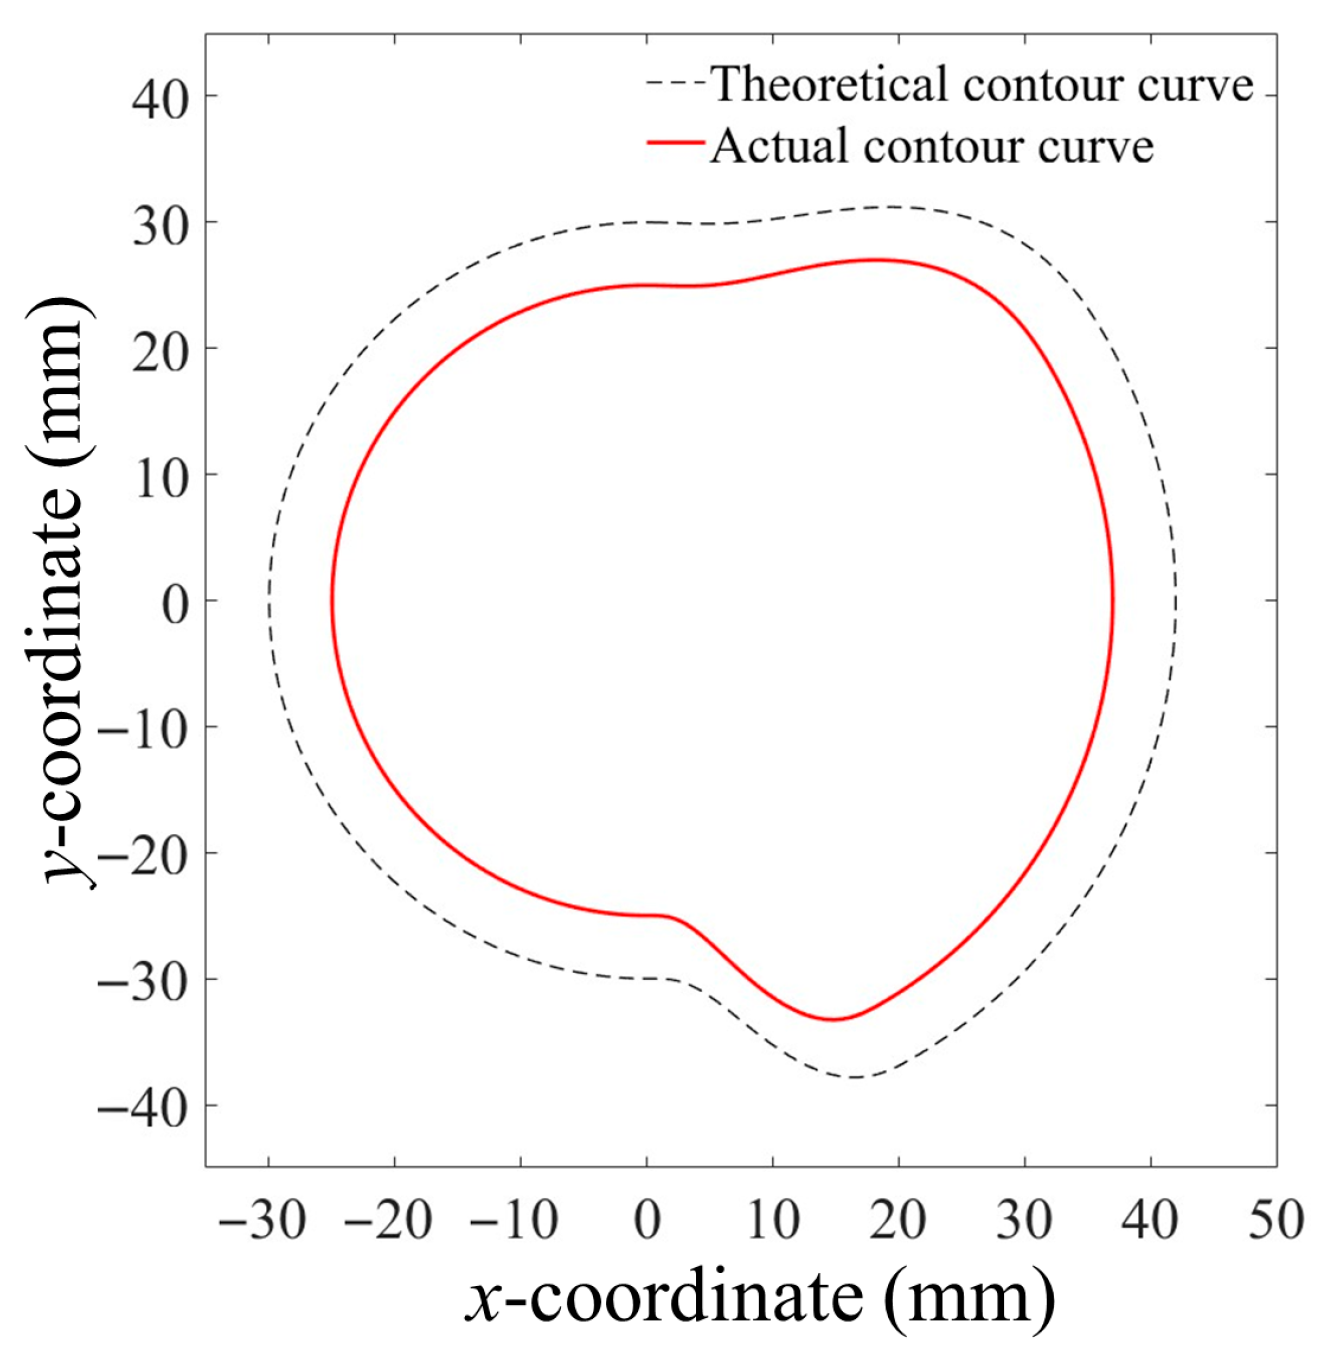
Given the motion law of the swing link and initial cam design parameters, the theoretical cam profile and actual cam profile are obtained using an analytical method. The actual cam profile is derived by subtracting the roller radius from the normal direction of the theoretical profile. The coordinate equation of the theoretical cam profile is expressed as follows [19]:
x = a l sin δ l sin δ + φ + φ o y = a l cos δ l cos δ + φ + φ o
where (x, y) are the coordinates of a point on the theoretical cam profile, al is the distance between the cam center and the swing link pivot center (mm), l is the length of the swing link (mm), δ is the cam rotation angle (°), φ is the swing angle of the rod (°), and φo is the initial swing angle of the rod (°).
Based on the parameters of the cam-swing link mechanism, when the distance between the cam center and the swing link rotation center is 76 mm, the length of the swing link is 50 mm, the swing angle of the rod is 15°, and the initial swing angle is 14°, the theoretical and actual cam profiles can be obtained from Equation (6), as illustrated in Figure 10.

2.3.3. Analysis of Factors Influencing Seed-Filling Performance

During operation, the seed cluster within the seed chamber is disturbed by the protruding type holes on the seeding disc, disrupting the static equilibrium of the seed cluster and forming a disturbance zone around the type holes [20]. For seeds located within the disturbed layer of the seed chamber, as the rotational speed of the seeding disc increases from 10 to 40 rpm, continuous disturbance leads to greater dispersion among the seeds and increased inter-seed spacing. This reduces the interaction forces between seeds and enhances overall seed mobility. However, at higher seeding rotational disc speeds, the contact duration between seeds and the type holes becomes shorter, thereby increasing the likelihood of underfilled type holes. Therefore, the seeding disc’s rotational speed is a key parameter affecting seed-filling performance.
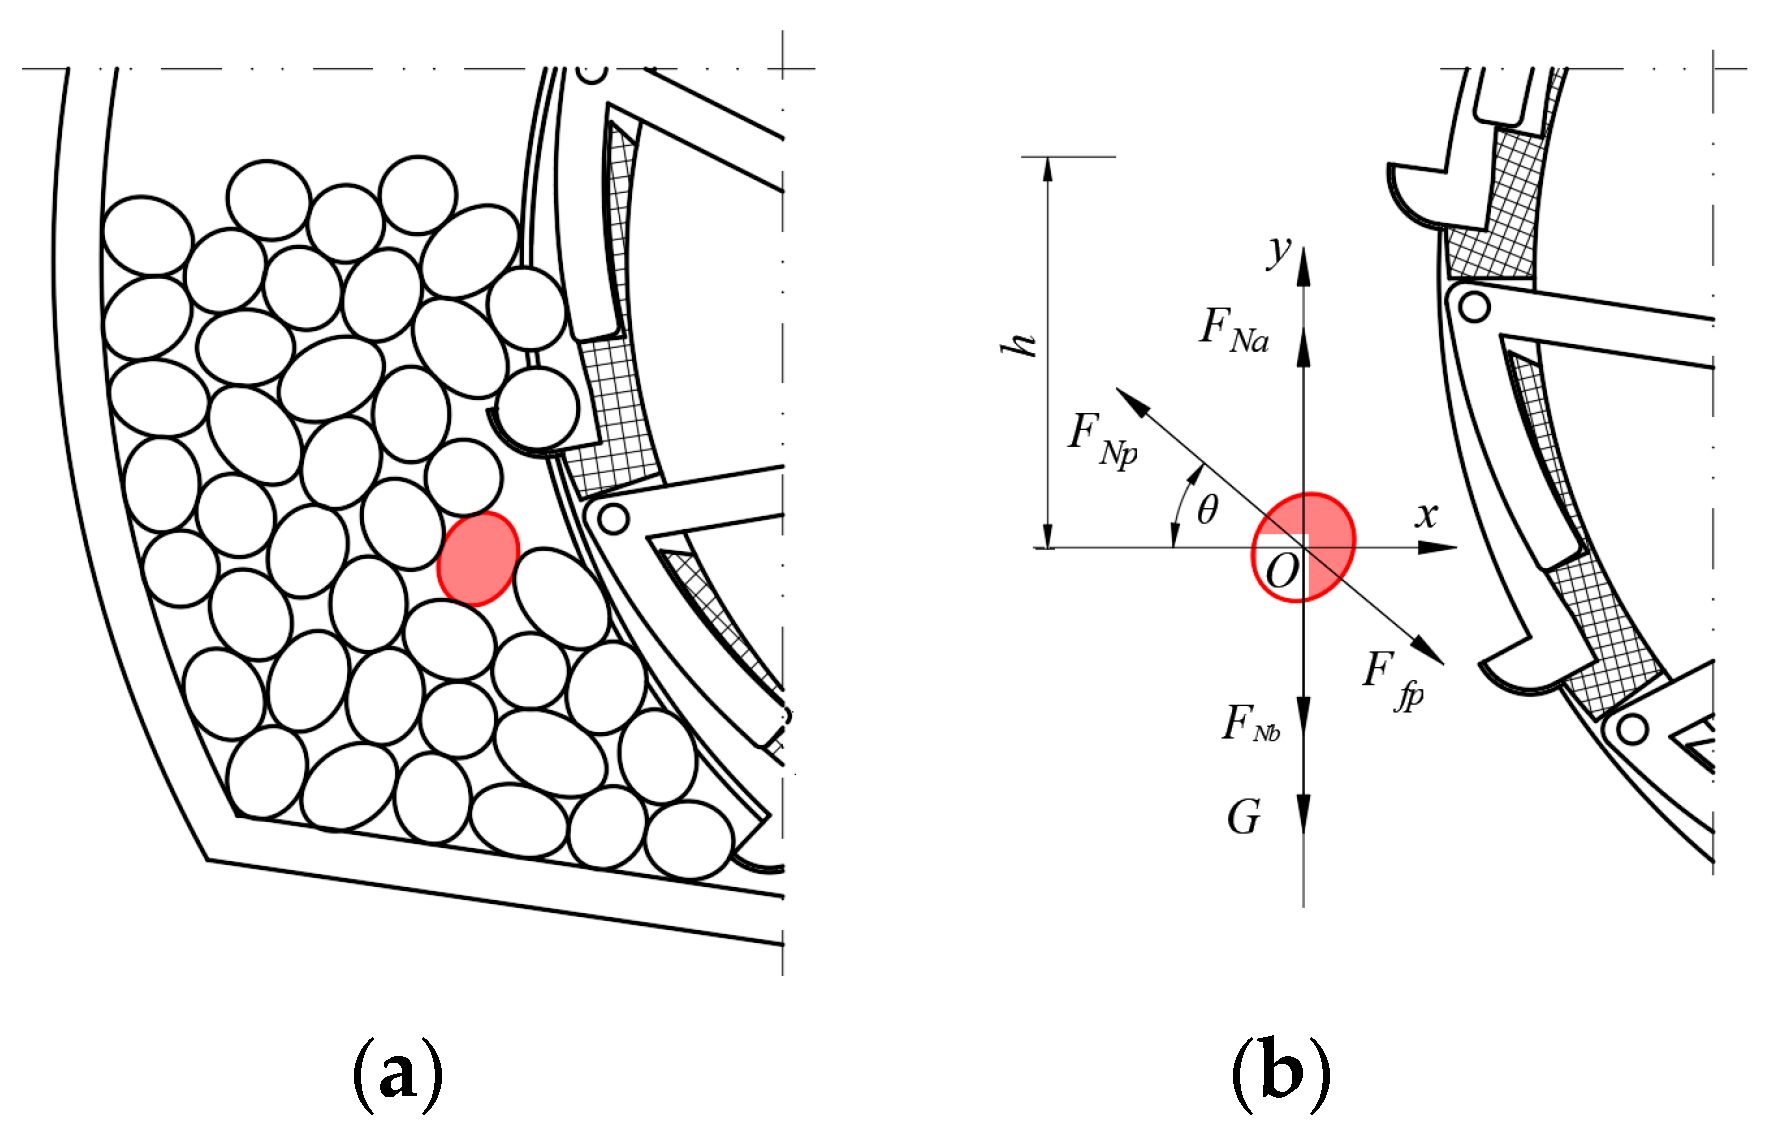
To investigate the influencing factors governing seed motion within the disturbed layer, an analysis was conducted on seeds located at a vertical depth h beneath the surface of the seed cluster. The primary forces acting on each seed include the compressive force FNb from overlying seeds, the support force FNa from underlying seeds, the frictional resistance Ffp between seed layers, the gravitational force G, and the contact force FNp exerted by the type hole. A coordinate system is established with the seed’s center of mass as the origin, the X-axis in the horizontal direction, and the Y-axis in the vertical direction. The selected seed and its corresponding force diagram are shown in Figure 11.
For a seed to be effectively disturbed by the seeding disc, the applied disturbance force must exceed the total resistance acting on the seed, as expressed by the following formula:
F N p + F N a sin θ F f p + G + F N b sin θ
where θ is the angle between the disturbance force and the horizontal direction (°).
During seed motion, the primary frictional resistance within the disturbed layer arises from the contact between the moving seed and the adjacent seeds above and below it. The total frictional resistance Ffp in the seed cluster can be expressed as follows:
F f p = μ F N b + F N b cos θ
where μ is the coefficient of friction between peanut seeds.
Assuming each seed layer in the seed chamber has a uniform thickness and that seed mass is evenly distributed, the compressive force FNb from the upper seed layer and the support force FNa from the lower layer can be described as follows:
F N b = G h l p F N a = F N b + G
where lp is the thickness of a single seed layer in the chamber (m).
Based on Equations (7)–(9), it can be derived that
F N p 2 h l p + 1 μ G sin θ
According to Equation (8) through (10), the frictional resistance acting on an individual peanut seed is primarily influenced by the vertical depth of the seed layer. The deeper a seed is located within the seed cluster, the greater the frictional resistance it encounters from surrounding seeds, and thus the greater the disturbance force required to initiate motion. As a result, the vertical distance h between a seed within the disturbed layer and the seed surface is a key operational parameter affecting seed-filling performance.

2.4. DEM Simulation of the Effect of Type Hole Installation Positions on Seed Cluster Disturbance

To investigate the influence of the protrusion height of type holes on seed cluster disturbance within the seed chamber, DEM simulations were performed using three installation configurations of the type holes on the seeding disc: fully protruding, partially protruding, and non-protruding. The average kinetic energy of seeds within the chamber was used as the evaluation metric for seed cluster disturbance, based on which the optimal type hole configuration was identified.
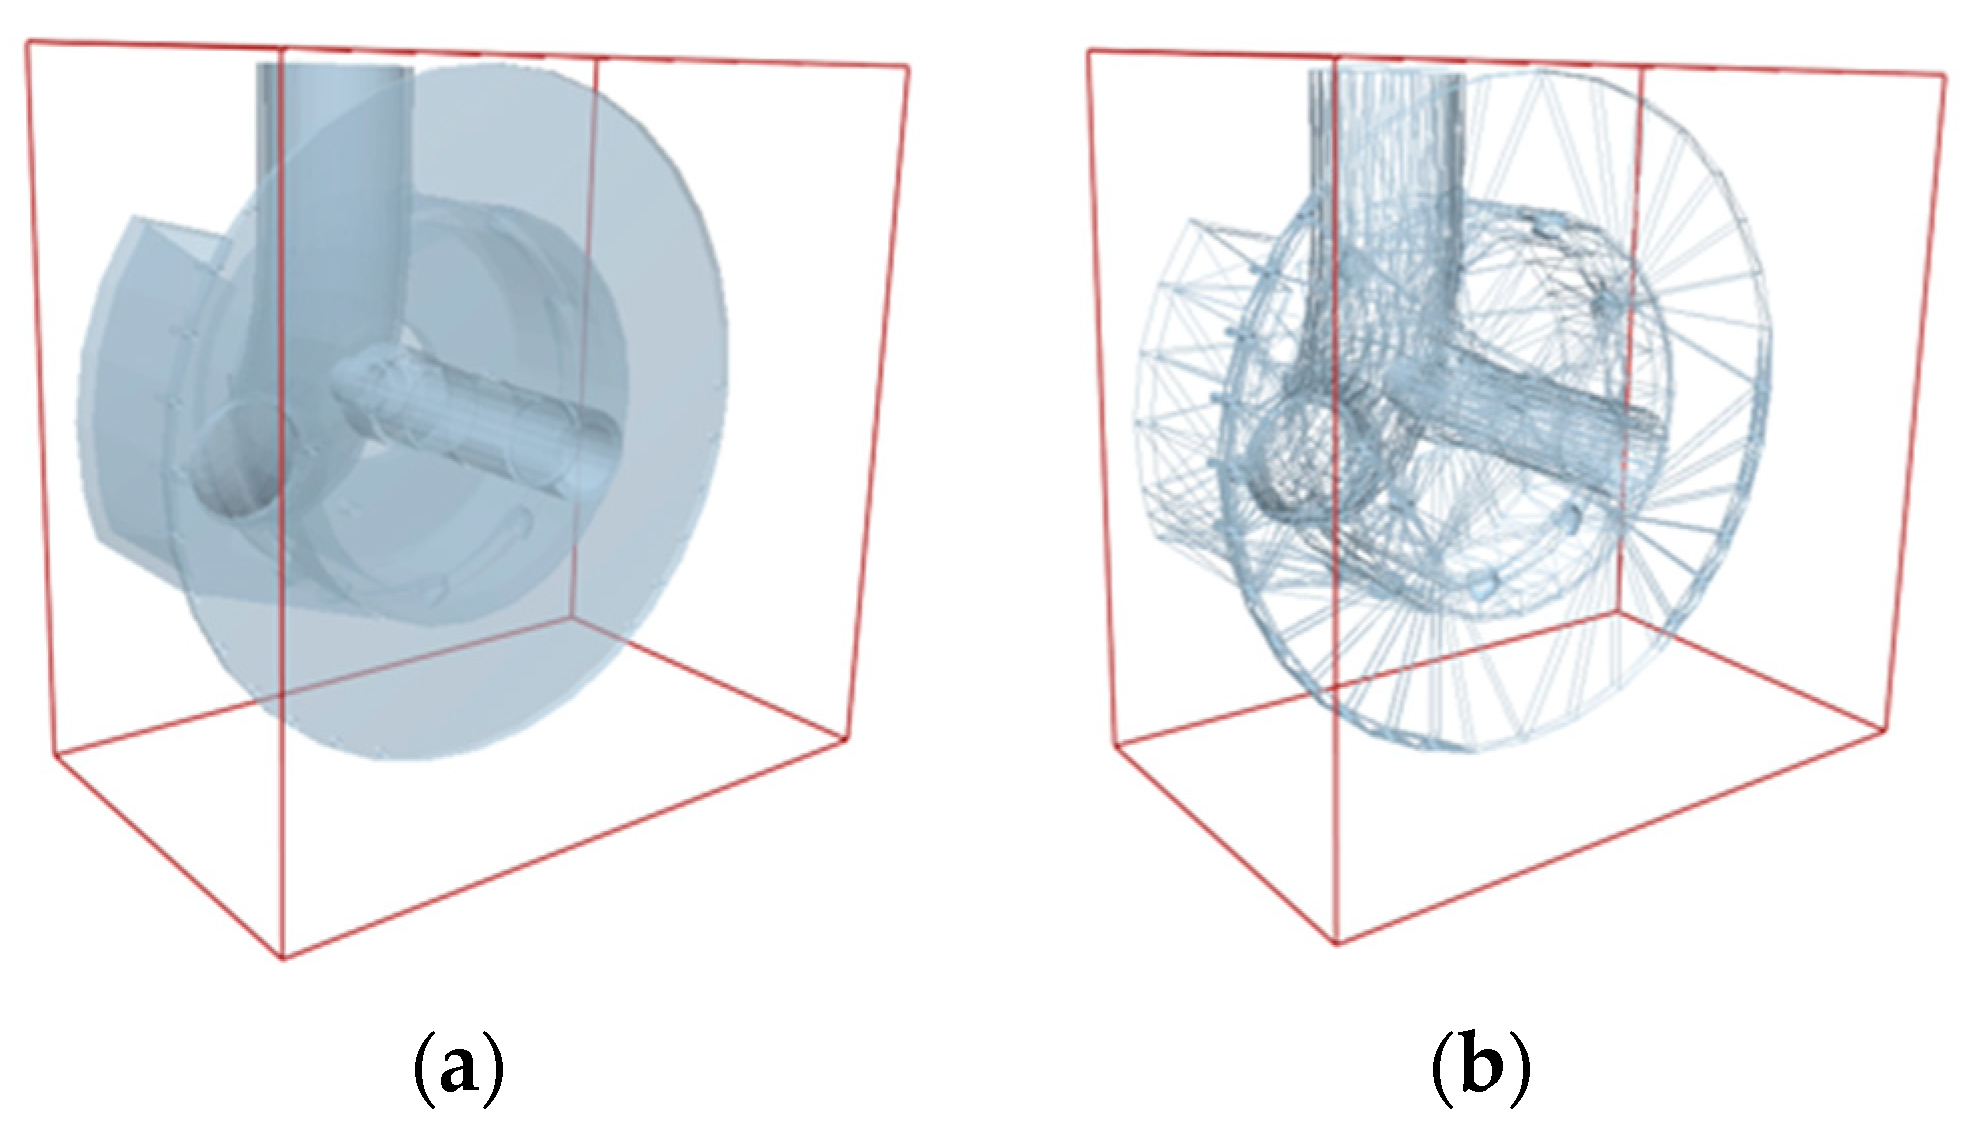
To improve simulation efficiency, the model was simplified by retaining only the seed inlet pipe, fixed disc, central shaft, and seeding disc. The simplified geometry was saved in .stp format and imported into the preprocessing module of EDEM 2018. A particle factory was defined above the inlet pipe to allow seeds to fall freely into the chamber. The simulation model is shown in Figure 12.
Based on the size and morphology of peanut seeds, three representative shapes were selected for 3D modeling, corresponding to elongated ellipsoidal, flat ellipsoidal, and near-spherical forms. A digital camera was used to capture orthographic images of the seeds from three views. The outer profiles were extracted using Photoshop and then imported into SolidWorks 2023. Spline curves were used to sketch the seed outlines, which were filled using Bezier surfaces. By adjusting the control points, the curves and surfaces were refined to match the actual sizes and shapes of the seeds as closely as possible. The completed 3D models were saved in .step format and imported into EDEM, where a multi-sphere filling method was applied to generate the discrete element simulation models. The modeling results are shown in Figure 13. According to the volume of the seed chamber and the bulk density of peanut seeds, a total of 300 seeds were simulated, including 141 elongated ellipsoidal seeds, 108 flat ellipsoidal seeds, and 51 near-spherical seeds. The Hertz–Mindlin (no slip) contact model was used to simulate interactions between seeds and between seeds and the metering device. The seed inlet pipe, seed chamber, and seeding disc were modeled using photosensitive resin, while the stationary disc was modeled using acrylic. The simulation parameters are provided in Table 1 [14].
The total simulation time was set to 10 s, with a time step of 1 × 10⁻⁵ s and a mesh size defined as 10 Rmin. The rotational speed of the seeding disc was set to 25 rpm to allow seeds to fall freely into the chamber. To investigate the disturbance effect of different seeding disc configurations on the seed cluster inside the chamber, the average kinetic energy of the seed cluster was analyzed under the condition where seed movement was driven solely by the interaction with the seeding disc. The variation in average kinetic energy from 1 to 6 s was examined for the three installation positions of type holes.

2.5. MBD–DEM Coupling Simulation of Seeding Performance

The model was saved in .step format and imported into Adams. Fixed joints were added between the shaft, cam, fixed disc, and ground [21]. A revolute joint was defined between the seeding disc and the cam, and a rotational joint with a torsion spring was added between the swing link and the seeding disc. The stiffness coefficient of the torsion spring was set to 15 N/°. Solid contact was established between the swing link and the cam, using the impact contact method. The total simulation time was set to 10 s with a step size of 0.01. Since force transmission occurs between particles and geometric bodies in the simulation, applied forces were added in Adams. For each component, a general force was defined. The force source was set to subroutine, and the program source was designated as ACSI Adams. After all the general forces were applied, the file was exported as an Adams Solver Dataset for use as a coupling motion control file.
In the simulation analysis of the seeding process, the saved .step format model was imported into EDEM. Components requiring connection were merged using the Merge Geometry function to ensure consistency with the structural configuration used in Adams. The contact model was set to Hertz–Mindlin (no slip), and the total number of peanut seeds was set to 300. The simulation time was controlled by Adams, with a time step of 1 × 10⁻⁵ s. The rotational speed of the seeding disc was set to 25 rpm, and the mesh size was defined as 10 Rmin.
The seeding performance was primarily affected by the rotational speed of the seeding disc and the vertical distance between the seeds in the disturbed layer and those on the surface. Given a fixed seeding disc diameter, this vertical distance could be determined by the wrap angle of the seed cluster and the seeding disc radius. The wrap angle could be adjusted by changing the relative position between the seed chamber and the fixed disc. Therefore, the rotational speed of the seeding disc and the wrap angle of the seed cluster were selected as the independent variables in single-factor simulations. To investigate the effect of the seeding disc rotational speed on seed-filling performance, the wrap angle was fixed at 50°, and the seeding disc rotational speed was varied from 10 to 40 rpm in 5 rpm increments. To investigate the effect of seed cluster pressure on seed-filling performance, the rotational speed of the seeding disc was fixed at 25 rpm, and the wrap angle of the seed cluster was varied from 20° to 70°, with an increment of 12.5° per level. All the other simulation parameters remained consistent with those used in the previous seeding process analysis.

2.6. Bench Test for Optimization of Seeding Performance

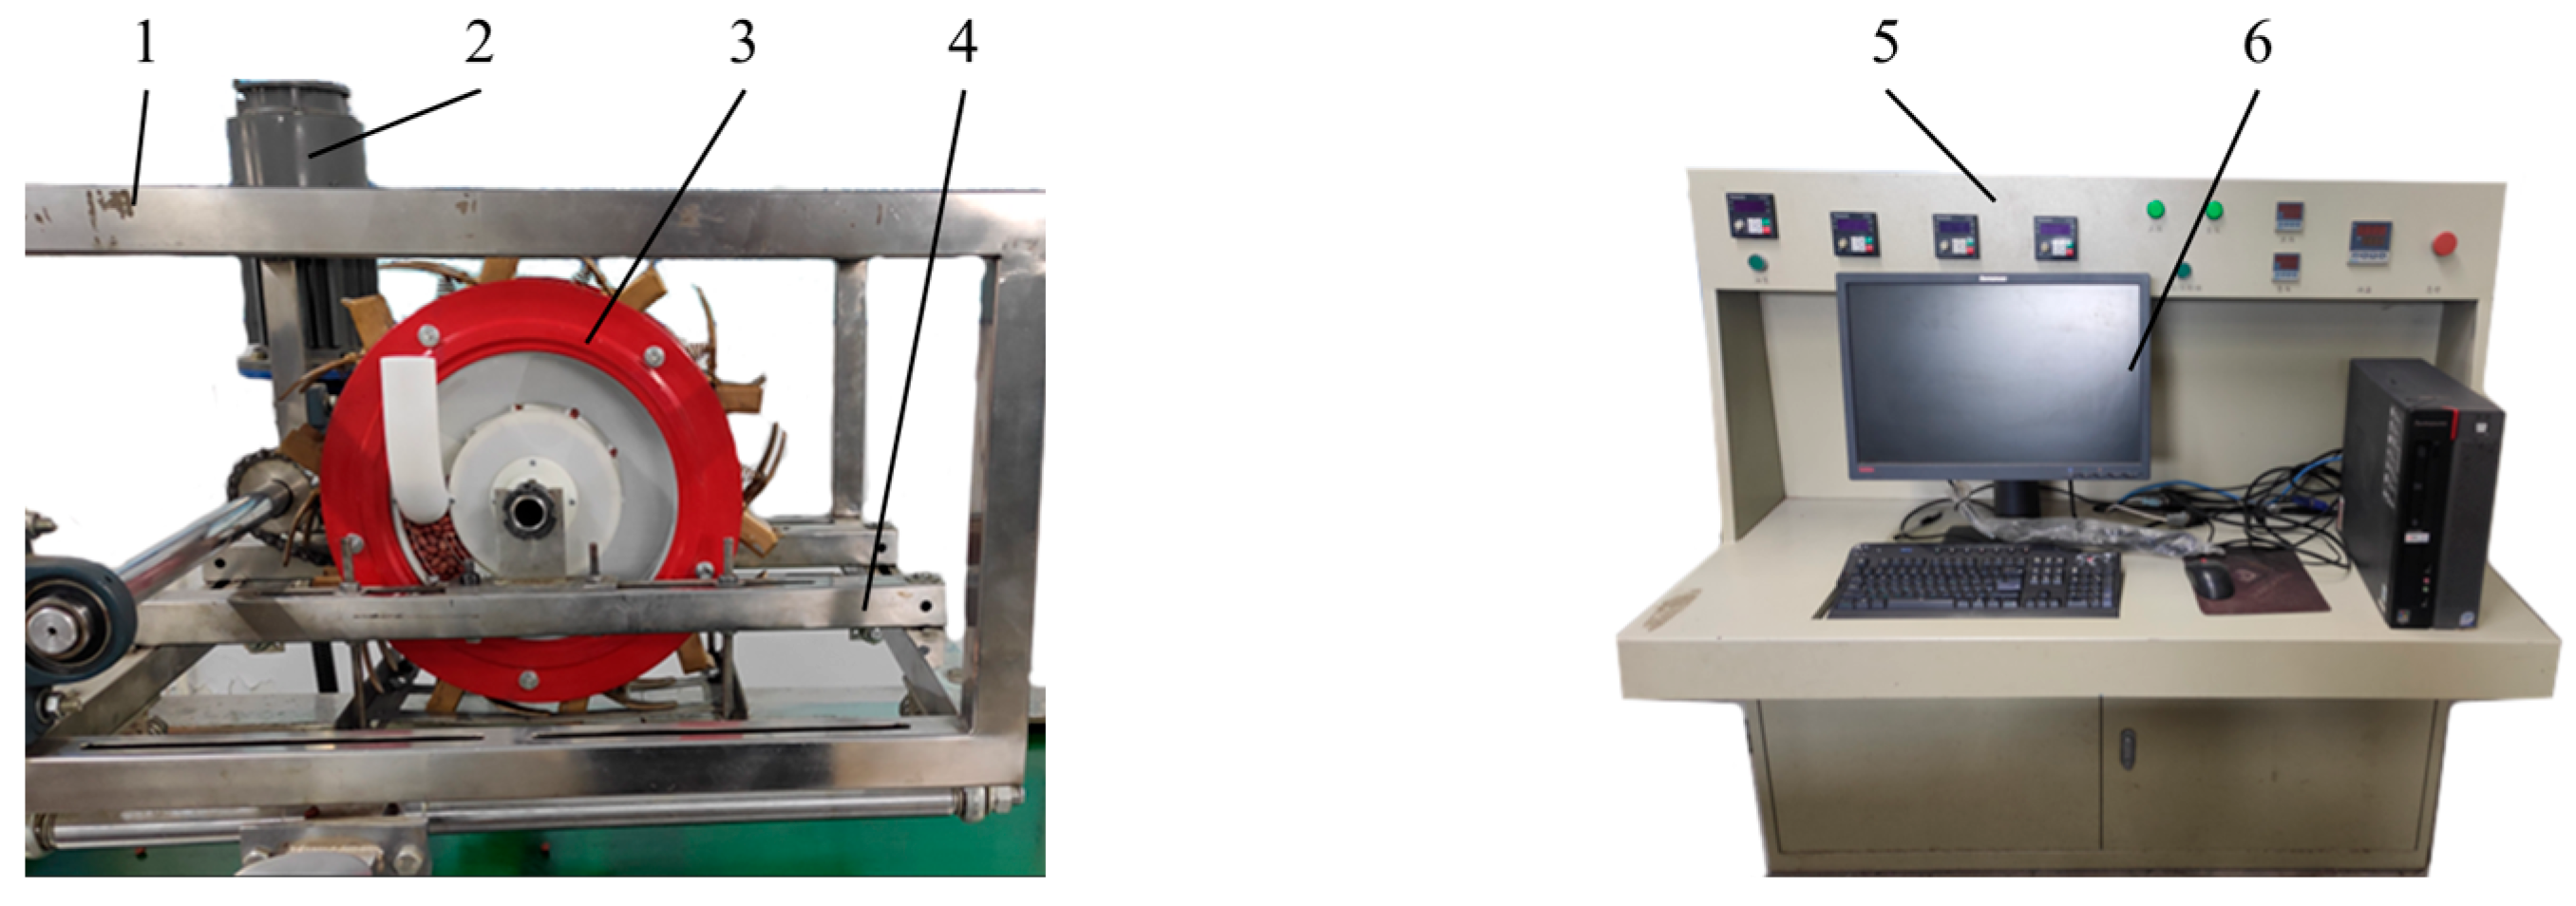
To validate the reliability of the simulation results and to determine the optimal operating parameters of the metering device, a physical test was conducted using a bench setup. The metering device, equipped with components fabricated by 3D printing, such as the seeding disc, seed chamber, and seed-guiding channel, was mounted on a JPS-12 computer vision testing platform for seeding performance. The test apparatus is shown in Figure 14.
The peanut cultivar used in the test was Silihong, with a thousand-seed mass of 525.7 g and an average three-axial size of 14.4 mm × 8.37 mm × 8.02 mm. A second order rotational orthogonal combination experiment was adopted to determine the optimal operating parameter combination. The rotational speed of the seeding disc (X1) and the wrap angle of the seed cluster (X2) were selected as experimental factors. The qualified index (A), the multiples index (D), and the missed index (M) were used as evaluation metrics. During testing, seeds discharged from the outlet of the metering device fell onto the oil belt of the test bench. An image acquisition and processing system was used to automatically measure the seeding performance indicators. Based on the experimental findings regarding the influence of seeding disc rotational speed on seed-filling performance, it was observed that performance was poor at the rotational speed of 10 rpm. Accordingly, the rotational speed range for subsequent tests was set between 15 and 40 rpm. The wrap angle was set in the range of 20 to 70°. Each test was repeated five times. The coding scheme for factor levels is shown in Table 2.

2.7. Field Validation Test of Optimized Operating Parameters for the Metering Device

To evaluate the seeding performance of the cam-swing link precision metering device under optimized parameter settings, a field test was conducted in a peanut test field located in Shihezi City, Xinjiang Uygur Autonomous Region. Prior to testing, the soil compaction was measured at 213 kPa, and the soil moisture content was 7.02%. The operating speed of the seeder was set to 2.15 km·h−1. Under the optimized configuration (seeding disc rotational speed of 26 rpm and a wrap angle of 46°), the peanuts were sown over an area of 0.5 ha. The working width of the planter was 2 m, and it sowed 4 rows per pass. The field operation conditions are shown in Figure 15a, the emergence status 30 days after sowing is shown in Figure 15b, and the growth condition after 150 days is shown in Figure 15c.

3. Results

3.1. Effect of Type Hole Installation Position on Seed Cluster Disturbance

The results showing the influence of three type hole installation positions on the average kinetic energy of seeds are presented in Figure 16. As shown, different installation positions resulted in significant variations in seed cluster disturbance within the seed chamber. Among the configurations, the fully protruding type hole exhibited the strongest disturbance effect on the seeds, whereas the non-protruding type hole showed the weakest effect. Within the time interval from 1.5 to 3 s, seeds in contact with the seeding disc were set in motion due to the drag effect of the type holes and the guiding grooves. This motion was further transmitted to adjacent seeds, thereby affecting the average kinetic energy of the entire seed cluster.
Using the average kinetic energy as the evaluation index for seed disturbance performance, the configuration with fully protruding type holes demonstrated the highest disturbance effectiveness, while the non-protruding type hole configuration showed the weakest performance. When the protrusion height of the type holes corresponded to the fully protruding configuration of the seeding disc, the gap between the bottom groove of the seed chamber and the seeding disc, according to their fit relationship, became greater than the size of the peanut seeds. As a result, seeds inside the seed chamber leaked out of the chamber during operation. When the protrusion height of the type holes corresponded to the partially protruding configuration of the seeding disc, the bottom groove of the disc aligned with the curved seed-guiding groove in a manner that prevented seeds from leaking out of the seed chamber. In this configuration, the average kinetic energy of the seed cluster remained relatively stable, indicating improved seed disturbance within the chamber. Considering both the disturbance effect on the seed cluster and the interaction among the metering device’s components, it was concluded that the partially protruding configuration provided better seed-filling performance.

3.2. Seeding Performance Based on MBD–DEM Coupling Simulation

3.2.1. Seed Trajectory During the Seeding Process

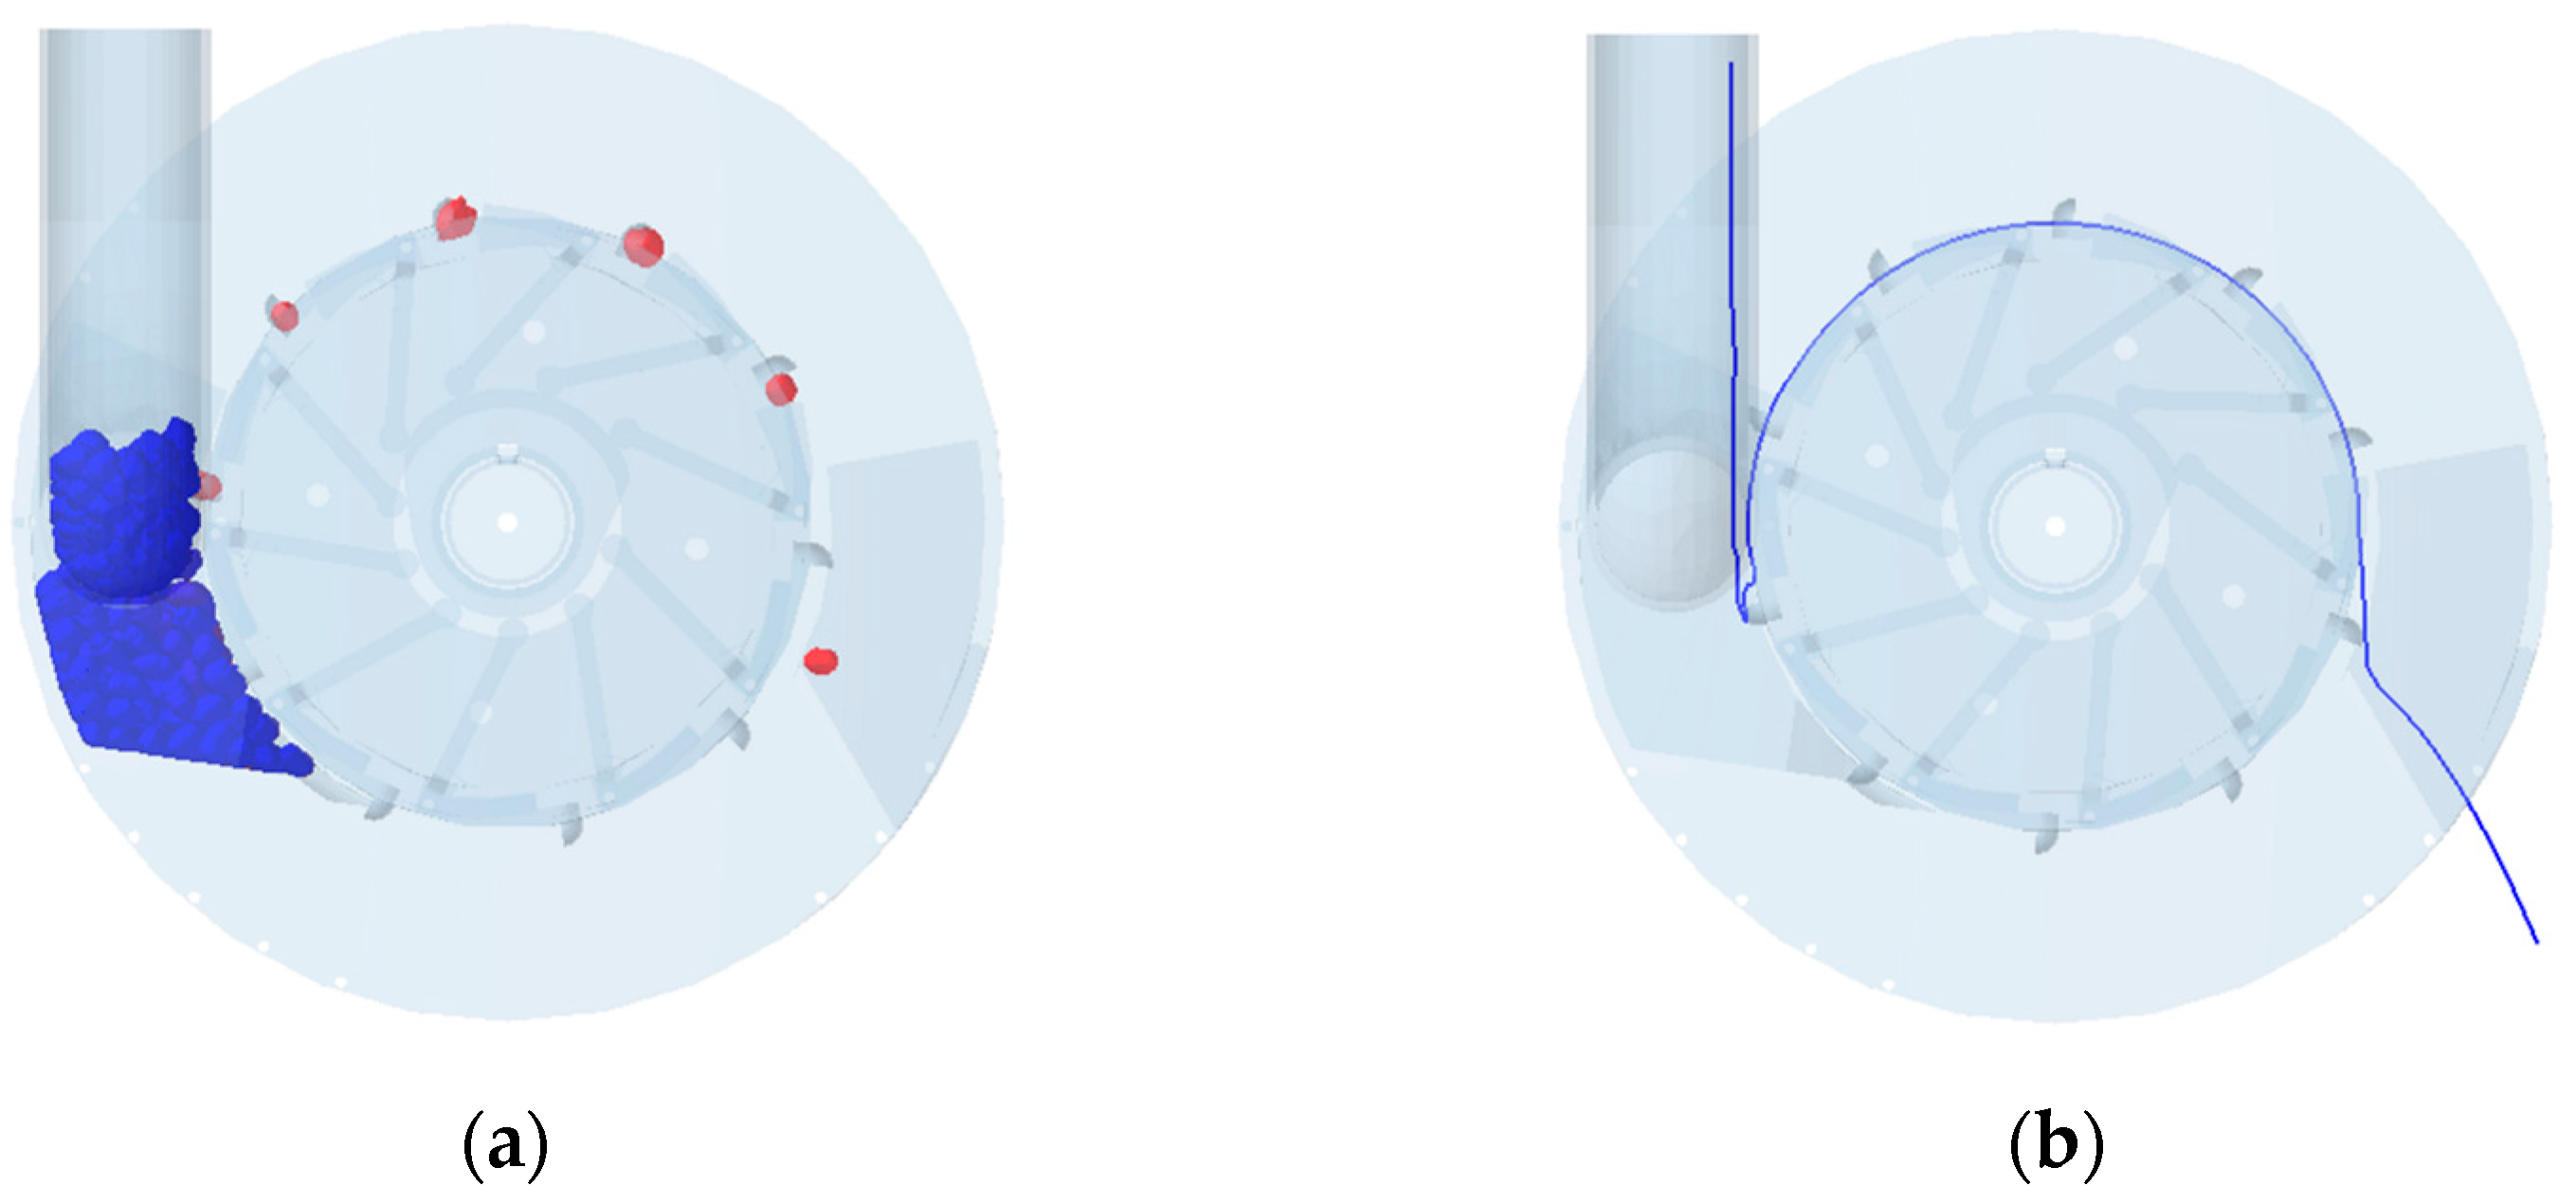
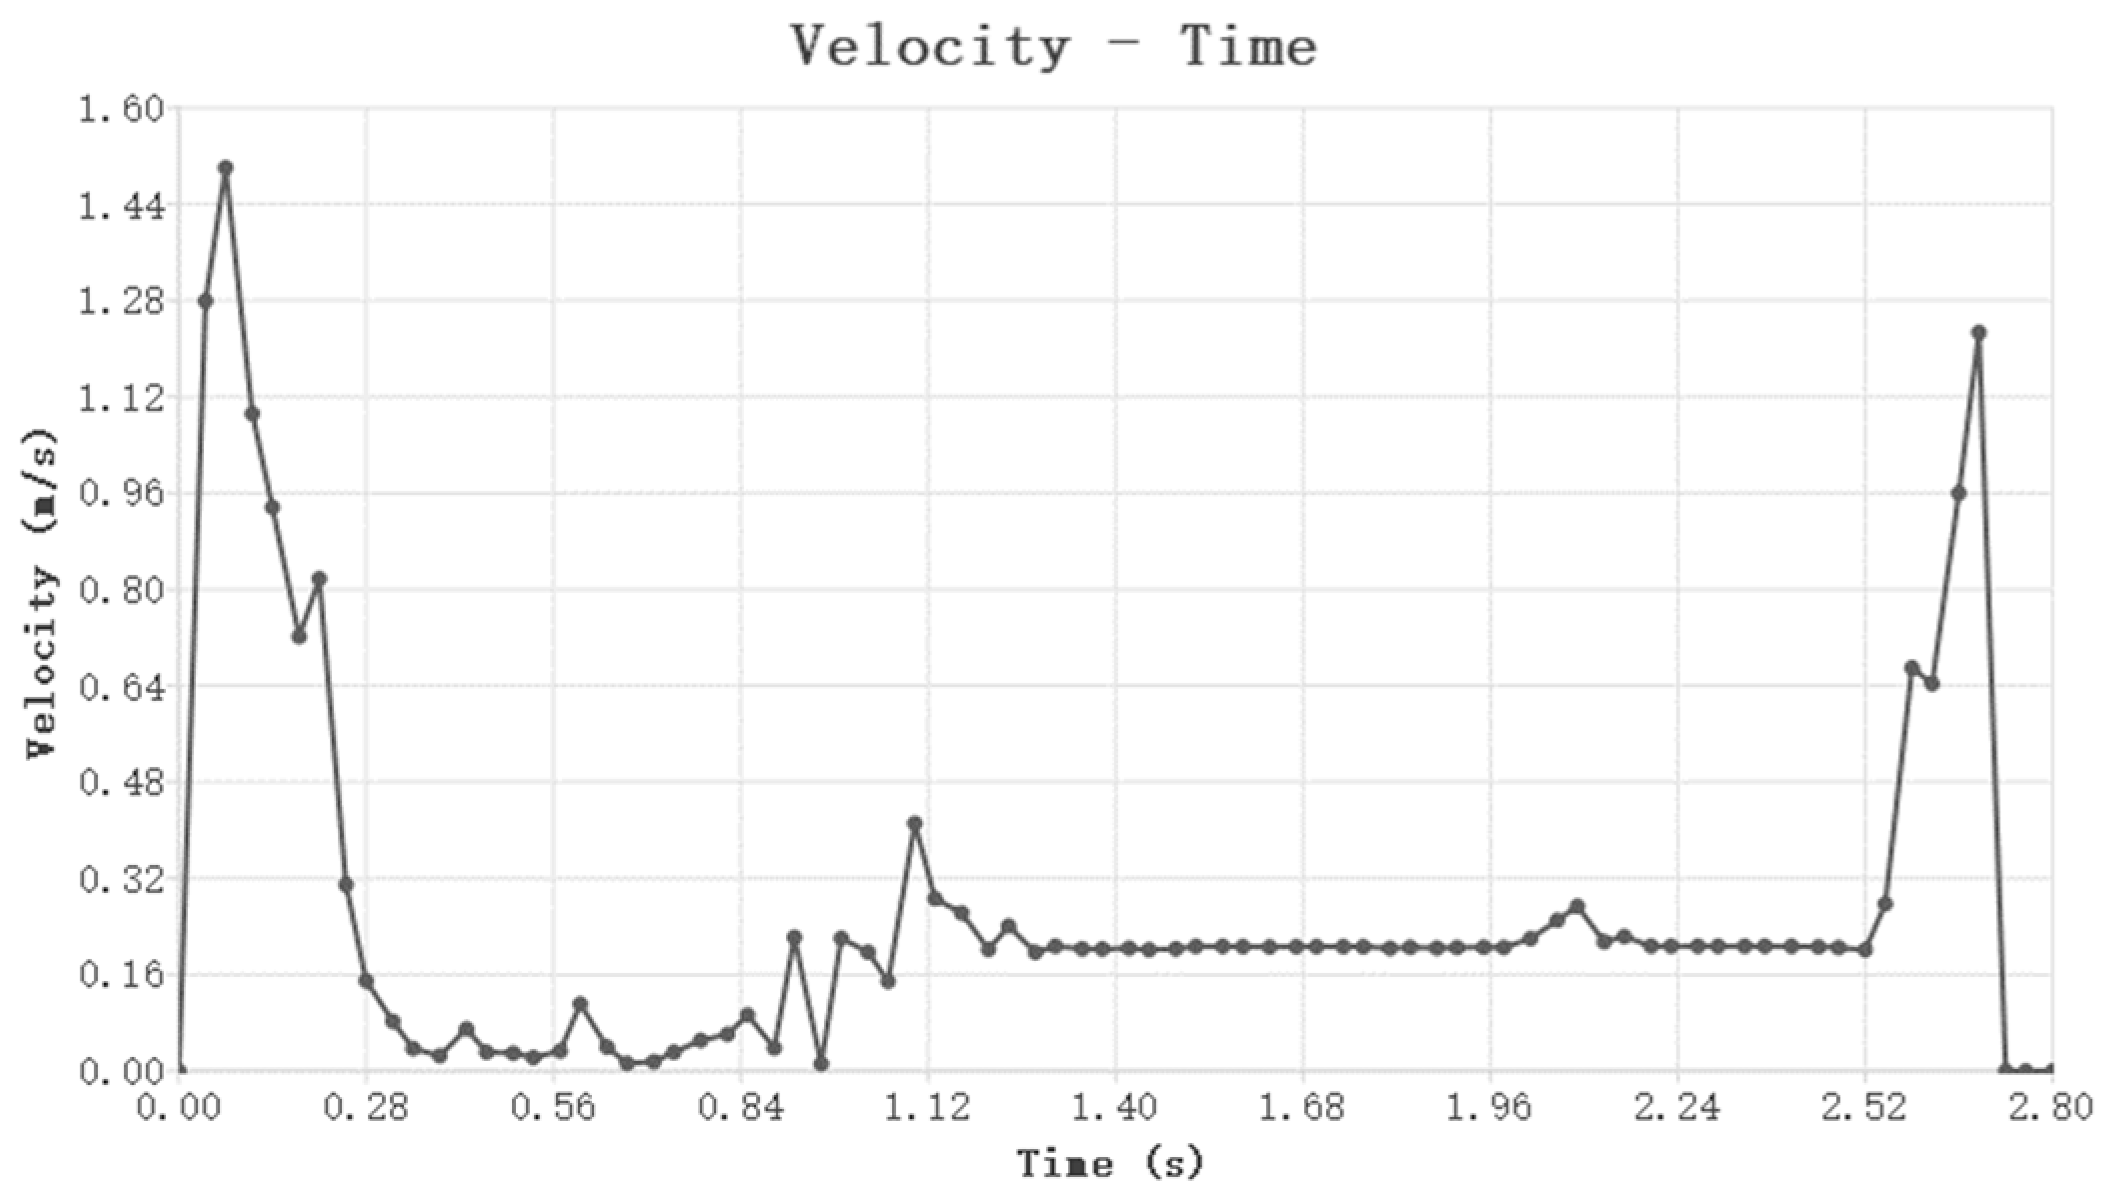
The spatial relationship between the peanut seed and the metering device during the seeding process is illustrated in Figure 17a. The motion trajectory of a single seed is shown in Figure 17b, while the corresponding variation in seed velocity over time is presented in Figure 18.
Based on Figure 17b and Figure 18, it can be observed that the seed entered the seed chamber through the inlet pipe between 0 and 0.5 s. From 0.5 to 1.1 s, the seed underwent the filling phase, during which it was disturbed by the type hole, resulting in significant velocity fluctuations. Between 1.1 and 2.5 s, the seed entered the carrying phase, rotating with the seeding disc. During this period, the seed velocity remained relatively stable, with a notable change occurring around 2.0 s when the seed passed the limit position and, under the influence of gravity, shifted from being in contact with the type hole to contacting the end of the swing link. At 2.5 s, seed delivery occurred as the seed underwent free fall and its velocity increased. The seed trajectory and velocity variation confirmed that the combination of the type hole and cam-swing link mechanism effectively enabled stable seed carrying and precise seed delivery.

3.2.2. Effects of Seeding Disc Rotational Speed and Seed Cluster Wrap Angle on Seeding Performance

Figure 19 shows the number of seeds delivered into the type holes under different filling conditions. Table 3 presents the seeding performance under various disc rotational speeds. As shown in Figure 19, the filling status of the type holes could be categorized into three conditions: single-seed filling, multiple seed filling, and empty holes. The single-seed filling corresponds to the qualified index, multiple seed filling corresponds to the multiples index, and empty holes correspond to the missed index. As shown in Table 3, when the wrap angle was held constant, increasing the seeding disc rotational speed from 10 to 40 rpm led to an initial increase, followed by a decrease in the qualified index. The multiples index generally showed a decreasing trend, while the missed index first decreased and then increased. At a seeding disc rotational speed of 10 rpm, the type holes disturbed the peanut seeds at a relatively low frequency, resulting in a lower qualified index and a higher missed index. As the seeding disc rotational speed increased, the seed cluster in the chamber experienced more frequent disturbance from the type holes, improving seed mobility and increasing the likelihood of seeds entering the holes. However, when the seeding disc rotational speed became too high, the contact time between the seeds and the type holes was reduced, making it more difficult for seeds to be successfully filled. Therefore, with increasing seeding disc rotational speed, the qualified index initially increased and then decreased, while the missed index first decreased and then increased. When the seeding disc rotational speed reached 25 rpm, the qualified index reached its peak at 87.1%, indicating the best overall seeding performance.
Table 4 presents the seeding performance under different wrap angles. As shown in the table, when the seeding disc rotational speed remained constant, increasing the wrap angle from 20° to 70° led to a gradual rise and then a decline in the qualified index, while the missed index consistently decreased. When the wrap angle was small, the contact time between the seeds and the type holes, as well as the guiding grooves was short, resulting in reduced filling time and a relatively high missed index. As the wrap angle increased, the seeds remained in contact with the type holes and guiding grooves for a longer period, allowing more time for seed filling. In addition, the increased lateral pressure from the upper seed layers enhanced the likelihood of seeds entering the holes. Under these conditions, the missed index became lower while the multiples index increased. When the wrap angle reached 45°, the qualified index peaked at 88.5%, indicating optimal seeding performance.

3.3. Bench Testing for Optimization of Seeding Performance

Table 5 presents the design and results of a second-order rotational orthogonal combination experiment conducted to optimize the performance of the peanut metering device. Design-Expert 8.0.6 software was used to perform an analysis of variance on the experimental results. The ANOVA outcomes are summarized in Table 6.
Regression equations were established for the actual values of the qualified index (A), multiples index (D), and missed index (M), and the significance of each model was tested. The regression model describing the effects of the factors on the qualified index was given by the following equation:
A = 66.7 + 1.1 X 1 + 0.32 X 2 + 0.009 X 1 X 2 0.03 X 1 2 0.005 X 2 2
According to Table 6, the order of significance (p < 0.01) for factors influencing the qualified index was X12 > X1 > X22 > X2 > X1X2. The lack-of-fit test yielded a p value of 0.1324, indicating no significant lack of fit and suggesting that no other major factors influenced the response variable.
The regression model for the multiples index was as follows:
D = 15.63 0.67 X 1 + 0.03 X 2 0.005 X 1 X 2 + 0.01 X 1 2 + 0.002 X 2 2
For the multiples index, the factors with highly significant effects (p < 0.01) were ranked as X1 > X2 > X12 > X22. The lack-of-fit test returned a p value of 0.5478, indicating no significant lack of fit and suggesting that no other major factors influenced the response variable.
The regression model for the missed index was as follows:
M = 17.66 0.43 X 1 0.35 X 2 0.005 X 1 X 2 + 0.02 X 1 2 + 0.004 X 2 2
For the missed index, the factors with significant effects (p < 0.01) were ranked as X1 > X2 > X12 > X22 > X1X2. The lack-of-fit test yielded a p value of 0.3914, again indicating no significant lack of fit and suggesting that no other major factors influenced the response variable.
To determine the optimal operating parameter combination for the cam-swing link precision metering device for peanut, the Numerical module in Design-Expert 8.0.6 was employed to perform multi-objective optimization. The goal was to maximize the qualified index while minimizing the multiples and missed indices. A mathematical model was constructed, with the objective function and constraint conditions defined as shown in Equation (14):
M a x   A M i n   D M i n   M 15 rpm X 1 40 rpm 20 ° X 4 70 °
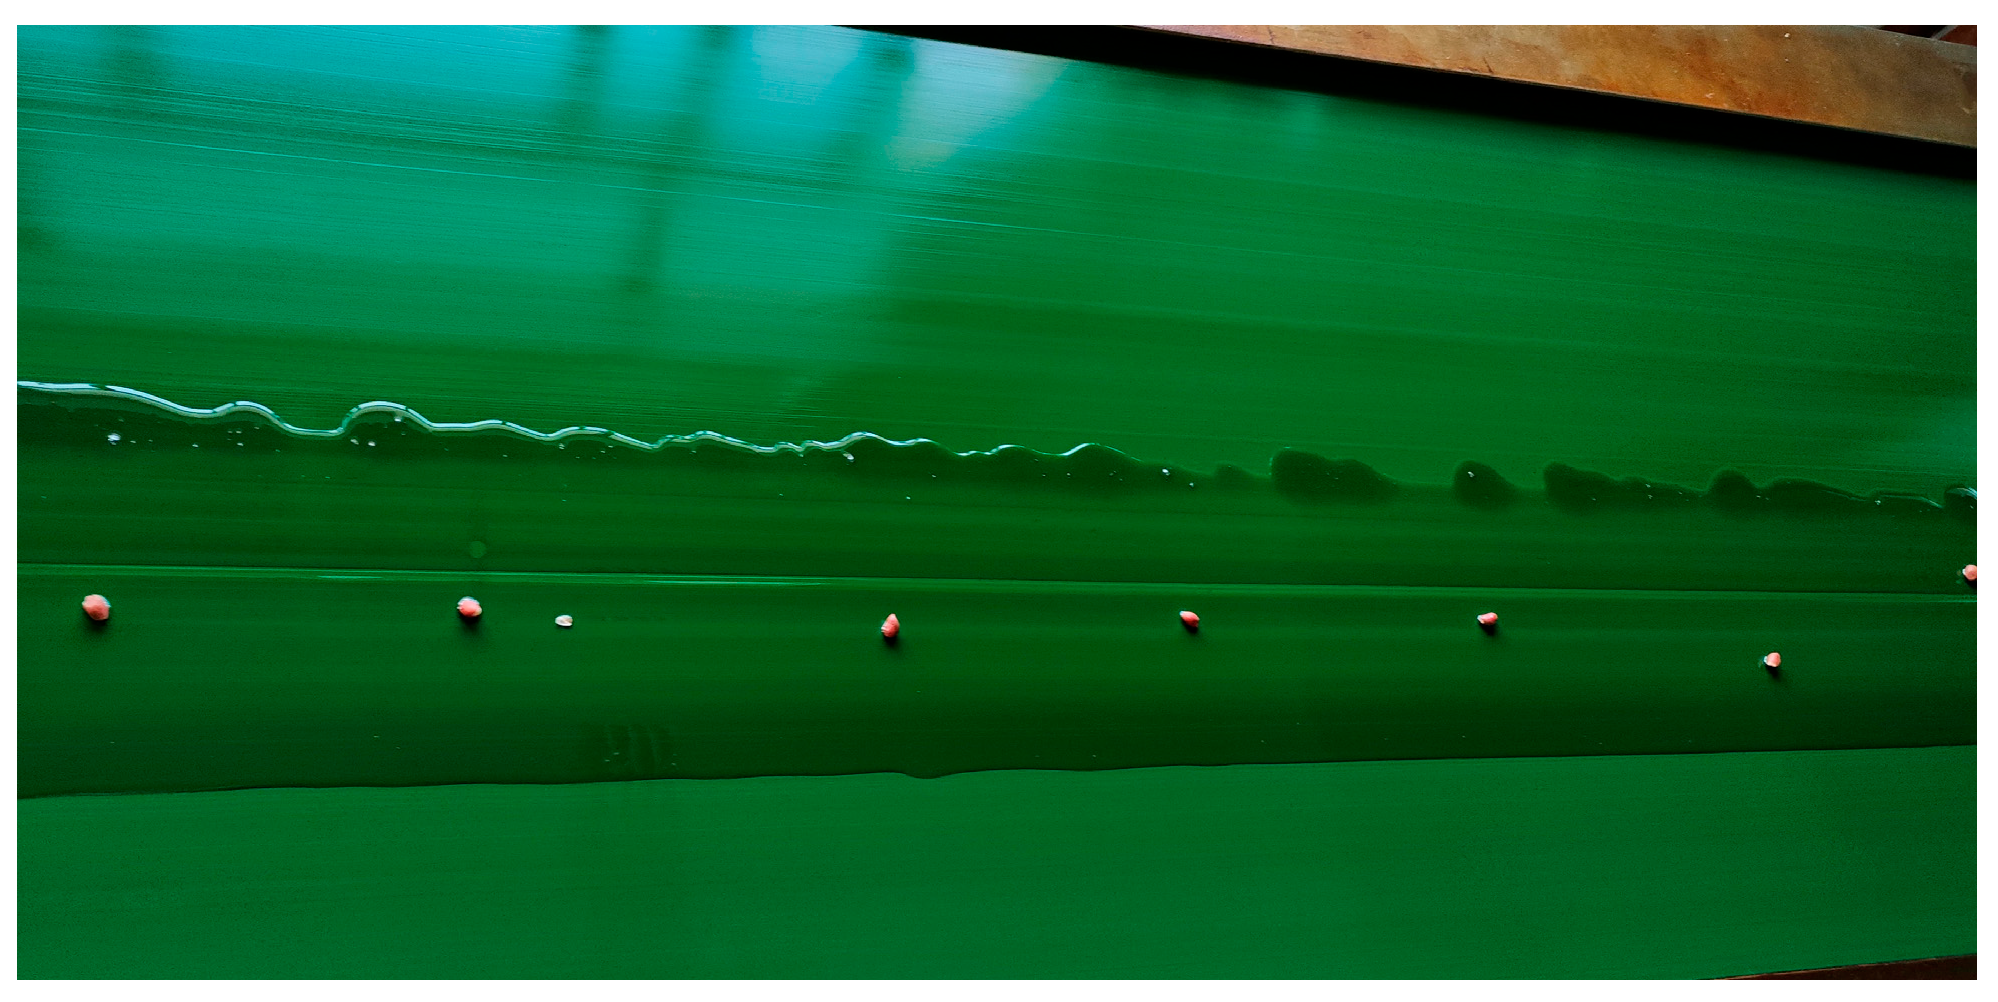
According to the objective function and constraints, the optimal solution was obtained when the seeding disc rotational speed was 26.25 rpm and the seed cluster wrap angle was 46.29°. Considering practical operating conditions, a verification test was conducted using a seeding disc rotational speed of 26 rpm and a wrap angle of 46°. Each trial was repeated three times, and the results are shown in Figure 20. The experimental results show that under the selected parameter combination, the qualified index reached 89.95%, the multiples index was 6.01%, the missed index was 4.04%, and the seed damage rate was 0.46%. These results satisfy the operational requirements for precision peanut seeding.

3.4. Field Validation Test of the Metering Device

After planting, five locations were randomly selected within the test area, and in each location, peanut seeds in mulch holes within a 1 m section of four rows were counted. The measured average plant spacing was 136.7 mm. The qualified index of plant spacing was 89.16%, the multiples index was 7.13%, and the missed index was 3.71%. The results of the field validation test indicate that under the optimized operating parameters, the performance of the metering device meets the requirements of precision planting for peanuts.

4. Discussion

The precision metering device for peanut, as a key part of the planter, utilizes the type hole and cam-swing link mechanism to control the movement trajectory of peanut seeds in the stages of seed filling, cleaning, carrying, and delivering. This enables improvement of seed flowability and seeding performance. The seeding performance of the metering device is mainly affected by the structure of the metering device, seeding disc rotational speed, and the seed cluster wrap angle. Utilizing DEM simulation and MBD–DEM coupled simulation can effectively analyze the seed motion characteristics within the metering device. In this article, bench testing was utilized to evaluate the effects of disc rotational speed and seed cluster wrap angle on seeding performance. Under the optimal parameter combination, the qualified index reached 89.95%, the multiples index was 6.01%, and the missed index was 4.04%. This seeding performance can meet the requirements for precision peanut planting. Compared to the optimal seeding performance of previous research on precision mechanical metering device for peanut [14], in which the qualified index reached 88.42%, the multiples index was 6.04%, and the seed damage rate reached 0.58%, the mechanical metering device in this article can satisfy the requirements for precision seeding of peanut. When the cam-swing link precision metering device is used for film-mulched seeding, such as cotton seed, the focus is on optimizing the structural parameters of the metering device. However, there is a lack of research on the influence of disc rotational speed and seed cluster wrap angle on seeding performance, and studies on movement trajectory of peanut are relatively scarce [9]. The advantage of utilizing a cam-swing link precision metering device for seeding peanut is to improve seed flowability and increase the probability of successful seed filling, cleaning, carrying, and delivering. This article, through bench testing with a combination of operating parameters for disc rotational speed and seed cluster wrap angle, further clarifies the influence of the operating parameters on seeding performance.

5. Conclusions

(1) A cam-swing link precision metering device for peanut was developed. The main structural parameters of the seeding disc and the cam-swing link mechanism were determined. The semi-ellipsoidal type holes were designed with a major axis of 19 mm and a minor axis of 11 mm. The number of type holes on the seeding disc was set to 10. The base circle diameter of the cam was defined as 60 mm, and the lower section length of the swing link was determined to be 50 mm.
(2) DEM simulations were used to comparatively analyze the effect of different type hole installation positions on the disturbance capability of the seed cluster. A single-factor test and MBD–DEM coupled simulation were conducted to analyze the influence on seeding performance. The simulation results indicate that when the type hole protrusion height was set to half the thickness of the seeding disc, seed cluster kinetic energy remained relatively stable, enhancing the capability to disturb seeds. Increasing the rotational speed of the seeding disc from 10 to 40 rpm led to an initial increase followed by a decrease in the qualified index, and a corresponding initial decrease followed by an increase in the missed index. The highest qualified index of 87.1% was observed at a seeding disc rotational speed of 25 rpm. Increasing the seed cluster wrap angle from 20° to 70° resulted in an initial increase and then a decrease in the qualified index, while the missed index showed a decreasing trend. The maximum qualified index of 88.5% was achieved at a wrap angle of 45°.
(3) A seeding performance optimization test was conducted using the JPS-12 computer vision-based test platform. A second-order rotational orthogonal combination experiment was applied to evaluate their effects on seeding performance. The experimental results show that when the seeding disc rotational speed was set at 26 rpm and the seed cluster wrap angle at 46°, the qualified index reached 89.95% and the missed index was 4.04%. Under these conditions, the device demonstrated superior seeding performance that meets the operational requirements for precision peanut seeding. The results of the field validation test show that the qualified index of peanut plant spacing was 89.16% and the missed index was 3.7%, indicating that the planting performance meets the requirements for precision planting of peanuts.

Author Contributions

Conceptualization, J.C. and K.C.; methodology, Y.X. and S.W.; validation, J.C., J.W., Y.X., S.W., K.C., and L.W.; formal analysis, Y.X., S.W., and K.C.; investigation, J.W.; resources, J.W.; data curation, K.O.; writing—original draft preparation, J.C. and K.O.; writing—review and editing, L.W.; supervision, L.W.; funding acquisition, J.C. All authors have read and agreed to the published version of the manuscript.

Funding

This work was supported by the National Natural Science Foundation of China (52475272) and the National Key Research and Development Program of China (2023YFD200100204).

Data Availability Statement

The data presented in this study are available on request from the corresponding author. The data are not publicly available due to ongoing patent applications.

Conflicts of Interest

The authors declare no conflicts of interest.

References

  1. Li, Z.; Zhang, Y.; Liu, Y.; Fan, Y.; Qiu, D.; Li, Z.; Zhou, Y.; Gong, F.; Yin, D. Comprehensive analysis of high-oil peanut cultivars in China: Agronomic performance, disease resistance, and breeding insights. Reprod. Breed. 2025, 5, 102–109. [Google Scholar] [CrossRef]
  2. Sun, Q.; Zheng, Y.; Li, S.; Yang, J.; Zhao, X.; Du, L.; He, K.; Liu, J. Diversified crop rotation: Synergistically enhancing peanut yield and soil organic carbon stability. Agric. Ecosyst. Environ. 2025, 382, 109497. [Google Scholar] [CrossRef]
  3. Zhao, Z.; Wu, H.; Jin, T.; Liu, H.; Men, J.; Cai, G.; Cernava, T.; Duan, G.; Jin, D. Biodegradable mulch films significantly affected rhizosphere microbial communities and increased peanut yield. Sci. Total Environ. 2023, 871, 162034. [Google Scholar] [CrossRef]
  4. Zhao, J.; Liu, Z.; Lai, H.; Zhao, M.; Zhu, Q.; Zhao, C.; Yang, D.; Li, X. The impacts of soil tillage combined with plastic film management practices on soil quality, carbon footprint, and peanut yield. Eur. J. Agron. 2023, 148, 126881. [Google Scholar] [CrossRef]
  5. Xu, X.; Wei, H.; Yan, J.; Bao, G.; Du, Y.; Xie, H. Parameter calibration of peanut pods discrete element simulation. J. Chin. Agric. Mech. 2022, 43, 81–89. [Google Scholar] [CrossRef]
  6. Yadav, B.; Moses, S.C.; D’Souza, P.M.; Alam, R.N. Study of physical properties of groundnut seeds relevant to design of planter. J. Exp. Agric. Int. 2025, 47, 39–46. [Google Scholar] [CrossRef]
  7. Guo, P.; Zheng, X.; Wang, D.; Hou, J.; Zhao, Z. Design and experiment of precision seed metering device with pneumatic assisted seed-filling for peanut. Trans. Chin. Soc. Agric. Mach. 2024, 55, 64–74. [Google Scholar] [CrossRef]
  8. Zhang, C.; Kang, J.; Zhang, N.; Peng, Q.; Zhang, H.; Wang, X. Design and experiment of seed separation tray of air-suction roller dibbler for peanut. Trans. Chin. Soc. Agric. Mach. 2023, 54, 28–37. [Google Scholar] [CrossRef]
  9. Kang, J.; Xiang, Y.; Zhang, C.; Peng, Q.; Zhang, G.; Zhang, N.; Wang, X.; Tang, C. Analysis and experiments of the seed feeding performance of air-suction roller dibbler for peanuts. Trans. CSAE 2022, 38, 1–11. [Google Scholar] [CrossRef]
  10. Hao, J.; Qin, J.; Yang, S.; Ai, Q.; Ma, Z. Design and experiments of a precision sowing unit with the spoon clip for single peanut seed planting in plot. Trans. CSAE 2023, 39, 33–41. [Google Scholar] [CrossRef]
  11. Ren, D.; Chang, X.; Liu, B.; Yang, Y.; Li, M.; Wang, D.; Gao, Z. Study on the design and performance of a seed discharger for peanut plot breeding based on the CFD-DEM method. Agriculture 2025, 15, 276. [Google Scholar] [CrossRef]
  12. Xiang, Y.; Zhang, C.; Kang, J.; Peng, Q.; Zhang, N.; Wang, X. Analysis and optimization test of the peanut seeding process with an air-suction roller dibbler. Agriculture 2022, 12, 1942. [Google Scholar] [CrossRef]
  13. Da Costa, E.; Yazgi, A. Mathematical modelling and optimization of seed metering unit performance in precision peanut seeding. Appl. Sci. 2024, 14, 7525. [Google Scholar] [CrossRef]
  14. Wu, M.; Cong, J.; Yan, Q.; Zhu, T.; Peng, X.; Wang, Y. Calibration and experiments for discrete element simulation parameters of peanut seed particles. Trans. CSAE 2020, 36, 30–38. [Google Scholar] [CrossRef]
  15. Liu, C.; Wang, C.; Song, J.; Du, X.; Zhang, F. Design and seed-filling test of cell-type precision seed-metering device with vibration technology. Trans. Chin. Soc. Agric. Mach. 2018, 49, 108–115. [Google Scholar] [CrossRef]
  16. Shang, S.; Chang, X.; Zhang, N.; He, X.; Li, M.; Wang, D. Design and verification of material-laying seed meter test bench. Trans. Chin. Soc. Agric. Mach. 2025, 56, 186–201. [Google Scholar] [CrossRef]
  17. Li, Y.; Wei, Y.; Yang, L.; Zhang, D.; Cui, T.; Zhang, K. Design and experiment of mung bean precision seed-metering device with disturbance for promoting seed filling. Trans. Chin. Soc. Agric. Mach. 2020, 51, 43–53. [Google Scholar] [CrossRef]
  18. Wang, D.; Ji, R.; He, X.; Guo, P.; Shi, Y.; Zhang, C. Drive-guided combination slot-assisted seed-attached air-absorbing peanut high-speed precision seed meter. Trans. Chin. Soc. Agric. Mach. 2023, 54, 59–70. [Google Scholar] [CrossRef]
  19. Lan, W.; Fan, S.; Fan, S. Analysis of structural design defects in parallel overloading mechanisms with cam transmission mechanism. Appl. Math. Model. 2022, 107, 717–739. [Google Scholar] [CrossRef]
  20. Wang, L.; Liao, Q.; Xi, R.; Li, X.; Liao, Y. Influence of an equal width polygon groove-tooth wheel on feeding performance of the seed feeding device for wheat. Comput. Electron. Agric. 2024, 217, 108565. [Google Scholar] [CrossRef]
  21. He, D.; Li, H.; He, J.; Lu, C.; Wang, C.; Wang, Y.; Wu, Z.; Tong, Z.; Gao, Z. Research on vibration characteristics of no-tillage seeding unit based on the MBD-DEM coupling. Comput. Electron. Agric. 2025, 230, 109877. [Google Scholar] [CrossRef]
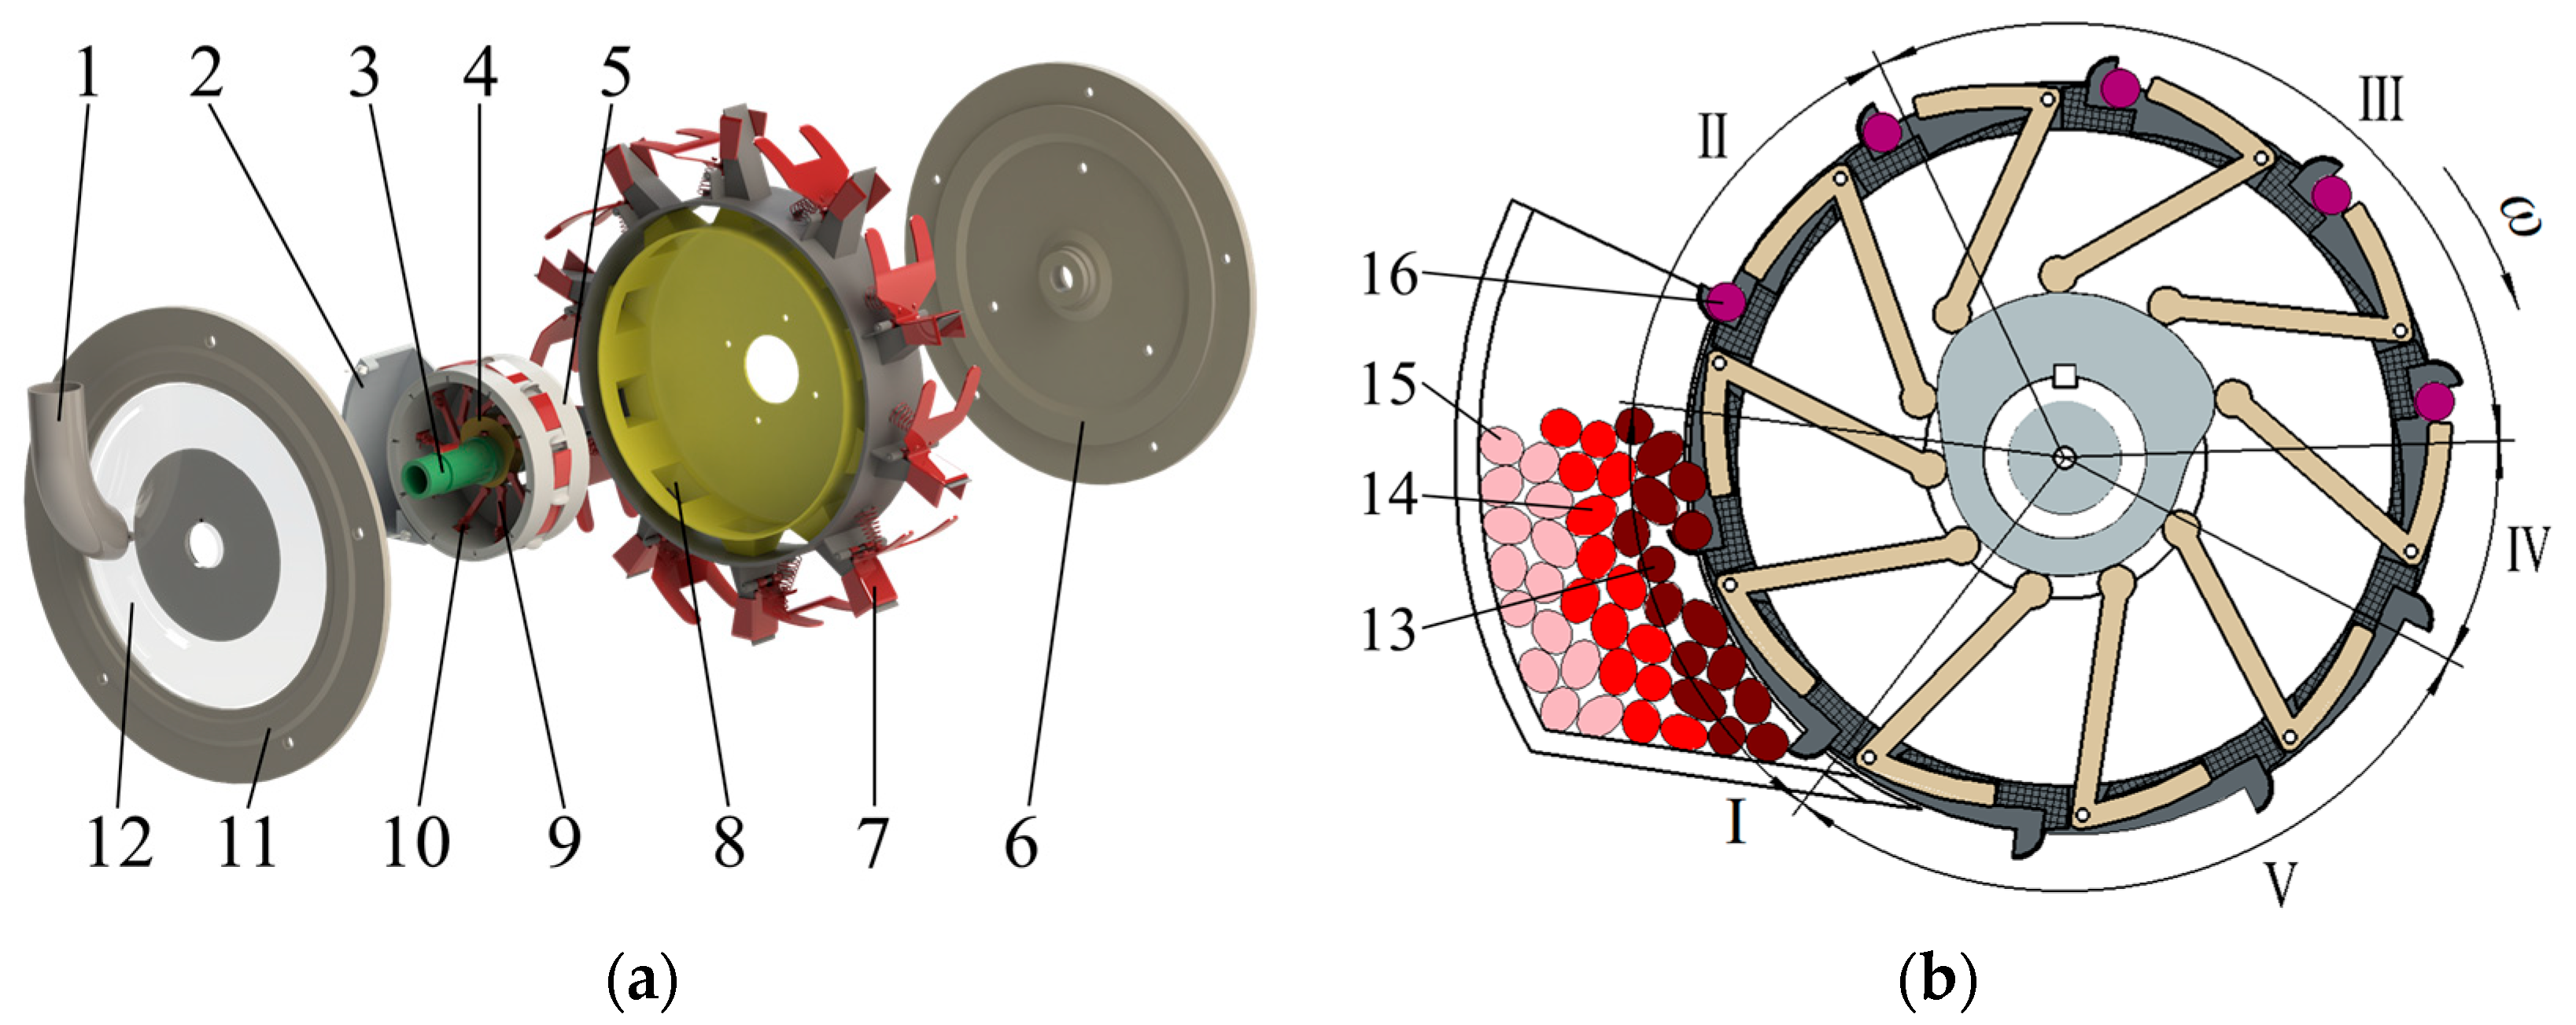
Figure 1. Schematic diagrams of the cam-swing link precision metering device for peanut. (a) Expanded structural view; (b) functional zoning of the seeding process. 1. Seed inlet pipe; 2. Seed chamber; 3. Shaft; 4. Cam; 5. Seeding disc; 6. Inner rotating disc; 7. Duckbill outlet; 8. Seed-guiding channel; 9. Swing link; 10. Swing link shaft; 11. Outer rotating disc; 12. Fixed disc; 13. Disturbed layer seeds; 14. Friction driving layer seeds; 15. Stationary layer seeds; 16. Seeds within type hole; I. Seed-filling zone; II. Seed-cleaning zone; III. Seed-carrying zone; IV. Seed-delivering zone; V. Transition zone.
Agronomy 15 01917 g001
Figure 2. Structural diagram of the seeding disc. 1. Disc body; 2. Guiding groove; 3. Type hole.
Agronomy 15 01917 g002
Figure 3. Installation configurations of type holes on the seeding disc. (a) Fully protruding; (b) partially protruding; (c) non-protruding.
Agronomy 15 01917 g003
Figure 4. Mounting orientations of semi-ellipsoidal type holes on the seeding disc. (a) Vertically oriented short axis; (b) horizontally oriented long axis; (c) vertically oriented long axis.
Agronomy 15 01917 g004
Figure 5. Postures of peanut seeds inside the type hole. (a) Flat-lying; (b) side-lying; (c) upright.
Agronomy 15 01917 g005
Figure 6. Baseline curve of the seed-guiding groove.
Agronomy 15 01917 g006
Figure 7. Structural diagram of the cam-swing link mechanism. 1. Swing link; 2. Cam; 3. Swing link shaft; 4. Main shaft.
Agronomy 15 01917 g007
Figure 8. Structural diagram of the swing link. 1. Swing link top; 2. Swing link tip; 3. Torsion spring; 4. Swing link bottom.
Agronomy 15 01917 g008
Figure 9. Division of cam working zones.
Agronomy 15 01917 g009
Figure 10. Theoretical and actual profiles of the cam.
Agronomy 15 01917 g010
Figure 11. Force diagrams of seeds in the disturbed layer within the seed chamber. (a) Selected seed in the disturbed layer; (b) force analysis of seed in the disturbed layer.
Agronomy 15 01917 g011
Figure 12. Simulation model of the metering device. (a) Particle fill mode; (b) mesh mode.
Agronomy 15 01917 g012
Figure 13. Particle models of peanut seeds. (a) Elongated ellipsoidal; (b) flat ellipsoidal; (c) near spherical.
Agronomy 15 01917 g013
Figure 14. Test setup. 1. Motor mounting frame; 2. Drive motor; 3. Cam-swing link precision metering device; 4. Device mounting frame; 5. Control console; 6. Computer.
Agronomy 15 01917 g014
Figure 15. Field test of peanut planting. (a) Planting operation; (b) emergence status; (c) growth condition.
Agronomy 15 01917 g015
Figure 16. Variation in average kinetic energy of seeds under different type hole installation configurations. (a) Fully protruding; (b) partially protruding; (c) non-protruding.
Agronomy 15 01917 g016
Figure 17. Seeding process and motion trajectory of peanut seeds. (a) Spatial relationship between the seed and the device; (b) trajectory of a single seed during seeding.
Agronomy 15 01917 g017
Figure 18. Velocity variation of a single seed over time.
Agronomy 15 01917 g018
Figure 19. Number of seeds filled per type hole under different filling conditions. (a) Single-seed filling; (b) multiple seed filling; (c) empty holes.
Agronomy 15 01917 g019
Figure 20. Bench test results of the peanut-seeding performance.
Agronomy 15 01917 g020
Table 1. Parameters of simulation and contact.
CategoryParameterValue
Peanut seedPoisson’s ratio0.30
Shear modulus (Pa)5.72 × 10⁷
Density (kg·m−3)1030
AcrylicPoisson’s ratio0.50
Shear modulus (Pa)1.37 × 10⁸
Density (kg·m−3)1197
Photosensitive resinPoisson’s ratio0.35
Shear modulus (Pa)1.2 × 10⁸
Density (kg·m−3)1455
Seed–seedRestitution coefficient0.36
Static friction coefficient0.42
Dynamic friction coefficient0.06
Seed–acrylicRestitution coefficient0.68
Static friction coefficient0.36
Dynamic friction coefficient0.03
Seed–resinRestitution coefficient0.6
Static friction coefficient0.34
Dynamic friction coefficient0.04
Table 2. Experimental factor level coding.
Code ValueRotational Speed (X1) (rpm)Wrap Angle (X2) (°)
−1.4141520
−118.6627.32
027.545
136.3462.68
1.4144070
Table 3. Seeding performance under different seeding disc rotational speeds.
Rotational Speed (rpm)Qualified Index (%)Multiples Index (%)Missed Index (%)
1065.25.629.2
1582.39.58.2
2084.68.27.2
2587.16.36.6
3082.75.911.4
3580.35.114.6
4076.74.718.6
Table 4. Seeding performance under different wrap angles.
Wrap Angle (°)Qualified Index (%)Multiples Index (%)Missed Index (%)
2075.64.719.7
32.580.76.412.9
4588.56.74.8
57.585.311.33.4
7082.114.73.2
Table 5. Experimental design and results.
Test No.FactorsPerformance Indicators
X1 (rpm)X2 (°)Qualified Index A (%)Multiples Index D (%)Missed Index M (%)
101.41486.79.73.6
20−1.41483.25.711.1
30088.66.25.2
40087.97.34.8
5−1.414086.110.53.4
61184.67.87.6
70087.57.15.4
81.414081.06.612.4
9−1185.311.82.9
100088.36.65.1
111−178.46.914.7
120088.16.35.6
13−1−185.27.96.9
Table 6. Analysis of variance results.
SourceQualified Index AMultiples Index DMissed Index M
Sum of SquaresDegree of
Freedom
F Valuep ValueSum of SquaresDegree of
Freedom
F Valuep ValueSum of SquaresDegree of FreedomF Valuep Value
Model110.17562.77<0.000138.97535.98<0.0001162.045312.93<0.0001
X127.06177.07<0.000113.82163.81<0.000179.561768.21<0.0001
X215.82145.060.000313.67163.10<0.000158.901568.72<0.0001
X1X29.30126.500.00132.25110.390.01462.40123.200.0019
X1242.911122.24<0.00017.58134.990.000614.431139.29<0.0001
X2222.13163.05<0.00012.66112.300.00999.44191.17<0.0001
Residual2.467 1.527 0.727
Lack of fit1.7733.430.13240.5830.820.54780.3631.290.3914
Pure
error
0.694 0.944 0.374
Total112.6312 40.4812 162.7612
Disclaimer/Publisher’s Note: The statements, opinions and data contained in all publications are solely those of the individual author(s) and contributor(s) and not of MDPI and/or the editor(s). MDPI and/or the editor(s) disclaim responsibility for any injury to people or property resulting from any ideas, methods, instructions or products referred to in the content.