Article

Assessing the Regional Impacts of Climate Change on Grain Yield and Nitrogen Surplus in China (2000–2020)

1
State Key Laboratory of North China Crop Improvement and Regulation, Key Laboratory of Ecological Environment of Farmland in Hebei, College of Resources and Environmental Sciences, Hebei Agricultural University, Baoding 071000, China
2
School of Environmental and Chemical Engineering, Shanghai University, Shanghai 200444, China
3
Daming County Agriculture and Rural Bureau, Handan 056999, China
*
Authors to whom correspondence should be addressed.
These authors contributed equally to this work.
Agronomy 2025, 15(8), 1908; https://doi.org/10.3390/agronomy15081908
Submission received: 7 July 2025 / Revised: 31 July 2025 / Accepted: 5 August 2025 / Published: 8 August 2025
(This article belongs to the Section Soil and Plant Nutrition)

Abstract

Rising food demand and nitrogen pollution have posed key challenges under climate change. This study analyzed meteorological and grain yield data from 2000 to 2020 across seven regions in China. By integrating an economic–climate model with a nutrient balance approach, it examined the effects of climate change on yields and nitrogen surplus. During the study period, average temperatures rose in all regions (0.73–1.49 °C), with more pronounced warming in northern areas. Rainfall trends varied regionally, from a decrease of 159.76 mm to an increase of 179.93 mm. Despite these climatic changes, national grain yields increased from 390 million tons in 2000 to 600 million tons in 2020, with temperature having a stronger influence on yield variation than rainfall. Nitrogen surplus showed regional differences, ranging from −236.50 kg·hm−2 to 117.20 kg·hm−2. In most areas, temperature and nitrogen surplus were negatively correlated. In contrast, rainfall had a weaker effect, with positive and negative coefficients close to zero. These results provide a basis for promoting green agricultural development in China.

1. Introduction

Due to alterations in the natural environment and intensified human activities, the global climate has experienced significant shifts [1,2]. Rising average temperatures and more frequent extreme weather events, driven by climate change, have adversely impacted agricultural production, posing serious threats to food security at both national and global levels [3,4]. Food security plays a vital role in economic development and constitutes a fundamental livelihood concern. Total grain yield is a critical determinant of food security [5,6]. In addition to its impact on food production, climate change also affects the agricultural environment, such as nutrient cycling and nitrogen losses [7,8]. Therefore, examining regional climate change, grain yield trends, and environmental indicators—such as farmland nitrogen surplus—was essential for understanding the dual impacts of climate change on food production and nitrogen pollution. This analysis provided a scientific basis for addressing the intertwined challenges of food and environmental security in China [9].
In recent years, some scholars have explored the impacts of climate change on agricultural production. For instance, Wang et al. [10]. employed climate scenario modeling to assess the impact of climate change on winter wheat yields in the Loess Plateau, revealing significant regional variability and highlighting the need for region-specific policy interventions. Chou et al. [11] further applied the economic–climate model to evaluate the effects of climatic factors on grain yields across different crop zones. In China, Japan, and Korea, the results showed substantial regional and crop-specific variability in both climate impacts and associated risks. Li et al. [12] conducted a meta-analysis on the impact of climate change on global cotton yields using a crop simulation approach. The results indicated that climate patterns significantly influence cotton yield variations. Specifically, a 1 °C increase in average temperature leads to a 1.64% decrease in cotton yield, while a 1% increase in precipitation results in a 0.09% increase in yield. Yang et al. [13] examined monitoring data from 2016 to 2018 in Hubei Province and found that agroecological zones and cropping patterns significantly affected wheat yields. These examples help to further illustrate the limitations of previous studies and the need for a more comprehensive regional analysis.
However, most previous studies focused on individual crops or localized regions, with climate variables typically restricted to annual or intra-annual averages. Such approaches might have overlooked spatial heterogeneity and dynamic climate interactions. Moreover, environmental impacts—such as changes in farmland nitrogen surplus—were rarely incorporated into these analyses, leading to an incomplete understanding of the broader consequences of climate change on agricultural systems.
To fill the existing research gap, this study selected the seven major natural geographic regions of China as the study area. An economic–climate model, integrated with multiple regression analysis, was applied to evaluate the impacts of climate change (2000–2020) on total grain yield across regions. A distinctive feature of this study was its integration of grain yield analysis and farmland nitrogen surplus evaluation, providing a comprehensive perspective on the trade-offs between agricultural productivity and environmental sustainability under climate variability. The findings were expected to provide a scientific basis for enhancing national food security, reducing environmental risks, and supporting the transition toward sustainable agricultural development in China.

2. Materials and Methods

2.1. Study Area

China is located in eastern Asia, on the western coast of the Pacific Ocean, with a terrain that descends from west to east in a stepped pattern. Based on topography, climate, and geographical location, the country is commonly divided into seven major regions: Northern China, Northeast China, Eastern China, Central China, Southern China, Southwest China, and Northwest China. Northern China includes five provinces (Beijing, Tianjin, Hebei, Shanxi, and Inner Mongolia); Northeast China includes three provinces (Liaoning, Jilin, and Heilongjiang); Eastern China includes seven provinces (Shanghai, Jiangsu, Zhejiang, Anhui, Fujian, Jiangxi, and Shandong); Central China includes three provinces (Henan, Hubei, and Hunan); Southern China includes three provinces (Guangdong, Guangxi, and Hainan); Southwest China includes five provinces (Chongqing, Sichuan, Guizhou, Yunnan, and Tibet); and Northwest China includes five provinces (Shaanxi, Gansu, Qinghai, Ningxia, and Xinjiang). This classification provides a geographical basis for analyzing regional differences in climate conditions, grain yields, and environmental factors such as nitrogen surplus across the country.

2.2. Data Sources

This study employs climate data—including annual average temperature and annual average rainfall—and agricultural data comprising grain yields of wheat, maize, and rice, spanning the period from 2000 to 2020 across seven major natural geographical regions in China. Meteorological data were mainly obtained from the China Meteorological Administration, while grain yield data were collected from the China Statistical Yearbook and the China Rural Statistical Yearbook.
In addition, the estimation of farmland nitrogen surplus was based on the Nuffer model, which integrates data on fertilizer input, crop uptake, and environmental losses. Relevant parameters and supplementary data were derived from the previously published literature [14,15,16,17].

2.3. Research Methods

2.3.1. Model Construction

Referencing the economic–climate model [18,19,20,21], this study explores the impact of climate change on grain yields. Specifically, average annual temperature and rainfall are key climatic factors that directly influence crop growth and yield. Total agricultural machinery power reflects the level of agricultural mechanization, which can enhance productivity and efficiency in farming operations. The cultivated land area determines the production scale and directly impacts yield and nitrogen balance. Nitrogen fertilizer application is a crucial input affecting both yield and nitrogen surplus. A multiple regression analysis is conducted on grain yields, nitrogen surplus, and related influencing factors. To improve the interpretability and robustness of the model, all variables are logarithmically transformed, resulting in a log–log regression structure. This specification allows the estimated coefficients to be interpreted as elasticities, meaning they represent the percentage change in the dependent variable associated with a 1% change in each independent variable. The log transformation also helps reduce heteroscedasticity and better captures potential nonlinear relationships between variables.
ln Y i t = b 1 ln ( A i t ) + b 2 ln ( B i t ) + b 3 ln ( C i t ) + b 4 ln ( D i t ) + b 5 ln ( E i t ) + μ
ln S i t = b 1 ln ( A i t ) + b 2 ln ( B i t ) + b 3 ln ( C i t ) + b 4 ln ( D i t ) + b 5 ln ( E i t ) + μ
where i and t represent region i and year t, respectively. Yit denotes the grain yield in region i during year t; A is the annual average temperature (°C); B is the annual average rainfall (mm); C represents the total agricultural machinery power (kW); D is the area of land used for crop cultivation; E denotes the nitrogen fertilizer application (104 tons); S is the nitrogen surplus (tons); and μ is the constant term.

2.3.2. Nitrogen Surplus Calculation Method

Based on the farmland soil nutrient balance method, the apparent soil nitrogen surplus is evaluated by calculating the difference between the nitrogen input (from sources such as fertilizers, non-symbiotic nitrogen fixation, atmospheric deposition, irrigation water, seeds, and crop residue returned to the soil from previous crops) and the nitrogen output (through crop grains and straw) (Figure 1). This method helps to assess the nitrogen surplus in the soil [22,23,24]. The nitrogen surplus model applies uniform parameter settings and assumptions consistently across all regions of China.
N sur = N input N output
The calculation formula for nitrogen input in farmland is as follows:
N input = N cfer + N bfix + N deep + N irr + N seed + N straw
N cfer = N nfer + C oncf × T ncf
N bfix = S i × B i
N deep = S total × U udeep
N irr = S i × V i × T nirr × 10 6
N seed = S i × U i × D i × E i
N straw = G i × H i
Nitrogen inputs to farmland mainly include sources such as chemical fertilizers, non-symbiotic nitrogen fixation, atmospheric deposition, irrigation water, seeds, and crop straw return. The nitrogen input from chemical fertilizers (Ncfer) is calculated based on the amount of applied fertilizer nitrogen (Nnfer) and the nitrogen content of compound fertilizers (Concf × Tncf). Non-symbiotic nitrogen fixation (Nbfix) depends on the biomass (Bi) per unit area of crops and their nitrogen-fixing capacity. Atmospheric nitrogen deposition (Ndeep) is obtained by multiplying the dry and wet deposition rate of nitrogen per unit area of soil (Undeep) by the total cultivated land area (Stotal). The nitrogen input from irrigation water (Nirr) is calculated using the amount of irrigation water applied (Vi) and its nitrogen concentration (Tnirr). Seed-borne nitrogen input (Nseed) is determined by the crop seeding rate (Ui), grain dry matter ratio (Di), and grain nitrogen content (Ei). Nitrogen input from crop straw return (Nstraw) is estimated using the amount of returned straw from the previous crop (Gi) and its nitrogen content (Hi).
The main nitrogen output pathways include the nitrogen content in harvested grain and in the straw of crops grown during the season. The nitrogen output can be calculated using the following formula:
N output = N sed + N straw
N s e d = S i × J i × D i × E i
N s t r = K i × H i
where Nsed is the amount of nitrogen in crop fruits, kg; Ji is the economic yield of the crop, kg·hm−2; Nstr is the amount of nitrogen carried away by the straw of the crop in the season, kg; and Ki is the amount of straw produced by crop i in the season, kg.

3. Results and Analysis

3.1. Characteristics of Climate Change in China

3.1.1. Temperature Variations

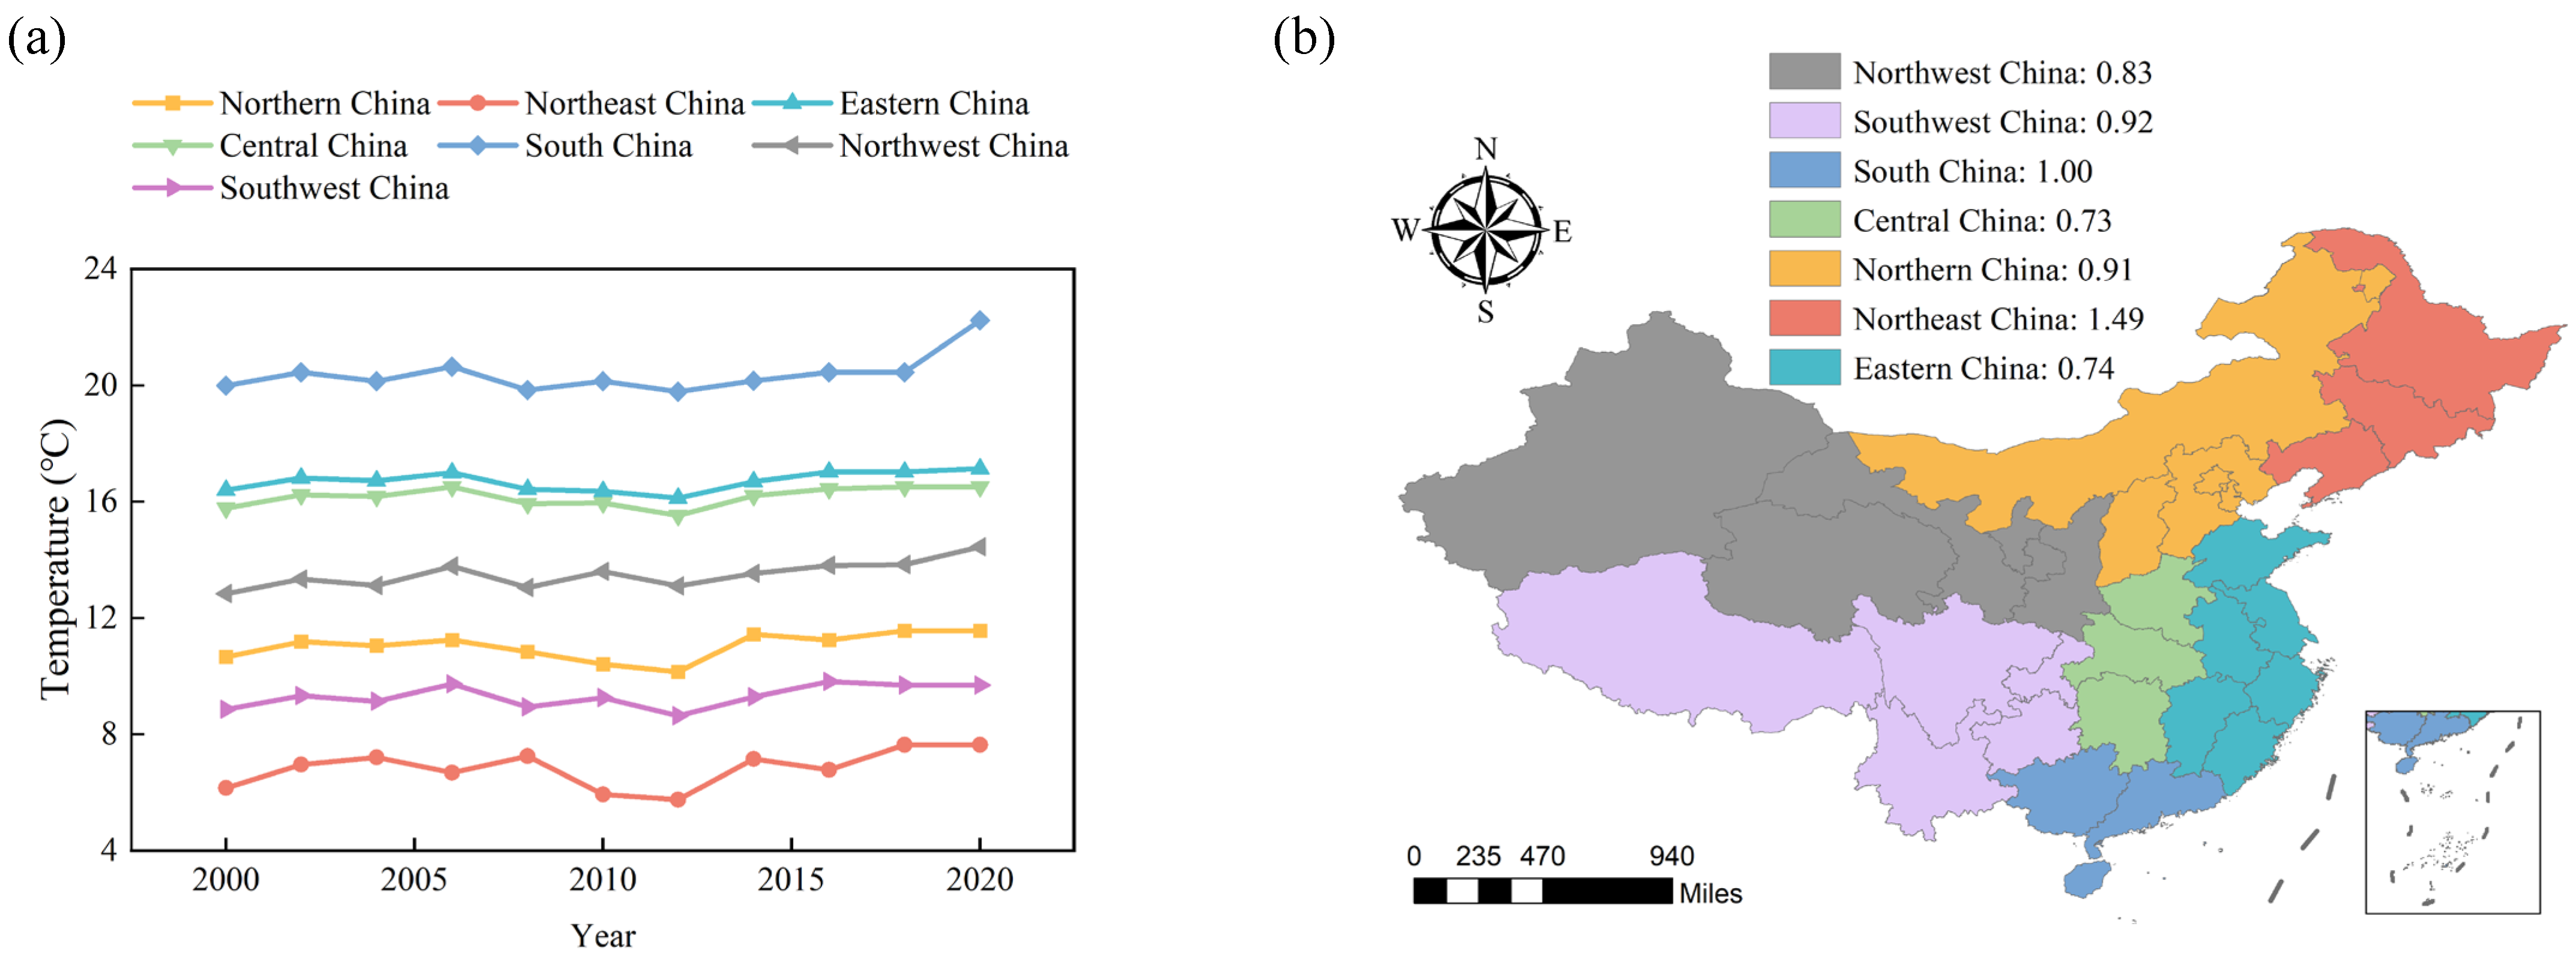
The annual average temperature across different regions in China showed significant variation (Figure 2). Overall, during the study period (2000–2020), the average annual temperature ranked from highest to lowest as follows: Southern China (20.95–22.23 °C) > Eastern China (16.23–17.13 °C) > Central China (15.53–16.51 °C) > Southwest China (13.52–14.49 °C) > Northern China (10.14–11.56 °C) > Northwest China (8.64–9.81 °C) > Northeast China (5.76–7.64 °C). In general, the temperature increased from north to south. Over time, the annual average temperature across all regions of China showed an upward trend from 2000 to 2020, which was consistent with the global warming trend (Table S1). Notably, the temperature in the northwest region exhibited a significant increasing trend (p = 0.0127). Over the 20-year period, the range of temperature increase across the regions was between 0.73 °C and 1.49 °C, with the greatest to the smallest increase observed as Northeast China (1.49 °C) > Southern China (1.00 °C) > Southwest China (0.92 °C) > Northern China (0.91 °C) > Northwest China (0.83 °C) > Eastern China (0.74 °C) > Central China (0.73 °C). The national temperature changes also exhibited a general pattern of increase from south to north. Notably, Northeast China experienced a significant temperature rise, with an increase exceeding 1 °C during the study period. The increase in average temperature was more pronounced in regions with relatively lower baseline temperatures.

3.1.2. Rainfall Variations

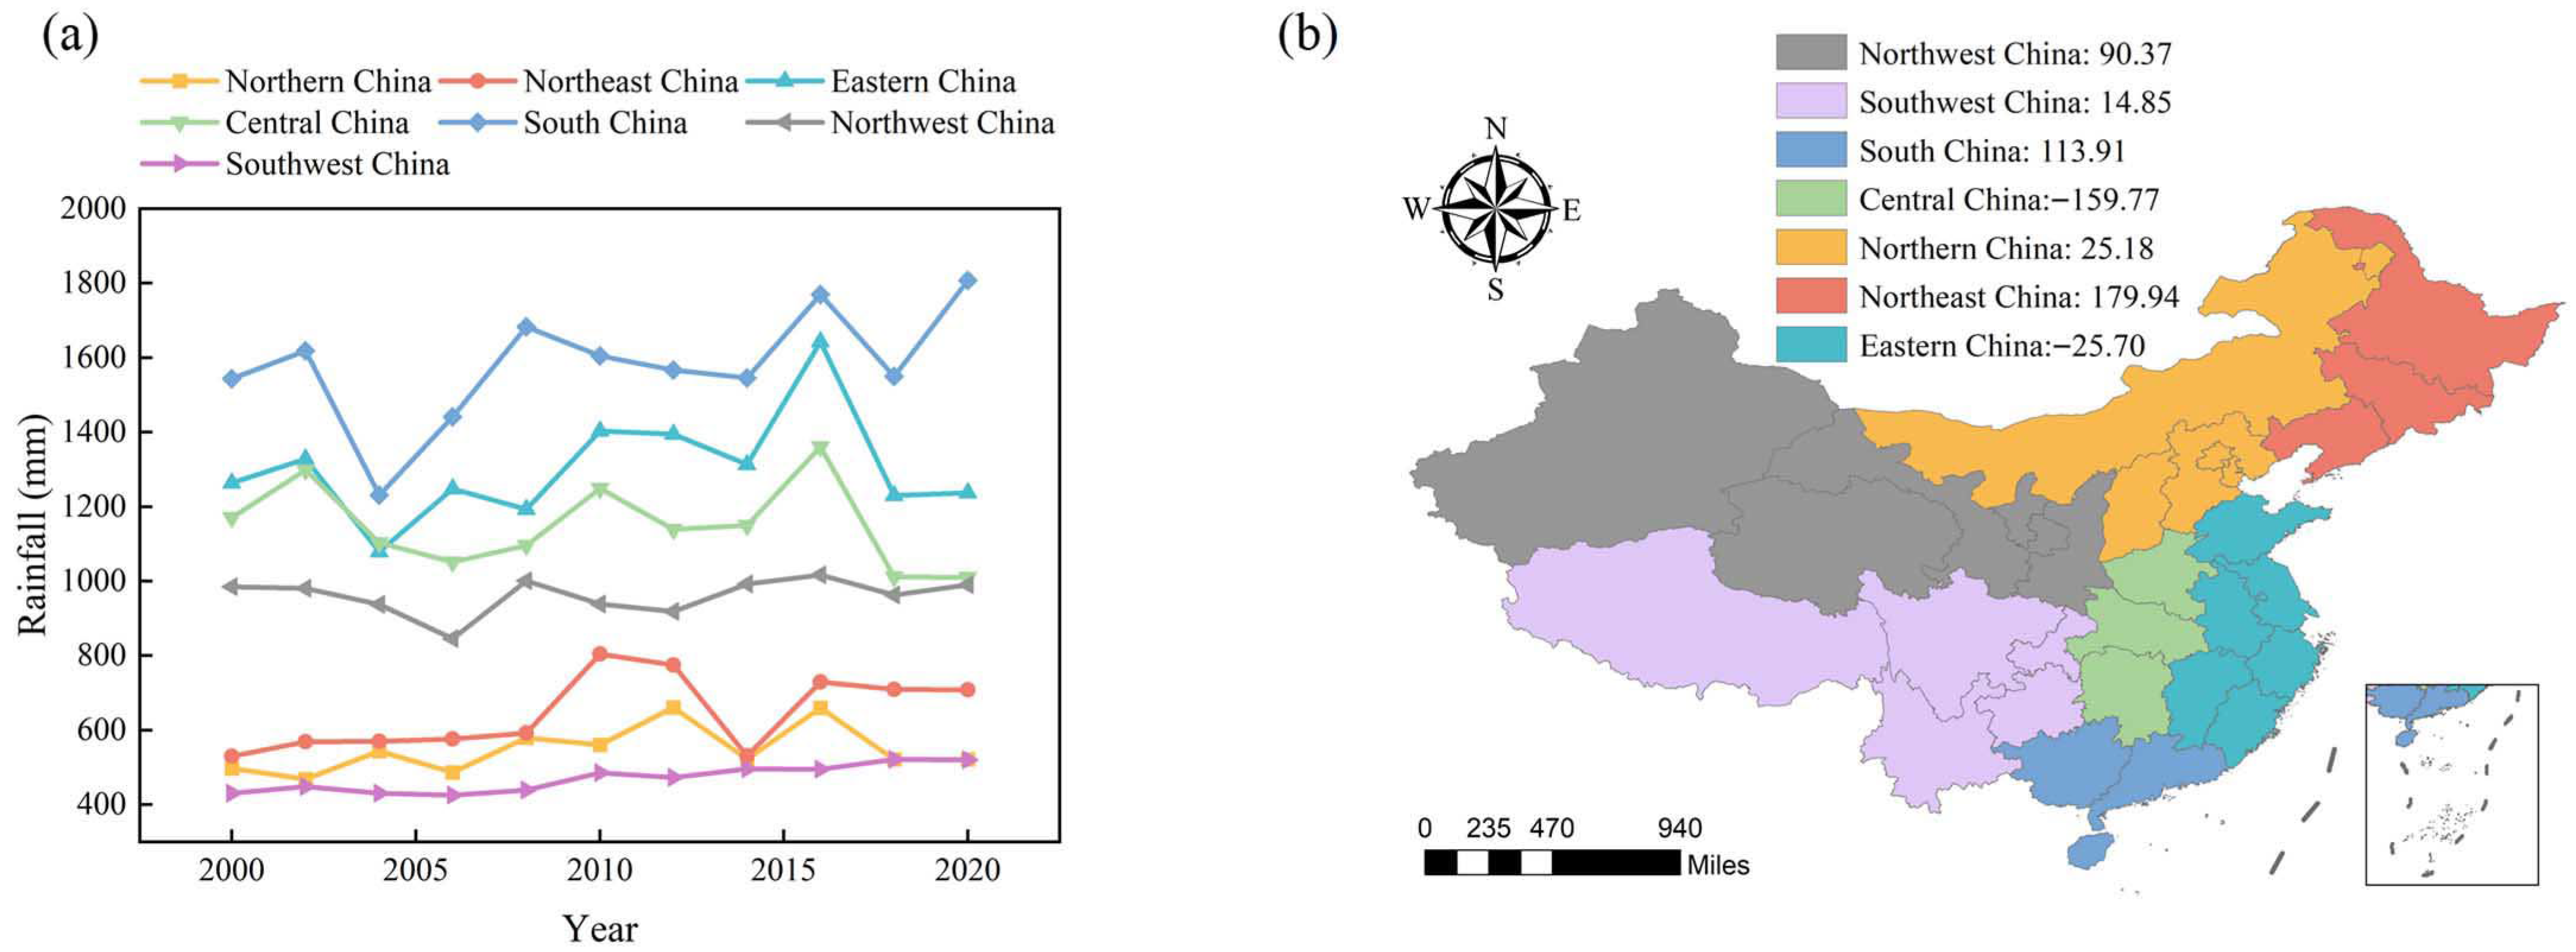
As shown in Figure 3, there were also significant regional differences in the annual average rainfall across China. From highest to lowest, the regional average annual rainfall ranked as follows: Southern China (1231.50–1808.09 mm) > Eastern China (1079.24–1643.12 mm) > Central China (1011.06–1361.60 mm) > Northwest China (845.53–1016.81 mm) > Northeast China (530.04–804.57 mm) > Northern China (468.87–661.17 mm) > Southwest China (425.21–525.35 mm). Between 2000 and 2020, except for a slight decrease in Central and Eastern China, rainfall in the rest of the regions showed an overall increasing trend, with the most significant increase in rainfall observed in Northeast China (179.94 mm increase). It was worth noting that rainfall in the southwest region showed a significant increasing trend (p = 0.0051) over time (Table S2).

3.2. Grain Yield and Nitrogen Surplus in China

3.2.1. Changes in Grain Yield

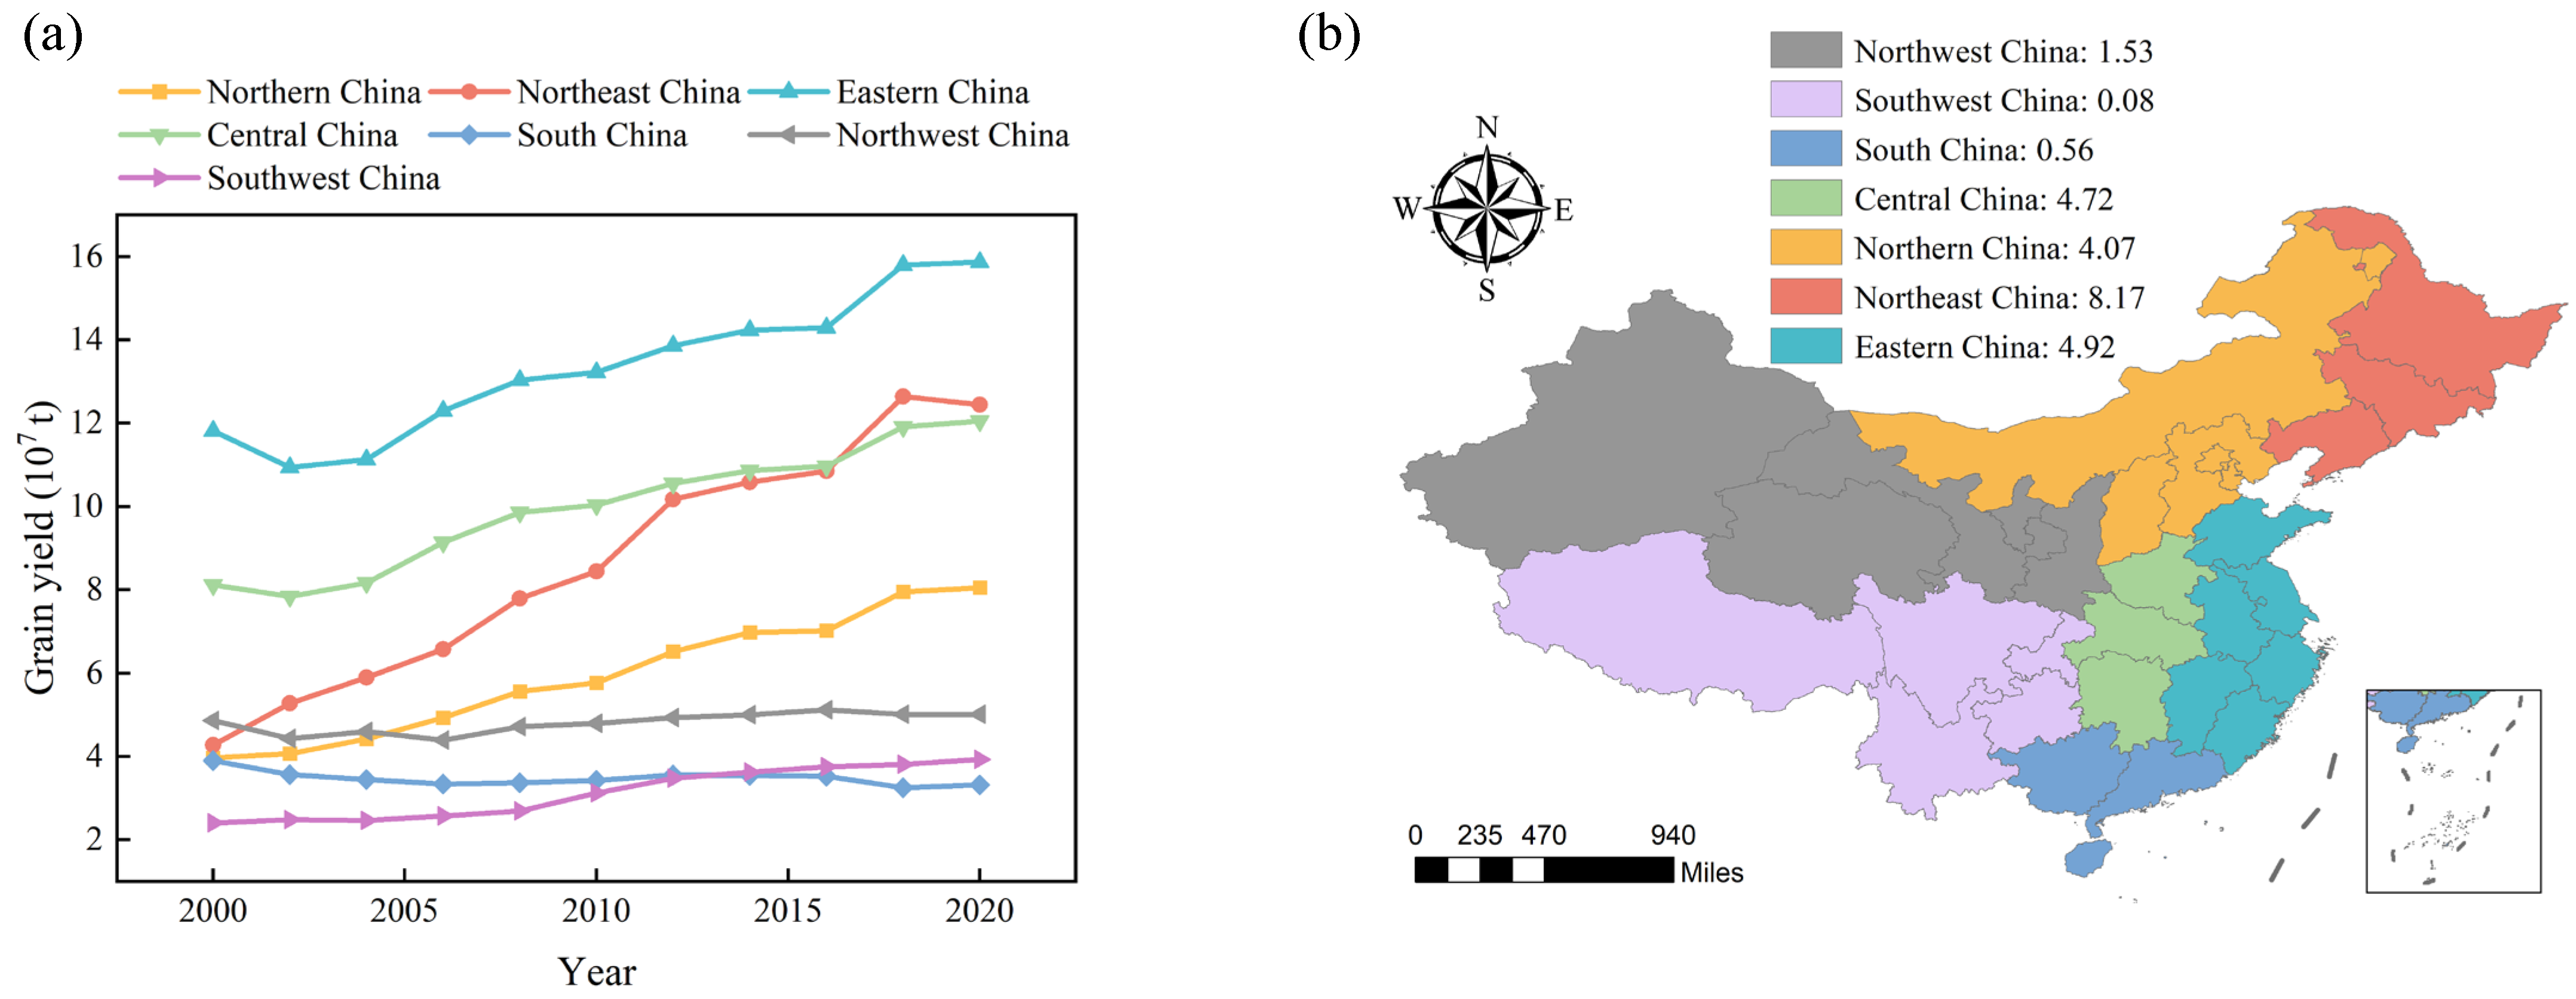
The overall grain yield across all regions showed the following ranking from highest to lowest: Eastern China (109,400,000–157,300,000 t) > Central China (78,400,000–120,600,000 t) > Northeast China (42,800,000–124,400,000 t) > Northern China (39,700,000–80,500,000 t) > Northwest China (51,200,000–543,800,000 t) > Southern China (32,500,000–39,200,000 t) > Southwest China (24,000,000–39,300,000 t). During the study period, grain yield in all regions exhibited an overall increasing trend. The magnitude of yield increase from 2000 to 2020, ranked from largest to smallest, was Northeast China (81,700,000 t) > Eastern China (49,200,000 t) > Central China (47,200,000 t) > Northern China (40,700,000 t) > Northwest China (15,300,000 t) > Southern China (5,600,000 t) > Southwest China (800,000 t) (Figure 4). Notably, except for Southern China, grain yields in the other six regions showed significant changes over time (Table S3).

3.2.2. Changes in Nitrogen Surplus

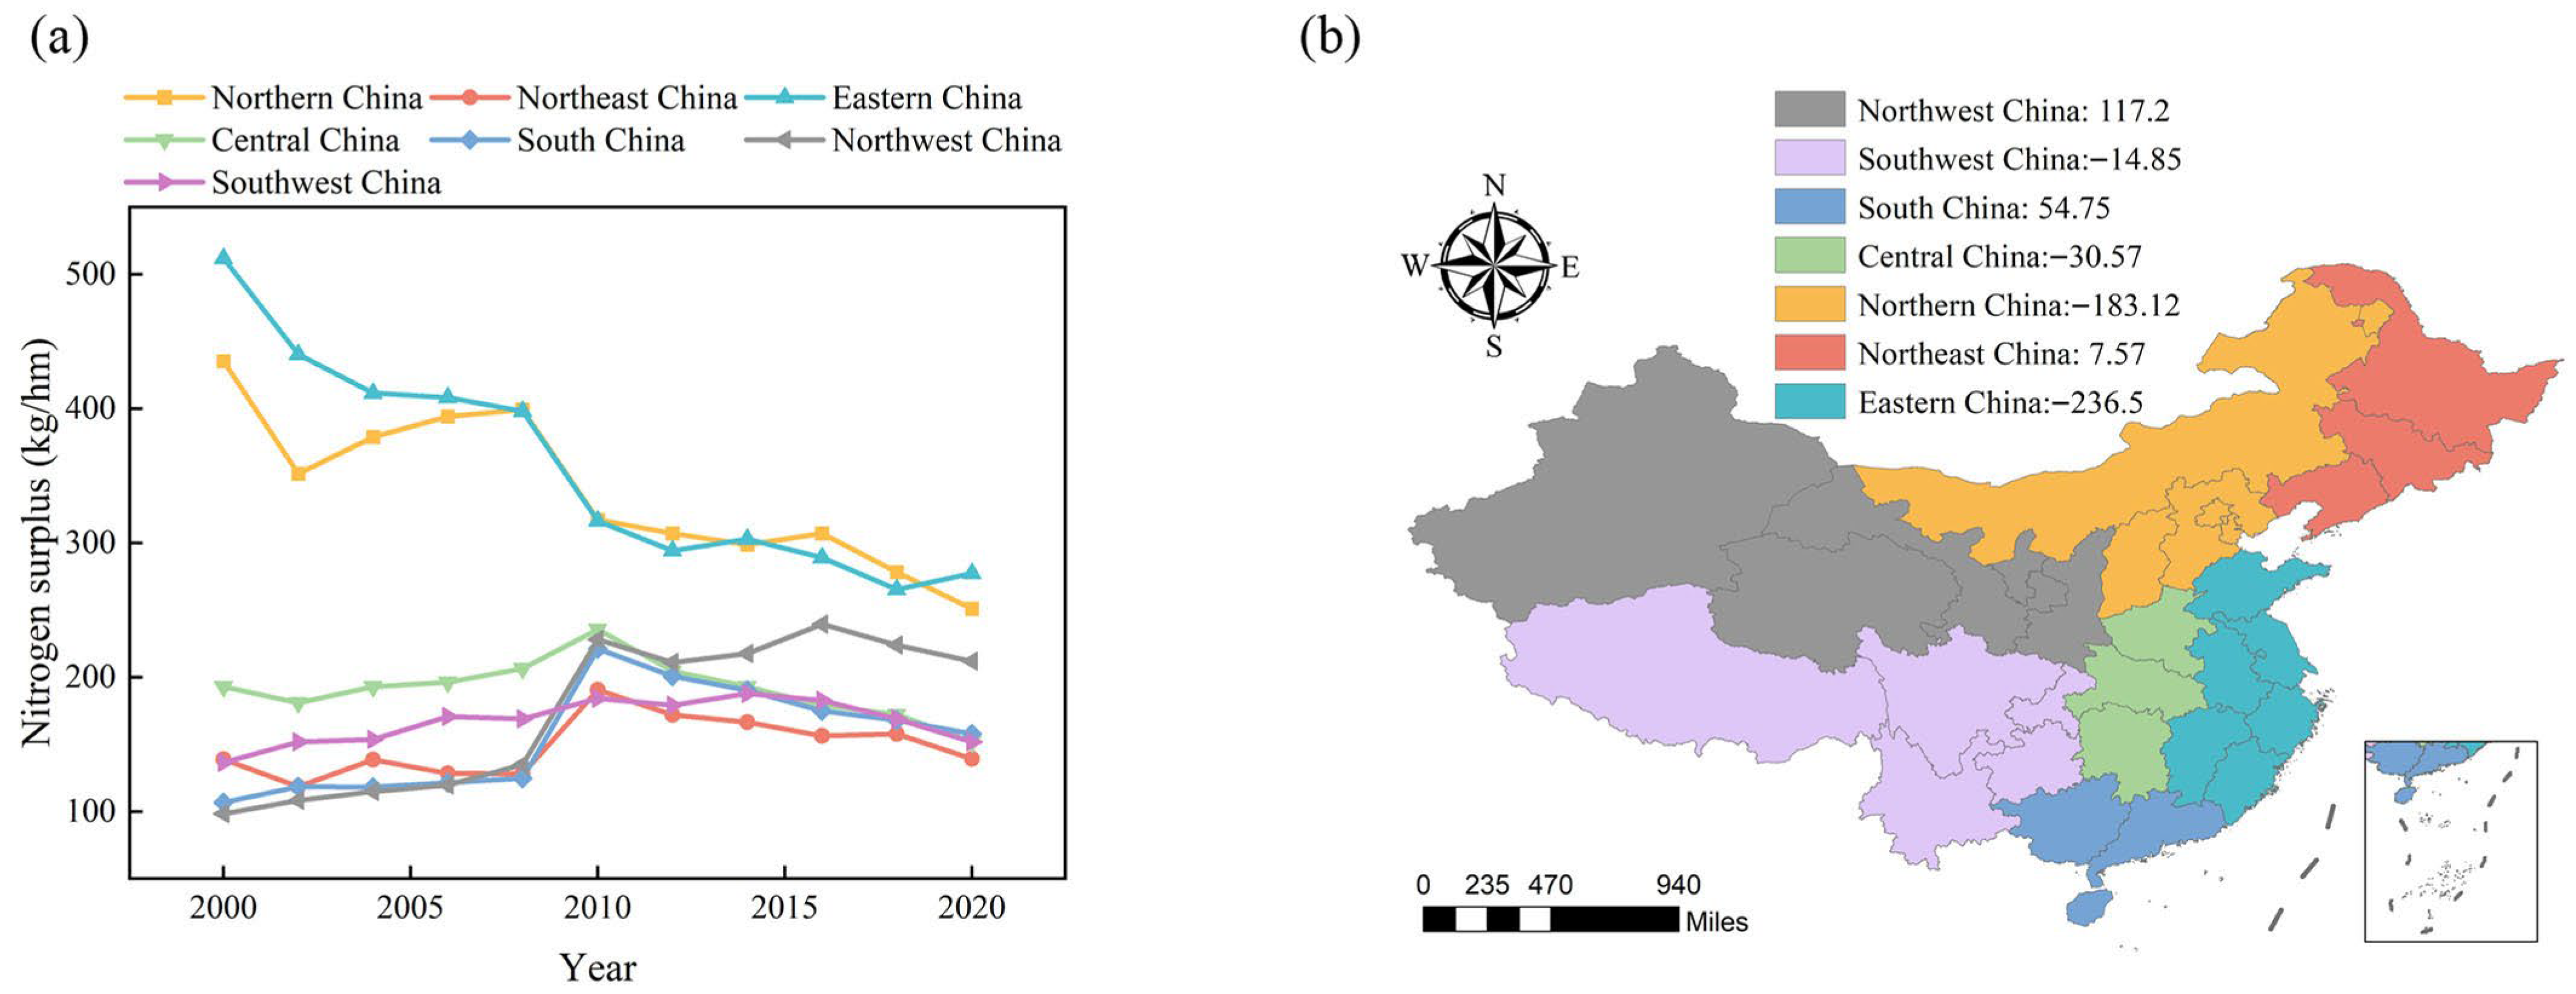
As shown in Figure 5, there were significant regional differences in nitrogen surplus intensity during the study period. Northern China (250.52–433.64 kg·hm−2) and Eastern China (266.44–514.12 kg·hm−2) had noticeably higher nitrogen surplus intensity compared with other regions. Northwest China (100.58–241.00 kg·hm−2) also exhibited relatively high values, while Southern China (107.00–221.53 kg·hm−2), Central China (160.42–232.39 kg·hm−2), Southwest China (137.02–184.97 kg·hm−2), and Northeast China (118.74–190.79 kg·hm−2) showed comparatively lower nitrogen surplus intensity. By the end of the study period in 2020, compared with the beginning in 2000, Eastern China, Northern China, Central China, and Southwest China experienced a significant decline in nitrogen surplus intensity, whereas the other regions showed an increasing trend. In terms of absolute decrease, the top three regions were Eastern China (236.50 kg·hm−2) > Northern China (183.12 kg·hm−2) > Central China (30.57 kg·hm−2). Among them, the changes in nitrogen surplus over time were more significant in Northern China, Eastern China, and Northwest China (Table S4).

3.3. Impact of Climate Change on Grain Yields

This study conducted multiple regression analyses on the seven regions of Northern China, Northeast China, Eastern China, Central China, Southern China, Southwest China, and Northwest China based on the model that examined the impact of climate change on grain yield. Table 1 presents the regression results of the model for each region’s climate change impact on grain yields.
From Table 1, it was observed that the simulation results of all models were generally good, with high values of R2 and Adjusted R2, indicating that the models had strong explanatory power. In all models, the collective influence of the factors on grain yield was significant. As one of the climatic factors in the model, the coefficient of annual average temperature was negative for the Northwest and Southern China regions, indicating that the increase in annual average temperature during the study period had a negative impact on grain yields in these regions. The coefficient of temperature was positive for the other regions, suggesting that temperature increase positively affected grain yields in most parts of China. As another climatic factor in the model, the coefficient of annual average rainfall was negative for the Eastern and Central China regions, indicating that the increase in rainfall during the study period had a negative impact on grain yields in these regions. In contrast, the coefficient of annual average rainfall was positive for the remaining regions, indicating that increased rainfall positively impacted grain yields in these areas during the study period.

3.3.1. Impact of Temperature Changes on Grain Yields

Since the coefficients of temperature varied across different regions in the models, and there were significant differences in the annual average temperatures among the regions, the impact of temperature changes on grain yield also differed by region. Based on the regression results of the models, the approach was to first predict the grain yield using the average values of each variable over the past decade as the baseline. Then, keeping the other variables constant (at their 20-year average values), the grain yield was predicted by increasing the average temperature by 1 °C. The predicted result was then compared with the original predicted yield, which allowed for the estimation of the change in grain yield caused by a 1 °C increase in average temperature.
There was a significant regional variation in the impact of a 1 °C increase in the average temperature on grain yields across different regions. When the average temperature rose by 1 °C, the largest increase in grain yield occurred in the Northern China region (3.05%), followed by Southwest China (2.99%), Eastern China (2.44%), Central China (0.93%), and Southwest China (0.42%). In contrast, both Southern China and Northeast China experienced a decrease in grain yield with the rise in temperature. Specifically, in Southern China, grain yield decreased by 15.70%, and in Northeast China, the yield decreased by 1.22%. The varying changes in grain yield across regions suggested that the impact of temperature rise on China’s food production differed by region, with the most significant effect observed in the northwest (Table 2).

3.3.2. Impact of Rainfall Changes on Grain Yields

Due to the differing coefficients of average rainfall in the models across regions, as well as the substantial differences in average rainfall between regions, the impact of rainfall changes on grain yields also varied. Based on the regression results from the model, the predicted change in grain yield due to an increase of 100 mm in average rainfall was calculated. The results showed that the effect of a 100 mm increase in average rainfall on grain yields was not significantly different across regions. Specifically, in Eastern China and Central China, grain yields showed a declining trend with an increase in rainfall, while in Northern China, Northeast China, Southern China, Southwest China, and Northwest China, grain yields showed a slight increase in response to the 100 mm rise in rainfall (Table 2).

3.4. Regional Analysis of Climate Change Impact on Nitrogen Surplus

This study conducted multiple regression analysis on the seven regions—Northern China, Northeast China, Eastern China, Central China, Southern China, Southwest China, and Northwest China—based on the model that examined the impact of climate change on nitrogen surplus (Table 3). All models passed the significance test at a certain level, indicating that the combined influence of various factors on nitrogen surplus was significant in all models. As one of the climate factors in the model, the coefficient of the annual average temperature was negative in all regions except for Southwest China and Northwest China, suggesting that the increase in temperature during the study period negatively affected nitrogen surplus in most regions of China. Another climate factor, annual average rainfall, had a relatively smaller impact on nitrogen surplus compared with temperature. An increase in annual rainfall during the study period negatively affected nitrogen surplus in Northern China, Northeast China, Central China, Southwest China, and Northwest China, with coefficients of −376,799, −20,843, −13,633, −5617, and −139,624, respectively. However, the increase in annual rainfall positively affected nitrogen surplus in Eastern China and Southern China, with coefficients of 177 and 1681, respectively.

3.4.1. Impact of Temperature Change on Nitrogen Surplus

To explore the change in nitrogen surplus, we first predicted the nitrogen surplus using the average values of each variable over the past 10 years as the baseline. Then, we increased the average temperature by 1 °C, keeping the other variables fixed at their 20-year average values, and predicted the nitrogen surplus again. This approach helped investigate the magnitude of the change in nitrogen surplus due to the increase in temperature.
There was a significant regional variation in the change of nitrogen surplus when the average temperature rose by 1 °C. Except for the Southern China and Northwest China regions, where the nitrogen surplus decreased by 1.22% and 15.70%, respectively, the nitrogen surplus in most of China increased. The increase in nitrogen surplus was relatively larger in Northern China (3.05%) and Eastern China (2.99%), followed by Northeast China, Central China, and Southwest China, with increases in nitrogen surplus of 2.44%, 0.93%, and 0.42%, respectively (Table 4).

3.4.2. Impact of Rainfall Changes on Nitrogen Surplus

The change in nitrogen surplus when the annual average rainfall increased by 100 mm also showed slight spatial differences across regions. When the average annual rainfall increased by 100 mm, the nitrogen surplus in Northern China, Northeast China, and Southern China showed an upward trend, with increases of 0.39%, 0.38%, and 0.10%, respectively. The nitrogen surplus in Eastern China remained relatively unchanged with the increase in rainfall. In contrast, the nitrogen surplus in Central China, Southwest China, and Northwest China showed a slight downward trend with increases in rainfall by 100 mm, with decreases of 0.07%, 0.03%, and 1.13%, respectively.

4. Discussion

4.1. Characteristics of Climate Change

Between 2000 and 2020, the annual average temperature in all regions of China showed a clear upward trend. This warming pattern, particularly pronounced over the past 50 years, was confirmed by multiple meteorological studies, and aligned with the broader trend of global climate change [25,26].
Although China’s temperature showed an overall upward trend, the warming was spatially uneven. The temperature increases in northern regions were more pronounced than in southern regions, with Northeast China experiencing an increase of approximately 1.49 °C during the study period. This pattern was consistent with the global warming distribution, where northern regions experienced more significant temperature increases, leading to a higher frequency and intensity of hot weather [27]. Changes in rainfall could also have been an important factor. Northern regions, located in the mid-latitude zone, had relatively complex climates. In recent years, there was a noticeable reduction in rainfall in the north, exacerbating drought conditions. This dry weather had a considerable impact on vegetation cover and soil moisture, making the land more vulnerable to the effects of high temperatures [28].
Additionally, human activities, changes in the natural environment, and meteorological conditions might also have contributed to the higher temperature increases in the northern regions. Rainfall changes showed considerable spatial variation. Eastern China and most of Central China experienced a decreasing trend in rainfall, while most of northern China saw a slight increase in rainfall. Peng [29] analyzed rainfall trends and found that overall, rainfall in China increased in the west and decreased in the east. Notably, the increased rainfall in the northwest might have been linked to afforestation efforts in China’s vast northwest. Increased forest cover led to higher humidity in the air, altering the regional microclimate and consequently increasing rainfall [30]. Global climate warming might also have been a contributing factor. Water vapor, primarily concentrated in the troposphere, was able to cross the Qinghai-Tibet Plateau due to higher atmospheric temperatures, facilitating the movement of water vapor to higher altitudes.

4.2. Impact of Climate Change on Grain Yield

China’s overall grain yield showed a slight upward trend, particularly in the Northern China, Northeast, Eastern China, Central China, and Southwest China regions, where the increase was more pronounced. Climate change had a certain impact on grain yield. With the exception of Southern China and Northwest China, temperature changes positively affected the grain yield in most parts of China, especially in Northern China, where the impact was significant. This phenomenon was mainly due to the fact that the increase in temperature could promote organic matter accumulation to some extent, thereby enhancing grain yield. However, this accumulation was not infinite, and as the temperature rose, the growth period shortened. Studies showed that increased pests and diseases brought about by warmer temperatures in parts of the south and the frequency of extreme rainfall have resulted in a 4.0 per cent reduction in yields in the south for every 1 °C of warmer temperatures [31,32]. Schlenker et al. [33] conducted a prediction for the Heihe Oasis, showing that a 7 °C annual average temperature was optimal for corn cultivation, and above this temperature, yields were negatively correlated. In Southern China, where baseline temperatures were already high, further warming exceeded optimal thresholds for crop growth, leading to a negative impact on yield. However, the annual average temperature in Southern China has increased slowly during the study period, and its natural conditions are relatively favorable with good climate and abundant rainfall. Thus, temperature increase had little effect on grain yield there. The negative impact of temperature rise on Northwest China’s grain yield might have been due to the long growing period of crops in this region. Rising temperatures shortened the growing season, reducing photosynthesis and affecting pollen fertilization, which in turn negatively impacted grain yield. To mitigate the adverse effects of warming, agricultural production in Northwest China could have adjusted crop varieties and planting schedules, thus offsetting the negative impact of rising temperatures and achieving increased yields.
The impact of rainfall on grain yield showed clear spatial differences. In Eastern China and Central China, the effect of rainfall was negative, although relatively small. This might have been due to the fact that some areas in East and Central China had relatively fertile soil and a humid climate, and excessive rainfall could have caused crops to absorb too much water, leading to reduced yields [34,35]. However, the positive impact of temperature rise on grain yield in these regions largely offset the negative effects of increased rainfall.
In Northern China, Northeast China, Southern China, Southwest China, and Northwest China, rainfall tended to have a small positive impact. This may be because these regions experienced relatively arid conditions as temperatures rose, and a slight increase in rainfall had a beneficial effect on grain yield. In Southern China and Southwest China, where rice was the primary crop and had a higher demand for rainfall, the relatively adequate heat conditions in these southern regions could mean insufficient moisture. Therefore, an increase in rainfall promoted grain yield growth in these areas to some extent.

4.3. Impact of Climate Change on Nitrogen Surplus

Climate change-induced nonlinear responses in grain yield and fertilization patterns further influenced farmland nitrogen surplus. During the study period, nitrogen surplus in Northern China, Eastern China, and Central China generally declined. While temperature and rainfall had relatively minor impacts overall, temperature increases positively influenced grain yields in most regions except for Southern China and Northwest China. A moderate rise in temperature enhanced photosynthesis and nitrogen uptake, thereby improved yields and reduced nitrogen surplus. This was consistent with our finding that temperature increases had a generally positive effect on the environmental characterization index of nitrogen surplus in most regions, likely due to the moderate degree of warming. However, extreme weather events damaged crop growth, reduced nitrogen absorption, and increased nitrogen losses such as ammonia volatilization [36,37]. In addition, conscious reductions in fertilizer use in response to warming may have further mitigated the negative effects of temperature increases on nitrogen surplus.
Rainfall had a minimal impact on nitrogen surplus, showing a negative effect in Central China, Southwest China, and Northwest China. This may have been because rainfall influenced grain yields in different regions, which in turn affected nitrogen surplus in farmland. The decrease in nitrogen surplus during the study period in most regions was mainly due to the temperature rise, increased grain yield, and reduced nitrogen fertilizer application. Although the impact of rainfall on nitrogen surplus in farmland was relatively small, frequent heavy rainfall events exacerbated soil erosion, generated surface runoff, and washed away nitrogen from farmland soil, leading to widespread non-point source pollution, which would have had serious environmental consequences [38].

4.4. Implications and Limitations

This study provided valuable insights into the spatial and temporal impacts of climate change on grain yield and farmland nitrogen surplus across different regions of China. By capturing the nonlinear relationships between temperature, rainfall, crop production, and nitrogen surplus, the findings contributed to the understanding of how climate variables influenced agricultural nutrient dynamics. The results supported the development of climate-smart fertilizer strategies and region-specific adaptation measures aimed at promoting sustainable agricultural practices.
Although this study yielded meaningful results, some limitations remained. Firstly, the model does not incorporate socio-economic factors such as changes in agricultural policies, fertilizer subsidy programs, and farmers’ behavioral adaptations to climate change, all of which may significantly have affected nitrogen use efficiency and surplus levels [39]. Secondly, due to data constraints, this study did not account for differences in irrigation practices, which were critical management measures influencing grain yield and nitrogen mobility [40,41,42,43]. Lastly, although this study revealed the significant impacts of rising temperatures on grain yield and nitrogen surplus and emphasized spatial variability among different regions, complex interactions between multiple climatic and anthropogenic factors resulted in considerable differences in regional response mechanisms [44,45]. Future research should further analyze specific drivers in different regions to more accurately elucidate the multi-scale impacts of climate change on agricultural nitrogen cycling. The model could also be enhanced by incorporating socio-economic variables, agricultural management practices, and land-use changes to improve its scientific rigor, adaptability, and policy relevance.

5. Conclusions

Based on climate and grain yield data from 2000 to 2020, this study revealed that rising temperatures across China, particularly in the north, coincided with increased grain yields and reduced farmland nitrogen surplus in many regions. The impact of temperature on grain yield was generally stronger than that of rainfall, and spatial differences in climate responses were evident. These findings suggest that moderate warming may enhance crop productivity and nutrient use efficiency, indirectly mitigating nitrogen surplus. However, the uneven effects of climate change across regions highlight the need for region-specific adaptive strategies, especially in fertilizer management. Future policies should promote climate-smart agriculture, integrating temperature trends, yield responses, and optimized fertilizer application. Further research is needed to assess how extreme climate events may influence these relationships over time.

Supplementary Materials

The following supporting information can be downloaded at: https://www.mdpi.com/article/10.3390/agronomy15081908/s1, Table S1: Mann-Kendall trend test results for annual temperature in different regions; Table S2: Mann-Kendall trend test results for annual rainfall in different regions; Table S3: Mann-Kendall trend test results for annual grain yield in different regions; Table S4: Mann-Kendall trend test results for annual nitrogen surplus in different regions.

Author Contributions

Conceptualization, H.W. (Hao Wang); Methodology, Z.Y.; Validation, H.W. (Hao Wang); Formal analysis, Z.W. and H.W. (Hongda Wen); Investigation, H.W. (Hao Wang) and J.Y.; Resources, W.L.; Data curation, H.C. and Y.W.; Writing—review & editing, H.W. (Hao Wang), W.L. and H.W. (Hongda Wen); Visualization, H.J. and H.W. (Hongda Wen); Supervision, G.Y. and H.W. (Hongda Wen); Project administration, W.L. All authors have read and agreed to the published version of the manuscript.

Funding

This research is supported by the following projects: The National Key R&D Program of China (2024YFD1701304), the National Natural Science Foundation of China (42477441), Local Science and Technology Development Fund Projects Guided by the Central Government in Hebei Province (246Z3607G).

Data Availability Statement

The original contributions presented in the study are included in the article, further inquiries can be directed to the corresponding author.

Conflicts of Interest

The authors declare no conflict of interest.

References

  1. Guo, B. The Dominant Influencing Factors of Desertification Changes in the Source Region of Yellow River: Climate Change or Human Activity? Sci. Total Environ. 2022, 813, 152512. [Google Scholar] [CrossRef]
  2. Deming, D. Climatic Warming in North America: Analysis of Borehole Temperatures. Science 1995, 268, 1576–1577. [Google Scholar] [CrossRef]
  3. Xu, X. Spatiotemporal Variations in Damages to Cropland from Agrometeorological Disasters in Mainland China during 1978–2018. Sci. Total Environ. 2021, 785, 147247. [Google Scholar] [CrossRef]
  4. Fujimori, S.; Wu, W.; Doelman, J.; Frank, S.; Hristov, J.; Kyle, P.; Sands, R.; Van Zeist, W.-J.; Havlik, P.; Domínguez, I.P.; et al. Land-Based Climate Change Mitigation Measures Can Affect Agricultural Markets and Food Security. Nat. Food 2022, 3, 110–121. [Google Scholar] [CrossRef] [PubMed]
  5. Fei, L.; Shuang, M.; Xiaolin, L. Changing Multi-Scale Spatiotemporal Patterns in Food Security Risk in China. J. Clean. Prod. 2023, 384, 135618. [Google Scholar] [CrossRef]
  6. Liang, Z.; Sun, L.; Tian, Z.; Fischer, G.; Yan, H. Increase in Grain Production Potential of China under Climate Change. PNAS Nexus 2023, 2, pgad057. [Google Scholar] [CrossRef] [PubMed]
  7. Iglesias, A.; Minguez, M.I. Modelling Crop-Climate Interactions in Spain: Vulnerability and Adaptation of Different Agricultural Systems to Climate Change. Mitig. Adapt. Strat. Glob. Change 1997, 1, 273–288. [Google Scholar] [CrossRef]
  8. Zhou, Z.; Ren, X.; Shi, L.; He, H.; Zhang, L.; Wang, X.; Zhang, M.; Zhang, Y.; Fan, Y. Vapor Pressure Deficit and Temperature Variability Drive Future Changes to Carbon Sink Stability in China’s Terrestrial Ecosystems. Front. For. Glob. Change 2024, 7, 1518578. [Google Scholar] [CrossRef]
  9. Hu, Y.; Yang, S.; Qian, X.; Li, Z.; Fan, Y.; Manevski, K.; Chen, Y.; Gao, W. Bibliometric Network Analysis of Crop Yield Gap Research over the Past Three Decades. Agriculture 2023, 13, 2105. [Google Scholar] [CrossRef]
  10. Wang, D.; Guo, M.; Li, J.; Wu, S.; Cheng, Y.; Shi, L.; Liu, S.; Ge, J.; Dong, Q.; Li, Y.; et al. Impact of Climate Change on the Winter Wheat Productivity Under Varying Climate Scenarios in the Loess Plateau: An APSIM Analysis (1961–2100). Agronomy 2024, 14, 2609. [Google Scholar] [CrossRef]
  11. Chou, J.; Jin, H.; Xu, Y.; Zhao, W.; Li, Y.; Hao, Y. Impacts and Risk Assessments of Climate Change for the Yields of the Major Grain Crops in China, Japan, and Korea. Foods 2024, 13, 966. [Google Scholar] [CrossRef]
  12. Li, N.; Yao, N.; Li, Y.; Chen, J.; Liu, D.; Biswas, A.; Li, L.; Wang, T.; Chen, X. A Meta-Analysis of the Possible Impact of Climate Change on Global Cotton Yield Based on Crop Simulation Approaches. Agric. Syst. 2021, 193, 103221. [Google Scholar] [CrossRef]
  13. Yang, R.; Harrison, M.T.; Wang, X. Current State and Limiting Factors of Wheat Yield at the Farm Level in Hubei Province. Agronomy 2023, 13, 2043. [Google Scholar] [CrossRef]
  14. Ma, L.; Ma, W.Q.; Velthof, G.L.; Wang, F.H.; Qin, W.; Zhang, F.S.; Oenema, O. Modeling Nutrient Flows in the Food Chain of China. J. Environ. Qual. 2010, 39, 1279–1289. [Google Scholar] [CrossRef]
  15. Chen, H. Dry and Wet Atmospheric Deposition of Nitrogen and Phosphorus in Small Catchment Around Miyun Reservoir. Res. Environ. Sci. 2022, 35, 1419–1431, (In Chinese with English abstract). [Google Scholar]
  16. Zhang, D. Simulation of atmospheric nitrogen deposition in China in 2010. China Environ. Sci. 2014, 34, 1089–1097, (In Chinese with English abstract). [Google Scholar]
  17. Wang, C.; Zhang, X.; Duan, J.; Zhao, Z.; Ti, C.; Wang, G. A-High-Resolution Ammonia Emission Inventory for Cropland and Livestock Production in China. Chin. J. Eco-Agric. 2021, 29, 1973–1980, (In Chinese with English Abstract). [Google Scholar]
  18. Chou, J.; Xu, Y.; Dong, W.; Zhao, W.; Li, J.; Li, Y. An Economy-Climate Model for Quantitatively Projecting the Impact of Future Climate Change and Its Application. Front. Phys. 2021, 9, 723306. [Google Scholar] [CrossRef]
  19. Qi, B.; Fang, C.; Wang, C. Study on assessing total winter-wheat yield based on an economy-climate coupling model in Kunming city. Southwest China J. Agric. Sci. 2013, 26, 2241–2246, (In Chinese with English Abstract). [Google Scholar]
  20. Chou, J. New Ideas for Research on the Impact of Climate Change on China’s Food Security. Clim. Environ. Res. 2022, 27, 206–216, (In Chinese with English Abstract). [Google Scholar]
  21. Li, B. Impact of Climate Change on Rice Yield and Its Regional Heterogeneity in China. Environ. Monit. Assess. 2023, 195, 1156, (In Chinese with English Abstract). [Google Scholar] [CrossRef] [PubMed]
  22. Li, B.; Yan, L.; Zhang, W. Study on N Application and N Reduction Potential of Farmland in China. Env. Monit Assess 2023, 195, 1156. [Google Scholar] [CrossRef]
  23. He, W.; Jiang, R.; He, P.; Yang, J.; Zhou, W.; Ma, J.; Liu, Y. Estimating Soil Nitrogen Balance at Regional Scale in China’s Croplands from 1984 to 2014. Agric. Syst. 2018, 167, 125–135. [Google Scholar] [CrossRef]
  24. Sieling, K.; Kage, H.N. Balance as an Indicator of N Leaching in an Oilseed Rape—Winter Wheat—Winter Barley Rotation. Agric. Ecosyst. Environ. 2006, 115, 261–269. [Google Scholar] [CrossRef]
  25. Ge, Q.; Wang, F.; Luterbacher, J. Improved Estimation of Average Warming Trend of China from 1951–2010 Based on Satellite Observed Land-Use Data. Clim. Change 2013, 121, 365–379. [Google Scholar] [CrossRef]
  26. Jiang, Y. Study on the 60-Year’s Temperature Variation in China on Multiple Time Scales. Ecol. Environ. Sci. 2010, 10, 2017–2022, (In Chinese with English abstract). [Google Scholar]
  27. Ma, J.; Liu, Y.; Yang, X.; Wang, W.; Xue, C.; Zhang, X. Characteristics of climate resources under global climate change in the North China Plain. Acta Ecol. Sin. 2010, 30, 3818–3827, (In Chinese with English abstract). [Google Scholar]
  28. Li, S. Characteristics of drought events and their impacts on vegetation in Northern China from 1982 to 2019. Res. Soil Water Conserv. 2023, 30, 251–259, (In Chinese with English abstract). [Google Scholar]
  29. Peng, Y.; Xia, J.; Ren, H. The variations of rainfall belt and its impact in China. China Rural. Water Hydropower 2015, 5, 45–48, (In Chinese with English abstract). [Google Scholar]
  30. A, D.; Zhao, W.; Qu, X.; Jing, R.; Xiong, K. Spatio-Temporal Variation of Vegetation Coverage and Its Response to Climate Change in North China Plain in the Last 33 Years. Int. J. Appl. Earth Obs. Geoinf. 2016, 53, 103–117. [Google Scholar] [CrossRef]
  31. Zhao, Y.; Xiao, D.; Bai, K.; Tao, F. Research progress on the response and adaptation of crop phenology to climate change in China. Prog. Geogr. 2019, 38, 224–235. [Google Scholar] [CrossRef]
  32. Chen, C.; Lu, W.; Sun, X.; Yu, H. Regional Differences of Winter Wheat Phenophase and Grain Yields Response to Global Warming in the Huang-Huai-Hai Plain in China Since 1980s. Int. J. Plant Prod. 2018, 12, 33–41. [Google Scholar] [CrossRef]
  33. Schlenker, W.; Roberts, M.J. Nonlinear Temperature Effects Indicate Severe Damages to U.S. Crop Yields under Climate Change. Proc. Natl. Acad. Sci. USA 2009, 106, 15594–15598. [Google Scholar] [CrossRef]
  34. Jiang, R.; He, W.; He, L.; Yang, J.Y.; Qian, B.; Zhou, W.; He, P. Modelling Adaptation Strategies to Reduce Adverse Impacts of Climate Change on Maize Cropping System in Northeast China. Sci. Rep. 2021, 11, 810. [Google Scholar] [CrossRef]
  35. Hui, H.; Lin, Q.; Liu, Y.; Zhang, H. Effect of irrigation on sugar content in flag leaf and grain, and yield of super-high-yield wheat at grain-filling stage. J. Triticeae Crops 2011, 31, 887–893, (In Chinese with English abstract). [Google Scholar]
  36. Tian, H.; Yang, J.; Xu, R.; Lu, C.; Canadell, J.G.; Davidson, E.A.; Jackson, R.B.; Arneth, A.; Chang, J.; Ciais, P.; et al. Global Soil Nitrous Oxide Emissions since the Preindustrial Era Estimated by an Ensemble of Terrestrial Biosphere Models: Magnitude, Attribution, and Uncertainty. Glob. Change Biol. 2019, 25, 640–659. [Google Scholar] [CrossRef]
  37. Mao, X.; Yin, S.; Liu, H. Analysis of agrometeorological disasters facing extreme climate events in Hebei, Shandong, and Henan provinces. Res. Soil Water Conserv. 2023, 30, 327–337, (In Chinese with English abstract). [Google Scholar]
  38. Tan, Z.; Leung, L.R.; Li, H.-Y.; Tesfa, T.; Zhu, Q.; Yang, X.; Liu, Y.; Huang, M. Increased Extreme Rains Intensify Erosional Nitrogen and Phosphorus Fluxes to the Northern Gulf of Mexico in Recent Decades. Environ. Res. Lett. 2021, 16, 054080. [Google Scholar] [CrossRef]
  39. Zhang, Q.; Li, T.; Yin, Y.; Ying, H.; Cui, Z.; Zhang, F. Targeting Hotspots to Achieve Sustainable Nitrogen Management in China’s Smallholder-Dominated Cereal Production. Agronomy 2021, 11, 557. [Google Scholar] [CrossRef]
  40. Wang, G.; Xu, H.; Huang, K.; Wang, J.; Zhao, H.; Qian, X.; Wang, J. Concurrent Response of Greenhouse Soil NO3− Concentration and N2O Emissions to Nitrogen and Irrigation Management in China: A Meta-Analysis. Agronomy 2024, 14, 1387. [Google Scholar] [CrossRef]
  41. Wang, Z.; Nie, T.; Lu, D.; Zhang, P.; Li, J.; Li, F.; Zhang, Z.; Chen, P.; Jiang, L.; Dai, C.; et al. Effects of Different Irrigation Management and Nitrogen Rate on Sorghum (Sorghum bicolor L.) Growth, Yield and Soil Nitrogen Accumulation with Drip Irrigation. Agronomy 2024, 14, 215. [Google Scholar] [CrossRef]
  42. Kaur, A.; Singh, K.B.; Gupta, R.K.; Alataway, A.; Dewidar, A.Z.; Mattar, M.A. Interactive Effects of Nitrogen Application and Irrigation on Water Use, Growth and Tuber Yield of Potato under Subsurface Drip Irrigation. Agronomy 2022, 13, 11. [Google Scholar] [CrossRef]
  43. Lu, J.; Hu, T.; Li, Y.; Cui, X.; Cheng, M.; Yan, S.; Xiang, Y.; Fan, J.; Zhang, F.; Xiong, Y. Effects of Different Water Management Strategies on Critical Nitrogen Concentration Dilution Curves, Nitrogen Accumulation, and Grain Yield in Winter Wheat. Agric. Commun. 2024, 2, 100052. [Google Scholar] [CrossRef]
  44. Thapa, V.R.; Ghimire, R.; Marsalis, M.A. Cover Crops for Resilience of a Limited-Irrigation Winter Wheat–Sorghum–Fallow Rotation: Soil Carbon, Nitrogen, and Sorghum Yield Responses. Agronomy 2021, 11, 762. [Google Scholar] [CrossRef]
  45. Zhang, F.; Zhang, Z.; Heng, T.; He, X. Optimizing Cotton Irrigation Strategies in Arid Regions Under Water–Salt–Nitrogen Interactions and Projected Climate Impacts. Agronomy 2025, 15, 1305. [Google Scholar] [CrossRef]
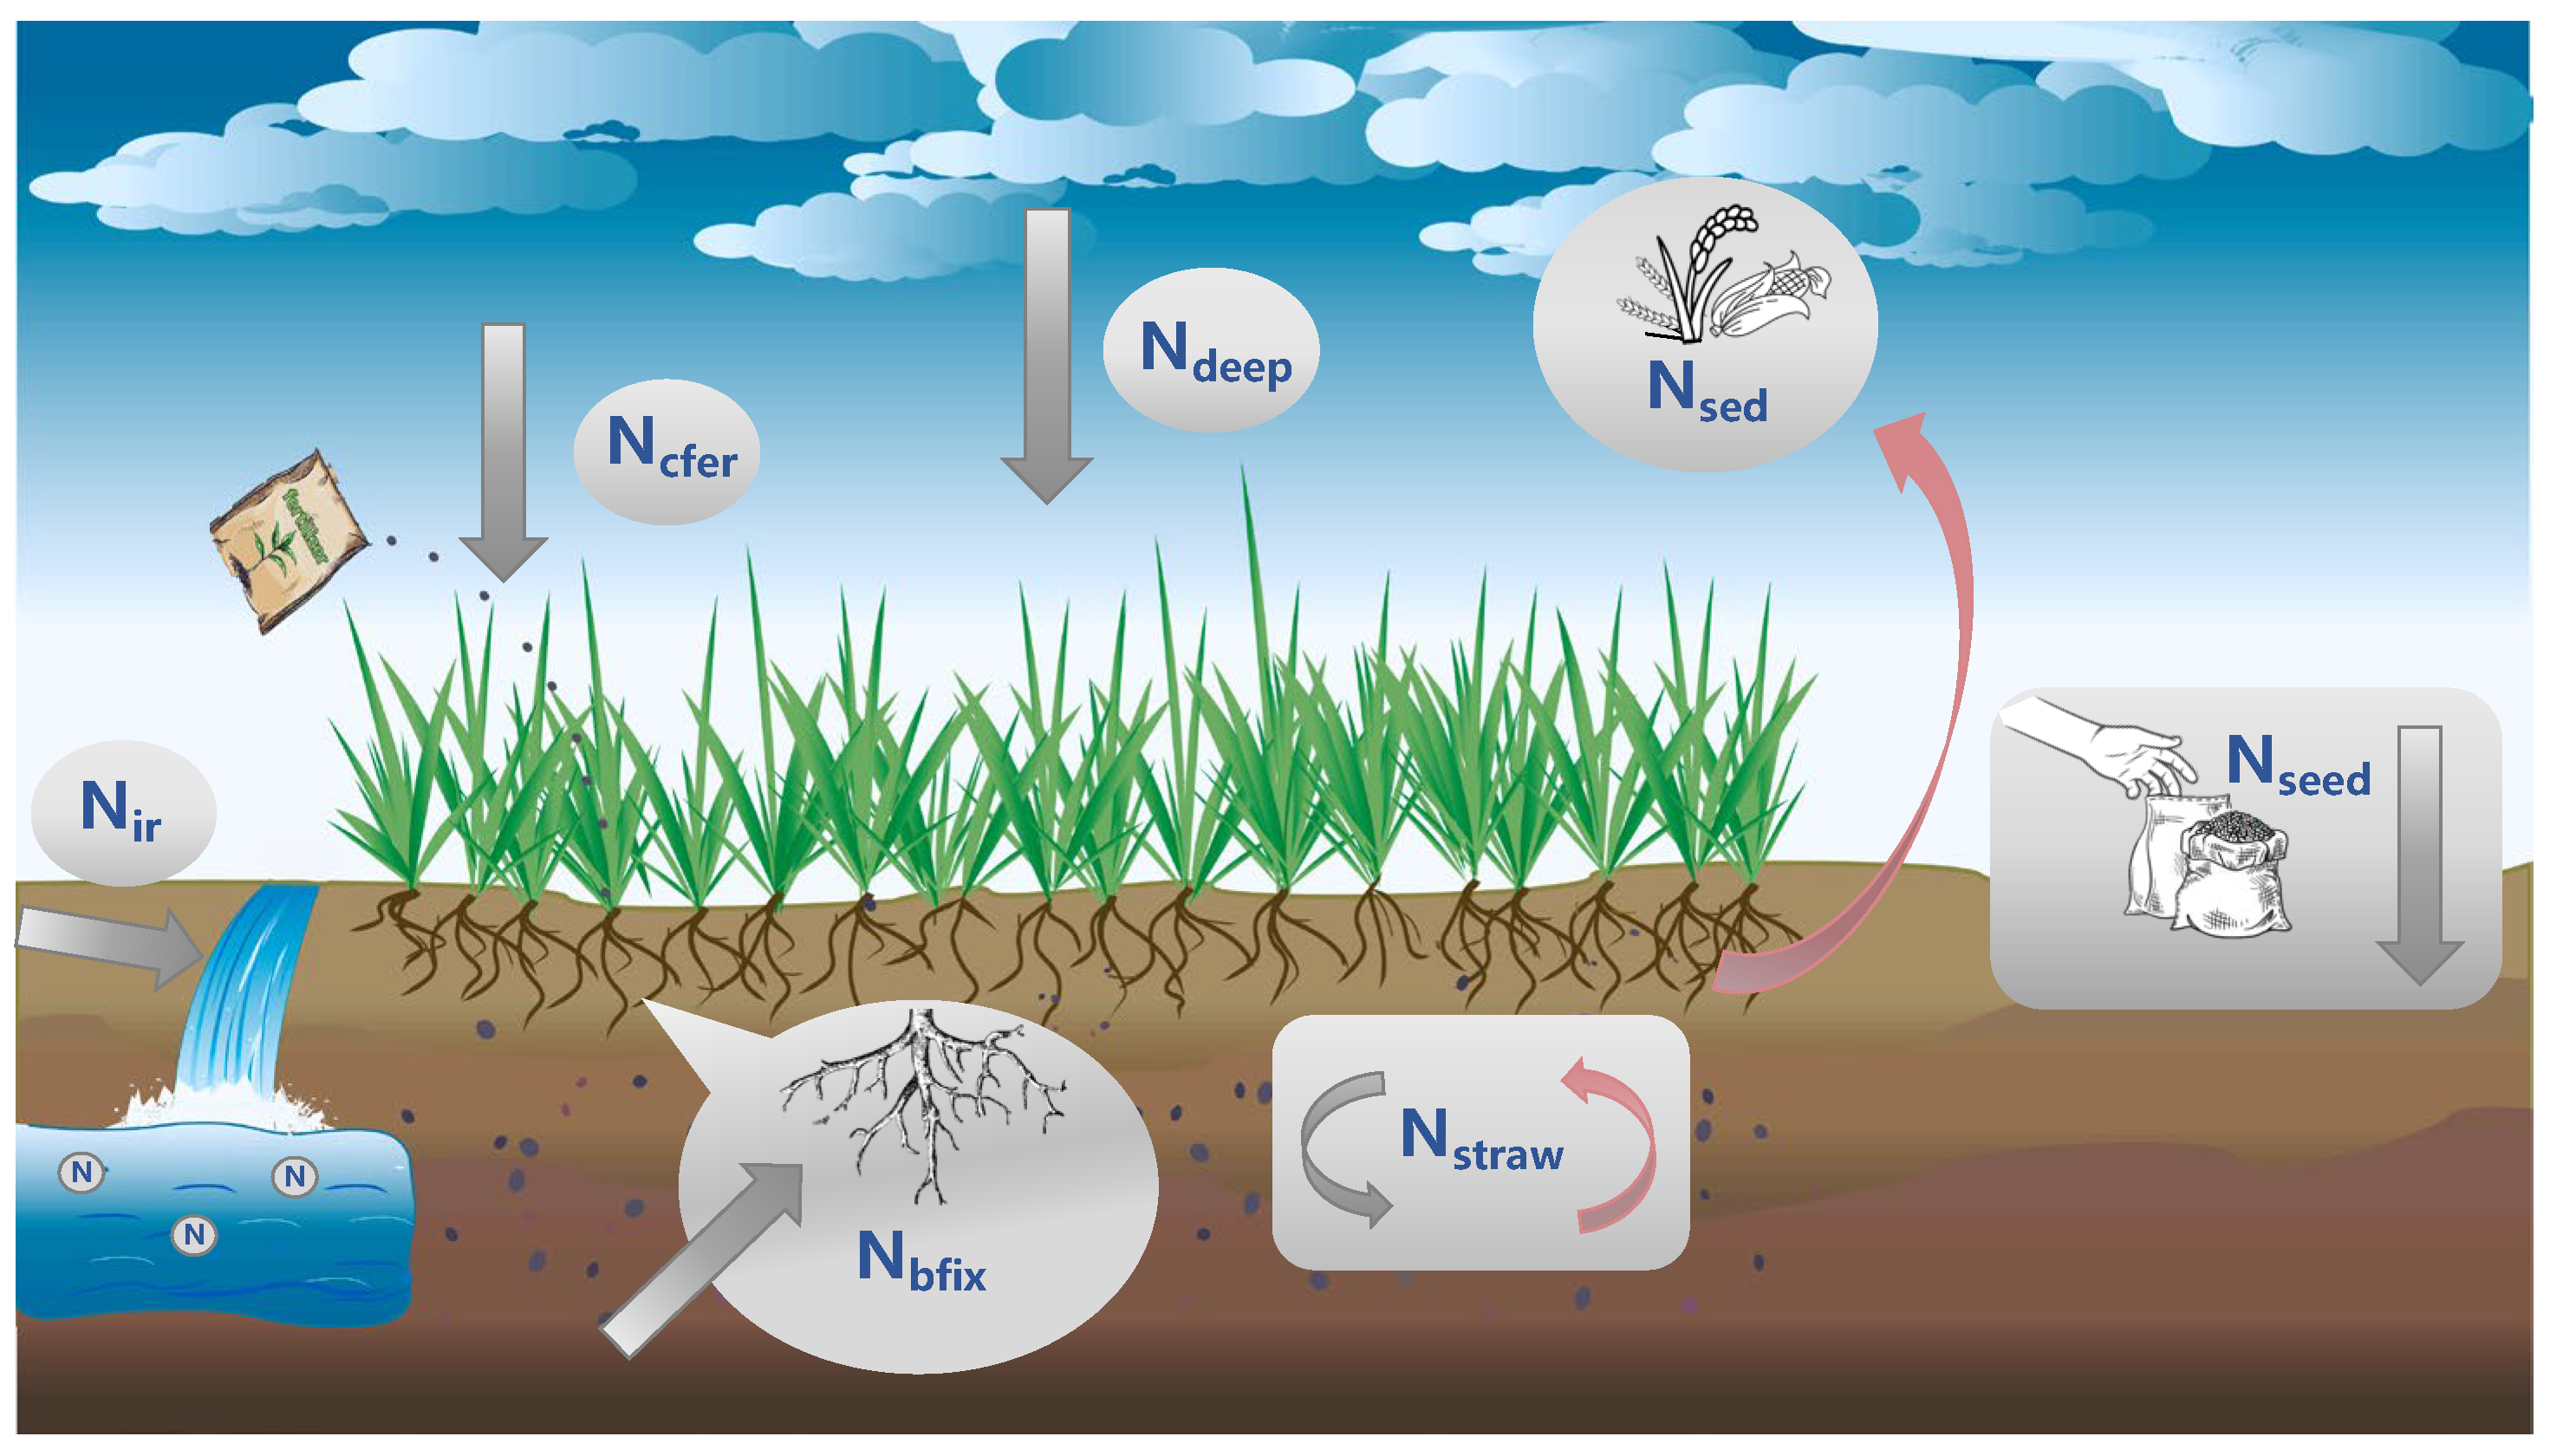
Figure 1. The source and destination of nitrogen surplus in agricultural lands. The figure depicts the output and input factors of the nitrogen surplus in agricultural lands. Grey arrows represent on-farm nutrient inputs and red arrows represent on-farm nutrient outputs.
Agronomy 15 01908 g001
Figure 2. Change of average temperature in China from 2000 to 2020. (a) Temporal trends of average annual temperature across the seven major natural geographical regions; (b) spatial distribution of temperature variations throughout China during the study period, illustrating regional differences in warming patterns.
Agronomy 15 01908 g002
Figure 3. Change of average rainfall in China from 2000 to 2020. (a) Temporal variation in average annual rainfall across the seven major natural geographical regions of China; (b) spatial distribution of rainfall changes over the study period, reflecting regional disparities in precipitation patterns.
Agronomy 15 01908 g003
Figure 4. Change of grain yield in China from 2000 to 2020. (a) Temporal trends of grain yield across the seven major natural geographical regions; (b) spatial distribution of grain yield changes across China over the study period, highlighting regional variability in agricultural productivity.
Agronomy 15 01908 g004
Figure 5. Changes in nitrogen surplus intensity in China from 2000 to 2020. (a) Temporal trends of nitrogen surplus intensity across the seven major natural geographical regions; (b) spatial distribution of nitrogen surplus intensity changes throughout China during the study period, illustrating regional variations in nitrogen pollution levels.
Agronomy 15 01908 g005
Table 1. Model results of impacts of climate change on grain yield in different regions.
Independent VariableNorthern
China
Northeast
China
Eastern
China
Central
China
Southern
China
Southwest
China
Northwest
China
CoefficientCoefficientCoefficientCoefficientCoefficientCoefficientCoefficient
ln(A)7,327,655 **5,681,065 *5,161,1181,144,625−1,027,137 **343,466−2,753,201
ln(B)5218.252 *2673.781−506.584−854.947354.975 **6912.8061137.686
ln(C)0.0940.2000.137 ***0.0730.236 ***0.152 **0.135 **
ln(D)12.2364.2848.0288.349 ***6.6590.8823.557
ln(E)−0.012 *0.006−0.002−0.001−0.007 **0.002−0.006
R20.9960.9950.9930.9950.9690.9810.884
AdjR20.9930.9910.9870.9900.9380.9630.769
Note: ***, **, and * represent 1%, 5%, and 10% significance levels. The dependent variable is nitrogen surplus (tons), and all independent variables were log-transformed prior to regression. Variable definitions and units are as follows: A denotes annual average temperature (°C), B is annual average rainfall (mm), Y represents grain yield (tons), D is the area of land used for crop cultivation (hectares), and E is nitrogen fertilizer application (104 tons). The coefficients indicate the elasticities of nitrogen surplus with respect to each variable in each region.
Table 2. Impacts of climate change on grain yield.
Northern
China
Northeast
China
Eastern ChinaCentral ChinaSouthern
China
Southwest
China
Northwest
China
The temperature rises by
1 °C
3.05%2.44%2.99%0.93%−1.22%0.42%−15.70%
Rainfall increased by 100
mm
0.21%0.11%−0.02%−0.06%0.04%0.86%0.64%
Table 3. Model results of effects of climate change on nitrogen surplus in different regions.
Independent VariableNorthern ChinaNortheast
China
Eastern ChinaCentral ChinaSouthern
China
Southwest
China
Northwest
China
CoefficientCoefficientCoefficientCoefficientCoefficientCoefficientCoefficient
ln(A)−556,573,960 **−38,589,402 *−519,937,268 *−90,985,481−4,386,974 **31,888,514 *26,928,862
ln(B)−376,799 **−20,8431770−13,6331681 ***−5617−139,624 **
ln(Y)−10.383 **−0.2227−12.530−13.603 **−0.0224−3.236−5.893
ln(D)−253.457 **20.035176.75 **202.995 **31.07259.221 **81.627 **
ln(E)0.995 **−0.0590.9931 **0.616 **−0.053 **0.3120.404
R20.8450.6990.9560.8890.9960.9930.995
AdjR20.6900.3990.9130.7790.9930.9870.990
Note: ***, **, and * represent 1%, 5%, and 10% significance level. The dependent variable is nitrogen surplus (tons), and all independent variables were log-transformed prior to regression. Variable definitions and units are as follows: A denotes annual average temperature (°C), B is annual average rainfall (mm), Y represents grain yield (tons), D is the area of land used for crop cultivation (hectares), and E is nitrogen fertilizer application (104 tons). The coefficients indicate the elasticities of nitrogen surplus with respect to each variable in each region.
Table 4. Impacts of climate change on nitrogen surplus.
Northern
China
Northeast
China
Eastern ChinaCentral ChinaSouthern
China
Southwest
China
Northwest
China
The temperature rises by
1 °C
3.05%2.44%2.99%0.93%−1.22%0.42%−15.70%
Rainfall increased by 100
mm
0.39%0.38%0%−0.07%0.10%−0.03%−1.13%
Disclaimer/Publisher’s Note: The statements, opinions and data contained in all publications are solely those of the individual author(s) and contributor(s) and not of MDPI and/or the editor(s). MDPI and/or the editor(s) disclaim responsibility for any injury to people or property resulting from any ideas, methods, instructions or products referred to in the content.