
Predicting De-Handing Point in Bananas Using Crown Morphology and Interpretable Machine Learning


Abstract
1. Introduction
2. Materials and Methods
2.1. A Systematic Workflow for Modeling Banana Crown De-Handing
2.2. Banana Crown Morphology Data Collection
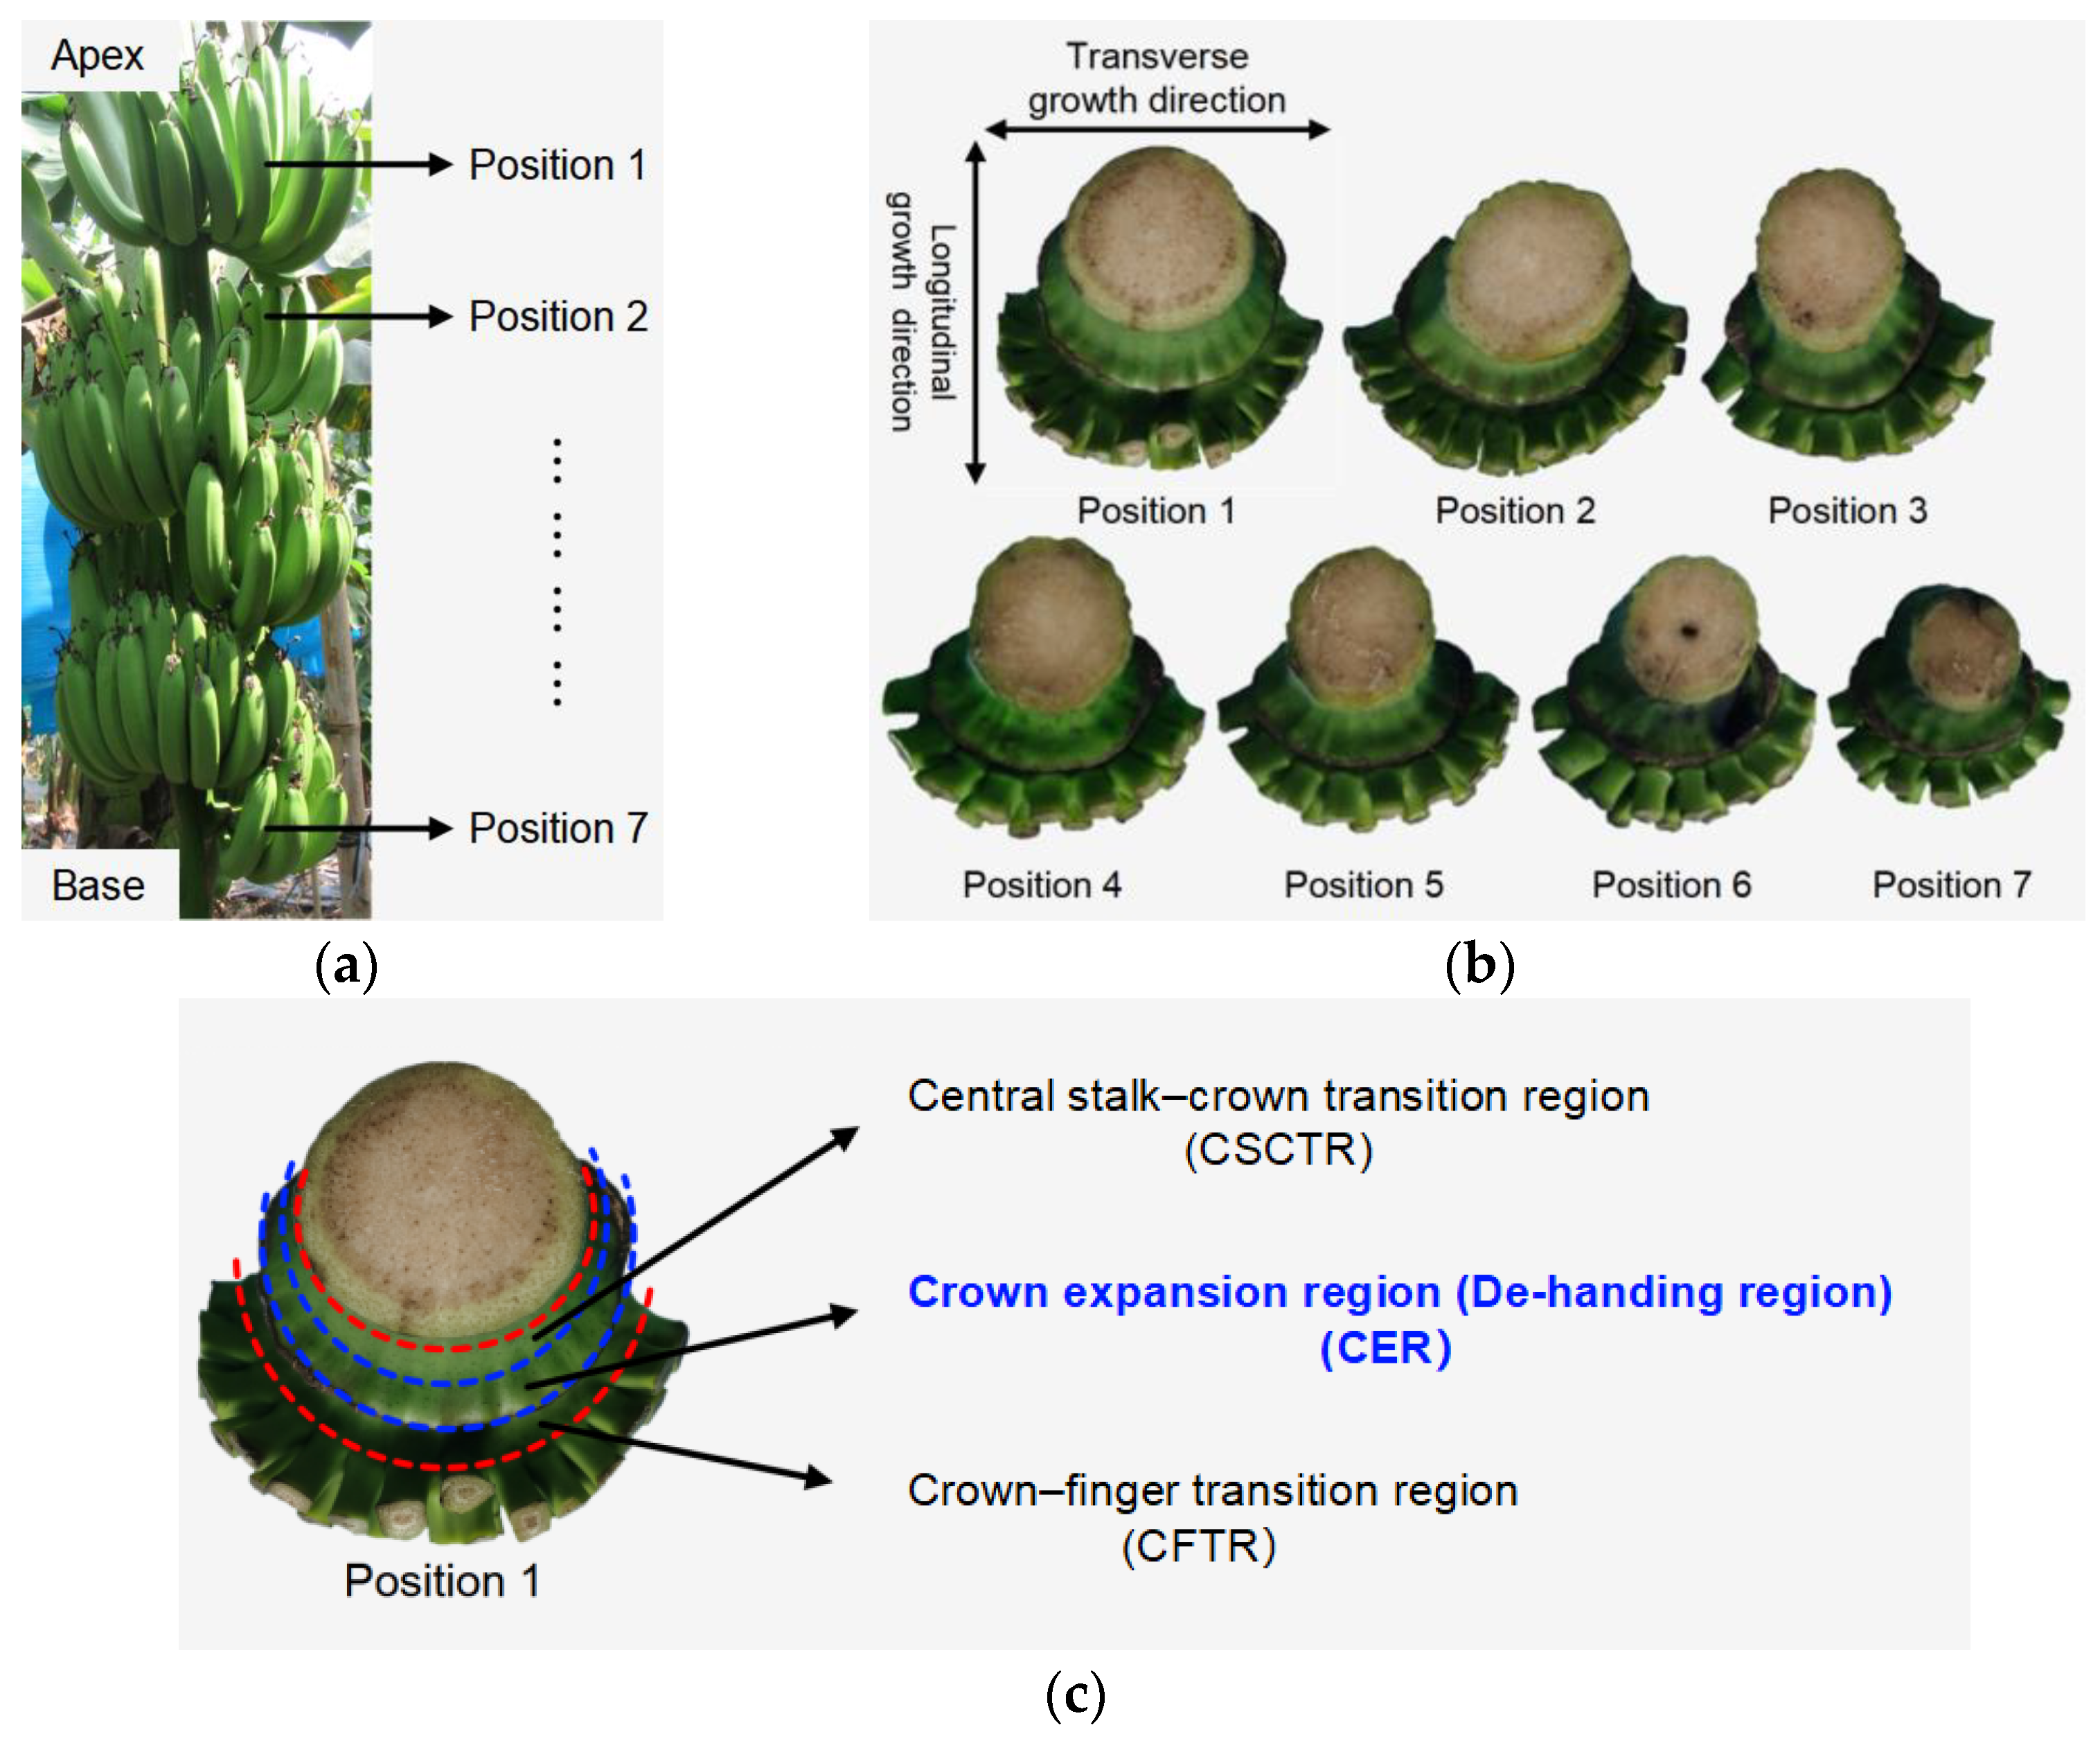
2.2.1. Crown Sample Preparation
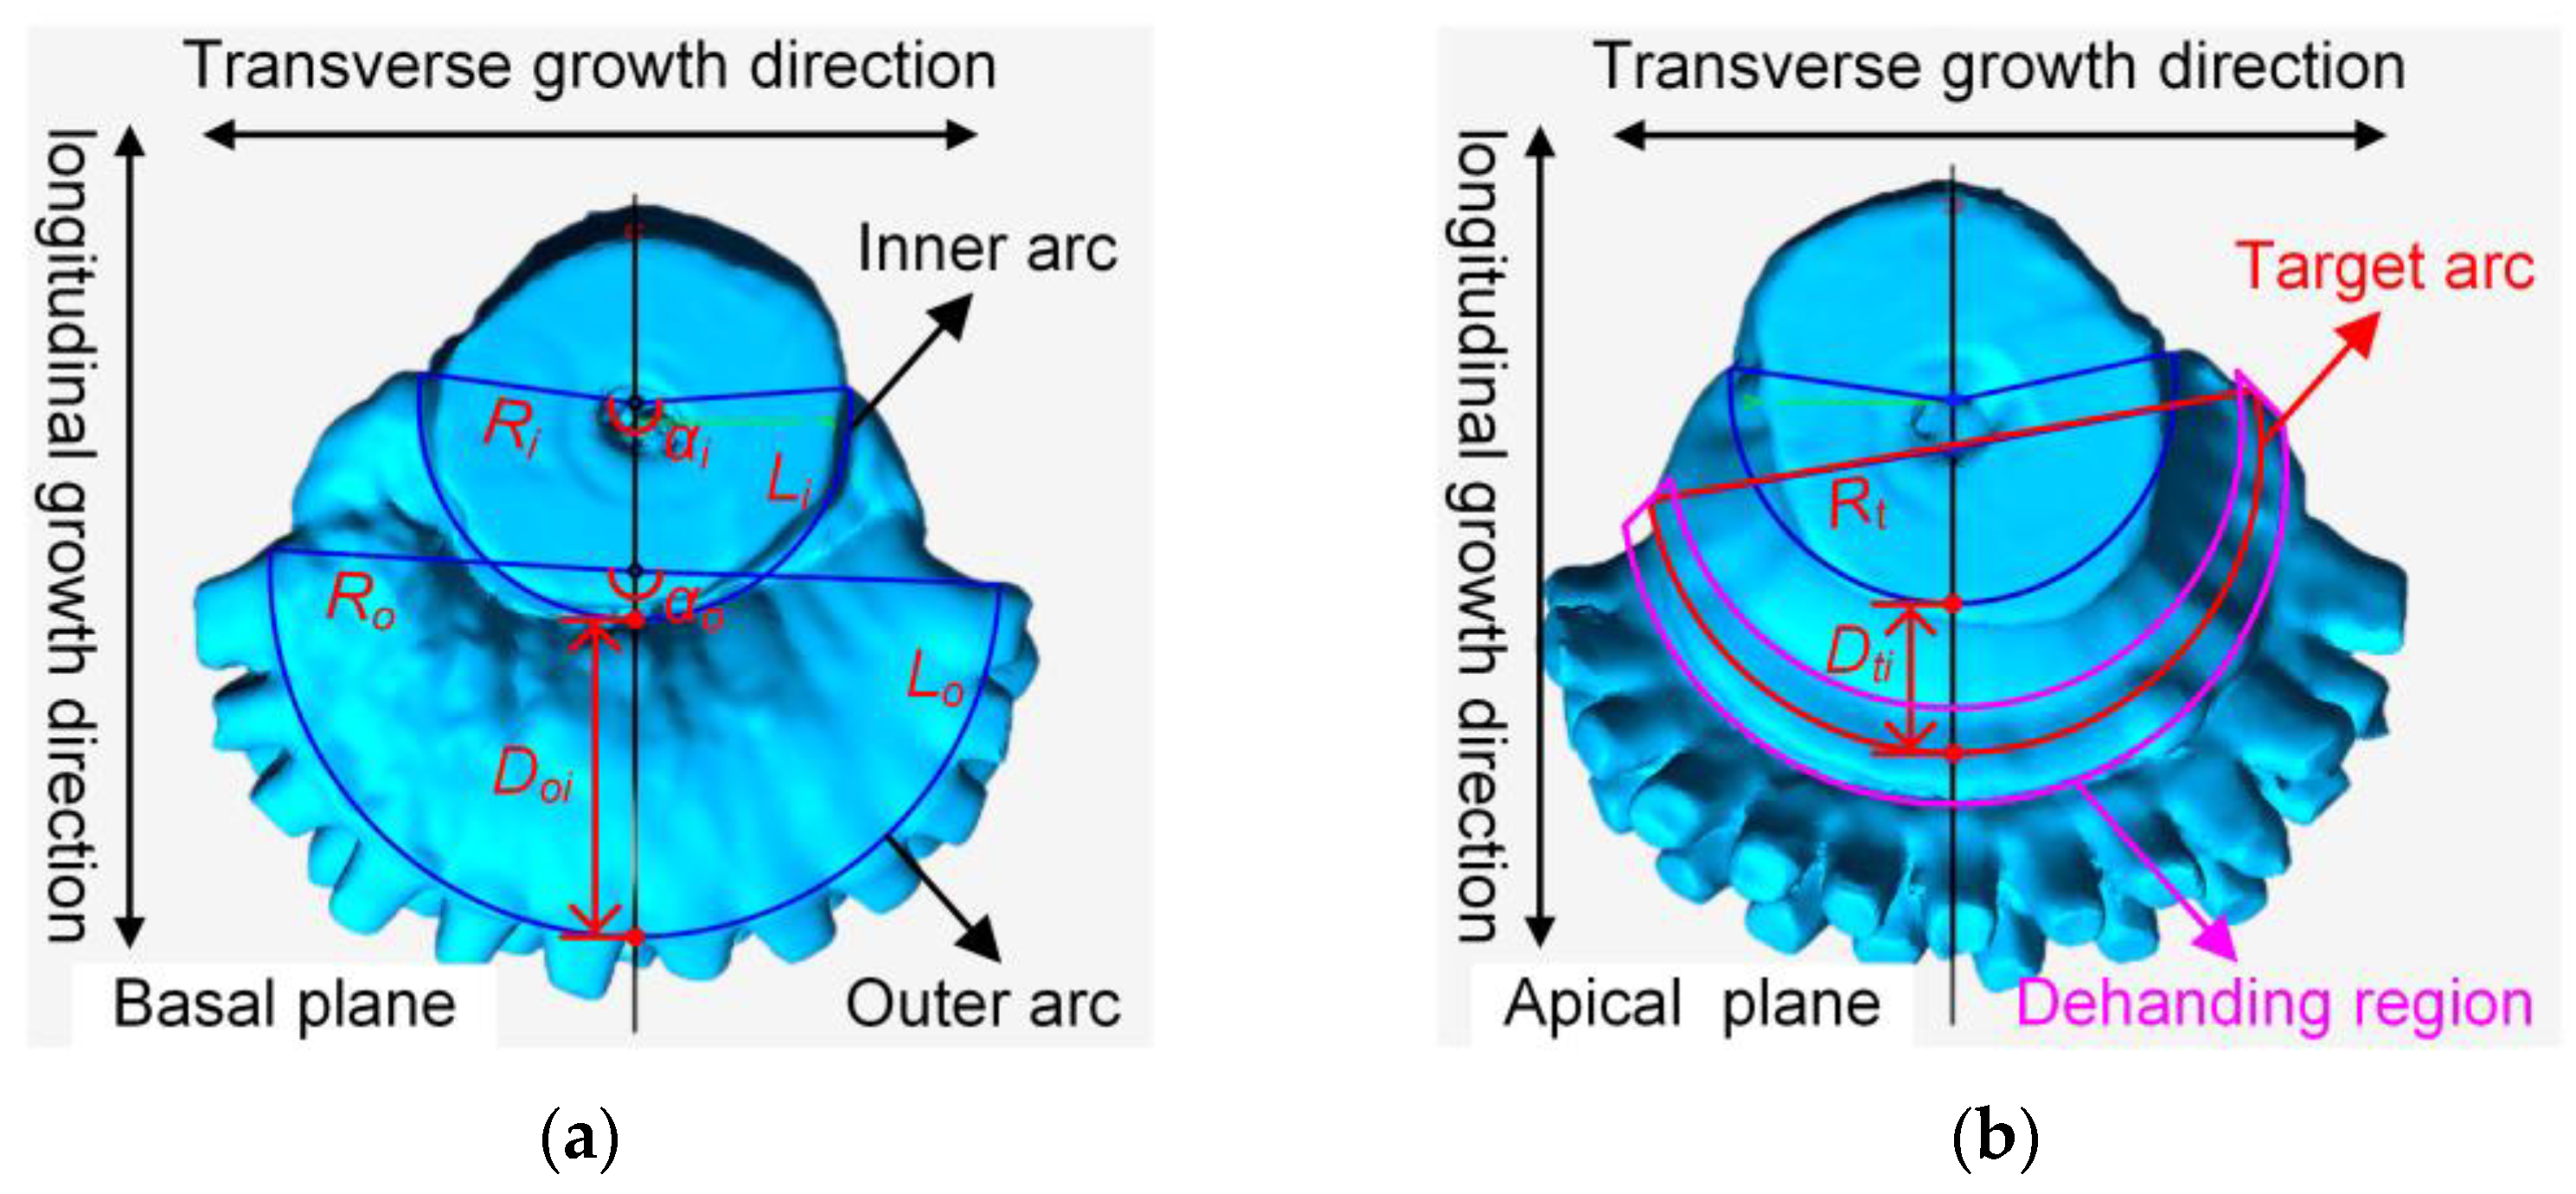
2.2.2. Extraction and Measurement of Crown Morphological Features
2.3. Machine Learning Algorithms and Hyperparameter Tuning
2.4. De-Handing Point Model Training and Evaluation
2.5. De-Handing Point Model Interpretation
3. Results
3.1. Banana Crown Morphometric Measurement Data
3.2. Hyperparameter Optimization for De-Handing Point Models
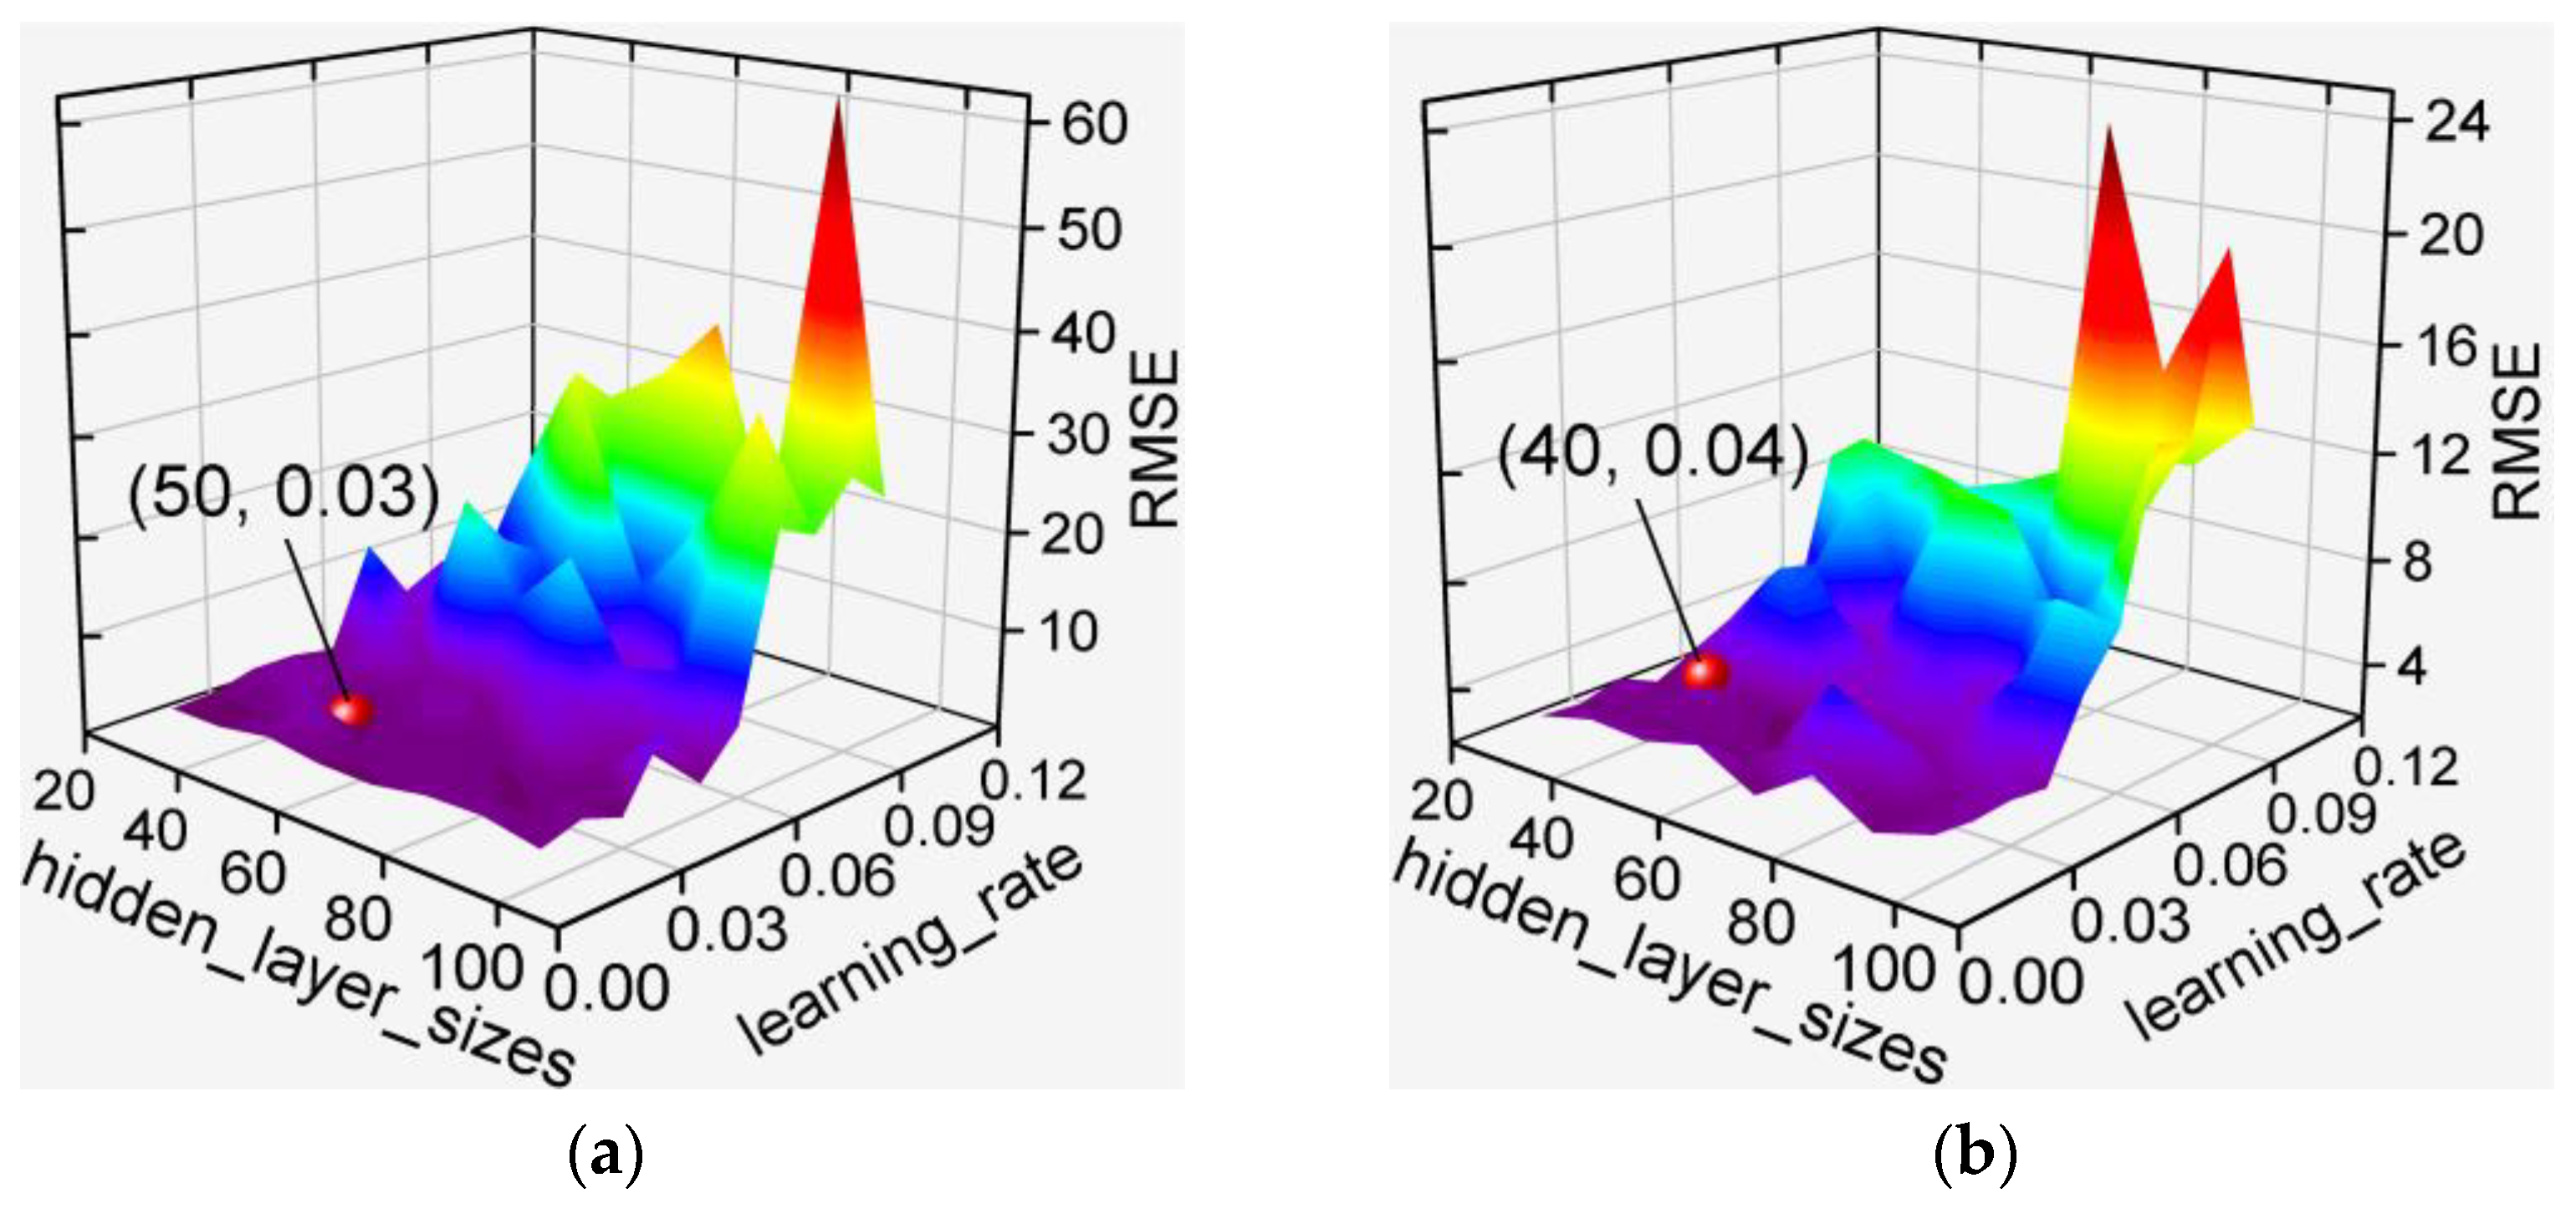
3.2.1. MLP-Based Models
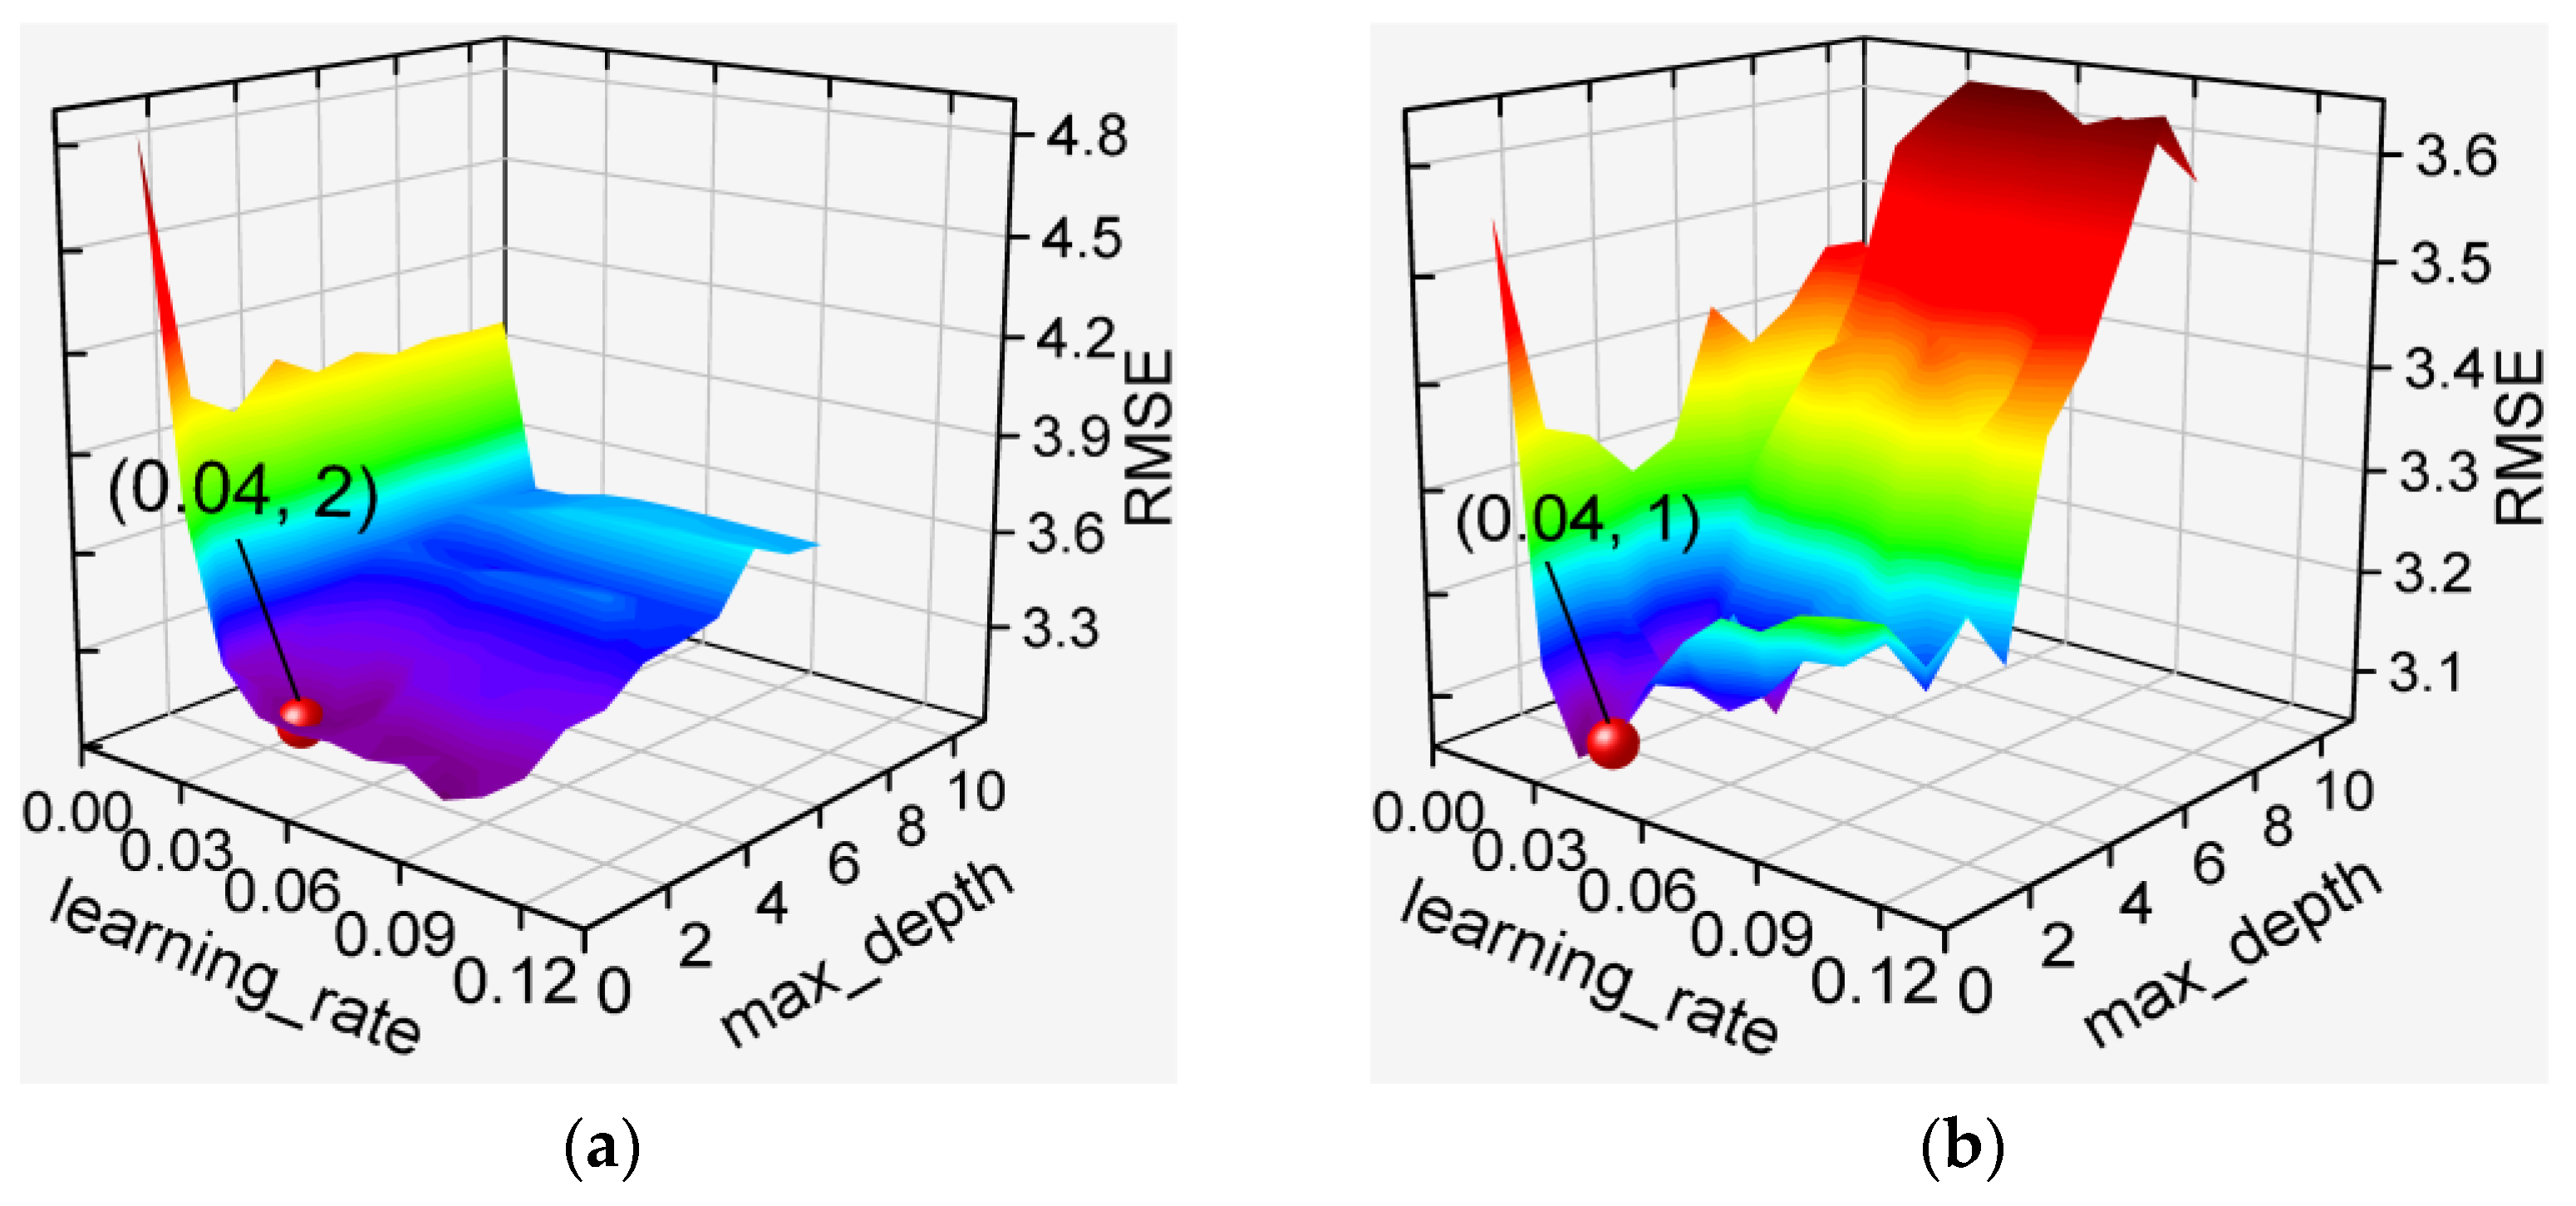
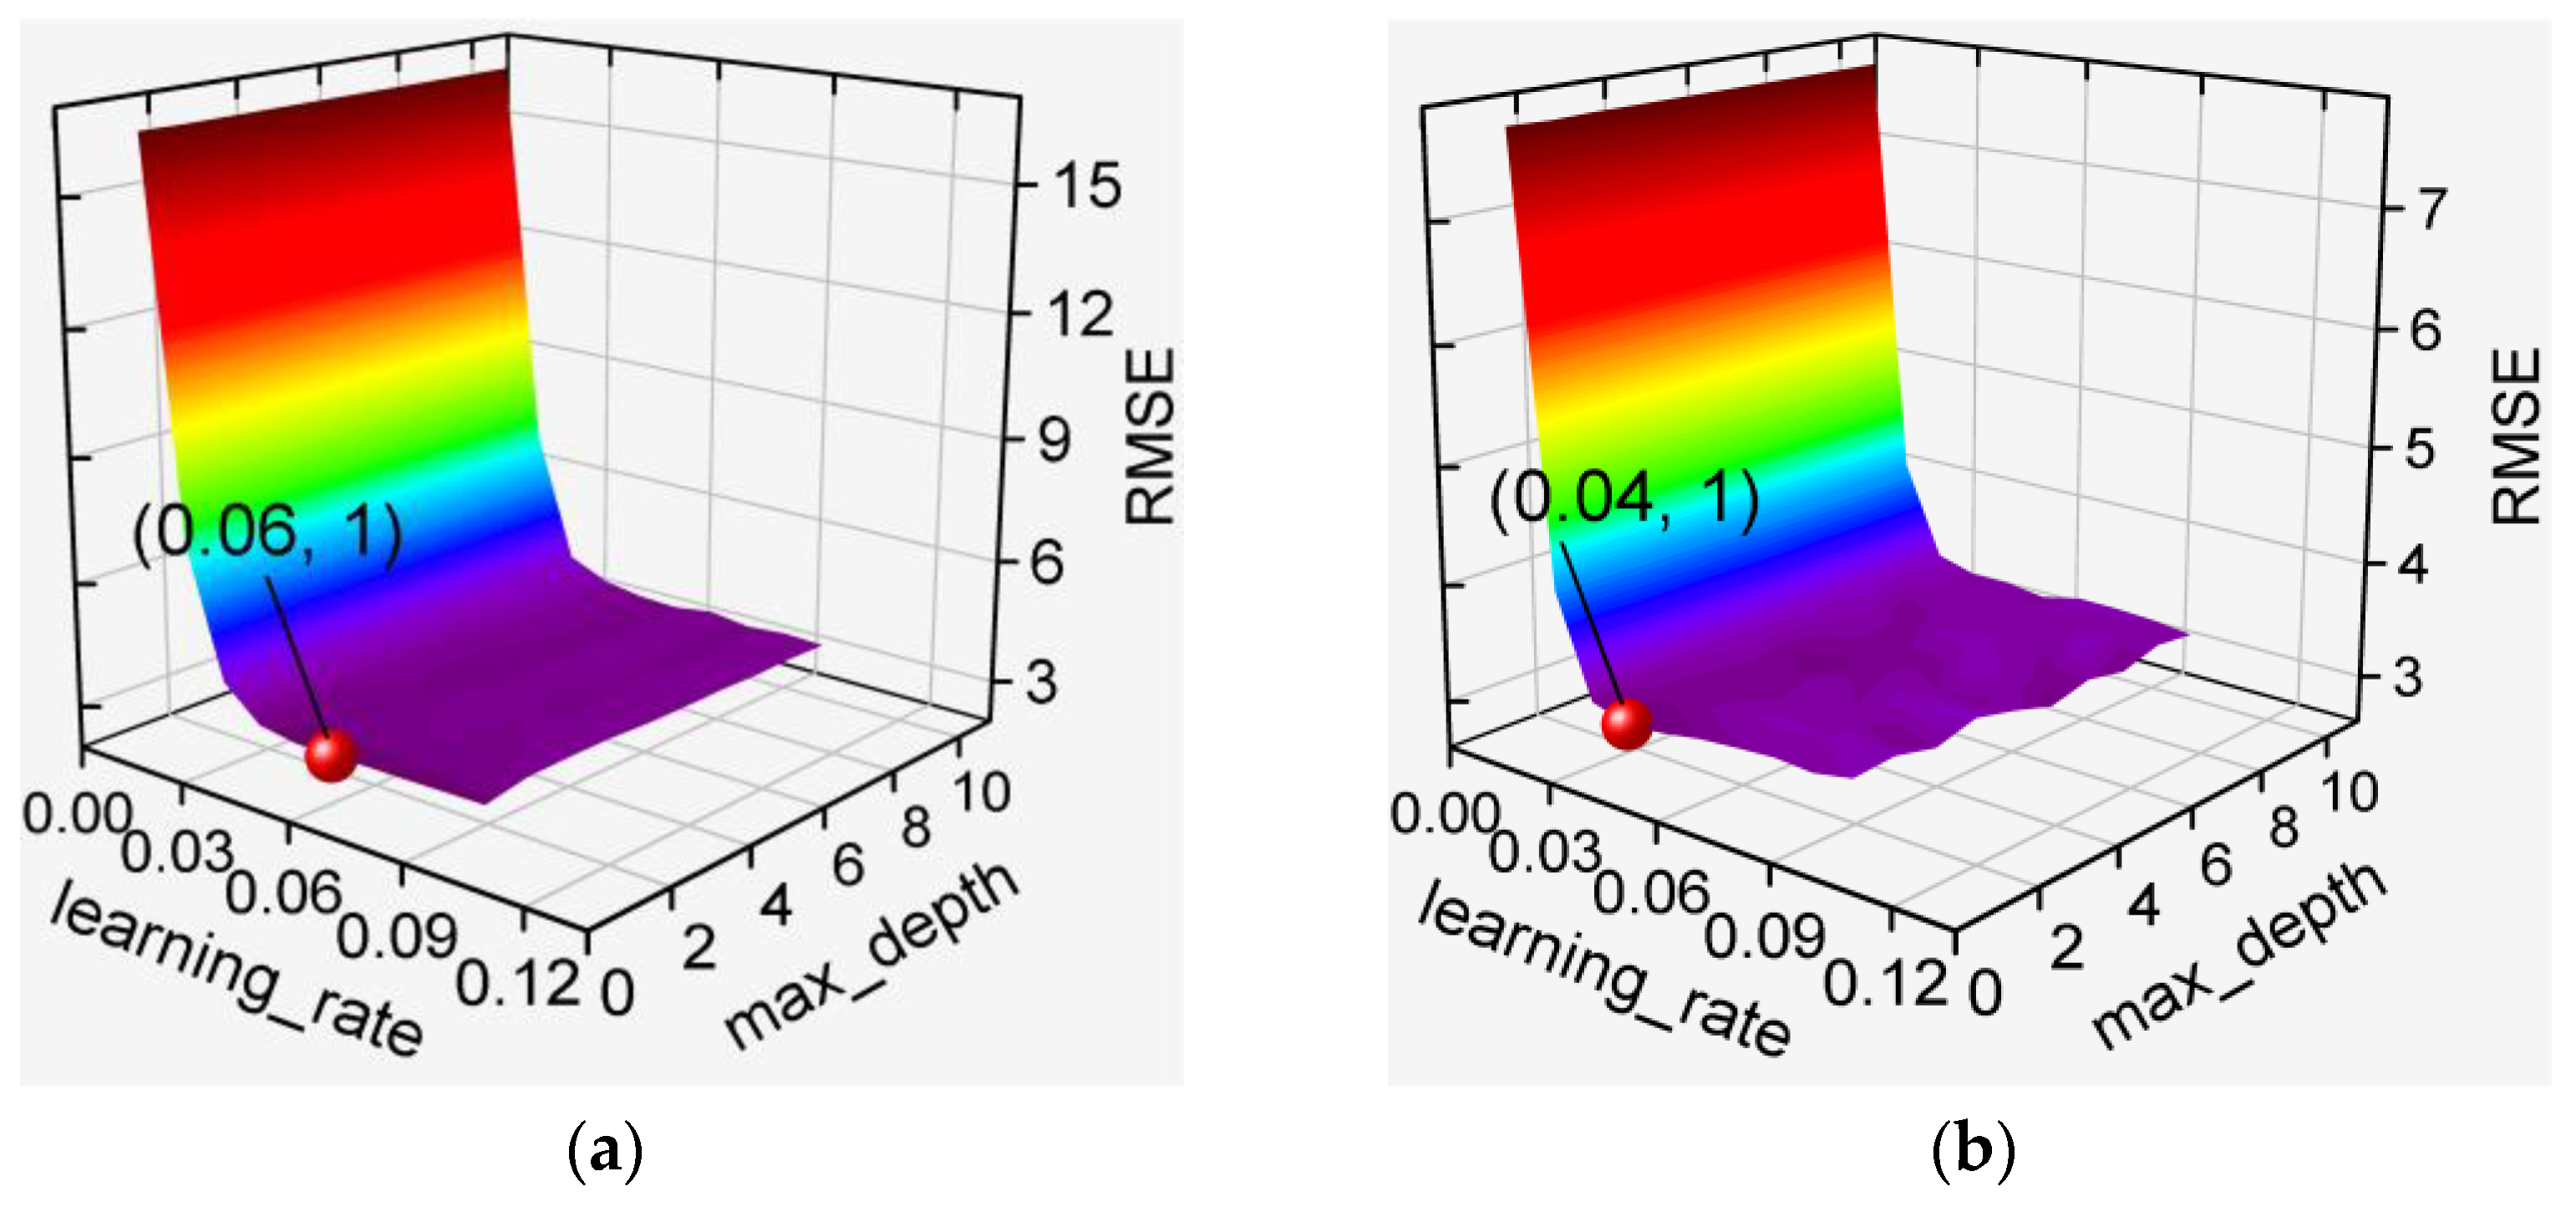
3.2.2. GBDT-Based and XGBoost-Based Models
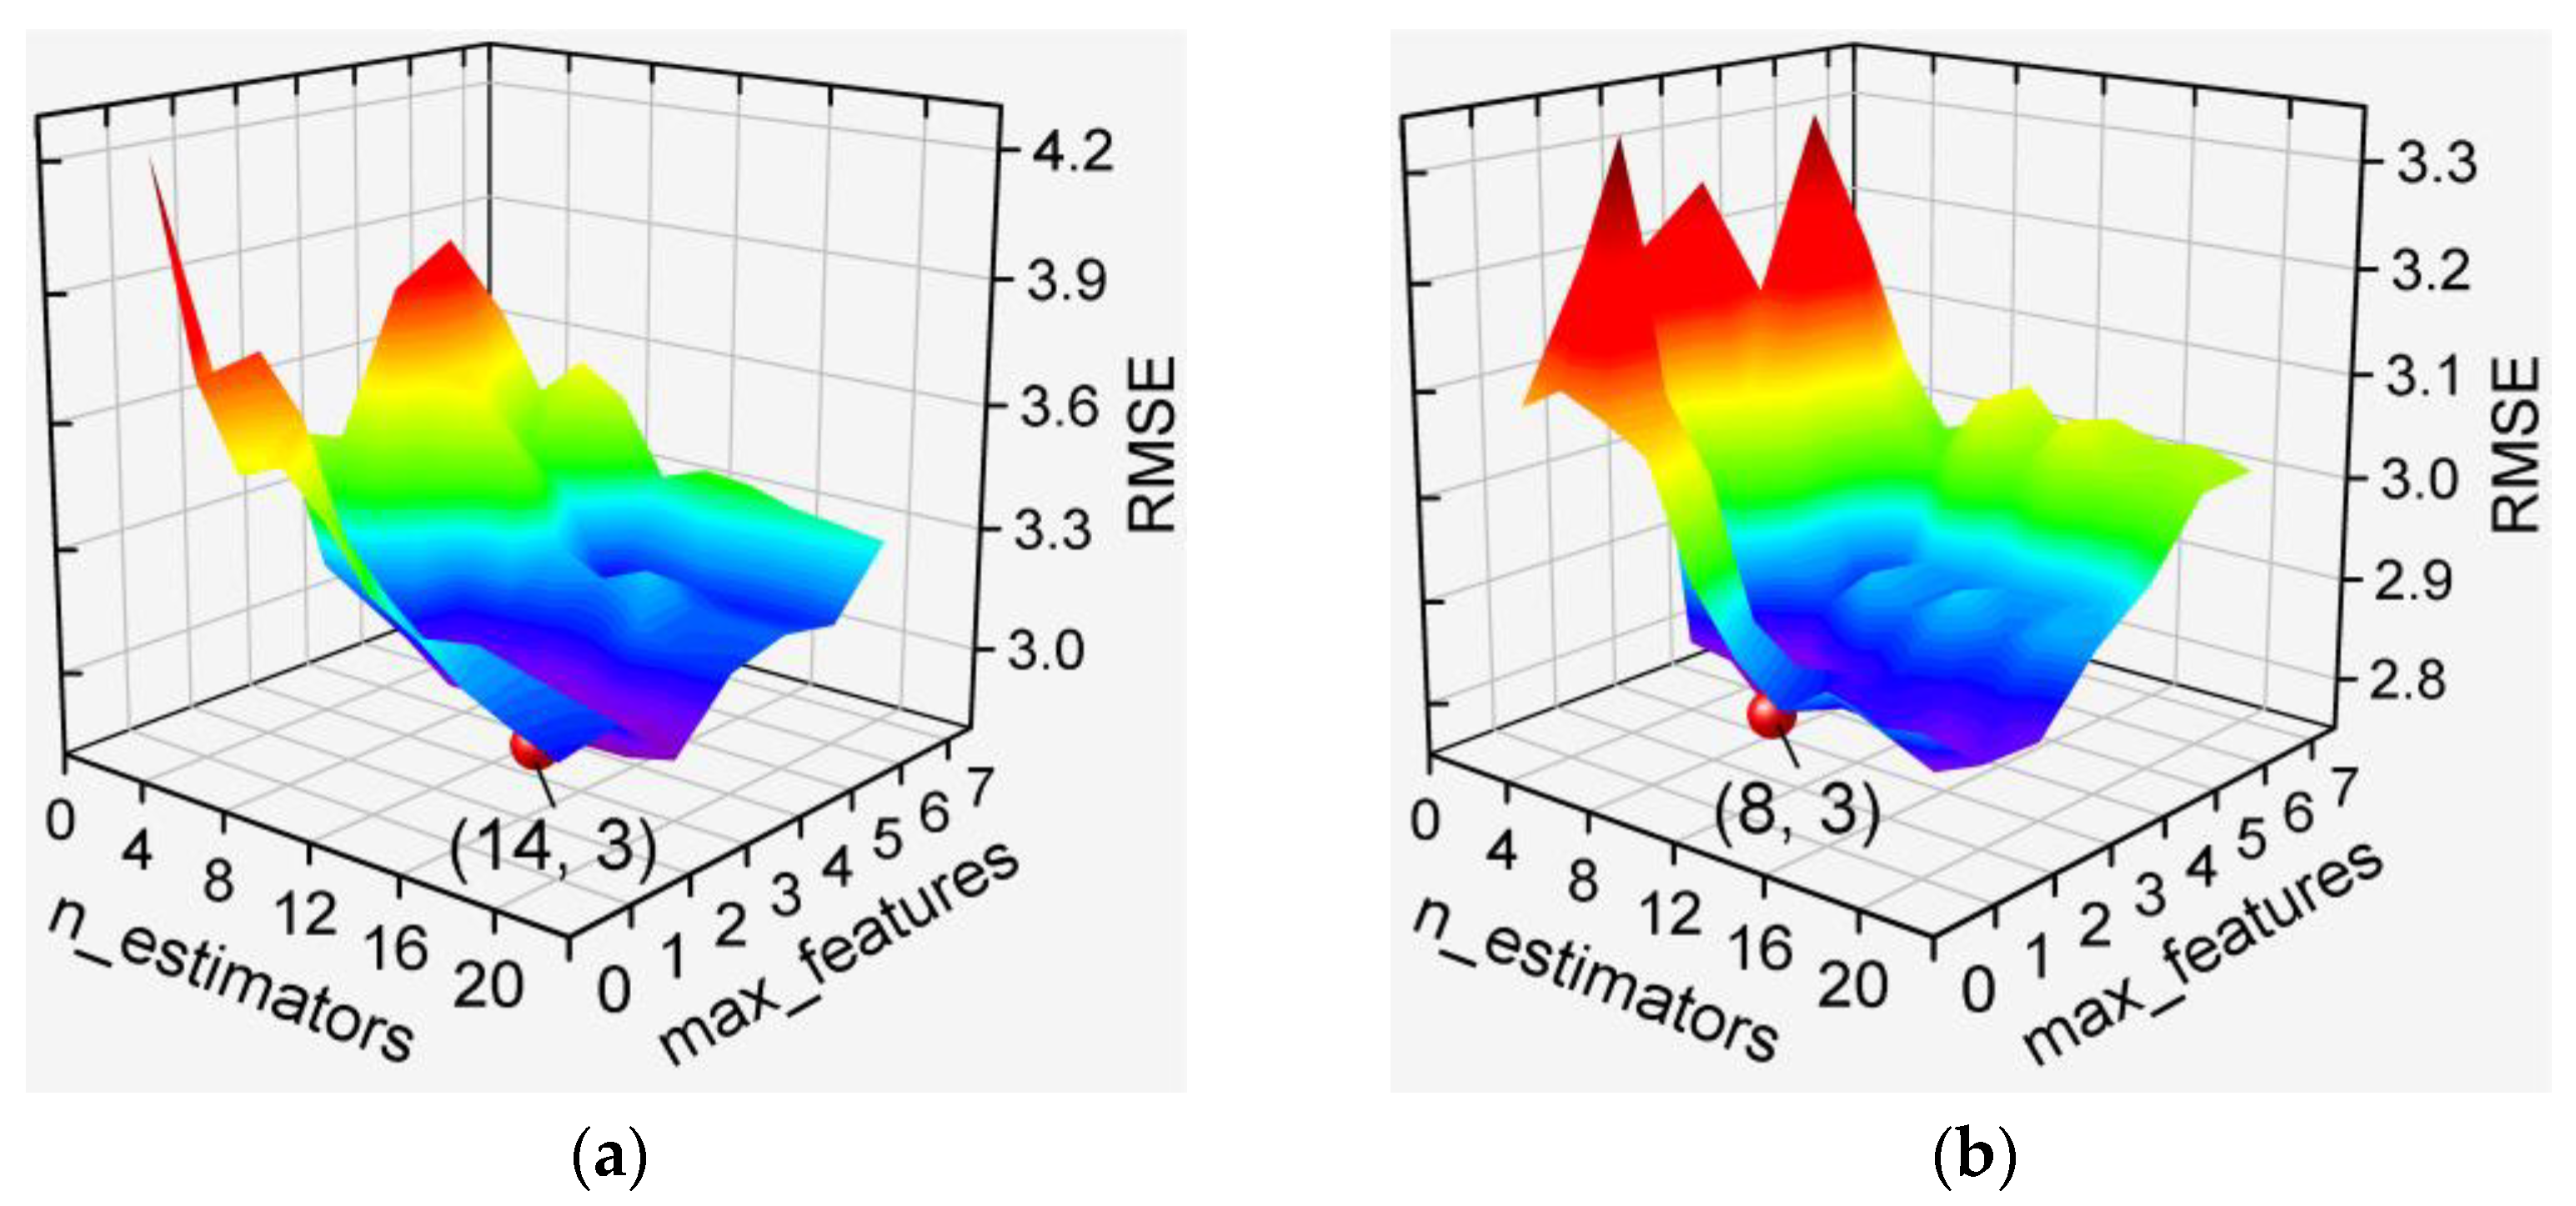
3.2.3. RF-Based Models
3.3. Performance Evaluation of De-Handing Point Models
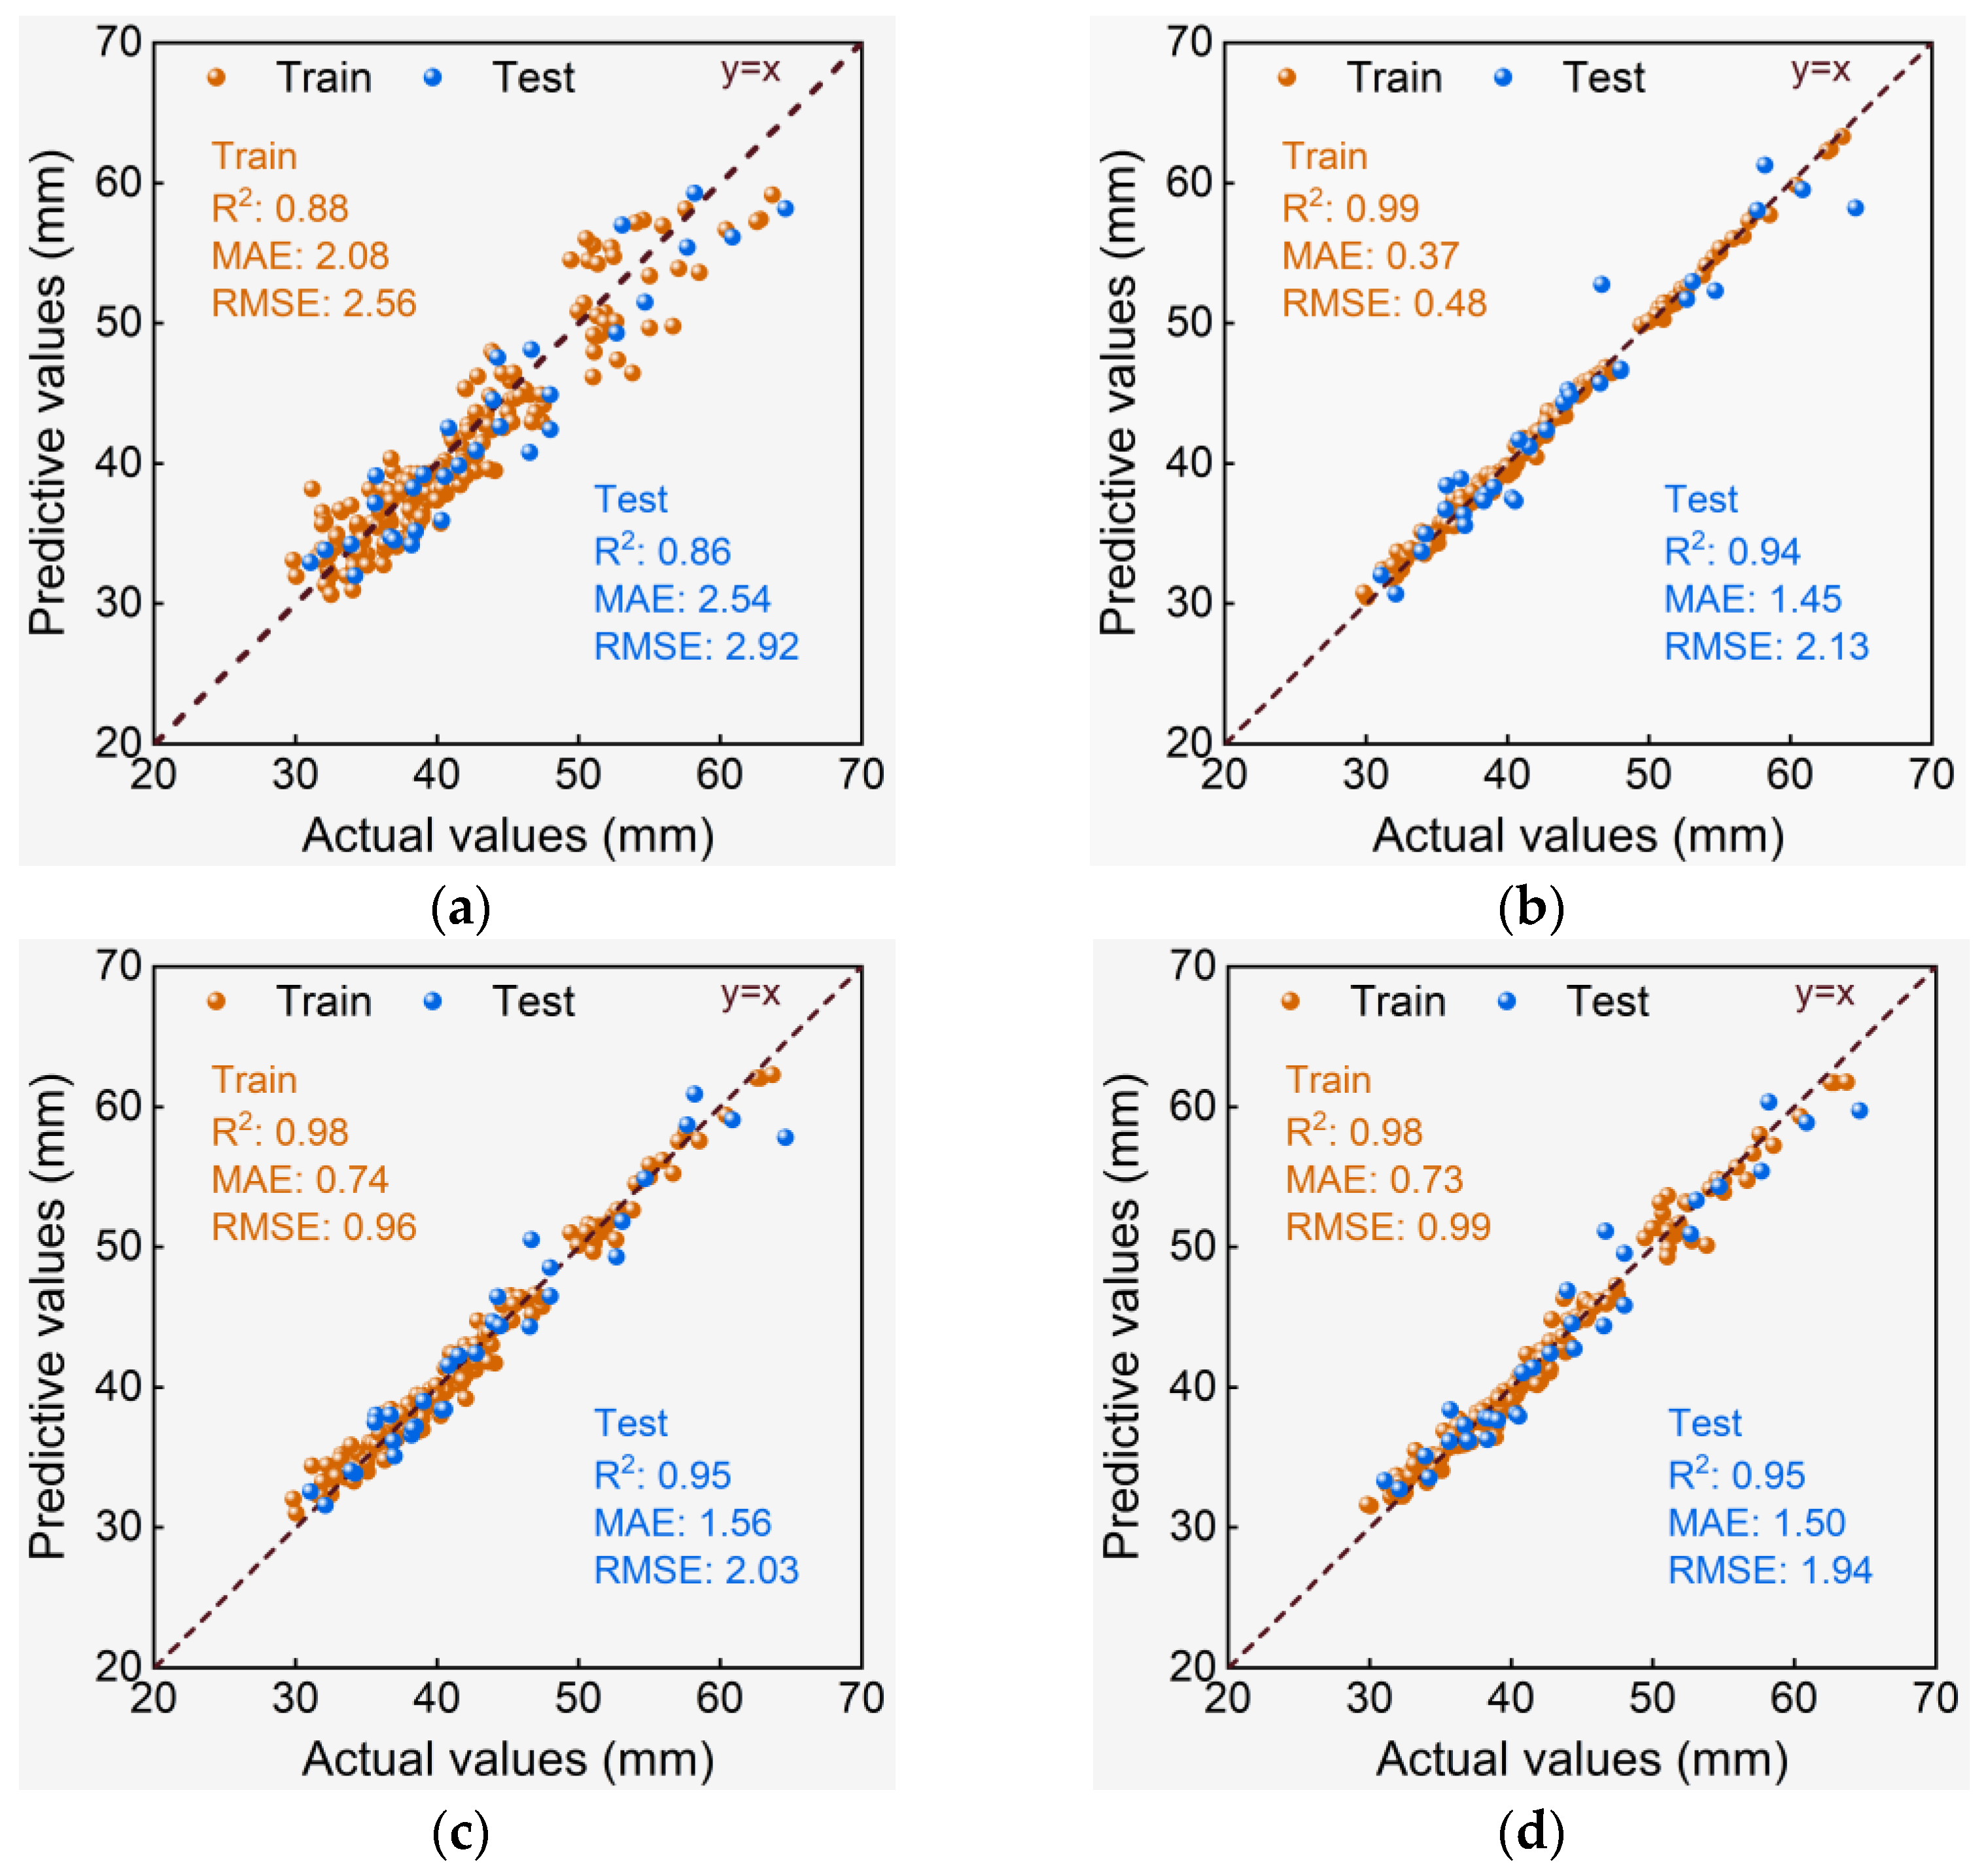
3.3.1. Rt Models
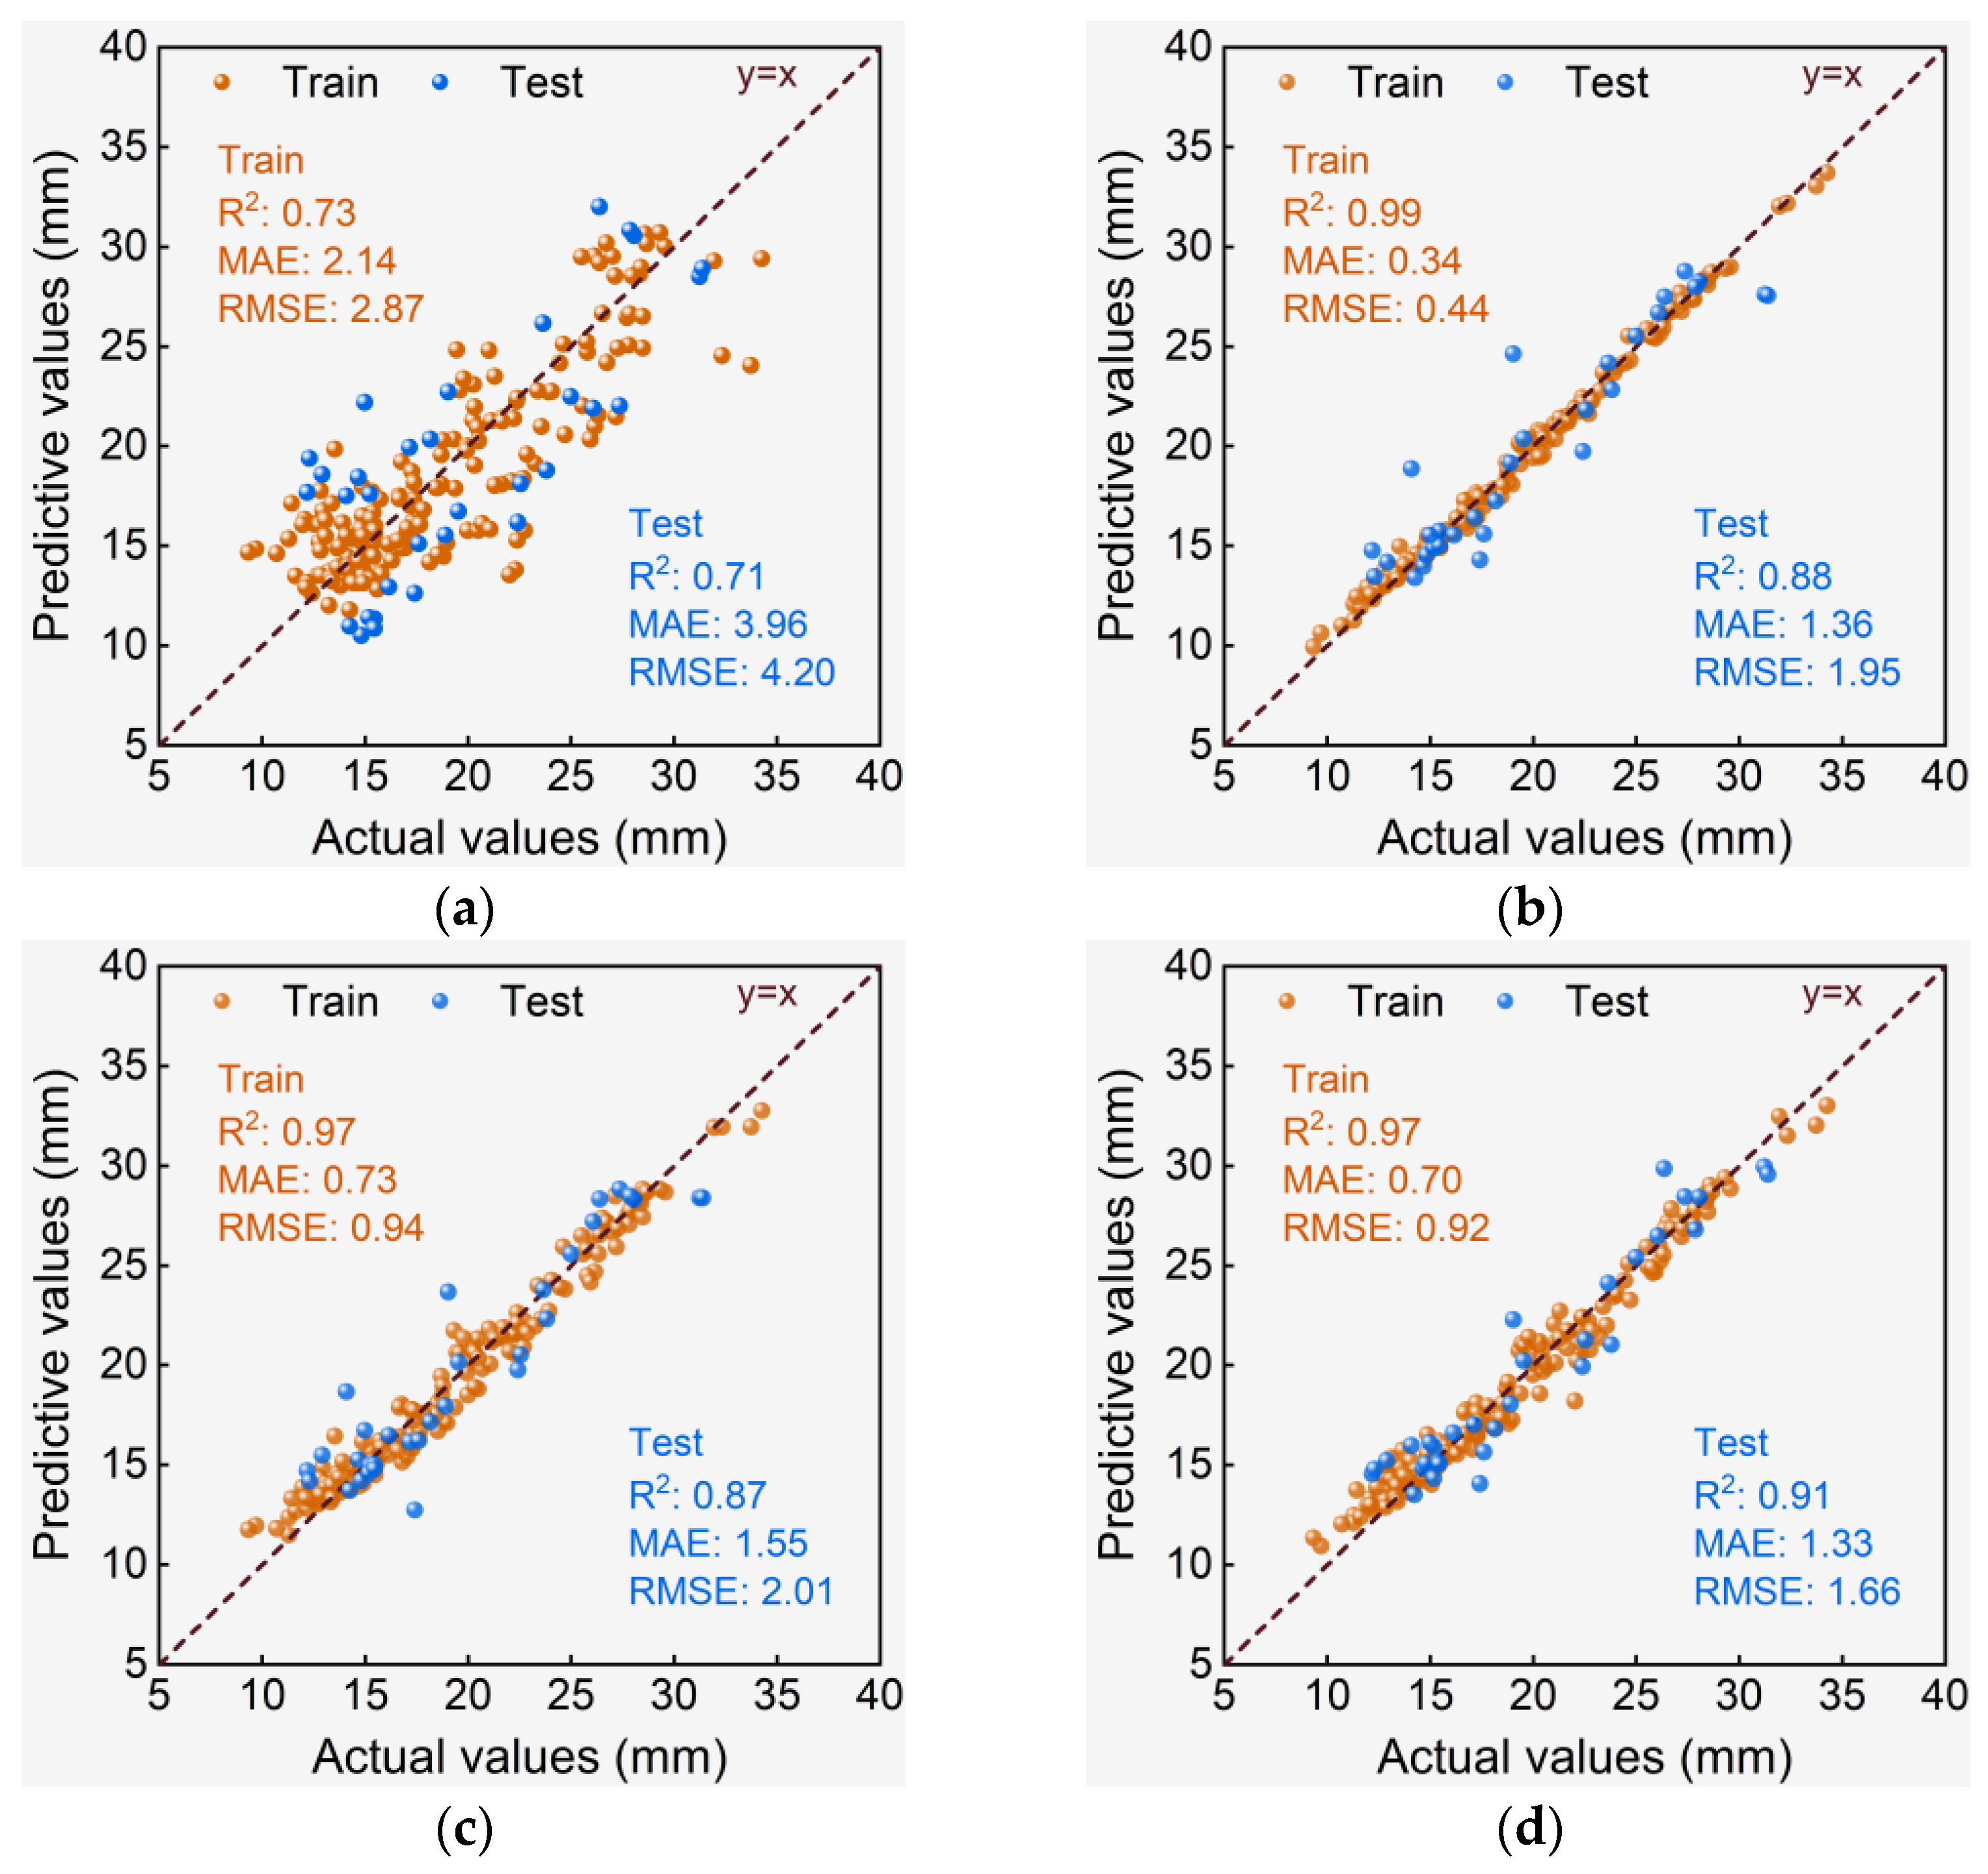
3.3.2. Dti Models
3.4. Interpretation of De-Handing Point Models
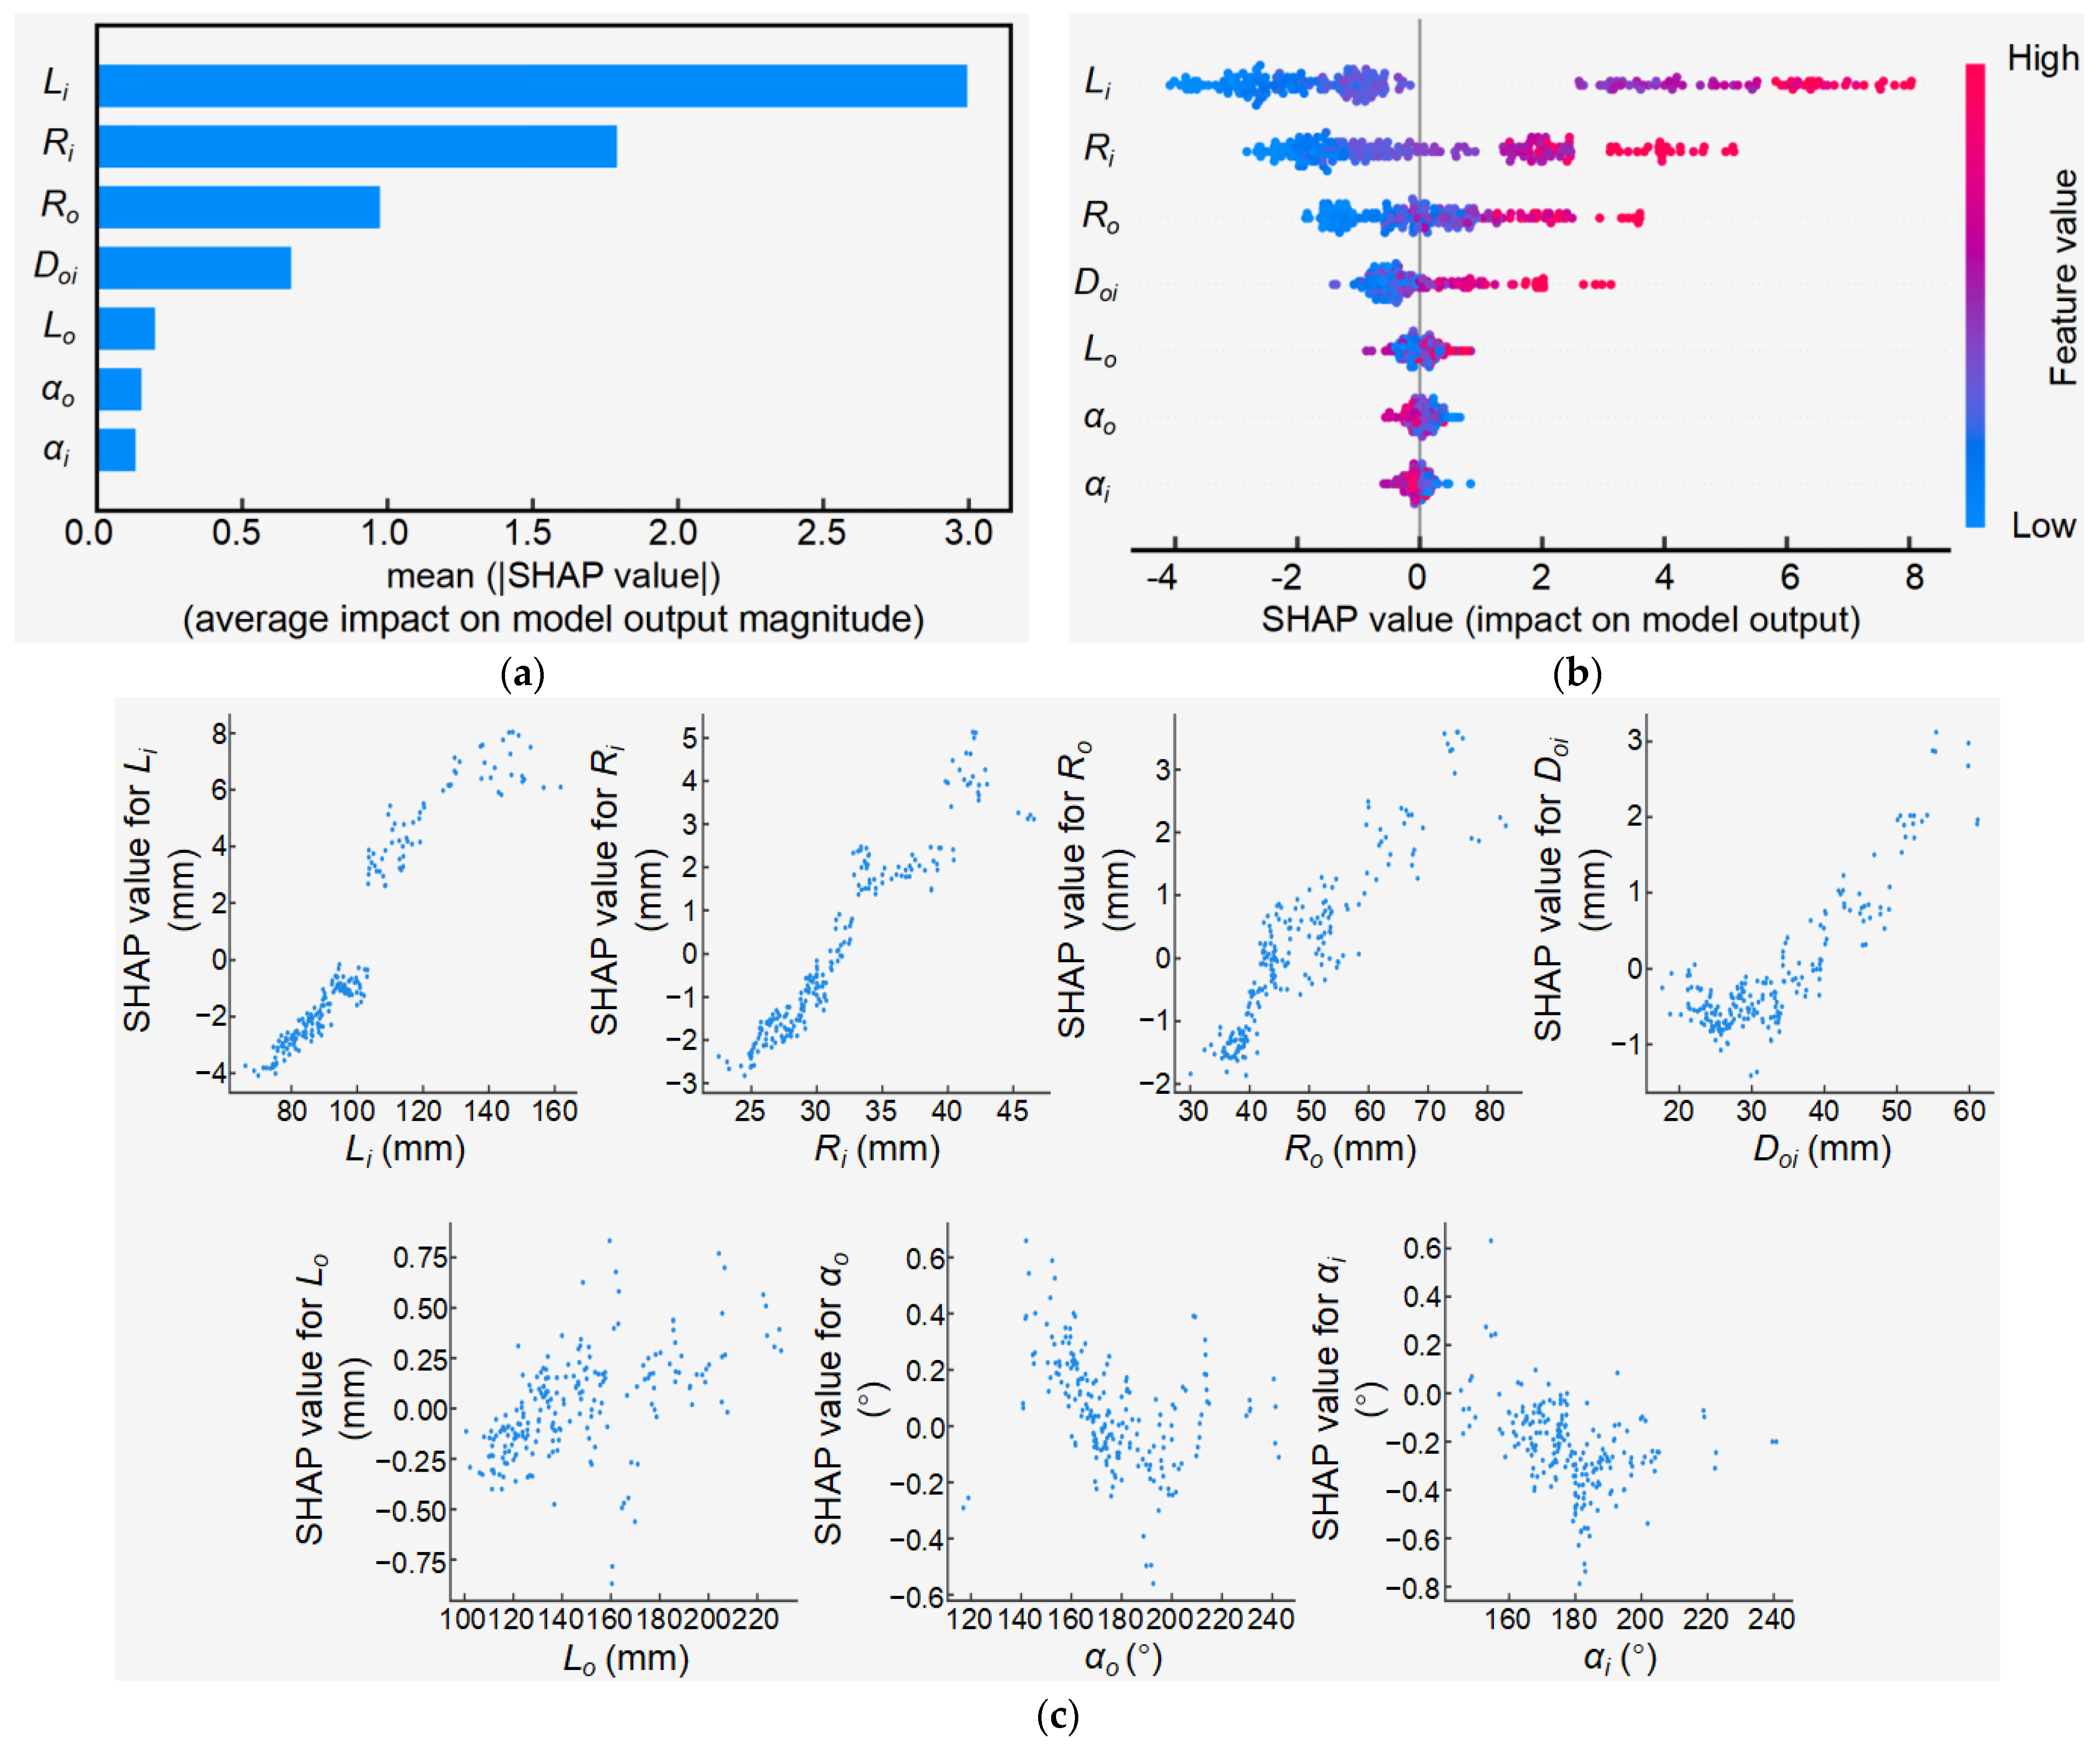
3.4.1. Feature Importance Analysis of RF-Based Rt Model
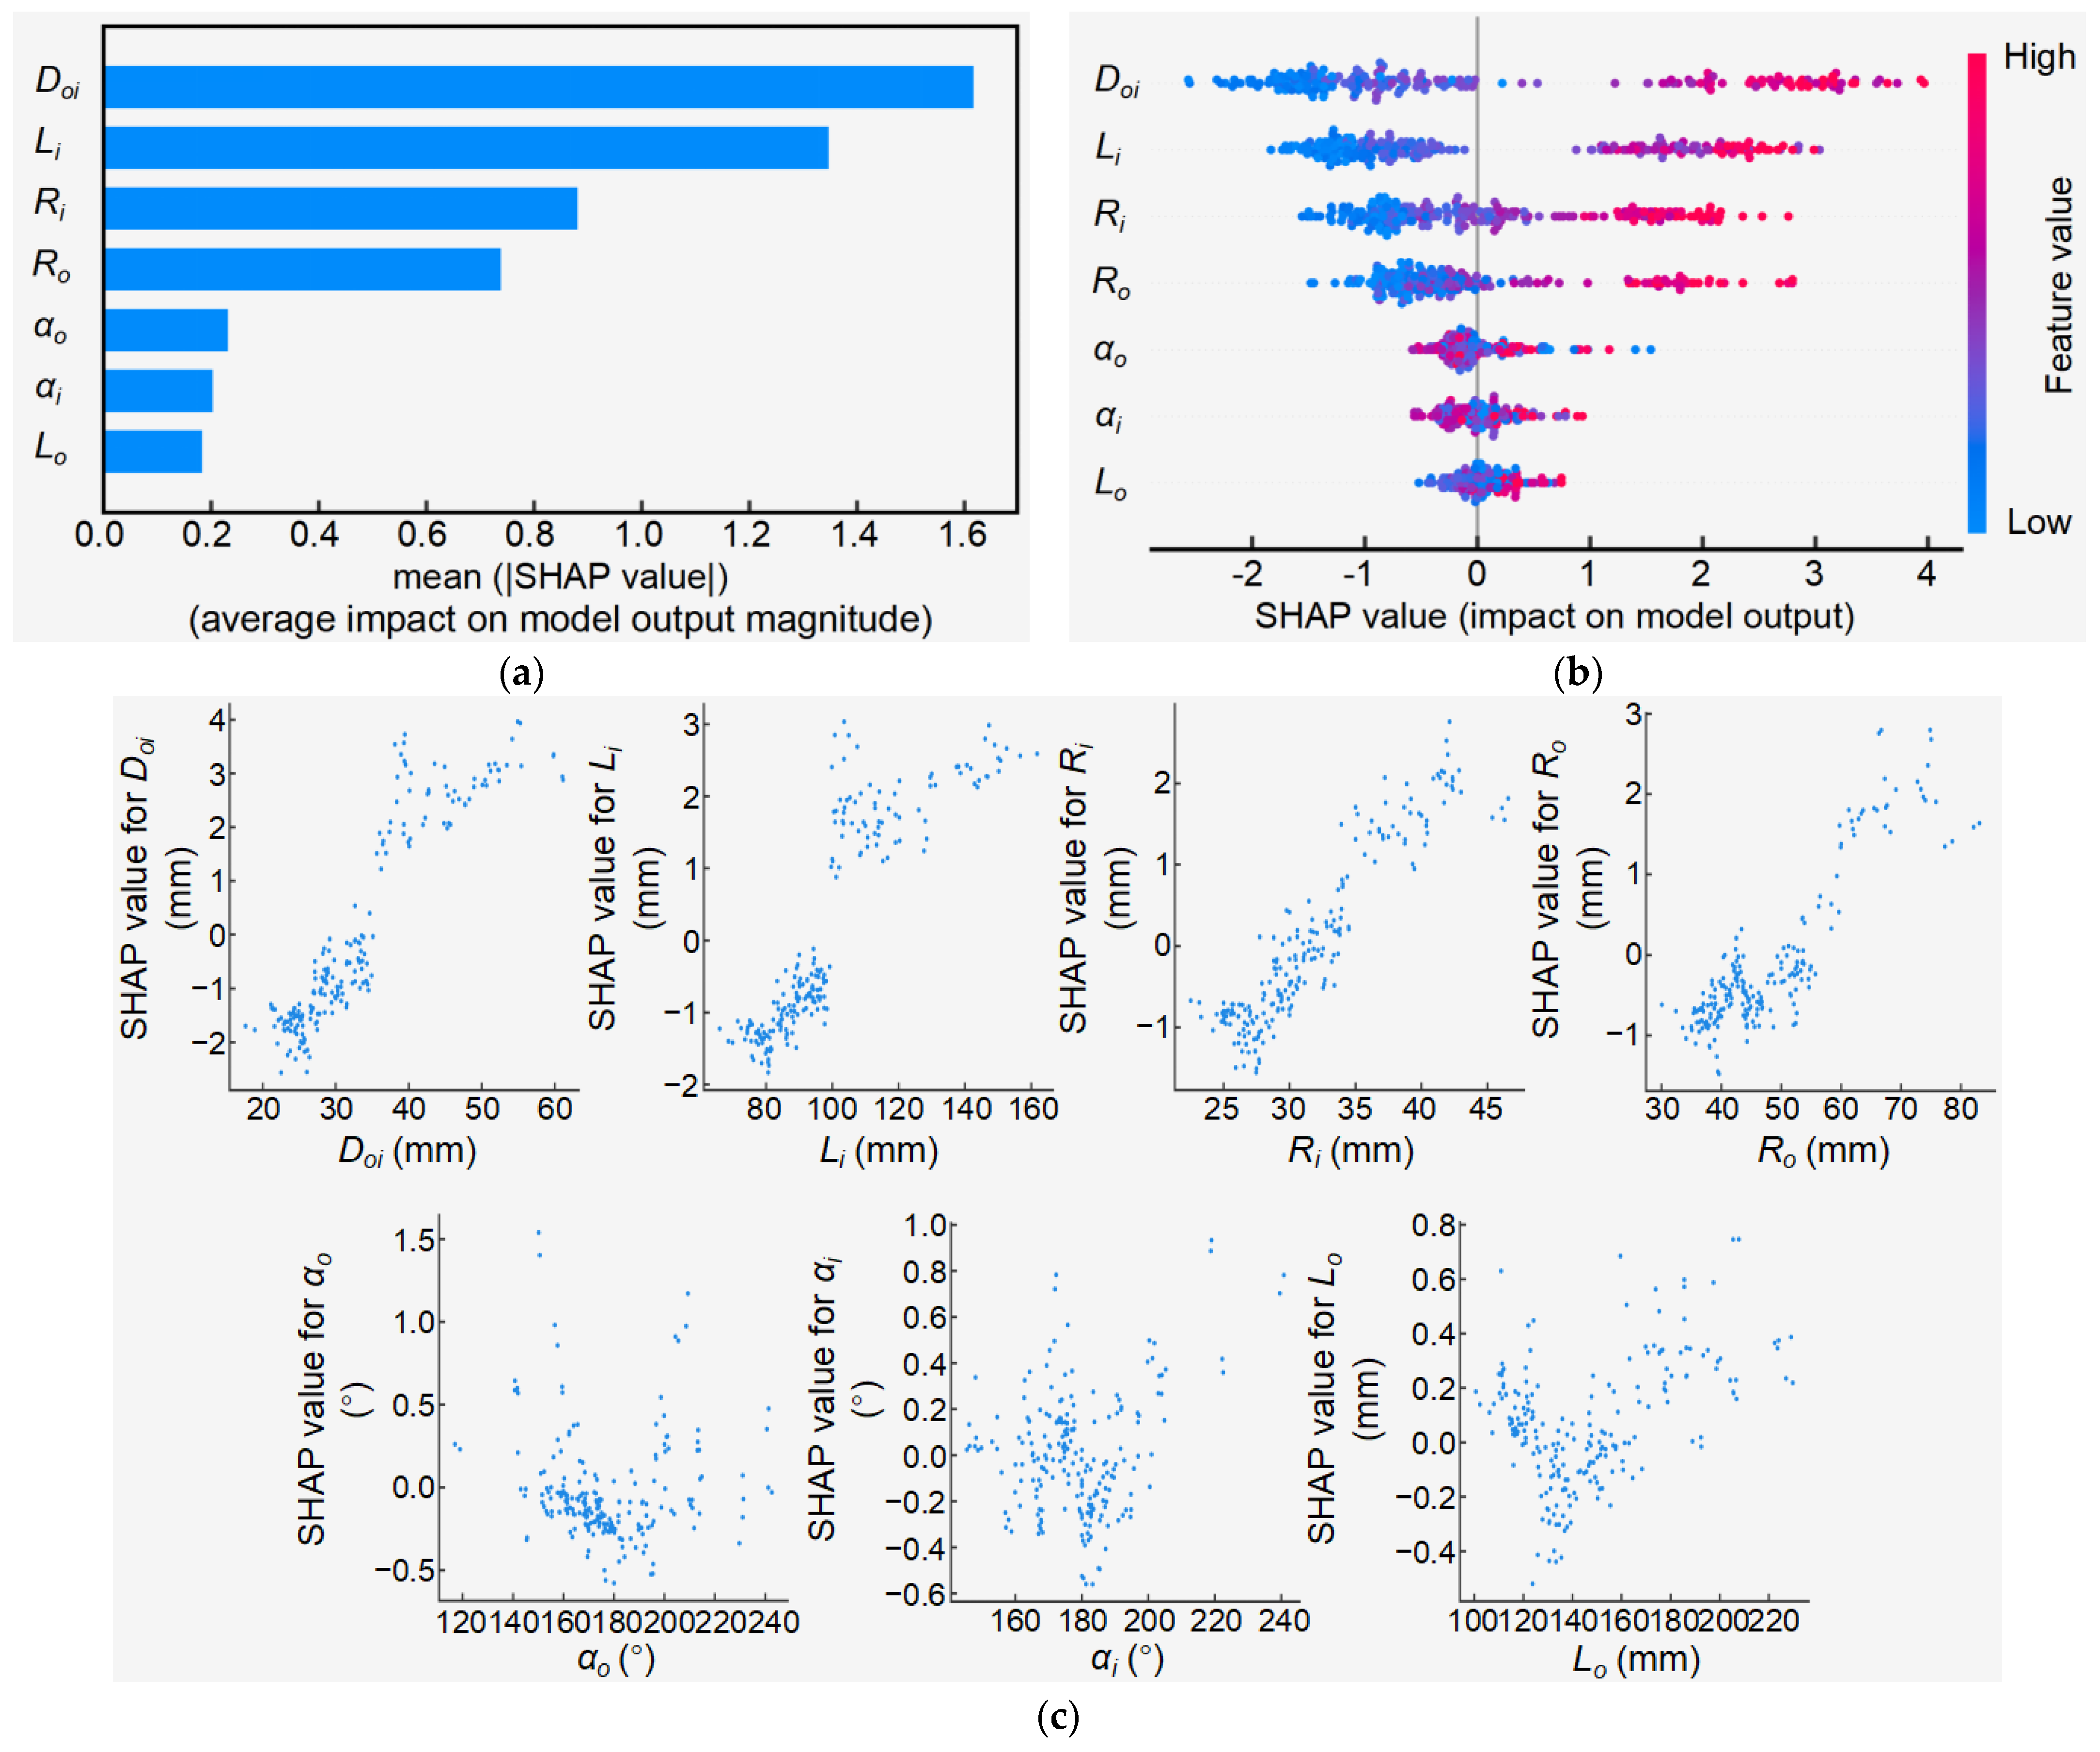
3.4.2. Feature Importance Analysis of Dti Model
4. Discussion
4.1. Morphological Drivers Governing De-Handing Location
4.2. Engineering Specifications for Automated De-Handing Systems
4.3. Limitations and Future Works
5. Conclusions
Supplementary Materials
Author Contributions
Funding
Data Availability Statement
Conflicts of Interest
References
- Tripathi, J.N.; Ntui, V.O.; Tripathi, L. Precision Genetics Tools for Genetic Improvement of Banana. Plant Genome 2024, 17, e20416. [Google Scholar] [CrossRef] [PubMed]
- Kamel, M.A.M.; Cortesi, P.; Saracchi, M. Etiological Agents of Crown Rot of Organic Bananas in Dominican Republic. Postharvest Biol. Technol. 2016, 120, 112–120. [Google Scholar] [CrossRef]
- Merino, G.; Da Silva, L.; Mattos, D.; Guimarães, B.; Merino, E. Ergonomic Evaluation of the Musculoskeletal Risks in a Banana Harvesting Activity through Qualitative and Quantitative Measures, with Emphasis on Motion Capture (Xsens) and EMG. Int. J. Ind. Ergon. 2019, 69, 80–89. [Google Scholar] [CrossRef]
- Guo, J.; Karkee, M.; Yang, Z.; Fu, H.; Li, J.; Jiang, Y.; Jiang, T.; Liu, E.; Duan, J. Research of Simulation Analysis and Experimental Optimization of Banana De-Handing Device with Self-Adaptive Profiling Function. Comput. Electron. Agric. 2021, 185, 106148. [Google Scholar] [CrossRef]
- Xu, Z.Y.; Yang, Z.; Duan, J.L.; Jin, M.H.; Mo, J.S.; Zhao, L.; Guo, J.; Yao, H.L. Design and Experiment of Symmetrical Shape Deployable Arc Profiling Mechanism Based on Composite Multi-Cam Structure. Symmetry 2019, 11, 958. [Google Scholar] [CrossRef]
- Fuentes, N.N.M.; Valle, J.A.B.; Gavilanes, D.A.P.; Loor, M.A.E. Riesgos Ergonómicos En El Trabajo En La Industria Bananera de La Costa Ecuatoriana. Religación 2024, 9, e2401232. [Google Scholar] [CrossRef]
- Robinson, J.C.; Saúco, V.G. Bananas and Plantains; CABI: Oxfordshire, UK, 2010; pp. 248–253. [Google Scholar]
- Zhao, L.; Huang, C.; Yang, Z.; Jin, M.; Duan, J. Characterization of Banana Crowns: Microscopic Observations and Macroscopic Cutting Experiments. Agriculture 2024, 14, 1714. [Google Scholar] [CrossRef]
- Niedbała, G.; Nowakowski, K.; Rudowicz-nawrocka, J.; Piekutowska, M.; Weres, J.; Tomczak, R.J.; Tyksiński, T.; Álvarez Pinto, A. Multicriteria Prediction and Simulation of Winter Wheat Yield Using Extended Qualitative and Quantitative Data Based on Artificial Neural Networks. Appl. Sci. 2019, 9, 2773. [Google Scholar] [CrossRef]
- Folberth, C.; Baklanov, A.; Balkovič, J.; Skalský, R.; Khabarov, N.; Obersteiner, M. Spatio-Temporal Downscaling of Gridded Crop Model Yield Estimates Based on Machine Learning. Agric. For. Meteorol. 2019, 264, 1–15. [Google Scholar] [CrossRef]
- Matsumura, K.; Gaitan, C.F.; Sugimoto, K.; Cannon, A.J.; Hsieh, W.W. Maize Yield Forecasting by Linear Regression and Artificial Neural Networks in Jilin, China. J. Agric. Sci. 2015, 153, 399–410. [Google Scholar] [CrossRef]
- Gopal, P.M.; Bhargavi, R. A Novel Approach for Efficient Crop Yield Prediction. Comput. Electron. Agric. 2019, 165, 104968. [Google Scholar] [CrossRef]
- Zhang, Y.; Li, N.; Zhang, L.; Lin, J.; Gao, X.; Chen, G. A Review on the Recent Developments in Vision-Based Apple-Harvesting Robots for Recognizing Fruit and Picking Pose. Comput. Electron. Agric. 2025, 231, 109968. [Google Scholar] [CrossRef]
- Zhang, G.; Li, L.; Zhang, Y.; Liang, J.; Chun, C. Citrus Pose Estimation under Complex Orchard Environment for Robotic Harvesting. Eur. J. Agron. 2025, 162, 127418. [Google Scholar] [CrossRef]
- Bai, Y.; Mao, S.; Zhou, J.; Zhang, B. Clustered Tomato Detection and Picking Point Location Using Machine Learning-Aided Image Analysis for Automatic Robotic Harvesting. Precis. Agric. 2023, 24, 727–743. [Google Scholar] [CrossRef]
- Yu, Y.; Zhang, K.; Liu, H.; Yang, L.; Zhang, D. Real-Time Visual Localization of the Picking Points for a Ridge-Planting Strawberry Harvesting Robot. IEEE Access 2020, 8, 116556–116568. [Google Scholar] [CrossRef]
- Chen, X.; Dong, G.; Fan, X.; Xu, Y.; Liu, T.; Zhou, J.; Jiang, H. Fruit Stalk Recognition and Picking Point Localization of New Plums Based on Improved DeepLabv3+. Agriculture 2024, 14, 2120. [Google Scholar] [CrossRef]
- Li, L.; Li, K.; He, Z.; Li, H.; Cui, Y. Kiwifruit Segmentation and Identification of Picking Point on Its Stem in Orchards. Comput. Electron. Agric. 2025, 229, 109748. [Google Scholar] [CrossRef]
- Zarbakhsh, S.; Shahsavar, A.R. Artificial Neural Network-Based Model to Predict the Effect of γ-Aminobutyric Acid on Salinity and Drought Responsive Morphological Traits in Pomegranate. Sci. Rep. 2022, 12, 16662. [Google Scholar] [CrossRef] [PubMed]
- Zhan, D.; Mu, Y.; Duan, W.; Ye, M.; Song, Y.; Song, Z.; Yao, K.; Sun, D.; Ding, Z. Spatial Prediction and Mapping of Soil Water Content by TPE-GBDT Model in Chinese Coastal Delta Farmland with Sentinel-2 Remote Sensing Data. Agriculture 2023, 13, 1088. [Google Scholar] [CrossRef]
- Abdikan, S.; Sekertekin, A.; Narin, O.G.; Delen, A.; Balik Sanli, F. A Comparative Analysis of SLR, MLR, ANN, XGBoost and CNN for Crop Height Estimation of Sunflower Using Sentinel-1 and Sentinel-2. Adv. Space Res. 2023, 71, 3045–3059. [Google Scholar] [CrossRef]
- Yamparla, R.; Shaik, H.S.; Guntaka, N.S.P.; Marri, P.; Nallamothu, S. Crop Yield Prediction Using Random Forest Algorithm. In Proceedings of the 2022 7th International Conference on Communication and Electronics Systems (ICCES), Coimbatore, India, 22–24 June 2022; IEEE: Piscataway, NJ, USA, 2022; pp. 1538–1543. [Google Scholar]
- Rustler, L.; Volprecht, V.; Hoffmann, M. Empirical Comparison of Four Stereoscopic Depth Sensing Cameras for Robotics Applications. IEEE Access 2025, 13, 67564–67577. [Google Scholar] [CrossRef]
- Huang, C.; Qin, Z.; Hua, X.; Zhang, Z.; Xiao, W.; Liang, X.; Song, P.; Yang, W. An Intelligent Analysis Method for 3D Wheat Grain and Ventral Sulcus Traits Based on Structured Light Imaging. Front. Plant Sci. 2022, 13, 840908. [Google Scholar] [CrossRef]
- Givi, M.; Cournoyer, L.; Reain, G.; Eves, B.J. Performance Evaluation of a Portable 3D Imaging System. Precis. Eng. 2019, 59, 156–165. [Google Scholar] [CrossRef]
- Litavec, H. A Novel Method for Sorting and Reassociating Commingled Human Remains Using Deviation Analysis. J. Forensic Sci. 2023, 68, 1780–1791. [Google Scholar] [CrossRef]
- Beleidy, M.; Ziada, A. 3D Surface Deviation Wear Analysis of Veneered PEEK Crowns and Its Correlation with Optical Digital Profilometry. J. Prosthodont. 2023, 32, 32–39. [Google Scholar] [CrossRef]
- Panigrahi, B.; Kathala, K.C.R.; Sujatha, M. A Machine Learning-Based Comparative Approach to Predict the Crop Yield Using Supervised Learning With Regression Models. Procedia Comput. Sci. 2023, 218, 2684–2693. [Google Scholar] [CrossRef]
- Prajapati, D.K.; Katiyar, J.K.; Prakash, C. Machine Learning Approach for the Prediction of Mixed Lubrication Parameters for Different Surface Topographies of Non-Conformal Rough Contacts. Ind. Lubr. Tribol. 2023, 75, 1022–1030. [Google Scholar] [CrossRef]
- Omotehinwa, T.O.; Oyewola, D.O. Hyperparameter Optimization of Ensemble Models for Spam Email Detection. Appl. Sci. 2023, 13, 1971. [Google Scholar] [CrossRef]
- Leng, L.; Zhang, W.; Chen, Q.; Zhou, J.; Peng, H.; Zhan, H.; Li, H. Machine Learning Prediction of Nitrogen Heterocycles in Bio-Oil Produced from Hydrothermal Liquefaction of Biomass. Bioresour. Technol. 2022, 362, 127791. [Google Scholar] [CrossRef]
- Majnarić, D.; Šegota, S.B.; Lorencin, I.; Car, Z. Prediction of Main Particulars of Container Ships Using Artificial Intelligence Algorithms. Ocean Eng. 2022, 265, 112571. [Google Scholar] [CrossRef]
- Lundberg, S.M.; Lee, S.-I. A Unified Approach to Interpreting Model Predictions. In Proceedings of the 31st International Conference on Neural Information Processing Systems, Long Beach, CA, USA, 4–9 December 2017; Curran Associates Inc.: Red Hook, NY, USA, 2017; pp. 4768–4777. [Google Scholar]
- Hao, W.; Sun, J.; Zhang, Z.; Zhang, K.; Qiu, F.; Xu, J. Novel Hybrid Model to Estimate Leaf Carotenoids Using Multilayer Perceptron and PROSPECT Simulations. Remote Sens. 2023, 15, 4997. [Google Scholar] [CrossRef]
- Sbai, Z. Deep Learning Models and Their Ensembles for Robust Agricultural Yield Prediction in Saudi Arabia. Sustainability 2025, 17, 5807. [Google Scholar] [CrossRef]
- Gaffoor, Z.; Pietersen, K.; Jovanovic, N.; Bagula, A.; Kanyerere, T.; Ajayi, O.; Wanangwa, G. A Comparison of Ensemble and Deep Learning Algorithms to Model Groundwater Levels in a Data-Scarce Aquifer of Southern Africa. Hydrology 2022, 9, 125. [Google Scholar] [CrossRef]
- Rizkallah, L.W. Enhancing the Performance of Gradient Boosting Trees on Regression Problems. J. Big Data 2025, 12, 35. [Google Scholar] [CrossRef]
- Vafaeinejad, A.; Sharifi, A.; Khan, S.N. Robust County-Level Corn Yield Estimation Using Ensemble Machine Learning and Multi-Source Remote Sensing. IEEE J. Sel. Top. Appl. Earth Obs. Remote Sens. 2025, 18, 16942–16953. [Google Scholar] [CrossRef]
- Elbasi, E.; Mostafa, N.; Zaki, C.; AlArnaout, Z.; Topcu, A.E.; Saker, L. Optimizing Agricultural Data Analysis Techniques through AI-Powered Decision-Making Processes. Appl. Sci. 2024, 14, 8018. [Google Scholar] [CrossRef]
- Jeong, J.H.; Resop, J.P.; Mueller, N.D.; Fleisher, D.H.; Yun, K.; Butler, E.E.; Timlin, D.J.; Shim, K.-M.; Gerber, J.S.; Reddy, V.R.; et al. Random Forests for Global and Regional Crop Yield Predictions. PLoS ONE 2016, 11, e0156571. [Google Scholar] [CrossRef] [PubMed]
- Sandhu, K.S.; Lozada, D.N.; Zhang, Z.; Pumphrey, M.O.; Carter, A.H. Deep Learning for Predicting Complex Traits in Spring Wheat Breeding Program. Front. Plant Sci. 2021, 11, 613325. [Google Scholar] [CrossRef] [PubMed]
- Wang, J.; Li, Z.; Gao, G.; Wang, Y.; Zhao, C.; Bai, H.; Lv, Y.; Zhang, X.; Li, Q. BerryNet-Lite: A Lightweight Convolutional Neural Network for Strawberry Disease Identification. Agriculture 2024, 14, 665. [Google Scholar] [CrossRef]
- Ren, J.; Zhou, H.; Tao, Z.; Ge, L.; Song, K.; Xu, S.; Li, Y.; Zhang, L.; Zhang, X.; Li, S. Long-Term Monitoring Chlorophyll-a Concentration Using HJ-1 A/B Imagery and Machine Learning Algorithms in Typical Lakes, a Cold Semi-Arid Region. Opt. Express 2024, 32, 16371. [Google Scholar] [CrossRef]
- Hosseini, F.S.; Jafari, A.; Zandi, I.; Alesheikh, A.A.; Rezaie, F. Groundwater Potential Mapping Using Optimized Decision Tree-Based Ensemble Learning Model with Local and Global Explainability. Water 2025, 17, 1520. [Google Scholar] [CrossRef]
- Çifci, A.; Kırbaş, İ. Fusion of Machine Learning and Explainable AI for Enhanced Rice Classification: A Case Study on Cammeo and Osmancik Species. Eur. Food Res. Technol. 2025, 251, 69–86. [Google Scholar] [CrossRef]
- Wu, G.; Li, B.; Zhu, Q.; Huang, M.; Guo, Y. Using Color and 3D Geometry Features to Segment Fruit Point Cloud and Improve Fruit Recognition Accuracy. Comput. Electron. Agric. 2020, 174, 105475. [Google Scholar] [CrossRef]
- Lin, G.; Tang, Y.; Zou, X.; Xiong, J.; Li, J. Guava Detection and Pose Estimation Using a Low-Cost RGB-D Sensor in the Field. Sensors 2019, 19, 428. [Google Scholar] [CrossRef]
- Gao, J.; Zhang, F.; Zhang, J.; Yuan, T.; Yin, J.; Guo, H.; Yang, C. Development and Evaluation of a Pneumatic Finger-like End-Effector for Cherry Tomato Harvesting Robot in Greenhouse. Comput. Electron. Agric. 2022, 197, 106879. [Google Scholar] [CrossRef]
- Liu, J.; Liu, Z. The Vision-Based Target Recognition, Localization, and Control for Harvesting Robots: A Review. Int. J. Precis. Eng. Manuf. 2024, 25, 409–428. [Google Scholar] [CrossRef]
- Xiao, X.; Wang, Y.; Jiang, Y. Review of Research Advances in Fruit and Vegetable Harvesting Robots. J. Electr. Eng. Technol. 2024, 19, 773–789. [Google Scholar] [CrossRef]
- Zhang, J.; Kang, N.; Qu, Q.; Zhou, L.; Zhang, H. Automatic Fruit Picking Technology: A Comprehensive Review of Research Advances. Artif. Intell. Rev. 2024, 57, 54. [Google Scholar] [CrossRef]
- Lamessa, K. Performance Evaluation of Banana Varieties, through Farmer’s Participatory Selection. Int. J. Fruit Sci. 2021, 21, 768–778. [Google Scholar] [CrossRef]
- Onyia, T.M.; Olarinoye, I.A.A.; Jimoh, S.A. Advancements and Challenges in 3D Scanning: A Comprehensive Review of Engineering Applications. Afr. J. Adv. Sci. Technol. Res. 2025, 18, 191–206. [Google Scholar] [CrossRef]
- Lundberg, S.M.; Erion, G.; Chen, H.; DeGrave, A.; Prutkin, J.M.; Nair, B.; Katz, R.; Himmelfarb, J.; Bansal, N.; Lee, S.-I. From Local Explanations to Global Understanding with Explainable AI for Trees. Nat. Mach. Intell. 2020, 2, 56–67. [Google Scholar] [CrossRef] [PubMed]


| Specifications | Parameters | Specifications | Parameters |
|---|---|---|---|
| Measuring rate | 550,000 measurements/s | Resolution | 0.50 mm |
| Scanning area | 380 mm × 380 mm | Accuracy | 0.10 mm |
| Positioning methods | Geometry and/or color and/or targets | Volumetric accuracy | 0.30 mm/m |
| Light source | White light (LED) | Stand-off distance | 400 mm |
| Texture color (resolution) | 24 bits (50 to 150 DPI) | Depth of field | 250 mm |
| Parameters | MLP | GBDT | XGBoot | RF |
|---|---|---|---|---|
| learning_rate | 0.01–0.10 | 0.01–0.10 | 0.01–0.10 | / |
| hidden_layer_sizes | 30–100 | / | / | / |
| max_depth | / | 1–10 | 1–10 | / |
| n_estimators | / | / | / | 1–20 |
| max_features | / | / | / | 1–7 |
| Crown Morphological Features | Maximum Value | Minimum Value | Mean Value | Standard Deviation |
|---|---|---|---|---|
| Inner arc radius (Ri, mm) | 46.57 | 22.51 | 31.69 | 5.42 |
| Inner arc center angle (αi, °) | 240.77 | 145.44 | 178.47 | 15.11 |
| Inner arc length (Li, mm) | 161.79 | 66.02 | 98.94 | 20.56 |
| Outer arc radius (Ro, mm) | 83.07 | 30.06 | 47.93 | 10.88 |
| Outer arc center angle (αo, °) | 242.60 | 117.00 | 177.03 | 21.74 |
| Outer arc length (Lo, mm) | 229.76 | 100.64 | 146.34 | 29.21 |
| Distance between inner and outer arc (Doi, mm) | 61.13 | 17.65 | 32.96 | 9.60 |
| Target radius (Rt, mm) | 64.50 | 29.83 | 41.61 | 7.68 |
| Target distance (Dti, mm) | 34.24 | 9.33 | 18.95 | 5.51 |
Disclaimer/Publisher’s Note: The statements, opinions and data contained in all publications are solely those of the individual author(s) and contributor(s) and not of MDPI and/or the editor(s). MDPI and/or the editor(s) disclaim responsibility for any injury to people or property resulting from any ideas, methods, instructions or products referred to in the content. |
© 2025 by the authors. Licensee MDPI, Basel, Switzerland. This article is an open access article distributed under the terms and conditions of the Creative Commons Attribution (CC BY) license (https://creativecommons.org/licenses/by/4.0/).
Share and Cite
Zhao, L.; Yang, Z.; Wang, C.; Jin, M.; Duan, J. Predicting De-Handing Point in Bananas Using Crown Morphology and Interpretable Machine Learning. Agronomy 2025, 15, 1880. https://doi.org/10.3390/agronomy15081880
Zhao L, Yang Z, Wang C, Jin M, Duan J. Predicting De-Handing Point in Bananas Using Crown Morphology and Interpretable Machine Learning. Agronomy. 2025; 15(8):1880. https://doi.org/10.3390/agronomy15081880
Chicago/Turabian StyleZhao, Lei, Zhou Yang, Chunxia Wang, Mohui Jin, and Jieli Duan. 2025. "Predicting De-Handing Point in Bananas Using Crown Morphology and Interpretable Machine Learning" Agronomy 15, no. 8: 1880. https://doi.org/10.3390/agronomy15081880
APA StyleZhao, L., Yang, Z., Wang, C., Jin, M., & Duan, J. (2025). Predicting De-Handing Point in Bananas Using Crown Morphology and Interpretable Machine Learning. Agronomy, 15(8), 1880. https://doi.org/10.3390/agronomy15081880