
Study on the Distribution and Quantification Characteristics of Soil Nutrients in the Dryland Albic Soils of the Sanjiang Plain, China


Abstract
1. Introduction
2. Materials and Methods
2.1. Study Area and Data Source
2.2. Experimental Design
2.3. Measurement Items and Methods
2.4. Data Processing
2.5. Agronomic Management Practices
3. Results and Discussion
3.1. Spatial Variability of Soil Nutrients in the Black Soil Layer
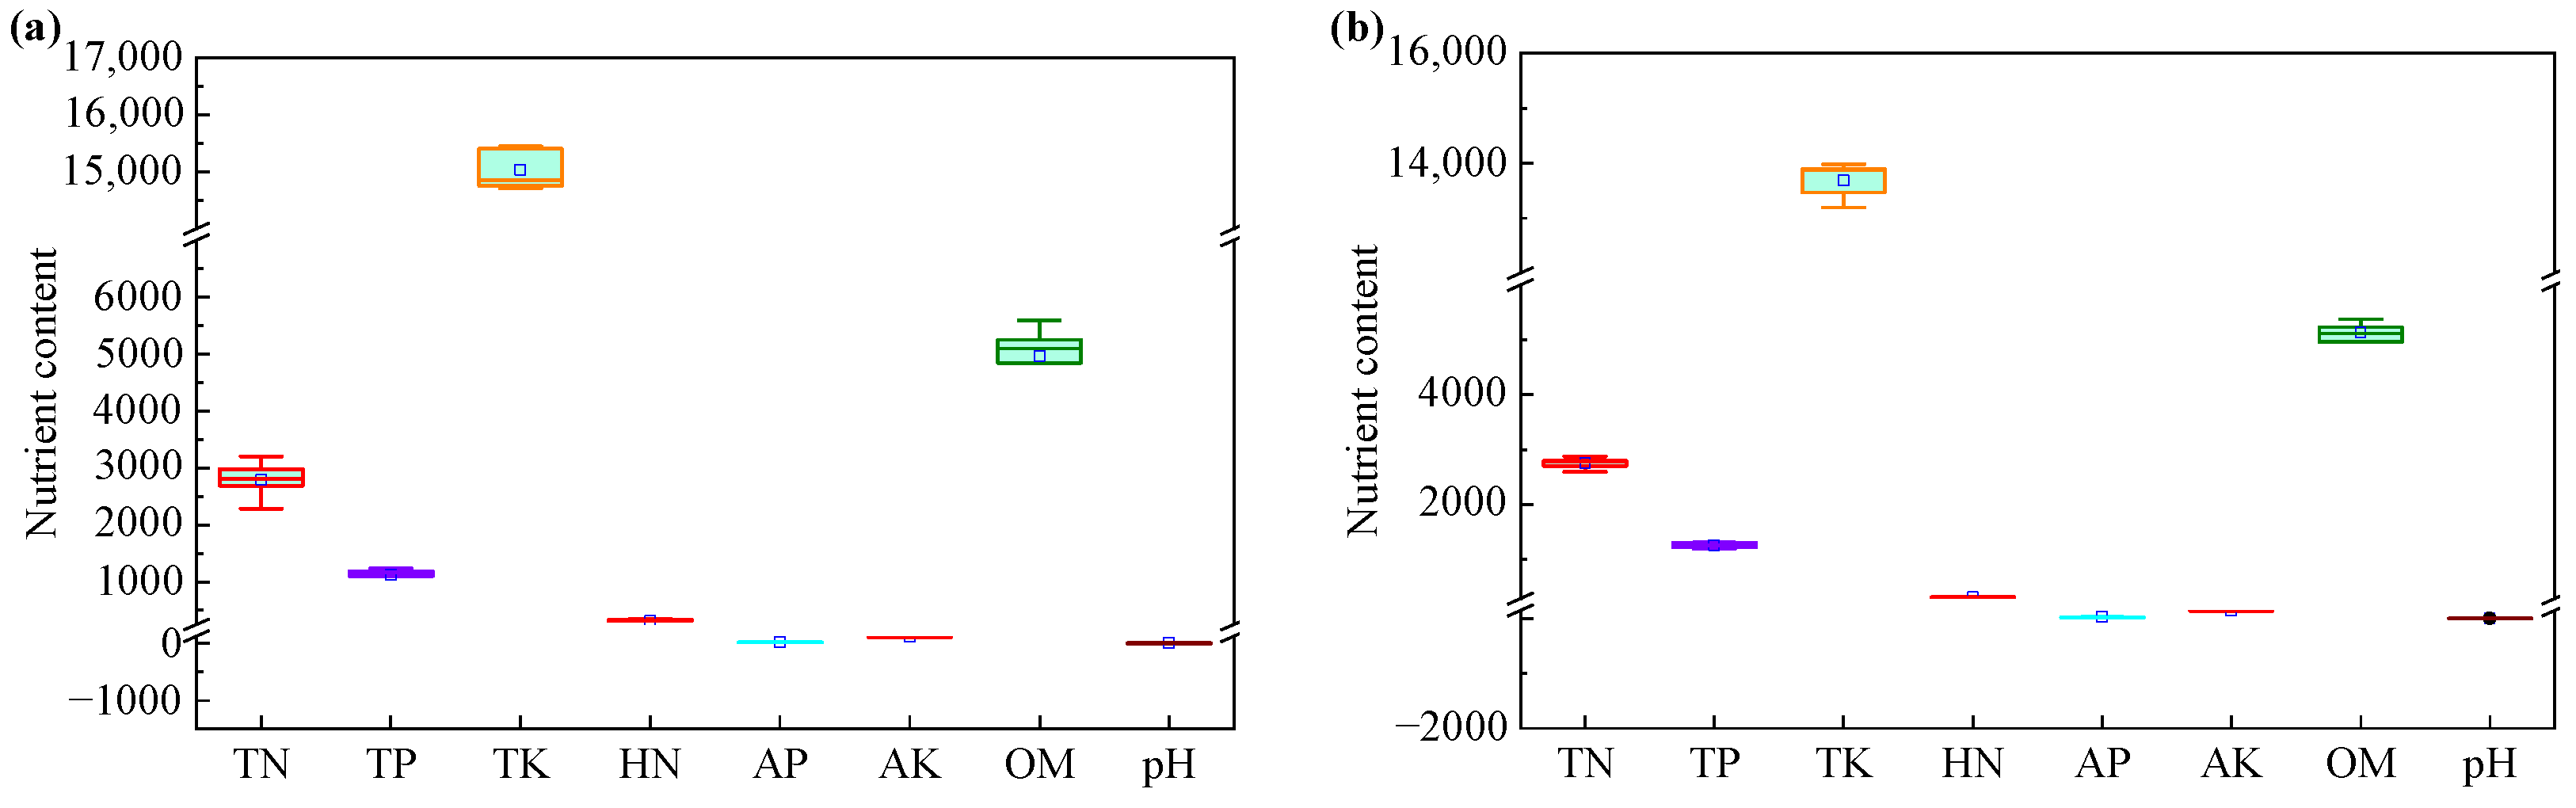
3.1.1. Statistical Characteristics of Soil Nutrients in the Black Soil Layer
3.1.2. Spatial Distribution Patterns of Soil Nutrients in the Black Soil Layer
3.2. Spatial Variation in Soil Nutrients in the Albic Soil Layer
3.2.1. Statistical Characteristics of Soil Nutrients in the Albic Soil Layer
3.2.2. Spatial Distribution Patterns of Soil Nutrients in the Albic Soil Layer
3.3. Comparison of Soil Nutrient Differences Between the Black Soil Layer and Albic Soil Layer
3.4. Mechanisms by Which Albic Soil Affects Crop Productivity
3.5. Discussion
3.6. Limitations and Future Directions
4. Conclusions
- (1)
- Nutrient characteristics of the black soil layer and albic soil layer
- (2)
- Comparison of nutrient differences between the two soil layers
- (3)
- Mechanism of soil nutrient influence on maize growth
Author Contributions
Funding
Data Availability Statement
Acknowledgments
Conflicts of Interest
References
- Montagne, D.; Cousin, I.; Cornu, S. Changes in the pathway and the intensity of albic material genesis: Role of agricultural practices. Geoderma 2016, 268, 156–164. [Google Scholar] [CrossRef]
- Gong, X.J.; Yu, Y.; Lv, G.Y.; Hao, Y.B.; Wang, L.L.; Ma, J.T.; Jiang, Y.B.; Zou, J.H.; Li, J.Y.; Wang, Q.J. Construction and effect analysis of a mixed actinomycete flora for straw returning to albic soil in Northeast China. Microorganisms 2025, 13, 385. [Google Scholar] [CrossRef]
- Yang, E.J.; Zhao, X.L.; Qin, W.; Jiao, J.; Han, J.Q.; Zhang, M. Temporal impacts of dryland-to-paddy conversion on soil quality in the typical black soil region of China: Establishing the minimum data set. Catena 2023, 231, 107303. [Google Scholar] [CrossRef]
- Wang, Q.J.; Liu, F.; Chi, F.Q.; Jiao, F.; Zhang, C.F.; Jiang, H.; Li, P.F.; Zhu, B.G. Effect of straw returning and nitrogen fertilizer regulation on nitrogen and rice yield in albic soil with different fertilities. Trans. China Soc. Agric. Eng. 2019, 35, 105–111. [Google Scholar]
- Nevedrov, N.P.; Sarzhanov, D.A.; Protsenko, E.P.; Vasenev, I.I. Spatial and temporal dynamics of carbon dioxide emission from Al-Fe-humus sandy soils in the forest-steppe zone. Eurasian Soil Sci. 2022, 55, 1546–1555. [Google Scholar] [CrossRef]
- Dymov, A.A.; Grodnitskaya, I.D.; Yakovleva, E.; Dubrovskiy, Y.A.; Kutyavin, I.N.; Startsev, V.V.; Milanovsky, E.Y.; Prokushkin, A.S. Albic Podzols of boreal pine forests of Russia: Soil organic matter, physicochemical and microbiological properties across pyrogenic history. For. Stud. China 2022, 13, 1831. [Google Scholar] [CrossRef]
- Bacmaga, M.; Wyszkowska, J.; Borowik, A.; Kucharski, J.; Paprocki, L. Microbiological and biochemical properties in Eutric/Dystric Brunic Arenosols, Eutric/Endocalcaric Cambisols, and Haplic/Albic Luvisols soils. J. Soil Sci. Plant Nutr. 2021, 21, 1277–1292. [Google Scholar] [CrossRef]
- Xiu, L.Q.; Zhang, W.M.; Sun, Y.Y.; Wu, D.; Meng, J.; Chen, W.F. Effects of biochar and straw returning on the key cultivation limitations of albic soil and soybean growth over 2 years. Catena 2019, 173, 481–493. [Google Scholar] [CrossRef]
- Zhang, D.; Jiang, B.Z.; Liu, G.H.; Zhang, H.; Nie, F.; Sun, Q.; Ji, M.Y. Applicability of spatial interpolation methods to predict total phosphorus in the typical irrigated areas of the Sanjiang Plain. Chin. J. Eco-Agric. 2021, 29, 1405–1416. [Google Scholar]
- Umarova, A.B.; Butylkina, M.A.; Suslenkova, M.M.; Aleksandrova, M.S.; Ejelev, Z.S.; Khmeleva, M.V.; Shkhapatsev, A.K.; Gasina, A.I. Aggregate structure of native and arable soils of different geneses: Morphological and rheological characteristics. Eurasian Soil Sci. 2021, 54, 1299–1311. [Google Scholar] [CrossRef]
- Zavyalova, N.E.; Shirokikh, I.G.; Vasbieva, M.T.; Fomin, D.S. Influence of different types of land use on prokaryotic communities and organic matter stabilization in soddy-podzolic soil. Eurasian Soil Sci. 2021, 54, 264–270. [Google Scholar] [CrossRef]
- Symochko, L.; Demyanyuk, O.; Crisan, V.; Dinca, L. Microbial transformation of soil organic matter under varying agricultural management systems in Ukraine. Folia Microbiol. 2024, 14, 1287701. [Google Scholar] [CrossRef] [PubMed]
- Liu, Z.J.; Zhou, W.; Shen, J.B.; Li, S.; Liang, G. Soil quality assessment of albic soils with different productivities for eastern China. Soil Tillage Res. 2014, 140, 74–81. [Google Scholar] [CrossRef]
- Zhou, Z.Y.; Wei, G.Y.; Zhou, P.; Chen, Z.; Yan, J.D.; Wang, J.S. Transferability of soil organic matter prediction models between different soil types based on improved standard-sample calibration transfer method. J. Appl. Remote Sens. 2024, 18, 042606. [Google Scholar] [CrossRef]
- Zhao, H.J.; Luo, C.; Kong, D.P.; Yu, Y.F.; Zang, D.Q.; Wang, F. Spatial and temporal variations in soil organic matter and their influencing factors in the Songnen and Sanjiang Plains of China (1984–2021). Land 2024, 13, 1447. [Google Scholar] [CrossRef]
- Dong, F.J.; Zhang, Z.B.; Jiang, F.H.; Wang, J.H.; Wang, Q.J.; Li, L.L.; Peng, X.H. Spatial distribution of the buried depth and thickness of albic soil albic layer in Sanjiang Plain and its influencing factors. Acta Pedol. Sin. 2025, 62, 362–374. [Google Scholar]
- Ovchinnikova, M.F. Transformation of humus substances in the long-drained surface-gleyed soddy-podzolic soils under conditions of pronounced microrelief and different agrogenic loads. Eurasian Soil Sci. 2016, 49, 859–867. [Google Scholar] [CrossRef]
- Yin, D.W.; Meng, J.; Shi, G.Z.; Cao, T.; Chen, Z.; Zhou, J.; Zheng, G.P.; Chen, W.F. Biochar as tool to improve physicochemical properties of Chinese albic soils. J. Biobased Mater. Bioenergy 2018, 12, 102–108. [Google Scholar] [CrossRef]
- Yin, D.W.; Li, H.Y.; Wang, H.Z.; Guo, X.H.; Wang, Z.H.; Lv, Y.D.; Ding, G.H.; Jin, L.; Lan, Y. Impact of different biochars on microbial community structure in the rhizospheric soil of rice grown in albic soil. Molecules 2021, 26, 4783. [Google Scholar] [CrossRef]
- Zhao, X.Y.; Song, B.Q.; Ishfaq, M.; Adil, M.F.; Lal, M.K.; Wu, Z.Z.; Jia, Q.; Huang, W. Zinc amendment increases the yield and industrial quality of Beta vulgaris L. cultivated in Northeast China. Field Crops Res. 2023, 298, 108973. [Google Scholar] [CrossRef]
- Liu, H.W.; Wang, J.J.; Sun, X.; McLaughlin, N.B.; Jia, S.X.; Liang, A.Z.; Zhang, S.X. The driving mechanism of soil organic carbon biodegradability in the black soil region of Northeast China. Sci. Total Environ. 2023, 884, 163835. [Google Scholar] [CrossRef] [PubMed]
- Meng, Q.Y.; Zou, H.T.; Zhang, C.F.; Zhu, B.G.; Wang, N.N.; Yang, X.H.; Gai, Z.J.; Han, Y.Y. Soil mixing with organic matter amendment improves albic soil physicochemical properties and crop yield in Heilongjiang Province, China. PLoS ONE 2020, 15, e0239788. [Google Scholar] [CrossRef]
- Zhang, Y.; Jiang, W.Z.; Li, Q.; Xu, W.J.; Wang, J.J.; Hu, J.; Zhang, Z.J. Soil nutrient levels determine the variation of bacterial communities in the rhizosphere of rice under different conditions of climate and genotype. Appl. Soil Ecol. 2021, 167, 104025. [Google Scholar] [CrossRef]
- Wang, Q.J.; Zhang, D.D.; Jiao, F.; Zhang, H.B.; Guo, Z.H. Impacts of farming activities on carbon deposition based on fine soil subtype classification. Front. Plant Sci. 2024, 15, 1381549. [Google Scholar] [CrossRef]
- Xiu, L.Q.; Zhang, W.M.; Wu, D.; Sun, Y.Y.; Zhang, H.G.; Gu, W.Q.; Wang, Y.N.; Meng, J.; Chen, W.F. Biochar can improve biological nitrogen fixation by altering the root growth strategy of soybean in albic soil. Sci. Total Environ. 2021, 773, 144564. [Google Scholar] [CrossRef]
- Havryshko, O.; Olifir, Y.; Hnativ, P.; Habryiel, A.; Partyka, T.; Ivaniuk, V. Influence of prolonged agrogenic transformation on soil structure and physicochemical properties of Ukrainian Albic Stagnic Luvisols: A case study from Western Ukraine. Soil Sci. Annu. 2023, 74, 183659. [Google Scholar] [CrossRef]
- Chen, A.H.; Wang, Q.J.; Zhang, H.B.; Liang, Y.C.; Qi, Z.J.; Zhou, W.Y.; Li, J.Y.; Tu, H.Y. Changes in tillage characteristics of albic soil with various soil amendment materials. Soil Use Manag. 2024, 40, e13152. [Google Scholar] [CrossRef]
- Zang, D.Q.; Zhao, Y.H.; Luo, C.; Zhang, S.Q.; Dai, X.L.; Li, Y.; Liu, H.J. Improving the accuracy of soil organic matter mapping in typical Planosol areas based on prior knowledge and probability hybrid model. Soil Tillage Res. 2025, 246, 106358. [Google Scholar] [CrossRef]
- Tiruneh, G.A.; Meshesha, D.T.; Adgo, E.; Tsunekawa, A.; Haregeweyn, N.; Fenta, A.A.; Belay, A.W.; Tadesse, N.; Fekadu, G.; Reichert, J.M. Use of soil spectral reflectance to estimate texture and fertility affected by land management practices in Ethiopian tropical highland. PLoS ONE 2022, 17, e0270629. [Google Scholar] [CrossRef]
- Zhang, M.; Han, J.; Jiao, J.; Han, J.; Zhao, X.; Hu, K.; Kang, Y.; Jaffar, M.T.; Qin, W. Soil Carbon Management Index under Different Land Use Systems and Soil Types of Sanjiang Plain in Northeast China. Agronomy 2023, 13, 2533. [Google Scholar] [CrossRef]
- Sootahar, M.K.; Zeng, X.; Su, S.; Wang, Y.N.; Bai, L.Y.; Zhang, Y.; Li, T.; Zhang, X.J. The effect of fulvic acids derived from different materials on changing properties of albic black soil in the Northeast Plain of China. Molecules 2019, 24, 1535. [Google Scholar] [CrossRef]
- Liu, D.; Chen, W.F.; Li, L.N. Disentangling the relative effects of climate change and anthropogenic activities on paddy expansion in the northern Sanjiang Plain of China. Ecol. Indic. 2023, 154, 110543. [Google Scholar] [CrossRef]
- Huang, P.; Xie, H.; Li, D.; Hu, X.H.; Liu, C.L.; Kurshid, B.; Xu, Y.; Song, C.H.; Dai, C.S.; Khan, S.; et al. Projected high-resolution ETo spatiotemporal variation under future climate change and paddy area expansion in the Sanjiang Plain, Northeast China. J. Hydrol. Reg. Stud. 2023, 50, 101574. [Google Scholar] [CrossRef]
- Wang, S.Z.; Wang, M.Y.; Gao, X.; Zhao, W.Q.; Miao, P.W.; Liu, Y.N.; Zhang, R.T.; Wang, X.; Sui, X.; Li, M.H. The diversity and composition of soil microbial communities differ in three land use types of the Sanjiang Plain, Northeastern China. Microorganisms 2024, 12, 780. [Google Scholar] [CrossRef] [PubMed]
- Fekadu, G.; Adgo, E.; Meshesha, D.T.; Tsunekawa, A.; Haregeweyn, N.; Peng, F.; Tsubo, M.; Mulualem, T.; Demissie, S.; Kebede, B.; et al. Effect of soil amendments on soil respiration in the midland agroecological environment, Ethiopia. Environ. Earth Sci. 2024, 83, 216. [Google Scholar] [CrossRef]
- Parding, K.M.; Benestad, R.E.; Dyrrdal, A.V.; Lutz, J. A principal-component-based strategy for regionalisation of precipitation intensity–duration–frequency (IDF) statistics. Hydrol. Earth Syst. Sci. 2023, 27, 3719–3732. [Google Scholar] [CrossRef]
- Tiruneh, G.A.; Meshesha, D.T.; Adgo, E.; Tsunekawa, A.; Haregeweyn, N.; Fenta, A.A.; Reichert, J.M. A leaf reflectance-based crop yield modeling in Northwest Ethiopia. PLoS ONE 2022, 17, e0269791. [Google Scholar] [CrossRef] [PubMed]
- Lu, X.C.; Fan, X.X.; Zou, W.X.; Yan, J.; Chen, X.; Han, X.Z.; Deng, W.N. Effects of the construction of fertile and cultivated soil layer on soil fertility and maize yield in albic soil. China J. Appl. Ecol. 2023, 34, 883–891. [Google Scholar]
- Andrzejewska, A.; Biber, M. The Effect of Long-Term Soil System Use and Diversified Fertilization on the Sustainability of the Soil Fertility—Organic Matter and Selected Trace Elements. Sustainability 2025, 17, 2907. [Google Scholar] [CrossRef]
- Ma, X.Z.; Zhao, Y.; Zheng, Y.; Wang, L.L.; Zhang, Y.L.; Sun, Y.; Ji, J.H.; Hao, X.Y.; Liu, S.Q.; Sun, N. Effect of different fertilization on soil fertility, biological activity, and maize yield in the albic soil area of China. Plants 2025, 14, 810. [Google Scholar] [CrossRef]
- Wu, Z.Z.; Zhao, X.Y.; Yong, J.W.H.; Sehar, S.; Adil, M.F.; Riaz, M.; Verma, K.K.; Li, M.Y.; Huo, J.L.; Yang, S.; et al. Slow-release boron fertilizer improves yield and nutritional profile of Beta vulgaris L. grown in Northeast China by increasing boron supply capacity. Front. Plant Sci. 2024, 15, 1441226. [Google Scholar] [CrossRef]
- Priatmadi, B.J.; Septiana, M.; Saidy, A.R. Growth performance and yield of rice grown in three different types of soil collected from rice fields with coal fly ash application. Plant Soil Environ. 2023, 69, 314–323. [Google Scholar] [CrossRef]
- Xiu, L.Q.; Zhang, W.M.; Wu, D.; Sun, Y.Y.; Zhang, H.G.; Gu, W.Q.; Meng, J.; Chen, W.F. Heat storage capacity and temporal-spatial response in the soil temperature of albic soil amended with maize-derived biochar for 2 years. Soil Tillage Res. 2020, 205, 104762. [Google Scholar]
- Klik, B.; Jachimowicz, P.; Liniauskiene, E.; Gusiatin, M.; Radzevičius, A.; Brtnicky, M.; Radziemska, M. Ash from gasification of poultry feathers for heavy metal immobilization under assisted phytostabilization in soils. Sci. Rev. Eng. Environ. Sci. 2024, 33, 131–143. [Google Scholar] [CrossRef]
- Gawryszewska, B.; Majewski, G.; Lasocki, M.; Klik, B.; Dzieduszyński, T.; Melon, M.; Kaczorowska, M.; Derewońko, D.; Radziemska, M. It is not risky, it is healthy. Assessing of soil enzymatic activity, heavy metal contamination, and health risk for urban gardens land development in Warsaw, Poland. Land Degrad. Dev. 2025, 36, 3379–3392. [Google Scholar] [CrossRef]


| Nutrient Content | Location | Mean | Minimum | Maximum | Standard Deviation | Variance | Coefficient of Variation |
|---|---|---|---|---|---|---|---|
| TN (g/kg) | L1 | 2.79 | 2.29 | 3.20 | 0.34 | 0.12 | 0.12 |
| L2 | 2.75 | 2.60 | 2.87 | 0.11 | 0.01 | 0.04 | |
| TP (g/kg) | L1 | 1.12 | 0.93 | 1.23 | 0.12 | 0.01 | 0.11 |
| L2 | 1.25 | 1.19 | 1.30 | 0.05 | 0.01 | 0.04 | |
| TK (g/kg) | L1 | 15.03 | 14.71 | 15.45 | 0.36 | 0.13 | 0.02 |
| L2 | 13.68 | 13.20 | 13.98 | 0.33 | 0.11 | 0.02 | |
| HN (mg/kg) | L1 | 313.54 | 264.34 | 353.69 | 32.85 | 109.43 | 0.10 |
| L2 | 305.49 | 295.14 | 319.36 | 10.22 | 104.36 | 0.03 | |
| AP (mg/kg) | L1 | 22.05 | 19.70 | 25.81 | 2.39 | 5.73 | 0.11 |
| L2 | 25.55 | 21.18 | 31.18 | 3.81 | 14.53 | 0.15 | |
| AK (mg/kg) | L1 | 113.08 | 101.05 | 121.88 | 7.91 | 62.56 | 0.07 |
| L2 | 140.58 | 130.79 | 146.78 | 7.19 | 51.71 | 0.05 | |
| OM (%) | L1 | 4.97 | 4.05 | 5.59 | 0.58 | 0.34 | 0.12 |
| L2 | 5.13 | 4.95 | 5.37 | 0.18 | 0.03 | 0.04 | |
| pH | L1 | 5.22 | 5.00 | 5.44 | 0.19 | 0.04 | 0.04 |
| L2 | 5.14 | 4.87 | 5.26 | 0.16 | 0.03 | 0.03 |
| Nutrient Content | Location | Mean | Minimum | Maximum | Standard Deviation | Variance | Coefficient of Variation |
|---|---|---|---|---|---|---|---|
| TN (g/kg) | L1 | 0.64 | 0.60 | 0.71 | 0.05 | 0.01 | 0.07 |
| L2 | 0.70 | 0.58 | 0.77 | 0.08 | 0.01 | 0.11 | |
| TP (g/kg) | L1 | 0.45 | 0.41 | 0.53 | 0.05 | 0.01 | 0.11 |
| L2 | 0.47 | 0.38 | 0.52 | 0.05 | 0.01 | 0.12 | |
| TK (g/kg) | L1 | 19.01 | 18.13 | 20.06 | 0.80 | 0.64 | 0.04 |
| L2 | 16.96 | 16.67 | 17.24 | 0.23 | 0.05 | 0.01 | |
| HN (mg/kg) | L1 | 66.90 | 63.04 | 72.24 | 3.39 | 11.46 | 0.05 |
| L2 | 67.73 | 53.90 | 76.92 | 9.26 | 85.73 | 0.14 | |
| AP (mg/kg) | L1 | 5.40 | 4.74 | 6.09 | 0.55 | 0.30 | 0.10 |
| L2 | 5.91 | 4.98 | 6.60 | 0.62 | 0.39 | 0.11 | |
| AK (mg/kg) | L1 | 68.61 | 62.02 | 77.13 | 5.85 | 34.20 | 0.09 |
| L2 | 77.76 | 71.00 | 82.48 | 4.40 | 19.35 | 0.06 | |
| OM (%) | L1 | 1.39 | 1.05 | 1.73 | 0.31 | 0.09 | 0.22 |
| L2 | 1.51 | 1.23 | 1.79 | 0.23 | 0.05 | 0.15 | |
| pH | L1 | 4.77 | 4.67 | 4.96 | 0.13 | 0.02 | 0.03 |
| L2 | 5.20 | 4.97 | 5.48 | 0.24 | 0.06 | 0.05 |
| Nutrient Content | Research Subject | Mean | Standard Deviation | Regression Statistic | |||
|---|---|---|---|---|---|---|---|
| Mean Difference | t | p | Cohen’s d | ||||
| TN | Black soil layer | 2.77 | 0.24 | 2.1 | 25.574 | 0.000 ** | 8.087 |
| Albic soil layer | 0.67 | 0.07 | |||||
| TP | Black soil layer | 1.19 | 0.11 | 0.73 | 19.398 | 0.000 ** | 6.134 |
| Albic soil layer | 0.46 | 0.05 | |||||
| TK | Black soil layer | 17.98 | 1.21 | 3.63 | 16.53 | 0.000 ** | 6.227 |
| Albic soil layer | 14.36 | 0.78 | |||||
| HN | Black soil layer | 309.52 | 23.33 | 242.2 | 32.306 | 0.000 ** | 10.216 |
| Albic soil layer | 67.32 | 6.59 | |||||
| AP | Black soil layer | 23.8 | 3.52 | 18.15 | 16.705 | 0.000 ** | 5.283 |
| Albic soil layer | 5.65 | 0.61 | |||||
| AK | Black soil layer | 126.83 | 16.15 | 53.64 | 12.493 | 0.000 ** | 3.951 |
| Albic soil layer | 73.19 | 6.86 | |||||
| OM | Black soil layer | 5.05 | 0.41 | 3.59 | 21.006 | 0.000 ** | 6.643 |
| Albic soil layer | 1.45 | 0.27 | |||||
| pH | Black soil layer | 5.18 | 0.17 | 0.2 | 1.916 | 0.088 | 0.606 |
| Albic soil layer | 4.98 | 0.29 | |||||
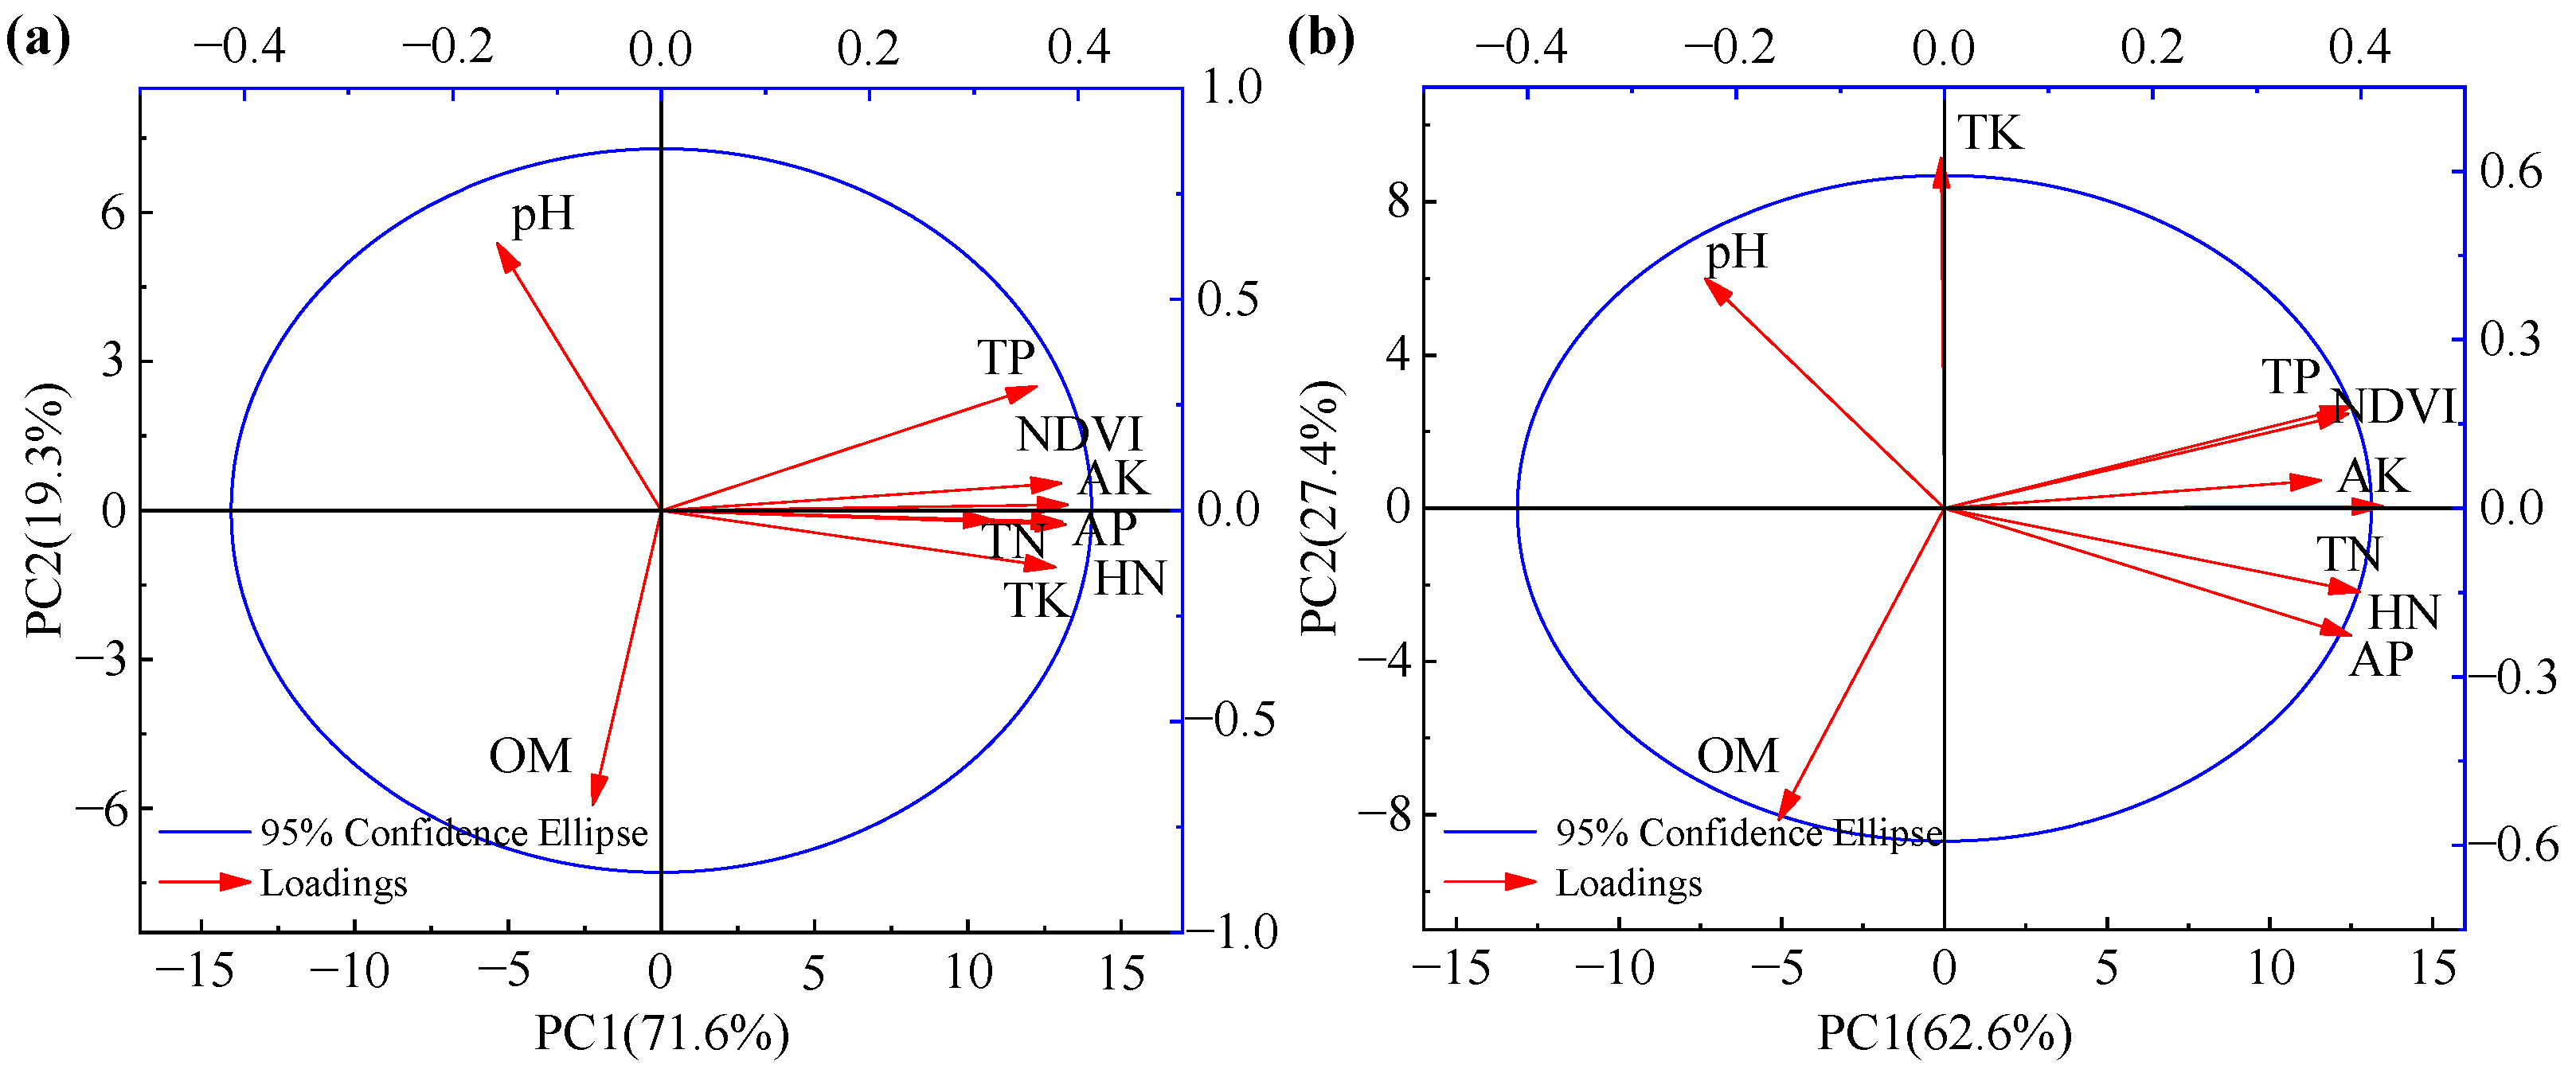
| Factor Coding | Chernozem Layer | Kaolinite Clay Layer | ||||
|---|---|---|---|---|---|---|
| Eigenvalue | Explained Variance Ratio/% | Cumulative/% | Eigenvalue | Explained Variance Ratio/% | Cumulative/% | |
| 1 | 4.584 | 57.297 | 57.297 | 5.020 | 62.745 | 62.745 |
| 2 | 2.398 | 29.978 | 87.275 | 1.423 | 17.785 | 80.530 |
| 3 | 0.709 | 8.859 | 96.133 | 1.264 | 15.794 | 96.324 |
| 4 | 0.155 | 1.933 | 98.066 | 0.198 | 2.476 | 98.801 |
| 5 | 0.093 | 1.160 | 99.226 | 0.069 | 0.865 | 99.666 |
| 6 | 0.048 | 0.596 | 99.822 | 0.015 | 0.183 | 99.848 |
| 7 | 0.014 | 0.178 | 99.915 | 0.008 | 0.096 | 99.944 |
| 8 | 0 | 0 | 100 | 0.004 | 0.056 | 100 |
Disclaimer/Publisher’s Note: The statements, opinions and data contained in all publications are solely those of the individual author(s) and contributor(s) and not of MDPI and/or the editor(s). MDPI and/or the editor(s) disclaim responsibility for any injury to people or property resulting from any ideas, methods, instructions or products referred to in the content. |
© 2025 by the authors. Licensee MDPI, Basel, Switzerland. This article is an open access article distributed under the terms and conditions of the Creative Commons Attribution (CC BY) license (https://creativecommons.org/licenses/by/4.0/).
Share and Cite
Li, J.; Li, H.; Wang, Q.; Wang, Y.; Hong, X.; Zhou, C. Study on the Distribution and Quantification Characteristics of Soil Nutrients in the Dryland Albic Soils of the Sanjiang Plain, China. Agronomy 2025, 15, 1857. https://doi.org/10.3390/agronomy15081857
Li J, Li H, Wang Q, Wang Y, Hong X, Zhou C. Study on the Distribution and Quantification Characteristics of Soil Nutrients in the Dryland Albic Soils of the Sanjiang Plain, China. Agronomy. 2025; 15(8):1857. https://doi.org/10.3390/agronomy15081857
Chicago/Turabian StyleLi, Jingyang, Huanhuan Li, Qiuju Wang, Yiang Wang, Xu Hong, and Chunwei Zhou. 2025. "Study on the Distribution and Quantification Characteristics of Soil Nutrients in the Dryland Albic Soils of the Sanjiang Plain, China" Agronomy 15, no. 8: 1857. https://doi.org/10.3390/agronomy15081857
APA StyleLi, J., Li, H., Wang, Q., Wang, Y., Hong, X., & Zhou, C. (2025). Study on the Distribution and Quantification Characteristics of Soil Nutrients in the Dryland Albic Soils of the Sanjiang Plain, China. Agronomy, 15(8), 1857. https://doi.org/10.3390/agronomy15081857