Article

Ozone Stress During Rice Growth Impedes Grain-Filling Capacity of Inferior Spikelets but Not That of Superior Spikelets

1
Jiangsu Key Laboratory of Crop Genetics and Physiology, Co-Innovation Center for Modern Production Technology of Grain Crops, Yangzhou University, Yangzhou 225009, China
2
College of Environmental Science and Engineering, Yangzhou University, Yangzhou 225127, China
*
Authors to whom correspondence should be addressed.
Agronomy 2025, 15(8), 1809; https://doi.org/10.3390/agronomy15081809 (registering DOI)
Submission received: 27 May 2025 / Revised: 19 July 2025 / Accepted: 24 July 2025 / Published: 26 July 2025

Abstract

Ozone pollution decreases rice yield and quality in general, but how ozone stress changes grain-filling capacity is unclear. A chamber experiment was conducted to compare the effects of ozone exposure during the rice growth season on the grain-filling capacity and quality of spikelets located on the upper primary rachis (superior spikelets, SS) and the lower secondary rachis (inferior spikelets, IS). Ozone stress significantly decreased filled grain percentage by 41.4% and grain mass by 10.2% in IS, but had little effect on grain-filling capacity in SS. Consistent with the reduction in grain mass, ozone stress decreased grain volume, mainly due to reduced grain thickness, and IS was reduced more than SS. After removing the hull, brown rice obtained from ozone treatment exhibited higher proportions of immature and abnormal kernels, resulting in a substantially lower proportion of perfect kernels. Under ozone stress, the proportion of perfect kernels was only one-third in IS, compared with two-thirds in SS. Ozone stress affected the pasting properties of brown rice for both SS and IS, as shown by the decreased amylose content, and the increased maximum viscosity, minimum viscosity, final viscosity, setback, and peak time of the rapid visco analyzer profile. Out of fourteen traits related to nutritional quality of brown rice, only five showed significant increases under ozone stress, and they were the concentrations of albumin, prolamin, sulfur, copper, and manganese. The differential ozone responses between SS and IS were rather small for rice pasting properties and chemical compositions as shown by very few significant interactions between ozone and grain position. It is concluded that ozone stress during plant growth imposed more adverse effects on IS than SS in terms of grain-filling capacity and appearance quality, suggesting an enlarged asynchronous grain-filling pattern in rice panicles under ozone pollution. Strategies to improve the grain-filling capacity of IS are needed to mitigate ozone-induced damage to rice production.

1. Introduction

Ambient ozone concentrations in major urban areas across many Asian countries, including China and India, have continued to rise in recent years due to increasing emissions of anthropogenic precursors such as carbon monoxide, nitrogen oxides, and volatile organic compounds [1,2]. Since ozone precursors can travel long distances from urban centers to rural areas, ozone pollution is also prevalent in agricultural sites. Over the past two decades, research groups have reported that ambient ozone concentrations impose negative impacts on agricultural crops, with certain crop species being more sensitive than others [3,4]. Rice shows a moderate sensitivity to ozone [3,5,6]. An earlier meta-analysis revealed that an ozone concentration of 31–50 nL L−1 reduced rice yield by 17.5%, and an ozone concentration of 51–75 nL L−1 could drive a further ca. 10% loss in rice yield [3]. A recent meta-analysis estimated crop responses to a given change in ozone concentration using AOT40 (the hourly accumulated exposure over a threshold ozone concentration of 40 nL L−1 during daylight hours), and found a significant reduction of approximately 2% in yield or biomass per unit AOT40 for rice [7].
Ozone pollution not only reduces grain yield but also affects rice quality [8,9,10,11]. In fact, one study found that even if the ozone level was not high enough to cause significant reductions in yield, it could alter the grain quality of Japonica rice cv. Koshihikari, especially its appearance quality [12]. Unlike other small-grain cereals, the majority of rice is marketed and consumed as whole grain rather than as a processed product, with its appearance being critical for consumer acceptance [13,14]. Rice appearance quality has shown consistent responses to ozone elevation in several previous experiments: the proportion of chalky kernels was significantly increased by elevated ozone, possibly due to incomplete grain filling or loose packing of endosperm starch granules [9,10,12,15].
Grain quality is formed during the grain-filling period, but it also in part reflects the overall changes in plant physiological processes accumulated before flowering [16]. Experiments on soybean and wheat have revealed that the impact of ozone increased with developmental stages, with the largest detrimental impact during grain filling [17,18]. When rice plants are subjected to ozone stress throughout the entire cropping season, the accumulative effects of ozone on leaf photosynthesis, assimilate allocation, and antioxidant defense systems would lead to alterations in grain-filling capacity and grain quality, but this hypothesis has not been thoroughly investigated [15].
Rice spikelets exhibit different patterns of grain filling depending on their position within a panicle. Spikelets located on the upper primary rachis branches typically flower earlier, their caryopses elongate soon after anthesis, have a higher grain-filling rate and produce large grains at maturity. In contrast, spikelets located on the secondary rachis branches of the lower primary rachis flower later and undergo a delayed and less effective grain-filling process, resulting in smaller grains [19,20,21]. The former and latter types of spikelets are referred to as superior spikelets (SS) and inferior spikelets (IS), respectively [22,23,24,25].
Previous studies have demonstrated that IS exhibits greater sensitivity to environmental stresses (e.g., high temperature, drought) compared to SS, as shown by more reductions in grain-filling efficiency and quality due to impaired assimilate synthesis and translocation [26,27,28]. The asynchronous grain-filling pattern between SS and IS in rice panicles may also be enlarged when rice plants are grown under ozone stress. Firstly, elevated ozone concentrations can reduce leaf carbohydrate and nitrogen contents of rice during grain filling, which partially explains the quality deterioration such as the increases in grain chalkiness [15]. Secondly, ozone-induced senescence of functional leaves progresses with prolonged exposure time [15,29,30], so the assimilate demand of IS during the late grain-filling stage in a panicle will be more difficult to meet than that of SS, the rapid grain growth rate of which occurs soon after fertilization [31]. Based on these experimental evidence, we hypothesized that ozone stress differentially affects the development of grains located at different positions on a panicle, with IS being more vulnerable than SS in both grain size and quality. To test this hypothesis, a Japonica rice cultivar, Nanjing 9108 (NJ 9108), was chosen due to its elite cooking and eating quality [32] as well as its tolerance to ozone stress [33]. The findings from this study will advance our understanding of rice grain development under elevated ozone conditions and pave the foundation for searching for practices to secure rice production under climate change scenarios.

2. Materials and Methods

2.1. Plant Materials and Cultivation

The experiment was conducted on the campus of the Agricultural College, Yangzhou University (Yangzhou, China) in 2015. Seeds of the japonica rice cultivar NJ 9108 were germinated and grown in a nursery for 32 days and then manually transplanted (two plants per hill) to concrete tanks filled with paddy soil at 18 × 17 cm spacing (equivalent to 27 hills m−2). Fertilizers were applied at rates of 15 g N m−2, 7 g P2O5 m−2, and 7 g K2O m−2 using a compound chemical fertilizer (N:P2O5:K2O = 15:15:15%) and urea (46.7%). One day before transplanting, 9 g N m−2, 7 g P2O5 m−2, and 7 g K2O m−2 were applied as a basal dressing, and an additional 6 g N m−2 was applied at panicle initiation. The concrete tanks were placed inside four independent glasshouse-type fumigation chambers, measuring 3 × 3 × 1.7 m. The seedlings of NJ 9108 were grown in two blocks inside each concrete tank. Two chambers were assigned to the elevated ozone treatment (Ozone), and another two chambers without ozone fumigation were used as the control (Control). Microclimatic conditions in each chamber were monitored at 1-min intervals by a temperature/humidity sensor (EE21, E+E Elektronik GmbH, Engerwitzdorf, Austria), and the data were analyzed by a main control system (S7-200, Siemens, Nürnberg, Germany), which used computer feedback to regulate each environmental factor to the target level in each chamber.
Throughout the experiment (from 11 June to 22 September), air temperatures inside the chambers were set to match ambient conditions unless ambient temperatures exceeded 35 °C, in which case air temperatures inside chambers were maintained at 35 °C. We established an upper temperature threshold of 35 °C inside the chambers to ensure successful grain harvest for experimental analysis. The range of daily average temperature during the rice growth season was 20–35 °C. Relative humidity was set to 75% before 22 July and thereafter to 70%. Throughout the experiment, plants were exposed to natural light, and the soil was kept water-saturated.

2.2. Ozone Treatment

Ozone treatment was conducted using a fumigation system described previously [10,15]. Ozone was produced by an electric discharge ozone generator (QD-001-3A, Jiahuan, Guangzhou, China) using pure O2 as the source gas, and delivered to the chamber after being quickly mixed with air in a gas mixture unit through a high-speed fan. Ozone concentration in each chamber was monitored by an ozone analyzer (model 49i, Thermo Scientific Co., Franklin, MA, USA), and the data were analyzed by the main control system to regulate ozone concentration at the target level. All ozone analyzers were calibrated against a standard (Thermo Electron 49i-PS, Thermo Scientific Co., Franklin, MA, USA) on a monthly basis. The ozone treatment was initiated on 1 July at a target concentration of 100 nL L−1 from 9:00 a.m. to 5:00 p.m. and continued until 4 September. The actual measured average ozone concentrations in the chambers were: 100.3 nL L−1 (Ozone) and 18.1 nL L−1 (Control). The recorded environmental conditions and ozone concentrations inside the chambers and in the ambient air throughout the experiment period are summarized in Table 1.

2.3. Sampling and Analyses

Rice panicles were harvested at plant maturity. Panicles from six plants in each block were pooled in order to obtain enough grains for the analysis. The grains of SS and IS were separately collected according to Zhang et al. [31] with some modifications. In brief, a panicle was divided into two sections from the middle of the panicle, with apical and basal parts having an equal number of primary branches (when the number of primary branches was odd, the upper part had one more branch than the lower part). The grains on the primary branches of the apical section were collected and defined as SS, while the grains on the secondary branches of the basal section were collected and defined as IS (Figure 1). The filled grains and the unfilled grains from SS or IS were separated by hand, and the grain number was counted. The filled grain percentage and grain mass of filled grains were determined.
Thirty filled grains from each group were randomly selected to measure the grain size (length, width, and thickness) by using an electronic digital caliper (Guanglu Measuring Instrument Co., Guilin, China). Grain volume (V, mm3) was calculated as follows: V = (4/3) × (L/2) × (D/2) × (T/2) × π; where L, D, and T are the length (mm), width (mm), and thickness (mm) of the grain, respectively. Grain density was calculated by dividing grain mass (mg) by grain volume (mm3).
The filled grains were dehulled using a rice huller (SY88-TH, Ssangyong Ltd., Incheon, Republic of Korea) to obtain brown rice. We separated brown rice into perfect, immature, and abnormal grains by visual inspection, and the proportions of perfect, immature, and abnormal grains were calculated. Perfect grains were defined as brownish grains with normal size, immature grains were defined as green grains with normal size, and abnormal grains were those exhibiting smaller size, irregular shape, or bearing black mold spots. After that, the rice samples were pooled and ground into flour with a Vibration Disc Mill (TS1000, Siebtechnik GmbH, Muehlheim an der Ruhr, Germany) for the following chemical composition analysis.
Amylose content was determined by using a colorimetric method, which is based on the ability of amylose to bind to iodine (China National Standard GB/T 17891–1999 [34]). In brief, around 20 mg of rice powder was extracted in 1.8 mL of 1 mol L−1 NaOH at 65 °C for 1 h. Subsequently, 50 μL of suspension was mixed with 9 mL of distilled water, 100 μL of 1 mol L−1 sodium acetate, and 100 μL of 0.04% iodine solution. The absorbance of the mixture was measured at 620 nm.
The pasting properties of rice flours were determined with a Rapid Viscosity Analyzer (RVA) (RVA-Tec Master, Perten, Australia), using the Thermal Cycle for Windows software. The pasting properties are expressed as the maximum viscosity, minimum viscosity, breakdown, final viscosity, setback, peak time, and gelatinization temperature. Values for viscosity were recorded as centiPoises (cP).
Brown rice flour was subjected to protein fraction extraction according to Ju et al. [35]. Firstly, 0.2 g of rice flour sample was defatted with hexane by vortexing for 30 min at 25 °C, followed by centrifugation (8000× g, 15 min), and the defatted pellet was air-dried overnight to remove residual solvent. Sequential protein extraction was then conducted using four solvents: (1) distilled water at 4 °C for 2 h to extract albumin, (2) 10% NaCl at 25 °C for 1 h to extract globulin, (3) 70% ethanol at 60 °C for 1 h to extract prolamin, and (4) 0.02 mol L−1 NaOH at 25 °C for 2 h to extract glutelin. After each extraction step, the suspension was centrifuged (12,000× g for albumin and globulin, 10,000× g for prolamin, and 15,000×g for glutelin, respectively, all for 30 min at corresponding extraction temperatures). Nitrogen content in each supernatant was determined by the Kjeldahl method using Kjeltec 8400 auto analyzer (Foss Analytical AB, Hoganas, Sweden) with acid digestion (420 °C for 60 min in concentrated H2SO4 with K2SO4/CuSO4 catalyst), steam distillation (40% NaOH), and titration (0.1 mol L−1 HCl). Protein content was calculated by multiplying nitrogen content by a rice-specific conversion factor of 5.95.
Phytate concentration was measured according to Vaintraub and Lapteva [36] with some modifications. In brief, about 0.25 g of sample material was weighed into centrifuge tubes and extracted with 5 mL of 0.7% HCl for 1 h under agitation (25 °C, 150 rpm). After centrifugation at 4000 rpm for 15 min, the supernatant was collected and the phytate concentration in the supernatant was determined using Wade reagent, which contained 18 mg of FeCl3 and 300 mg of sulfosalicylic acid in 100 mL of deionized H2O. The absorbance was measured at 500 nm.
For nutrient element analysis, 0.5 g of sample material was wet digested with concentrated HNO3 in a Teflon incubation apparatus at 180 °C for 10 min by using a microwave digestion system (MARS 5, CEM Corporation, Matthews, NC, USA). After dilution with ultrapure water, the solution was filtered and the concentrations of phosphorus (P), potassium (K), calcium (Ca), magnesium (Mg), sulfur (S), boron (B), copper (Cu), manganese (Mn), and zinc (Zn) in the solutions were quantified by ICP (iCAP 6300, Thermo Fisher Scientific, Franklin, MA, USA). The rice standard reference material (GBW080684) was used to ensure precision of the analytical procedures.

2.4. Statistics

For the grain quality analysis, samples were taken separately from each of the two blocks within each chamber. Data were subjected to ANOVA using the PROC MIXED procedure in SAS software (version 9.4, SAS Institute Inc., Cary, NC, USA) with ozone treatment, grain position, and their interactions as fixed effects, and chamber and chamber × block as random effects. Two independent chambers per treatment were considered true replicates, and two independent blocks within the same chamber as sampling units, but not as true replicates. This mixed model has been used previously in comparable experiments [37,38]. Significant differences between mean values were determined by Tukey’s post-hoc comparison. All figures were generated by R software (version 4.3.2, https://cran.r-project.org accessed on 10 March 2024) and Excel 2016 (Microsoft, Redmond, WA, USA). All tables were created in Excel 2016.

3. Results

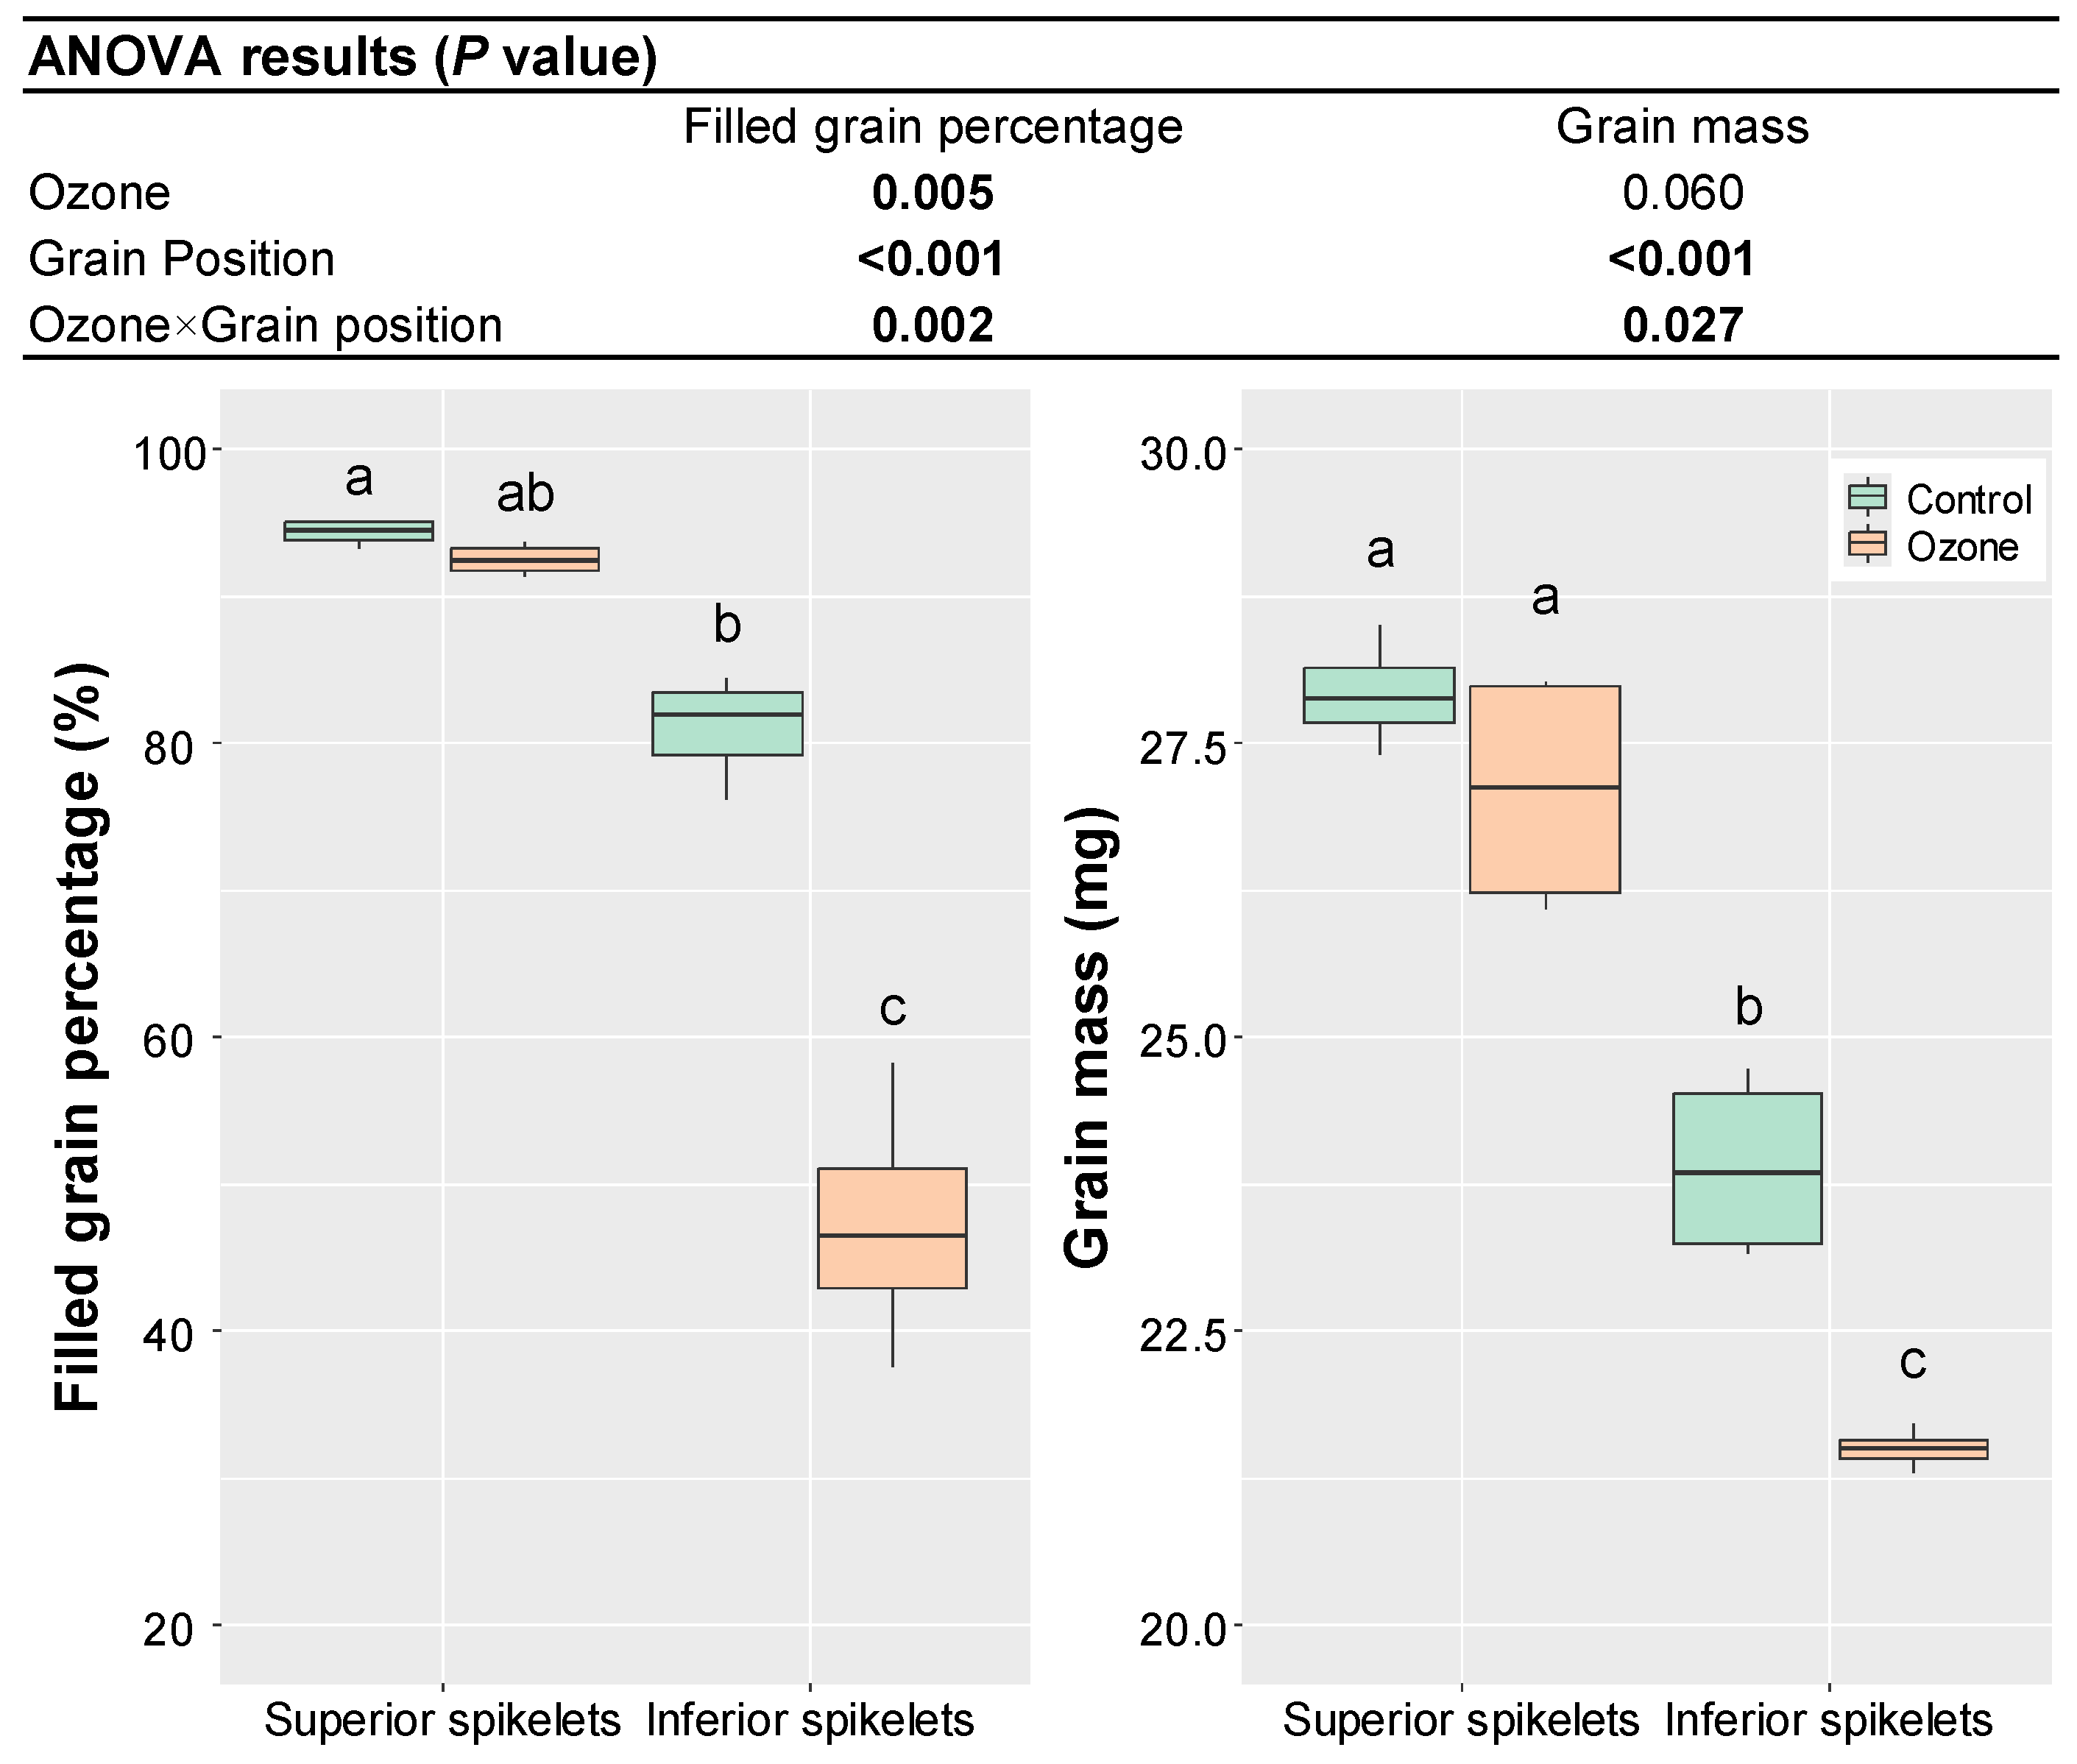
Grain-filling capacity of spikelets was assessed by filled grain percentage and grain mass (Figure 2). Under both ozone stress and the control condition, higher filled grain percentage and grain mass were detected in SS than in IS, showing significant position variations (p < 0.001). Ozone stress during rice growth decreased filled grain percentage of both SS (−1.6%, p = 0.768) and IS (−41.4%, p < 0.001), relative to their respective controls, resulting in a significant ozone by grain position interaction. Similar to filled grain percentage, grain mass of IS was decreased by 10.2% (p < 0.05) under ozone stress compared to the control condition, while the reduction in grain mass of SS was slight and statistically nonsignificant (−3.1%, p = 0.303). The results indicated that the ozone effect on SS was negligible compared with the more severe damage on grain-filling capacity of IS.
SS had larger grain size than IS, as indicated by the higher grain volume, length, width, and thickness (Table 2). Under ozone stress, grain volume was reduced in both SS and IS when compared with their respective controls, with the reductions of 5.9% (p < 0.05) in SS and 8.8% (p < 0.05) in IS, respectively. The decreased grain volume was mainly attributed to the ozone-induced reductions in grain thickness, which were 4.0% in SS (p < 0.001) and 7.6% in IS (p < 0.001), respectively. Among all grain size traits, only grain thickness showed a significant ozone by grain position interaction, with the grain thickness of IS being reduced more by ozone than that of SS. Since grain mass was also decreased by ozone (Figure 2), the simultaneous decreases in grain volume and grain mass under ozone stress resulted in no change in grain density (Table 2).
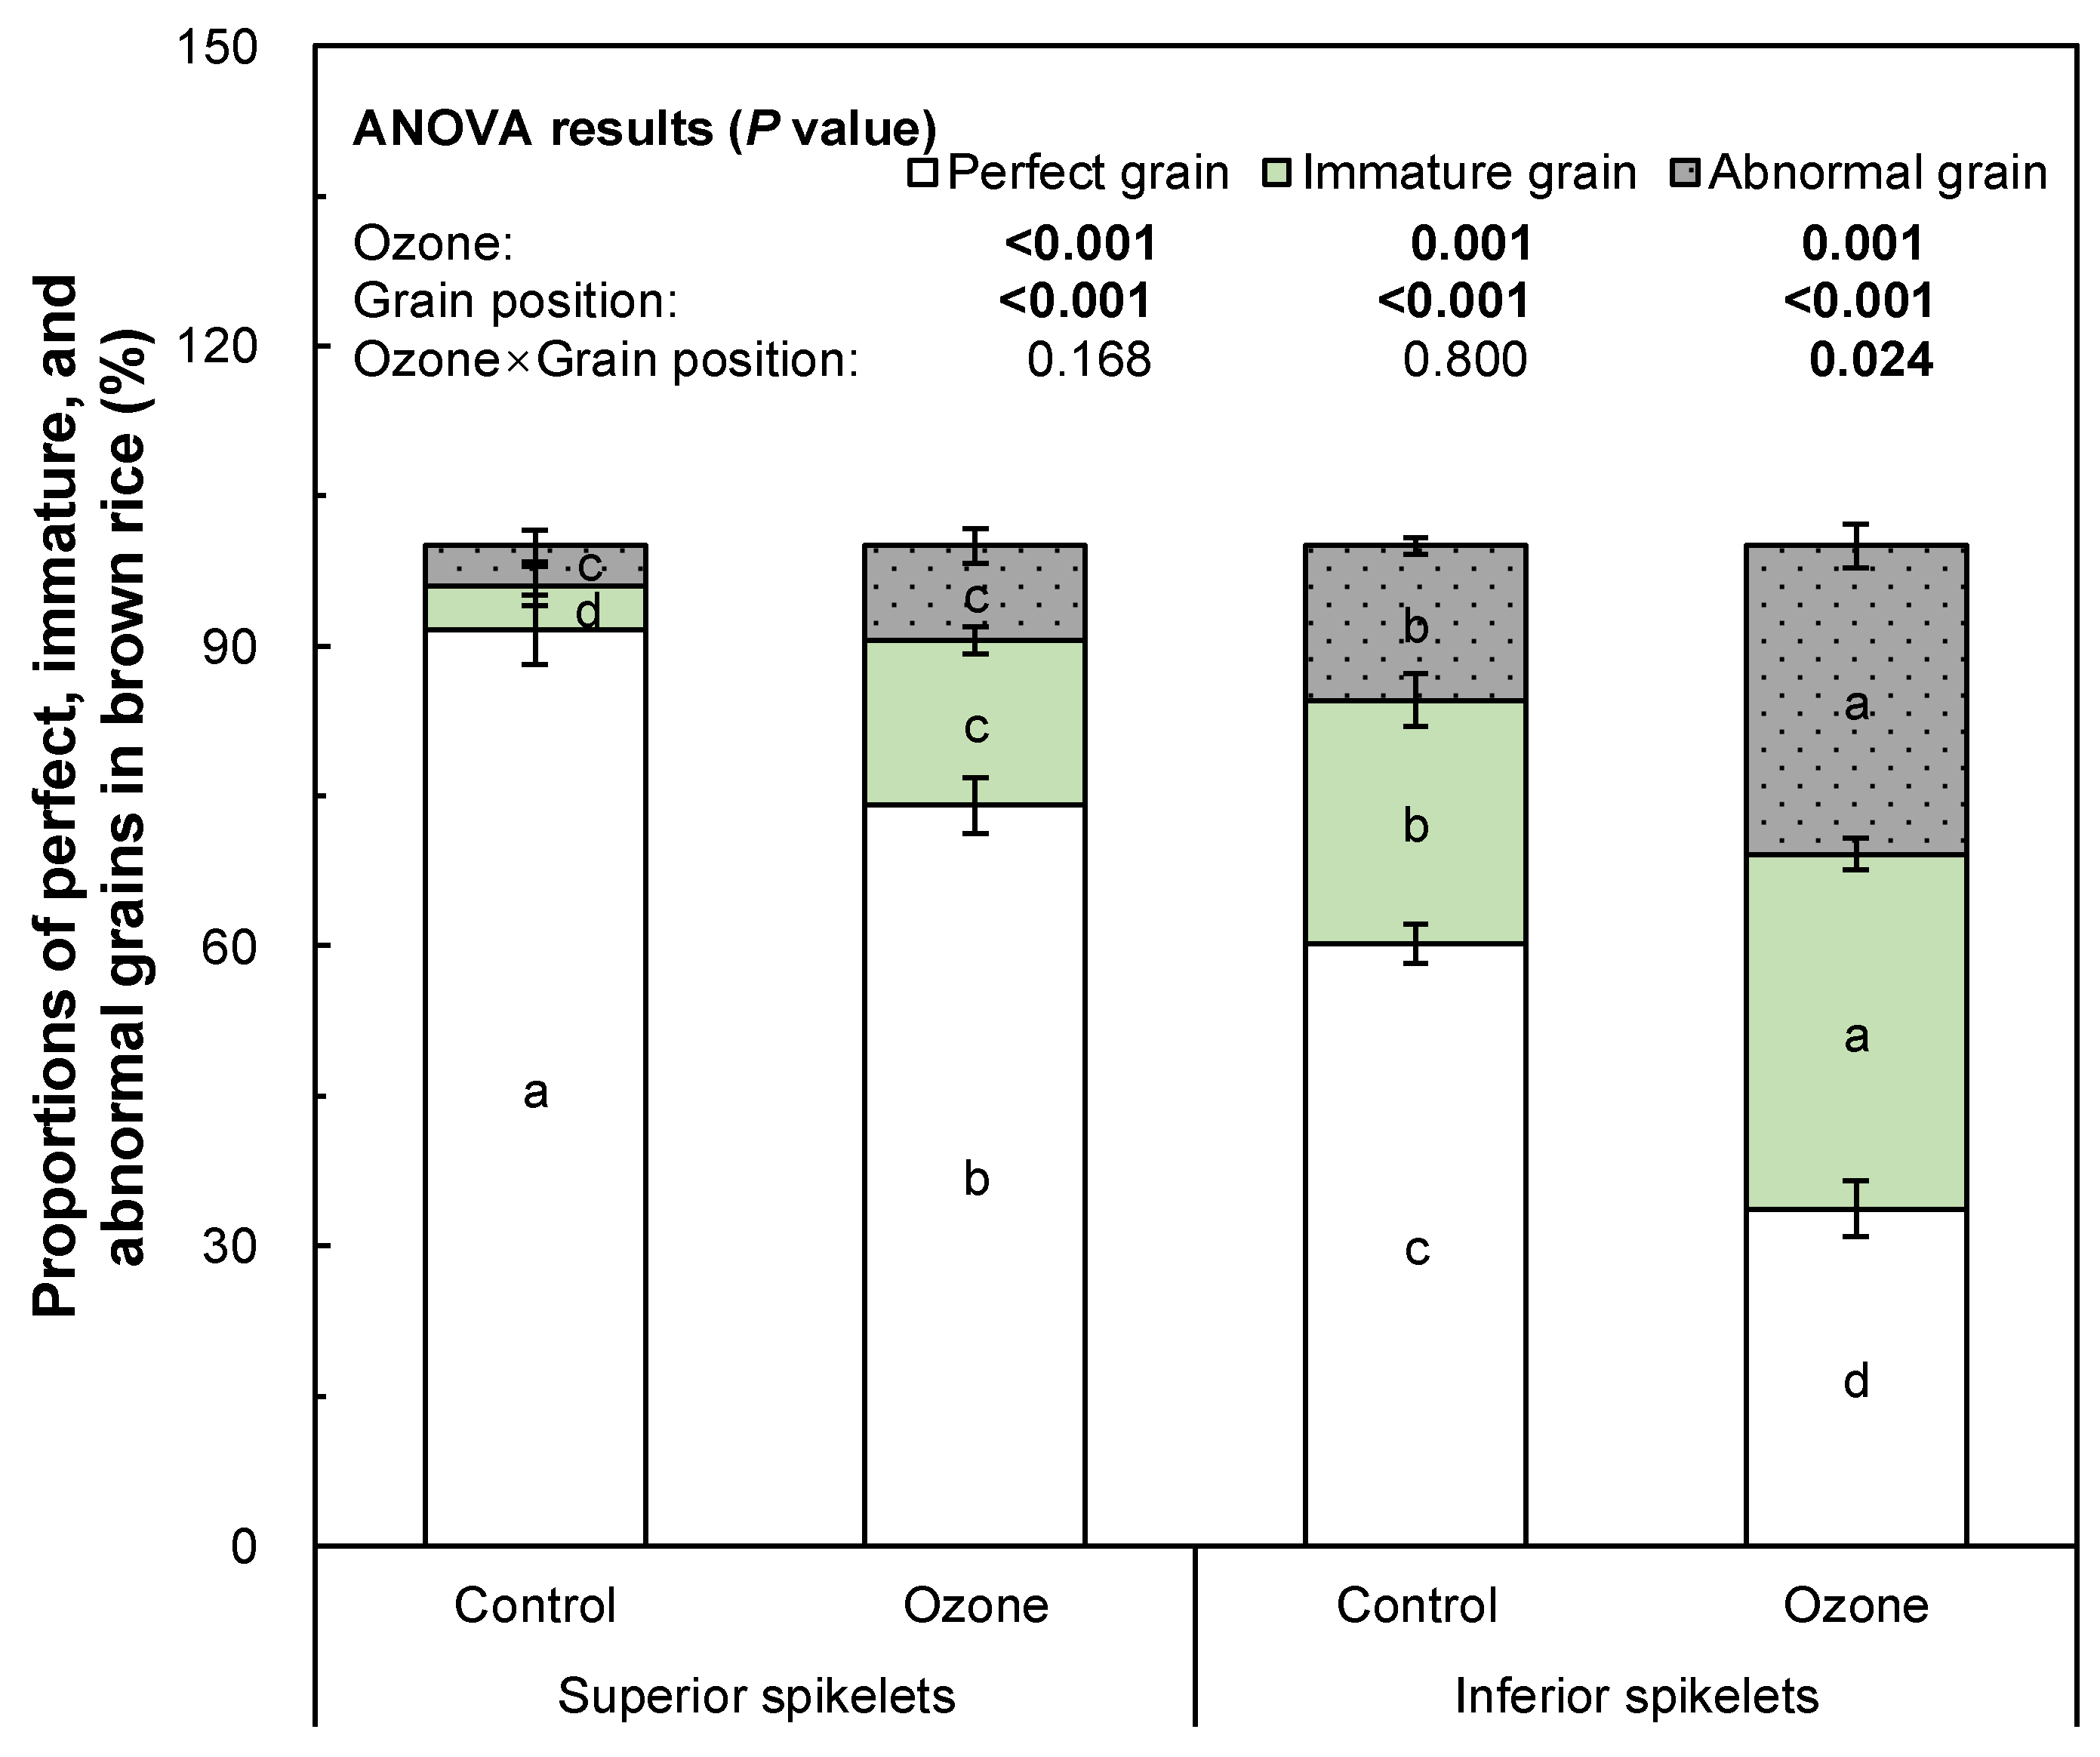
Brown rice was classified into three categories through visual inspection: perfect, immature, and abnormal grains (Figure 3). SS had a higher proportion of perfect grains and lower proportions of immature and abnormal grains than IS under either control or ozone conditions. Ozone stress decreased the proportion of perfect kernels and increased the proportions of immature and abnormal grains. The proportion of perfect grains fell from 91.6% under the control condition to 74.0% under high ozone treatment for SS, while it fell from 60.2% under the control condition to 33.7% under high ozone treatment for IS. The proportion of immature grains rose from 4.4% under the control condition to 16.5% under high ozone treatment for SS, while it rose from 24.3% under the control condition to 35.4% under high ozone treatment for IS. The proportions of abnormal grains under ozone stress were 137.6% and 99.9% higher than those under the control condition in SS and IS, respectively.
In general, IS had lower amylose content than SS (Table 3). Under ozone stress, the amylose content of IS was reduced by 10.2% (p < 0.05) compared to its control, while that of SS showed a smaller, nonsignificant reduction of 6.6% (p = 0.120). However, no significant ozone by grain position interaction was detected for amylose content. Starch pasting properties of rice flour were characterized by the RVA profile, which estimates the texture and stickiness of cooked rice. There was no difference between SS and IS with regard to the starch pasting properties. Compared to the control condition, ozone stress increased maximum viscosity by 9.8% (p < 0.01), minimum viscosity by 24.7% (p < 0.01), final viscosity by 21.4% (p < 0.001), setback by 60.2% (p < 0.01), and peak time by 6.1% (p < 0.01) in SS, while it tended to decrease breakdown by 8.7% (p = 0.115) (Table 3). Similar trends were found in IS, as shown by increases in maximum viscosity (4.4%, p = 0.072), minimum viscosity (12.9%, p < 0.05), final viscosity (14.0%, p < 0.01), setback (72.2%, p < 0.01), and peak time (4.2%, p < 0.05), and a decrease in breakdown (−6.8%, p = 0.206) under ozone stress. However, significant ozone by grain position interactions were detected for the minimum viscosity and final viscosity: for both parameters, the increases by ozone were smaller in IS than in SS.
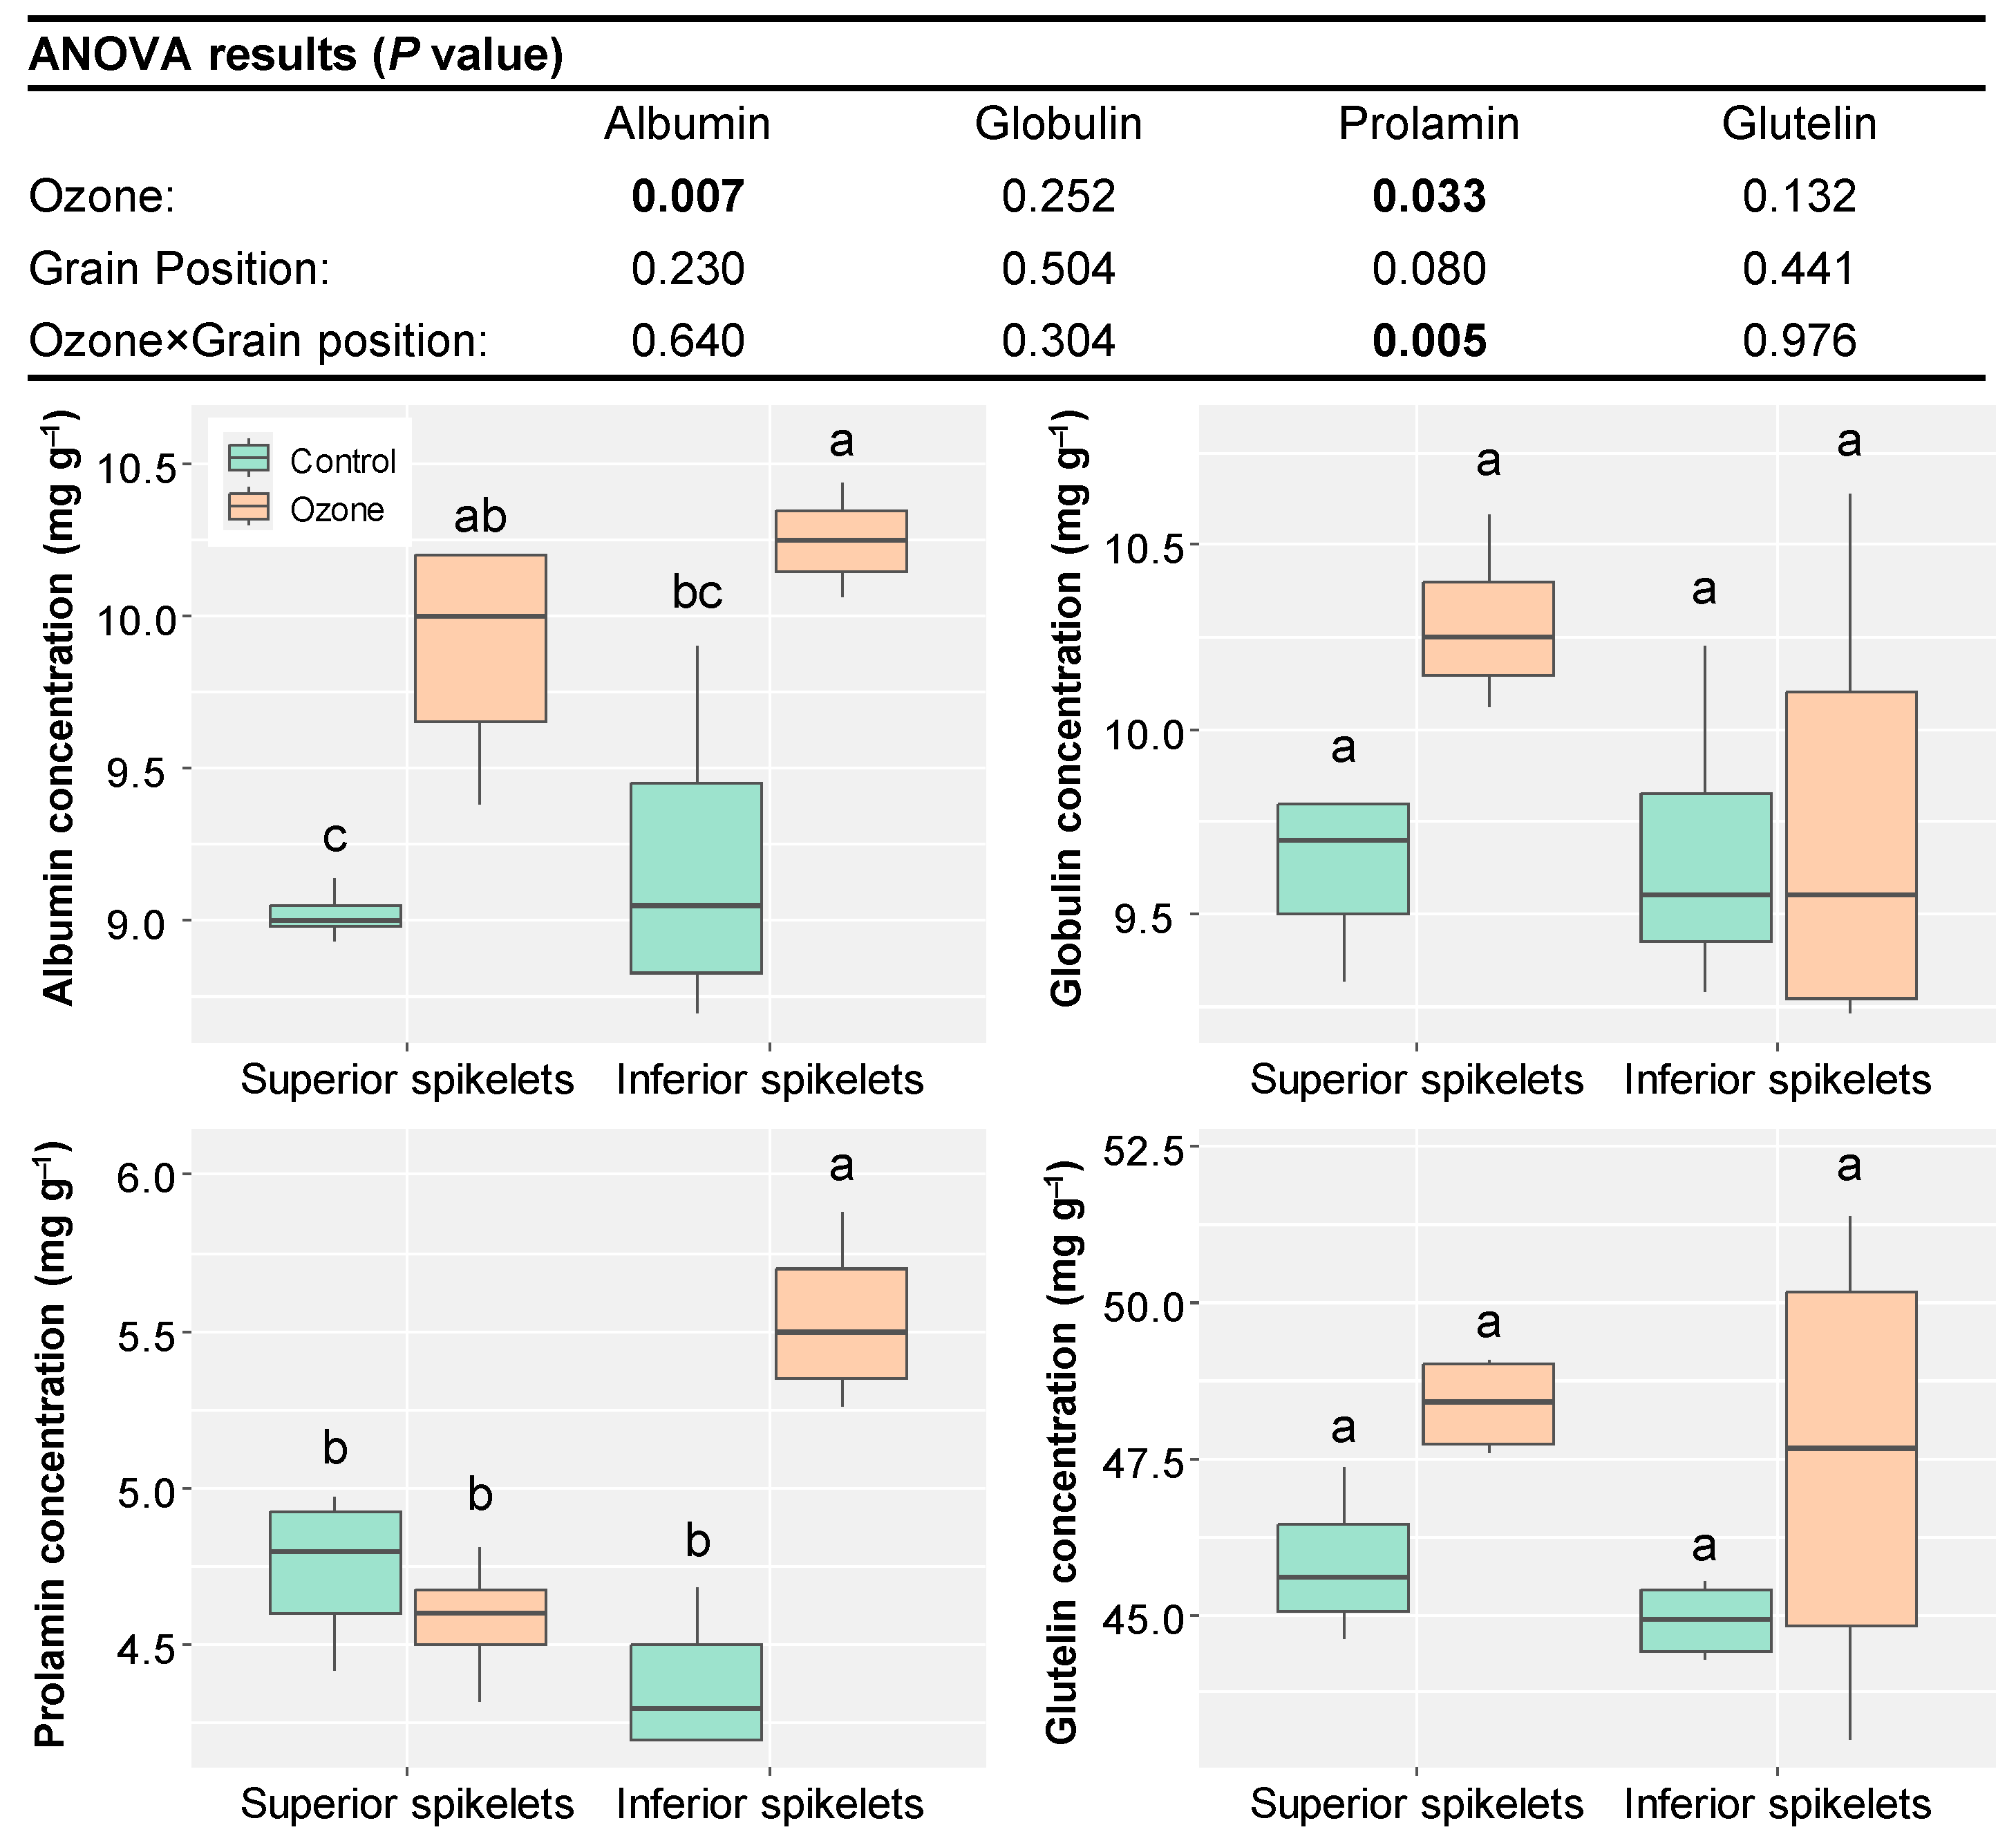
Under ozone stress, albumin concentrations increased in both SS and IS relative to their respective controls, with increases of 9.1% (p < 0.05) in SS and 11.1% (p < 0.05) in IS (Figure 4). An ozone by grain position interaction was detected for prolamin concentration, where ozone increased prolamin concentration in IS by 25.5% (p < 0.01) but did not increase it in SS. The other two protein fractions also showed a tendency to increase upon ozone exposure. The proportion of each protein fraction to total protein content was not affected by ozone treatment or grain position on the panicle, with proportions of albumin, globulin, prolamin, and glutelin at 13.5%, 13.9%, 6.8%, and 65.8%, respectively (Figure S1).
Of the nine nutrient elements (P, K, Ca, Mg, S, B, Cu, Mn, and Zn) measured in brown rice, only three were significantly affected by ozone stress: S, Cu, and Mn (Table 4). Ozone stress tended to increase the concentrations of S and Mn in both SS and IS compared to their respective controls, with increases of 10.7% (p < 0.01) in S concentration and 19.3% (p < 0.01) in Mn concentration for SS, and 5.2% (p = 0.094) in S concentration and 20.2% (p < 0.01) in Mn concentration for IS. Ozone stress increased Cu concentration in SS by 36.6% (p < 0.001) and in IS by 15.7% (p < 0.05) relative to their respective controls, resulting in a significant ozone by grain position interaction. SS had lower Mn concentration than IS, but no significant difference between SS and IS was found for the concentrations of other elements. The anti-nutrient component phytate was also measured, and the phytate concentration in brown rice was not affected by ozone treatment or grain position (Table 4).

4. Discussion

Ozone exposure during rice growth season decreased filled grain percentage and grain mass (Figure 2), which is in agreement with the findings in previous studies [33,38,39]. When rice plants were grown under continuous ozone stress, the photosynthesis of functional leaves declined with ozone exposure time, the activities of several enzymes involved in foliar carbohydrate and nitrogen metabolism were reduced, and foliar carbohydrate levels decreased [15,40]. With less assimilate supply for grain growth, incomplete grain filling and poor grain quality of ozone-exposed rice were observed in both chamber and FACE studies [9,15,38]. In this study, we further investigated the ozone effects on grain-filling capacity of spikelets located at different positions on a panicle. The greater reductions in filled grain percentage and grain mass in IS, in contrast to minimal changes observed in SS (Figure 2), indicate that IS is more susceptible to the ozone-induced impairment of grain-filling capacity. Since the ozone concentrations in the growth chambers were kept constant at 100 ppb during the whole rice season, the difference between SS and IS in response to ozone might be derived from the accumulative ozone effects on functional leaves combined with asynchronous initiation of grain filling of SS and IS.
The rapid grain mass accumulation for SS occurs soon after fertilization, whereas in the IS, the rapid grain mass accumulation begins at around 20 days after fertilization [25,31]. This distinct biphasic grain growth on rice panicles has been frequently observed and well characterized [21,25,41]. Grain filling in cereals is controlled by multiple factors, including direct biological processes (e.g., photosynthesis capacity, assimilates transportation, starch biosynthesis, and cell proliferation) and indirect environmental influences (e.g., abiotic stresses and nutrient application levels) [42]. Under normal conditions, the final grain mass of IS is usually lower than that of SS; however, this discrepancy is not attributed to an insufficient supply of assimilates to grains from functional leaves, but rather to the low activities of key enzymes involved in carbon metabolism in grains [23]. Under ozone stress, declined leaf photosynthesis capacity due to the leaf damage by ozone [29] might make the carbohydrate synthesis of functional leaves insufficient for grain filling of SS, and assimilates reserved in stems and sheaths would be used up to meet the needs of SS. When the time comes for the rapid growth of IS, the functional leaves may be already seriously damaged by the accumulative effects of ozone as shown by the lower chlorophyll content, lower leaf photosynthesis, and lower carbohydrate levels in functional top leaves [15], which will lead to even poorer grain filling of IS. In a recent report, substantially reduced nonstructural carbohydrates that were stored in the culms of an ozone-sensitive cultivar at the end of the grain-filling stage, may account for its greater reduction in grain mass compared to an ozone-tolerant cultivar under ozone stress [43]. This suggests a high probability of inadequate assimilate supply from stems during the late grain-filling stage when rice is grown under long-term ozone exposure, which would pose severe detriments to IS growth.
Similar to grain mass, ozone stress was associated with the decrease in grain size, especially grain thickness of IS (Table 2). A similar decrease in grain size due to ozone exposure was reported in a Japanese cv. Koshihikari (ssp. Japonica): in this case, grain width was not affected, but grain length and thickness were significantly reduced [12]. In a recent study reported by Autarmat et al. [44], an ozone exposure of 100–150 ppb significantly decreased both length and width of the seeds of two Thai fragrant rice cv. Pathumthani 1 and RD41 (ssp. Indica). In the current study, the most pronounced reduction in grain thickness was found in IS, which is consistent with the ozone effect on grain mass. The close association between grain size and grain mass in response to ozone stress is also confirmed by the positive correlations between grain mass and grain length (r = 0.82, p < 0.05), width (r = 0.94, p < 0.001), thickness (r = 0.85, p < 0.01) or volume (r = 0.97, p < 0.001) (Figure S2). The simultaneous reductions in grain mass and grain size by ozone led to no changes in the density of rough rice grains (Table 2), which indicates that ozone stress during rice growing season has adverse effects on both hull growth and grain filling.
A reduced proportion of perfect kernels was observed for rice grown under ozone exposure due to the increased production of immature and abnormal grains (Figure 3). The proportion of perfect kernels decreased more in IS (−44%) than in SS (−19%) under ozone exposure, which is in line with the changes in grain-filling capacity of SS and IS. A similar result was reported in another chamber study, that elevated ozone significantly increased the proportion of immature kernels of the Japanese cv. Koshihikari, and the further classification of immature kernels revealed an increased chalky grain percentage by ozone stress derived from more small and irregular granules and the enlarged air spaces between loosely packed starch granules [12]. A recent study on 19 rice cultivars found that the foliar application of ethylenediurea could reduce grain chalkiness of hybrid cultivars but not inbred Japonica or Indica cultivars under ambient ozone levels, indicating the genetic variability in the mechanisms of ozone impacts on grain-filling process [45]. Therefore, investigations on more rice cultivars are needed in the future to develop ozone-resistant rice.
Ozone exposure increased the protein concentration of rice kernels in both chamber [10,15,38] and field studies [9,46]. Despite various rice cultivars or ozone levels being applied across these experiments, it appears that the increased grain protein concentration of ozone-exposed plants represents a common phenomenon. In the current study, we further investigated the effects of ozone on protein fractions and found that albumin, the water-soluble protein fraction comprising metabolically active components such as enzymes [47], showed the significant increases in concentrations for both SS and IS (Figure 4). Although the amount of albumin present in rice is relatively small compared with the major protein fraction glutelin, it can substantially affect the pasting and textural characteristics of the rice flour [48]. In this study, the ozone-induced increase in grain albumin concentration is consistent with the responses of pasting properties of rice flour, e.g., the maximum, minimum, and final viscosity were all increased by ozone exposure (Table 3), which is further confirmed by the significantly positive correlations between albumin concentration and maximum viscosity (r = 0.71, p < 0.05), minimum viscosity (r = 0.80, p < 0.05) or final viscosity (r = 0.86, p < 0.01) (Figure S2).
Another protein fraction, prolamin, differentially responded to ozone stress in concentration between SS and IS. Only prolamin concentration in IS was increased by ozone, while that in SS was unaffected (Figure 4), which led to an increased proportion of the prolamin fraction in IS but not in SS (Figure S2). The position variation in ozone-induced changes in prolamin could be explained by the ‘concentration effect’ hypothesis, according to which the increase in grain protein concentration may result from reduced biomass production under stress [9,16], as the increase in prolamin concentration matches the decrease in grain mass of IS under ozone stress (Figure 2). In contrast, no significant changes were detected in globulin and glutelin concentrations for both SS and IS of ozone-exposed rice. The mechanisms underlying the differential responses of four protein fractions to ozone treatment require further investigation.
Amylose content of Japonica rice cv. NJ 9108 was decreased by ozone stress in this study (Table 3), as was also found in a hybrid Indica rice Shanyou 63 [9,10]. Low amylose content is associated with an increase of the viscosity of starch [49]. Indeed, ozone stress significantly increased maximum viscosity, minimum viscosity, final viscosity, and setback as shown by RVA profile (Table 3). These changes in starch viscosity properties suggest increased stickiness and firmness of starch for rice grown under ozone stress [50]. In the previous studies on hybrid rice Shanyou 63 with plants growing in open-air fields with ozone concentrations 50% over ambient throughout the cropping season, the degradation in cooking and eating quality was found based on starch property analysis [9], which was further confirmed by the sensory evaluation of cooked rice [51]. However, ozone treatment led to greater increases in maximum, minimum, and final viscosities in SS than in IS (Table 3), a trend that appears contradictory to the ozone effects on grain filling and visual quality parameters, which showed more pronounced changes in IS relative to SS (Figure 2 and Figure 3). Despite reduced amylose content typically enhances rice grain viscosity, ozone stress likely impairs photosynthetic carbon assimilation [40], reducing grain-filling capacity in IS (Figure 2), which may have altered endosperm starch microstructure, thereby partially offsetting the positive effect of reduced amylose content on starch viscosity in IS. In a report on Japonica rice cv. Koshihikari, ozone elevation increased the amylose content, as well as the maximum viscosity and breakdown of RVA profile [12]. In this case, the distribution analysis of amylopectin chain length revealed an ozone-induced decrease of long-side chains and alterations of short-side chains in rice kernels, which might contribute to the changes in starch pasting properties, outweighing the effects of amylose increase [12]. Further investigations on starch structure characteristics in SS and IS are needed in the future to analyze the ozone-induced changes in starch pasting characteristics and rice palatability.
When plants grow under adverse conditions, and encounter severely impaired assimilate synthesis during the grain-filling stage, SS remains unaffected, but the growth of IS would be substantially inhibited [20]. In the present study, filled grain percentage and grain mass were dramatically decreased in IS under ozone stress, but there was no change in SS. The differential ozone responses of SS and IS were clearly reflected in grain-filling capacity, verifying our hypothesis that IS exhibits significantly higher vulnerability to ozone stress compared to SS, possibly due to accumulative ozone damage on flag leaves and the shortage of assimilate supply for IS. Therefore, maintaining rice yield in ozone-polluted environments essentially hinges on enhancing the grain-filling capacity of IS. Further investigation is required to elucidate the relationship between grain development and plant assimilate dynamics (accumulation and translocation) during grain filling of rice under ozone stress. Although chemical compositions and pasting properties related to the nutritional value and cooking quality of rice were changed by ozone stress, the differential responses between SS and IS were rather small as shown by very few significant interactions between ozone and grain position. This indicates that despite less assimilate supply for grain filling of IS, the assimilate packaging process in IS could be similar to that in SS under ozone stress, but it requires validation through further quantification of total assimilate supply and grain-filling rates.
A key limitation of this study is the use of a single rice cultivar (NJ 9108, ssp. Japonica, known to exhibit relatively high ozone tolerance [33]), which restricts the generalizability of the findings. However, the results remain informative as we observed distinct grain position-dependent responses (SS vs. IS) even in this ozone-tolerant cultivar. Given the well-documented intraspecific variation in rice ozone sensitivity (particularly between indica and japonica subspecies) [29,33], future multi-cultivar studies are needed to validate the broader applicability of these findings.

5. Conclusions

This study demonstrates that ozone stress impairs grain-filling capacity in IS, while SS is relatively unaffected. The ozone-induced reductions in grain mass, size, and quality were generally more pronounced in IS, highlighting its higher vulnerability to ozone stress. These findings underscore that sustaining rice productivity under rising tropospheric ozone pollution requires targeted strategies to enhance IS resilience—particularly by safeguarding assimilate supply and starch biosynthesis in the late growth stages. The differential sensitivity of SS and IS provides a framework for breeding ozone-tolerant cultivars and optimizing crop management in polluted regions, where protecting grain-filling capacity of late-developing spikelets will be critical for yield stability.

Supplementary Materials

The following supporting information can be downloaded at: https://www.mdpi.com/article/10.3390/agronomy15081809/s1, Figure S1: Effects of ozone exposure during rice growth on the proportions of protein fractions—albumin, globulin, prolamin, and glutelin—relative to total protein in brown rice kernels of superior and inferior spikelets; Figure S2: Correlation matrix of grain quality traits in superior and inferior spikelets.

Author Contributions

Conceptualization, Y.W. (Yunxia Wang) and L.Y.; methodology, Y.W. (Yunxia Wang) and H.M.; validation, S.H.; formal analysis, L.J.; investigation, H.M.; data curation, H.M.; writing—original draft preparation, Y.W. (Yunxia Wang) and S.H.; writing—review and editing, Y.W. (Yunxia Wang) and L.Y.; visualization, S.H.; supervision, Y.W. (Yulong Wang) and J.H.; project administration, Y.W. (Yunxia Wang) and L.Y.; funding acquisition, L.Y. and S.H. All authors have read and agreed to the published version of the manuscript.

Funding

This research was funded by the National Natural Science Foundation of China (No. 32372216), the China Postdoctoral Science Foundation (No. 2023M742963), and the Priority Academic Program Development of Jiangsu Higher Education Institutions, China.

Data Availability Statement

The original contributions presented in this study are included in the article and Supplementary Material. Further inquiries can be directed to the corresponding authors.

Conflicts of Interest

The authors declare no conflicts of interest.

Abbreviations

The following abbreviations are used in this manuscript:
SSSuperior spikelets
ISInferior spikelets
RVARapid visco analyzer

References

  1. Gaudel, A.; Bourgeois, I.; Li, M.; Chang, K.-L.; Ziemke, J.; Sauvage, B.; Stauffer, R.M.; Thompson, A.M.; Kollonige, D.E.; Smith, N.; et al. Tropical tropospheric ozone distribution and trends from in situ and satellite data. Atmos. Chem. Phys. 2024, 24, 9975–10000. [Google Scholar] [CrossRef]
  2. Wang, H.; Lu, X.; Palmer, P.I.; Zhang, L.; Lu, K.; Li, K.; Nagashima, T.; Koo, J.-H.; Tanimoto, H.; Wang, H.; et al. Deciphering decadal urban ozone trends from historical records since 1980. Natl. Sci. Rev. 2024, 11, nwae369. [Google Scholar] [CrossRef]
  3. Feng, Z.; Kobayashi, K. Assessing the impacts of current and future concentrations of surface ozone on crop yield with meta-analysis. Atmos. Environ. 2009, 43, 1510–1519. [Google Scholar] [CrossRef]
  4. Ainsworth, E.A. Understanding and improving global crop response to ozone pollution. Plant J. 2017, 90, 886–897. [Google Scholar] [CrossRef] [PubMed]
  5. Mills, G.; Buse, A.; Gimeno, B.; Bermejo, V.; Holland, M.; Emberson, L.; Pleijel, H. A synthesis of AOT40-based response functions and critical levels of ozone for agricultural and horticultural crops. Atmos. Environ. 2007, 41, 2630–2643. [Google Scholar] [CrossRef]
  6. Feng, Z.; Xu, Y.; Kobayashi, K.; Dai, L.; Zhang, T.; Agathokleous, E.; Calatayud, V.; Paoletti, E.; Mukherjee, A.; Agrawal, M.; et al. Ozone pollution threatens the production of major staple crops in East Asia. Nat. Food 2022, 3, 47–56. [Google Scholar] [CrossRef]
  7. Li, S.; Leakey, A.D.B.; Moller, C.A.; Montes, C.M.; Sacks, E.J.; Lee, D.; Ainsworth, E.A. Similar photosynthetic but different yield responses of C3 and C4 crops to elevated O3. Proc. Natl. Acad. Sci. USA 2023, 120, e2313591120. [Google Scholar] [CrossRef]
  8. Ainsworth, E.A. Rice production in a changing climate: A meta-analysis of responses to elevated carbon dioxide and elevated ozone concentration. Glob. Change Biol. 2008, 14, 1642–1650. [Google Scholar] [CrossRef]
  9. Wang, Y.; Yang, L.; Han, Y.; Zhu, J.; Kobayashi, K.; Tang, H.; Wang, Y. The impact of elevated tropospheric ozone on grain quality of hybrid rice: A free-air gas concentration enrichment (FACE) experiment. Field Crop Res. 2012, 129, 81–89. [Google Scholar] [CrossRef]
  10. Wang, Y.; Song, Q.; Frei, M.; Shao, Z.; Yang, L. Effects of elevated ozone, carbon dioxide, and the combination of both on the grain quality of Chinese hybrid rice. Environ. Pollut. 2014, 189, 9–17. [Google Scholar] [CrossRef]
  11. Shang, B.; Deng, T.; Chen, H.; Xu, Y.; Feng, Z. Effects of elevated ozone on physiology, growth, yield and grain quality of rice (Oryza sativa L.): An ozone gradient experiment. Agric. Ecosyst. Environ. 2024, 363, 108858. [Google Scholar] [CrossRef]
  12. Sawada, H.; Tsukahara, K.; Kohno, Y.; Suzuki, K.; Nagasawa, N.; Tamaoki, M. Elevated ozone deteriorates grain quality of Japonica Rice cv. Koshihikari, even if it does not cause yield reduction. Rice 2016, 9, 7. [Google Scholar] [CrossRef]
  13. Lyman, N.B.; Jagadish, K.S.; Nalley, L.L.; Dixon, B.L.; Siebenmorgen, T. Neglecting rice milling yield and quality underestimates economic losses from high-temperature stress. PLoS ONE 2013, 8, e72157. [Google Scholar] [CrossRef] [PubMed]
  14. Zhou, H.; Xia, D.; He, Y. Rice grain quality—Traditional traits for high quality rice and health-plus substances. Mol. Breed. 2020, 40, 1. [Google Scholar] [CrossRef]
  15. Jing, L.; Dombinov, V.; Shen, S.; Wu, Y.; Yang, L.; Wang, Y.; Frei, M. Physiological and genotype-specific factors associated with grain quality changes in rice exposed to high ozone. Environ. Pollut. 2016, 210, 397–408. [Google Scholar] [CrossRef] [PubMed]
  16. Wang, Y.; Frei, M. Stressed food–The impact of abiotic environmental stresses on crop quality. Agric. Ecosyst. Environ. 2011, 141, 271–286. [Google Scholar] [CrossRef]
  17. Morgan, P.B.; Ainsworth, E.A.; Long, S.P. How does elevated ozone impact soybean? A meta-analysis of photosynthesis, growth and yield. Plant Cell Environ. 2003, 26, 1317–1328. [Google Scholar] [CrossRef]
  18. Feng, Z.; Kobayashi, K.; Ainsworth, E.A. Impact of elevated ozone concentration on growth, physiology, and yield of wheat (Triticum aestivum L.): A meta-analysis. Glob. Change Biol. 2008, 14, 2696–2708. [Google Scholar] [CrossRef]
  19. Mohapatra, P.; Patel, R.; Sahu, S. Time of flowering affects grain quality and spikelet partitioning within the rice panicle. Aust. J. Plant Physiol. 1993, 20, 231–241. [Google Scholar] [CrossRef]
  20. Ishimaru, T.; Matsuda, T.; Ohsugi, R.; Yamagishi, T. Morphological development of rice caryopses located at the different positions in a panicle from early to middle stage of grain filling. Funct. Plant Biol. 2003, 30, 1139–1149. [Google Scholar] [CrossRef]
  21. Yang, J.; Zhang, J.; Wang, Z.; Liu, K.; Wang, P. Post-anthesis development of inferior and superior spikelets in rice in relation to abscisic acid and ethylene. J. Exp. Bot. 2006, 57, 149–160. [Google Scholar] [CrossRef] [PubMed]
  22. Wang, F.; Chen, S.; Cheng, F.; Liu, Y.; Zhang, G. The differences in grain weight and quality within a rice (Oryza sativa L.) panicle as affected by panicle type and source-sink relation. J. Agron. Crop Sci. 2007, 193, 63–73. [Google Scholar] [CrossRef]
  23. Yang, J.; Zhang, J. Grain-filling problem in ‘super’ rice. J. Exp. Bot. 2010, 61, 1–5. [Google Scholar] [CrossRef] [PubMed]
  24. Zhang, H.; Li, H.; Yuan, L.; Wang, Z.; Yang, J.; Zhang, J. Post-anthesis alternate wetting and moderate soil drying enhances activities of key enzymes in sucrose-to-starch conversion in inferior spikelets of rice. J. Exp. Bot. 2012, 63, 215–227. [Google Scholar] [CrossRef]
  25. Liu, B.; Meng, S.; Yang, J.; Wu, J.; Peng, Y.; Zhang, J.; Ye, N. Carbohydrate flow during grain filling: Phytohormonal regulation and genetic control in rice (Oryza sativa). J. Integr. Plant Biol. 2025, 67, 1086–1104. [Google Scholar] [CrossRef]
  26. Mohammed, A.R.; Tarpley, L. Effects of high night temperature and spikelet position on yield-related parameters of rice (Oryza sativa L.) plants. Eur. J. Agron. 2010, 33, 117–123. [Google Scholar] [CrossRef]
  27. Zhao, Y.; Wu, W.; Liu, K.; Shi, W.; Peng, Y.; Zhang, C.; Shen, Y.; Liu, W.; Ding, Y.; Tang, S. Effects of structural properties of glutelin on the formation of grain quality under elevated temperatures and additional nitrogen during the grain filling period. Food Chem. 2025, 476, 143469. [Google Scholar] [CrossRef]
  28. Wang, X.; Fu, J.; Min, Z.; Zou, D.; Liu, H.; Wang, J.; Zheng, H.; Jia, Y.; Yang, L.; Xin, W.; et al. Response of rice with overlapping growth stages to water stress by assimilates accumulation and transport and starch synthesis of superior and inferior grains. Int. J. Mol. Sci. 2022, 23, 11157. [Google Scholar] [CrossRef]
  29. He, L.; Bao, M.; Li, Y.; Xu, Y.; Shao, Z.; Ma, Y.; Zhang, K.; Shang, B.; Feng, Z. Leaf biochemical and physiological responses to elevated atmospheric ozone concentration in eight modern rice cultivars. Ecosyst. Health Sust. 2024, 10, 0269. [Google Scholar] [CrossRef]
  30. Zhou, Y.Q.; Xu, Y.S.; He, L.X.; Zhang, Y.J.; Feng, Z.Z. Combined effects of elevated ozone concentration and warming on photosynthesis of rice leaves. Acta Ecol. Sin. 2025, 45, 877–888, (In Chinese with English Abstract). [Google Scholar] [CrossRef]
  31. Zhang, G.; Sakai, H.; Tokida, T.; Usui, Y.; Zhu, C.; Nakamura, H.; Yoshimoto, M.; Fukuoka, M.; Kobayashi, K.; Hasegawa, T. The effects of free-air CO2 enrichment (FACE) on carbon and nitrogen accumulation in grains of rice (Oryza sativa L.). J. Exp. Bot. 2013, 64, 3179–3188. [Google Scholar] [CrossRef] [PubMed]
  32. Wang, C.L.; Zhang, Y.D.; Zhu, Z.; Chen, T.; Zhao, Q.Y.; Zhong, W.G.; Yang, J.; Yao, S.; Zhou, L.H.; Zhao, L.; et al. Research progress on the breeding of japonica super rice varieties in Jiangsu Province, China. J. Integr. Agric. 2017, 16, 992–999. [Google Scholar] [CrossRef]
  33. Shao, Z.; Zhang, Y.; Mu, H.; Wang, Y.; Wang, Y.; Yang, L. Ozone-induced reduction in rice yield is closely related to the response of spikelet density under ozone stress. Sci. Total Environ. 2020, 712, 136560. [Google Scholar] [CrossRef] [PubMed]
  34. GB/T 17891-1999; High Quality Paddy. The State Bureau of Quality and Technical Supervision; National Standard of People’s Republic of China: Beijing, China, 1999.
  35. Ju, Z.Y.; Hettiarachchy, N.S.; Rath, N. Extraction, denaturation and hydrophobic properties of rice flour proteins. J. Food Sci. 2001, 66, 229–232. [Google Scholar] [CrossRef]
  36. Vaintraub, I.A.; Lapteva, N.A. Colorimetric determination of phytate in unpurified extracts of seeds and the products of their processing. Anal. Biochem. 1988, 175, 227–230. [Google Scholar] [CrossRef]
  37. Frei, M.; Kohno, Y.; Wissuwa, M.; Makkar, H.P.S.; Becker, K. Negative effects of tropospheric ozone on the feed value of rice straw are mitigated by an ozone tolerance QTL. Glob. Change Biol. 2011, 17, 2319–2329. [Google Scholar] [CrossRef]
  38. Frei, M.; Kohno, Y.; Tietze, S.; Jekle, M.; Hussein, M.A.; Becker, T.; Becker, K. The response of rice grain quality to ozone exposure during growth depends on ozone level and genotype. Environ. Pollut. 2012, 163, 199–206. [Google Scholar] [CrossRef]
  39. Kobayashi, K.; Okada, M.; Nouchi, I. Effects of ozone on dry matter partitioning and yield of Japanese cultivars of rice (Oryza sativa L.). Agric. Ecosyst. Environ. 1995, 53, 109–122. [Google Scholar] [CrossRef]
  40. Huang, Y.Z.; Sui, L.H.; Wang, W.; Geng, C.M.; Yin, B.H. Visible injury and nitrogen metabolism of rice leaves under ozone stress, and effect on sugar and protein contents in grain. Atmos. Environ. 2012, 62, 433–440. [Google Scholar] [CrossRef]
  41. Zhang, H.; Tan, G.; Yang, L.; Yang, J.; Zhang, J.; Zhao, B. Hormones in the grains and roots in relation to post-anthesis development of inferior and superior spikelets in japonica/indica hybrid rice. Plant Physiol. Biochem. 2009, 47, 195–204. [Google Scholar] [CrossRef]
  42. Ma, B.; Zhang, L.; He, Z. Understanding the regulation of cereal grain filling: The way forward. J. Integr. Plant Biol. 2023, 65, 526–547. [Google Scholar] [CrossRef] [PubMed]
  43. Hu, S.; Yang, Y.; Tian, C.; He, F.; Wang, Y.; Wang, Y.; Yang, L. Physicochemical characteristics of lodging susceptibility of rice cultivars in response to ozone exposure. Agric. Ecosyst. Environ. 2023, 344, 108313. [Google Scholar] [CrossRef]
  44. Autarmat, S.; Treesubsuntorn, C.; Thiravetyan, P. Possible mechanism of inoculating Oryza sativa L. with endophytic bacteria under ambient air and ozone stress. Environ. Exp. Bot. 2022, 194, 104761. [Google Scholar] [CrossRef]
  45. Zhang, G.; Risalat, H.; Kobayashi, K.; Cao, R.; Hu, Q.; Pan, X.; Hu, Y.; Shang, B.; Wu, H.; Zhang, Z.; et al. Ethylenediurea reduces grain chalkiness in hybrid rice cultivars under ambient levels of surface ozone in China. Front. Plant Sci. 2022, 13, 983576. [Google Scholar] [CrossRef] [PubMed]
  46. Zhang, G.; Pan, X.; Hu, Y.; Cao, R.; Hu, Q.; Fu, R.; Hamdulla, R.; Shang, B. Both short-term and long-term ozone pollution alters the chemical composition of rice grain. Bull. Environ. Contam. Toxicol. 2024, 113, 15. [Google Scholar] [CrossRef]
  47. Goesaert, H.; Brijs, K.; Veraverbeke, W.; Courtin, C.; Gebruers, K.; Delcour, J. Wheat flour constituents: How they impact bread quality, and how to impact their functionality. Trends Food Sci. Technol. 2005, 16, 12–30. [Google Scholar] [CrossRef]
  48. Baxter, G.; Zhao, J.; Blanchard, C. Albumin significantly affects pasting and textural characteristics of rice flour. Cereal Chem. 2010, 87, 250–255. [Google Scholar] [CrossRef]
  49. Larkin, P.D.; Mcclung, A.M.; Ayres, N.M.; Park, W.D. The effect of the Waxy locus (Granule Bound Starch Synthase) on pasting curve characteristics in specialty rices (Oryza sativa L.). Euphytica 2003, 131, 243–253. [Google Scholar] [CrossRef]
  50. Allahgholipour, M.; Ali, A.J.; Alinia, F.; Nagamine, T.; Kojima, Y. Relationship between rice grain amylose and pasting properties for breeding better quality rice varieties. Plant Breed. 2006, 125, 357–362. [Google Scholar] [CrossRef]
  51. Song, Q.L.; Qi, Y.T.; Zhao, Y.P.; Wang, Y.X.; Li, P.L.; Zhu, J.G.; Wang, Y.L.; Yang, L.X. Impact of free air ozone concentration enrichment on cooked rice (Wuyunjing 21) texture and palatability. Chin. J. Eco-Agric. 2013, 21, 566–571, (In Chinese with English Abstract). [Google Scholar] [CrossRef]

Figure 1. Structure diagram of a rice panicle of NJ 9108. The spikelets located on the upper primary branches are referred to as superior spikelets, while the spikelets located on the lower secondary branches are referred to as inferior spikelets; such spikelets are marked in grey and black, respectively.
Agronomy 15 01809 g001
Figure 2. Effects of ozone exposure during rice growth on filled grain percentage and grain mass of superior and inferior spikelets. The box boundaries indicate the 25th and 75th percentiles, the black line in the box marks the median, and whiskers below and above the box indicate the 10th and 90th percentiles, respectively (n  =  4). Different letters indicate significant differences at p < 0.05 by Tukey’s post-hoc comparison. The p values in bold show significant treatment effects at p < 0.05.
Agronomy 15 01809 g002
Figure 3. Effects of ozone exposure during rice growth on the proportions of perfect, immature, and abnormal kernels in brown rice of superior and inferior spikelets. Bars represent average values with standard errors (n = 4). For each kernel type, different letters indicate significant differences at p < 0.05 by Tukey’s post-hoc comparison. The p values in bold show significant treatment effects at p < 0.05.
Agronomy 15 01809 g003
Figure 4. Effects of ozone exposure during rice growth on the concentrations of protein fractions including albumin, globulin, prolamin, and glutelin in brown rice kernels of superior and inferior spikelets. The box boundaries indicate the 25th and 75th percentiles, the black line in the box marks the median, and whiskers below and above the box indicate the 10th and 90th percentiles, respectively (n = 4). For each protein fraction, different letters indicate significant differences at p < 0.05 by Tukey’s post-hoc comparison. The p values in bold show significant treatment effects at p < 0.05.
Agronomy 15 01809 g004
Table 1. Environmental conditions and ozone concentrations in the ozone fumigation chambers compared to the control chambers.
TreatmentTemperature (°C)Relative Humidity (%)Ozone Concentration (nL L−1)
8 h24 h8 h24 h8 h24 h
Control30.0 ± 0.526.0 ± 0.872.7 ± 0.669.8 ± 2.018.1 ± 1.411.3 ± 1.0
Ozone29.9 ± 0.526.0 ± 0.872.9 ± 0.470.2 ± 1.9100.3 ± 0.439.3 ± 1.2
Measurements of environmental conditions and ozone concentration were recorded at 1 min intervals throughout the experiment. Average values (±standard errors) of two replicate chambers per treatment are shown. Eight-hour averages were calculated for the daytime period (09:00–17:00), while 24-h averages were computed for the full diurnal cycle.
Table 2. Effects of ozone exposure during rice growth on the morphology of rough grains of superior and inferior spikelets.
Grain PositionTreatmentLength
(mm)
Width
(mm)
Thickness
(mm)
Volume
(mm3)
Density
(mg mm−3)
Superior spikeletsControl7.07 ± 0.02 a3.58 ± 0.03 a2.43 ± 0.01 a32.2 ± 0.3 a0.87 ± 0.02 ab
Ozone7.06 ± 0.02 a3.51 ± 0.02 a2.33 ± 0.02 b30.3 ± 0.4 b0.90 ± 0.01 a
% change−0.1−2.0−4.0−5.93.7
Inferior spikeletsControl6.81 ± 0.04 b3.35 ± 0.03 b2.36 ± 0.02 b28.3 ± 0.5 c0.86 ± 0.01 ab
Ozone6.84 ± 0.06 b3.29 ± 0.05 b2.18 ± 0.01 c25.8 ± 0.6 d0.85 ± 0.02 b
% change0.5−1.8−7.6−8.8−0.9
ANOVA results (p value)
Ozone0.7670.096<0.0010.0040.633
Grain position0.0010.0010.001<0.0010.065
Ozone × grain position0.6290.8660.0460.5670.199
Data show average values ± standard errors (n = 4). The p values in bold show significant treatment effects at p < 0.05. Different letters indicate significant differences at p < 0.05 identified using Tukey’s post-hoc comparison.
Table 3. Effects of ozone exposure during rice growth on the amylose content and pasting properties of brown rice kernels of superior and inferior spikelets.
Grain
Position
TreatmentAmylose Content (%)RVA Profile
Maximum Viscosity (cP)Minimum Viscosity (cP)Breakdown (cP)Final
Viscosity (cP)
Setback (cP)Peak Time (min)Gelatinization Temperature (°C)
Superior spikeletsControl9.61 ± 0.07 a2060 ± 17 c1139 ± 16 d921 ± 11 a1767 ± 25 c−293 ± 22 b5.78 ± 0.02 b73.9 ± 0.2 a
Ozone8.98 ± 0.21 a2261 ± 15 a1420 ± 29 a841 ± 38 a2145 ± 26 a−117 ± 35 a6.13 ± 0.06 a73.2 ± 0.4 a
% change−6.69.824.7−8.721.460.26.1−0.8
Inferior spikeletsControl9.31 ± 0.32 a2092 ± 18 bc1193 ± 18 c899 ± 31 a1858 ± 17 b−233 ± 22 b5.88 ± 0.05 b74.3 ± 0.6 a
Ozone8.36 ± 0.10 b2184 ± 52 ab1346 ± 32 b837 ± 32 a2119 ± 29 a−65 ± 38 a6.13 ± 0.04 a73.2 ± 0.2 a
% change−10.24.412.9−6.814.072.24.2−1.4
ANOVA results (p value)
Ozone0.0400.0030.0030.068<0.0010.0020.0030.207
Grain position0.0370.4700.4650.6720.1390.1110.2540.570
Ozone × grain position0.3930.1160.0020.7680.0220.9040.2540.570
Data show average values ± standard errors (n = 4). The p values in bold show significant treatment effects at p < 0.05. Different letters indicate significant differences at p < 0.05 identified using Tukey’s post-hoc comparison.
Table 4. Effects of ozone exposure during rice growth on the concentrations of mineral elements and phytate in brown rice kernels of superior and inferior spikelets.
ParameterGrain PositionControlOzone% ChangeANOVA Results (p Value)
OzoneGrain
Position
Ozone × Grain Position
P (mg g−1)Superior3.43 ± 0.05 a3.41 ± 0.05 a−0.80.2250.2220.323
Inferior3.58 ± 0.08 a3.42 ± 0.05 a−4.3
K (mg g−1)Superior2.88 ± 0.04 ab2.69 ± 0.05 b−6.50.0600.2770.761
Inferior2.93 ± 0.08 a2.78 ± 0.07 ab−5.1
Ca (mg g−1)Superior0.18 ± 0.02 a0.19 ± 0.02 a6.40.9980.8740.496
Inferior0.19 ± 0.01 a0.18 ± 0.01 a−6.0
Mg (mg g−1)Superior1.41 ± 0.02 a1.40 ± 0.02 a−0.80.2260.4380.399
Inferior1.46 ± 0.04 a1.40 ± 0.01 a−4.0
S (mg g−1)Superior0.96 ± 0.02 c1.06 ± 0.02 a10.70.0100.9790.149
Inferior0.98 ± 0.02 bc1.03 ± 0.01 ab5.2
B (μg g−1)Superior0.85 ± 0.12 a0.83 ± 0.16 a−2.10.4900.4050.165
Inferior0.63 ± 0.17 a0.89 ± 0.04 a42.1
Cu (μg g−1)Superior4.90 ± 0.12 c6.69 ± 0.12 a36.6<0.0010.6040.019
Inferior5.45 ± 0.25 b6.30 ± 0.07 a15.7
Mn (μg g−1)Superior20.3 ± 0.2 c24.3 ± 0.8 b19.30.0020.0040.612
Inferior23.0 ± 1.0 b27.6 ± 0.7 a20.2
Zn (μg g−1)Superior29.9 ± 1.5 a32.5 ± 4.8 a8.60.7270.2960.080
Inferior31.8 ± 1.5 a26.0 ± 1.7 a−18.4
Phytate
(mg g−1)
Superior12.4 ± 0.9 a13.6 ± 0.5 a9.20.2850.3320.597
Inferior13.1 ± 0.3 a13.8 ± 0.4 a5.0
Data show average values ± standard errors (n = 4). The p values in bold show significant treatment effects at p < 0.05. Different letters indicate significant differences at p < 0.05 identified using Tukey’s post-hoc comparison.
Disclaimer/Publisher’s Note: The statements, opinions and data contained in all publications are solely those of the individual author(s) and contributor(s) and not of MDPI and/or the editor(s). MDPI and/or the editor(s) disclaim responsibility for any injury to people or property resulting from any ideas, methods, instructions or products referred to in the content.