Article

Dual Mechanisms of Nitrate in Alleviating Ammonium Toxicity: Enhanced Photosynthesis and Optimized Ammonium Utilization in Orychophragmus violaceus

1
School of Karst Science, Guizhou Normal University/State Engineering Technology Institute for Karst Desertification Control, Guiyang 550025, China
2
State Key Laboratory of Environmental Geochemistry, Institute of Geochemistry, Chinese Academy of Sciences, Guiyang 550081, China
3
Department of Agricultural Engineering, Guizhou Vocational College of Agriculture, Qingzhen 551400, China
4
Institute of Eco-Environment and Industrial Technology, Shanxi Agricultural University, Taiyuan 030031, China
5
School of Biological Sciences, University of Western Australia, Perth, WA 6009, Australia
6
Department of Land, Air and Water Resources, University of California at Davis, Davis, CA 95616, USA
*
Authors to whom correspondence should be addressed.
Agronomy 2025, 15(8), 1789; https://doi.org/10.3390/agronomy15081789
Submission received: 7 July 2025 / Revised: 21 July 2025 / Accepted: 23 July 2025 / Published: 25 July 2025

Abstract

Ammonium (NH4+) toxicity impairs plant growth, but nitrate (NO3) can mitigate this effect through unresolved mechanisms. Using leaf δ13C values (photosynthetic capacity) and a bidirectional 15N tracer (NH4+ assimilation efficiency and source utilization), this study investigated these mechanisms in 35-day-old Orychophragmus violaceus plantlets grown in modified Murashige and Skoog media under varying NH4+:NO3 ratios. 15N isotope fractionation during NH4+ (same fixed 20 mM NH4Cl) assimilation decreased with increasing NO3 supply (10, 20, and 40 mM NaNO3). Under 20 mM NH4+15N = −2.64‰) at two 15NO3-labels (δ15N-NO3 = 8.08‰, low 15N, L) and (δ15N-NO3 = 22.67‰, high 15N, H), increasing NO3 concentrations enhanced NO3 assimilation, alleviating acidic stress from NH4+ and improving photosynthesis. Higher NO3 levels also increased NH4+ utilization efficiency, reducing futile NH4+ cycling and decreasing associated 15N fractionation during assimilation. Our results demonstrate that NO3 alleviates NH4+ toxicity primarily by enhancing photosynthetic performance and optimizing NH4+ utilization efficiency.

1. Introduction

The major inorganic nitrogen (N) sources utilized by plants are nitrate (NO3) and ammonium (NH4+). Compared to NO3, NH4+ is often considered the preferred N source due to its lower energy requirement for assimilation [1,2]. However, when plants are exposed to elevated concentrations of NH4+ in the environment, particularly from sources such as untreated wastewater effluents [3], or when plants are exclusively supplied with NH4+, they commonly exhibit symptoms including leaf chlorosis and growth suppression, a phenomenon known as NH4+ toxicity [4,5,6,7]. Interestingly, numerous studies have demonstrated that even a small amount of NO3 can effectively alleviate NH4+ toxicity, a process termed NO3-mediated mitigation of NH4+ toxicity [4,5,8,9]. Nevertheless, inadequate NO3 supply results in persistent NH4+ toxicity symptoms [10], suggesting that the mitigation effect depends critically on NO3 concentration.
Significant progress has been made in understanding the mechanisms underlying NH4+ toxicity. Proposed contributors include futile NH4+ cycling [11,12], rhizosphere acidification [13,14], inhibition of cation uptake [5,15], damage to the photosynthetic system [16,17], and reactive oxygen species (ROS) accumulation [8,18]. Given these established mechanisms, the mitigation of NH4+ toxicity by NO3 supplementation likely involves counteracting one or more of these detrimental processes.
The N sources used in the Murashige and Skoog (MS) medium [19] comprise NO3 and NH4+ with a ratio of 2:1 (NO3:NH4+) and a total N concentration of 60 mM. Although NO3 is generally not toxic even at high concentrations [20,21], the relatively high NO3 in the MS medium may lead to inefficient N utilization. A previous study indicates that plantlets preferentially assimilate NH4+ as their primary N source, even when its concentration is only half that of NO3 [22]. Therefore, while maintaining the NH4+ concentration at 20 mM, optimizing NO3 levels could enhance N use efficiency and simultaneously provide insights into the mechanism of NO3-mediated mitigation of NH4+ toxicity.
Sucrose (typically at 3% w/v) is widely used in the MS medium as a carbon (C) and energy source for plantlets [23,24]. While sucrose supports heterotrophic growth, CO2 enables autotrophic growth [24]. Consequently, the leaf δ13C values of plantlets reflects the combined contribution of C from sucrose utilization and CO2 assimilation. Carbon isotope discrimination differs significantly between these two processes: CO2 assimilation exhibits ~20‰ discrimination [25], whereas the sucrose utilization shows a much smaller ~2.54‰ discrimination [10]. By measuring the δ13C values of both the sucrose source and atmospheric CO2, the proportion of C assimilated from CO2 can be estimated using the leaf δ13C values. Therefore, leaf δ13C serves as an indirect indicator of photosynthetic capacity [24]. Given this relationship, comparing the leaf δ13C values under varying NH4+ to NO3 ratios provides a means to evaluate photosynthetic capacity. This approach offers an insight into how NH4+ toxicity affects plantlet photosynthesis.
Under high NH4+ conditions, plants mitigate NH4+ toxicity either by exporting excess NH4+ or enhancing its assimilation [26,27]. Both processes are energetically demanding, increasing carbohydrate catabolism and decreasing overall plant carbon content. Crucially, NH4+ assimilation through glutamine synthetase (GS) and NO3 reductase (NR) exhibits distinctive N isotope discrimination (Δ15N) [28,29]: GS exhibits Δ15N ≈ 16.8‰ [30], while NR shows stronger discrimination at 25.1‰ [31]. Effluxed, unassimilated NH4+ becomes enriched in 15N [31], meaning extensive futile NH4+ cycling produces 15N-depleted assimilates. Thus, the Δ15N of NH4+-derived assimilates may indicate futile cycling extent. However, quantifying Δ15N from NH4+ assimilation under mixed N sources remains challenging.
In this study, root formation in plantlets was suppressed by cytokinin and auxin levels in the culture medium, restricting NO3 and NH4+ assimilation primarily to leaves. Consequently, the leaf δ15N values reflect the integrated 15N signatures of both NO3 and NH4+ sources. Using clonal plantlets grown uniformly minimized individual variability. To disentangle NO3 and NH4+ assimilation effects, we employed a bidirectional stable N isotope tracer technique [10,22]. Two treatments were applied: L (NO315N = 8.08‰) and H (NO315N = 22.67‰), differing solely in NO3 isotopic composition. This approach enables quantification of (1) the Δ15N associated with NH4+ assimilation and (2) the relative contributions of NO3 and NH4+ to N uptake.
In this study, we employed bidirectional 15N labeling and gas exchange-based carbon isotope measurements to examine Orychophragmus violaceus (Brassicaceae) plantlets grown under different inorganic N regimes. Orychophragmus violaceus is a plant adapted to karst environments, exhibiting a robust capacity for nitrate assimilation [22]. The NH4+ concentration was maintained at 20 mM across all treatments. The objectives were three-fold: (1) to quantify the Δ15N values associated with NH4+ assimilation and to determine the relative contributions of NO3 and NH4+ to total N uptake under varying NO3:NH4+ ratios; (2) to assess the photosynthetic performance of plantlets exposed to different inorganic N source ratios; and (3) to elucidate the mechanisms underlying NO3-mediated mitigation of NH4+ toxicity. The expected results will help resolve conflicting reports in the literature regarding NO3’s role in NH4+ detoxification.

2. Materials and Methods

2.1. Plant Materials and Experimental Design

The experiment was conducted in November 2016. All reagents were analytical grade. Sodium nitrate (δ15N-NO3 = 8.08‰), potassium chloride, magnesium sulfate heptahydrate, potassium phosphate monobasic, calcium chloride dihydrate, and sucrose were provided by Jinshan Chemical Reagent Co., Ltd. (Chengdu, China). Sodium nitrate (δ15N-NO3 = 22.67‰) was provided by Kemiou Chemical Reagent Co., Ltd. (Tianjin, China). Ammonium chloride (δ15N = −2.64‰) was provided by Dengke Chemical Reagent Co., Ltd. (Tianjin, China). Manganese sulfate monohydrate, zinc sulphate heptahydrate, boric acid, potassium iodide, sodium molybdate dihydrate, copper sulfate pentahydrate, cobalt chloride hexahydrate, ferrous sulfate heptahydrate, and ethylenediaminetetraacetic acid disodium salt dihydrate were provided by Aladdin Biochemical Technology Co., Ltd. (Shanghai, China). Inositol, nicotinic acid, vitamin B1, vitamin B6, glycine, agar, α-naphthylacetic acid, and 6-benzylaminopurine were provided by Solarbio Technology Co., Ltd. (Beijing, China). The seeds of O. violaceus were collected from the garden of the Institute of Geochemistry, Chinese Academy of Sciences (Nanming District, Guiyang City, Guizhou Province, China). Individual shoots of O. violaceus plantlets (mean fresh weight = 0.13 g) were cultured as explants in a modified Murashige and Skoog medium [19]. This medium contained 20 mM NH4Cl (δ15N = −2.64‰), three NO3 concentrations (10, 20, and 40 mM NaNO3), growth regulators as 0.2 mg·L−1 α-naphthylacetic acid and 2.0 mg·L−1 6-benzylaminopurine, 100 mg·L−1 inositol, 0.5 mg·L−1 nicotinic acid, 0.1 mg·L−1 vitamin B1, 0.5 mg·L−1 vitamin B6, 2 mg·L−1 glycine, 16.9 mg·L−1 MnSO4·1H2O, 8.6 mg·L−1 ZnSO4·7H2O, 6.2 mg·L−1 H3BO3, 0.83 mg·L−1 KI, 0.25 mg·L−1 Na2MoO4·2H2O, 0.025 mg·L−1 CuSO4·5H2O, 0.025 mg·L−1 CoCl2·6H2O, 27.8 mg·L−1 FeSO4·7H2O, 37.3 mg·L−1 C10H14N2O8Na2·2H2O, 1.4 g·L−1 KCl, 0.37 g·L−1 MgSO4·7H2O, 0.17 g·L−1 KH2PO4, 0.44 g·L−1 CaCl2·2H2O, 30 g·L−1 sucrose, and 7.5 g·L−1 agar. We designed three NO3:NH4+ ratio treatments, and each ratio was further divided into two 15N-labeling groups based on NO3 source: low (L) (δ15N-NO3 = 8.08‰) and high (H) (δ15N-NO3 = 22.67‰). The medium pH was adjusted to 5.8 before dispensing 50 mL aliquots into Erlenmeyer flasks. The Erlenmeyer flask was sealed with a piece of vented sealing film (dimensions: 12 cm × 12 cm, vented membrane diameter: 3 cm, pore size: 0.2–0.3 μm), thereby enabling gas exchange with the ambient atmosphere. The Erlenmeyer flasks were autoclave-sterilized at 121 °C for 20 min. Plantlets were cultured under controlled conditions at 50 μmol m−2 s−1 photosynthetic photon flux density (PPFD) and 25 ± 2 °C and a 12 h photoperiod. Root formation was suppressed by the cytokinin/auxin balance, indicating that N assimilation occurred primarily within the shoot tissues.

2.2. Harvest and Biomass Measurements

Following a five-week growth period, O. violaceus plantlets were harvested. Each plantlet was carefully removed from its Erlenmeyer flask. Fresh weight (FW) was recorded immediately, and then dried at 60 °C to constant weight to determine dry weight (DW). Biomass increase was calculated as the difference between the final plantlet FW and the initial shoot FW (0.13 g). Dried leaf samples were finely ground using an agate mortar for subsequent analyses.

2.3. Chlorophyll Concentration Determination

Fresh leaf samples (0.1 g each) were flash-frozen in liquid nitrogen and homogenized using a mortar and pestle. The ground tissue was extracted in 10 mL of 95% ethanol for 24 h at 4 °C in darkness. After centrifugation (4000× g, 10 min, 4 °C), the supernatant absorbance was measured at 665 and 649 nm using spectrophotometer measurements. The chlorophyll (Chl a and Chl b) concentrations were calculated according to Alsaadawi et al. [32] using the following equations:
Chl   a   ( mg / g ) = ( 13.70 × A 665 5.76 × A 649 ) × V / 1000 / W
Chl   b   ( mg / g ) = ( 25.80 × A 649 7.60 × A 665 ) × V / 1000 / W
where A665 and A649 represent the absorbance at 665 and 649 nm, respectively. V is the volume of sample (0.01 L). W is the weight of fresh leaves (0.1 g).

2.4. Analysis of Leaf Nitrogen and Carbon Content

The analysis of leaf N and C content was performed using an elemental analyzer (vario MACRO cube, Langenselbold, Germany).

2.5. 13C and 15N Analysis

The leaf 13C and 15N signatures were determined using an isotope ratio mass spectrometer (MAT253, Thermo Fisher Scientific, Langenselbold, Germany) coupled with an elemental analyzer. 13C/12C or 15N/14N values were calculated as follows relative to their international references:
δ [ C 13 ,   N 15 ] samples = ( R sample / R standard 1 ) × 1000
where Rsample is the 13C/12C or 15N/14N ratio, and Rstandard is the international standard as VPDB for C (0.1‰) and atmospheric N2 for N (0.2‰) [33].

2.6. Quantifying Δ15N Values of NH4+ Assimilation and N Source Partitioning

For plantlets simultaneously assimilating both nitrate and ammonium, leaf δ15N values represents an integration of NO3- and NH4+-derived N. A two end-member isotope mixing model [10,22] was employed to quantify their relative contributions:
δ T = f A δ A + f B δ B = f A δ A + 1 f A δ B
where δT represents the experimentally measured leaf δ15N of O. violaceus plantlets grown with mixed N sources; δA and δB denote the δ15N values of assimilates that arise from the NO3 and NH4+ assimilation. The partitioning of NO3 is denoted fA, and that of NH4+ is denoted fB. Since these are complementary, fB = 1 − fA.
While NH4+ can induce toxicity when supplied as the sole N source, NO3 generally does not inhibit growth. To investigate this contrast, we applied two experimental treatments utilizing light (L) and heavy (H) stable N isotope-labeled NO3. This approach enabled the derivation of fA and fB, representing the fractional contributions of NH4+- and NO3-derived N, respectively, to plant assimilation. The resulting calculations are as follows:
δ T H = f A H δ A H + f B δ B = f A H δ A H + 1 f A H δ B
δ T L = f A L δ A L + f B δ B = f A L δ AL + 1 f A L δ B
In this experiment, O. violaceus plantlets for both the light (L) and heavy (H) 15N isotope treatments were cultivated under uniform conditions with identical growth media. The sole experimental difference was the δ15N value of the supplied NO3 (denoted δL,NO3 and δH,NO3 for L and H treatments, respectively). Given that stable N isotopes are physiologically inert and do not influence plant metabolism, growth, or other biological parameters, the principle of isotopic equivalence was applied. This established that the fractional contribution of NO3-derived N to assimilation (fA) remains constant across treatments (fA = fA,H = fA,L). Consequently, the relationship is fA = fAH = fAL, where 1 − fAH = 1 − fAL simplifies to the final equation:
f A = δ T H δ T L / δ A H δ A L
In this study, δTH denotes the leaf δ15N of O. violaceus plantlets grown with mixed N sources (NO3 and NH4+), where the NO3 had a δ15N of 22.67‰ (high δ15N, H treatment). Conversely, δTL represents leaf δ15N value plantlets grown under identically mixed N sources, but with NO3 at lower δ15N = 8.08‰ (low δ15N, L treatment). The standard error (SE) of the fractional contribution parameter fA was calculated using error propagation [34].
After determining fA, δB15NB) can be calculated by Equation (5) or Equation (6) as follows:
δ B = δ A H δ T L δ A L δ T H / δ A H + δ T L δ A L δ T H
The error propagation formula was also used to obtain the standard error (SE) of δB [34].
The N isotope discrimination of assimilates originating from leaf NH4+ assimilation (Δ15NB) relative to the source was calculated as follows [35]:
Δ 15 N B ( ) = δ 15 N ammonium δ 15 N B
where δ15Nammonium was −2.64‰. The error propagation formula was further used to obtain the standard error (SE) of Δ15NB [34].
In this study, both δTH and δTL were directly measured. However, determining the δAL and δAH parameters reflecting N isotope discrimination during NO3 assimilation and unassimilated NO3 translocation between shoots and growth medium, presented significant challenges under mixed N sources. Both δAL and δAH exhibited dynamically temporal changes throughout the experiment. Critically, reliable quantification of δAL and δAH was only achievable when plantlets were grown with NO3 as the sole N source.
While δAL and δAH in NO3-fed plantlets could be theoretically influenced by unassimilated NO3, prior studies indicate that this effect is negligible under the experimental conditions. For instance, prior studies indicate this effect is negligible under our experimental conditions. Studies in tomato and tobacco demonstrated that leaf NO3 storage pools are replenished during darkness and depleted in daylight, resulting in minimal leaf NO3 levels by afternoon [36,37]. Given that harvests occurred in the afternoon after five weeks of culture, unassimilated NO3 constituted a trivial fraction relative to assimilated NO3. Furthermore, leaf δ15N values remained consistent across 10 to 40 mM NO3 treatments [22,38], confirming that residual unassimilated NO3 exerted negligible effects on δ15N signatures. Consequently, δAL and δAH values for O. violaceus plantlets grown with mixed N sources were considered equivalent to those of NO3-fed plantlets.
In prior studies, where NaNO3 served as the sole N source (δ15N = 8.08‰ or 22.67‰) [22,38], the mean leaf δ15N values of O. violaceus plantlets across 10, 20, and 40 mM NO3 concentrations closely aligned with δ15N values (δAL or δAH) in this study. Specifically, δAL (5.71 ± 0.17‰, n = 9) derived from low-δ15N (L) treatment [38], while δAH (17.02 ± 0.23‰, n = 9, SE) corresponded to high-δ15N (H) treatment [22]. Using these parameters (δTH, δTL, δAH and δAL), we calculated the proportional contributions of fA and fB of NO3- and NH4+-derived N. Although NO3 efflux could theoretically alter δAL and δAH values by redistributing unassimilated NO3, leaf δ15N remained invariant across 10 mM to 40 mM NO3 concentrations [22,38]. This demonstrates that the presence of NH4+ in mixed sources negligibly affects NO3 isotope discrimination, and efflux dynamics did not significantly perturb leaf isotopic signatures. Thus, δAL and δAH values from NO3-fed plantlets were valid proxies for mixed-N treatments. Nevertheless, minor uncertainties calculated via Equation (5) may persist due to unquantified efflux effects.

2.7. Quantifying the Absolute Nitrogen and Carbon Accumulation in Leaves

Leaf N accumulation amount (NAA) and C accumulation amount (CAA) were calculated using the following two equations:
N   A   A = ( D   W   × N   c o n t e n t ) / M
C   A   A = ( D   W   × C   c o n t e n t ) / M  
where the molar mass of N or C is denoted as M.

2.8. Quantifying Leaf Nitrogen from NO3/NH4+ Assimilation

The leaf NAA from NO3/NH4+ assimilation are calculated using the following equations:
NAA nitrate = NAA × f A
NAA ammonium = NAA × f B
where the error propagation formula was used to calculate the standard error (SE) of NAAnitrate or NAAammonium [34].

2.9. Statistical Analysis

Data are presented as means ± standard errors (SE n = 3). Statistical significances were determined using analysis of variance (ANOVA), with treatment means compared by Tukey’s honestly significant difference (HSD) test (p < 0.05). All analyses were performed using a Data Processing System (DPS) software (version 7.05, Hangzhou Ruifeng Information Technology Co., Ltd., Hangzhou, China).

3. Results

3.1. Growth Characteristics

The growth of O. violaceus plantlets was significantly influenced by NO3 concentrations under a constant 20 mM NH4+. Increasing NO3 concentrations substantially enhanced plantlet growth. Biomass and leaf dry weight declined significantly only at the lowest tested NO3 concentration (Table 1), indicating that insufficient NO3 availability severely limited growth under these conditions.

3.2. Chlorophyll Concentrations

Chlorophyll levels in O. violaceus plantlets were significantly influenced by NO3 concentration. Under a constant 20 mM NH4+, increasing NO3 substantially supplied elevated chlorophyll concentrations. Levels increased over threefold as NO3 concentrations rose from 10 to 20 mM (Table 2). This enhancement in chlorophyll biosynthesis was strongly associated with elevated NO3 availability, highlighting its critical role in supporting photosynthetic capacity.

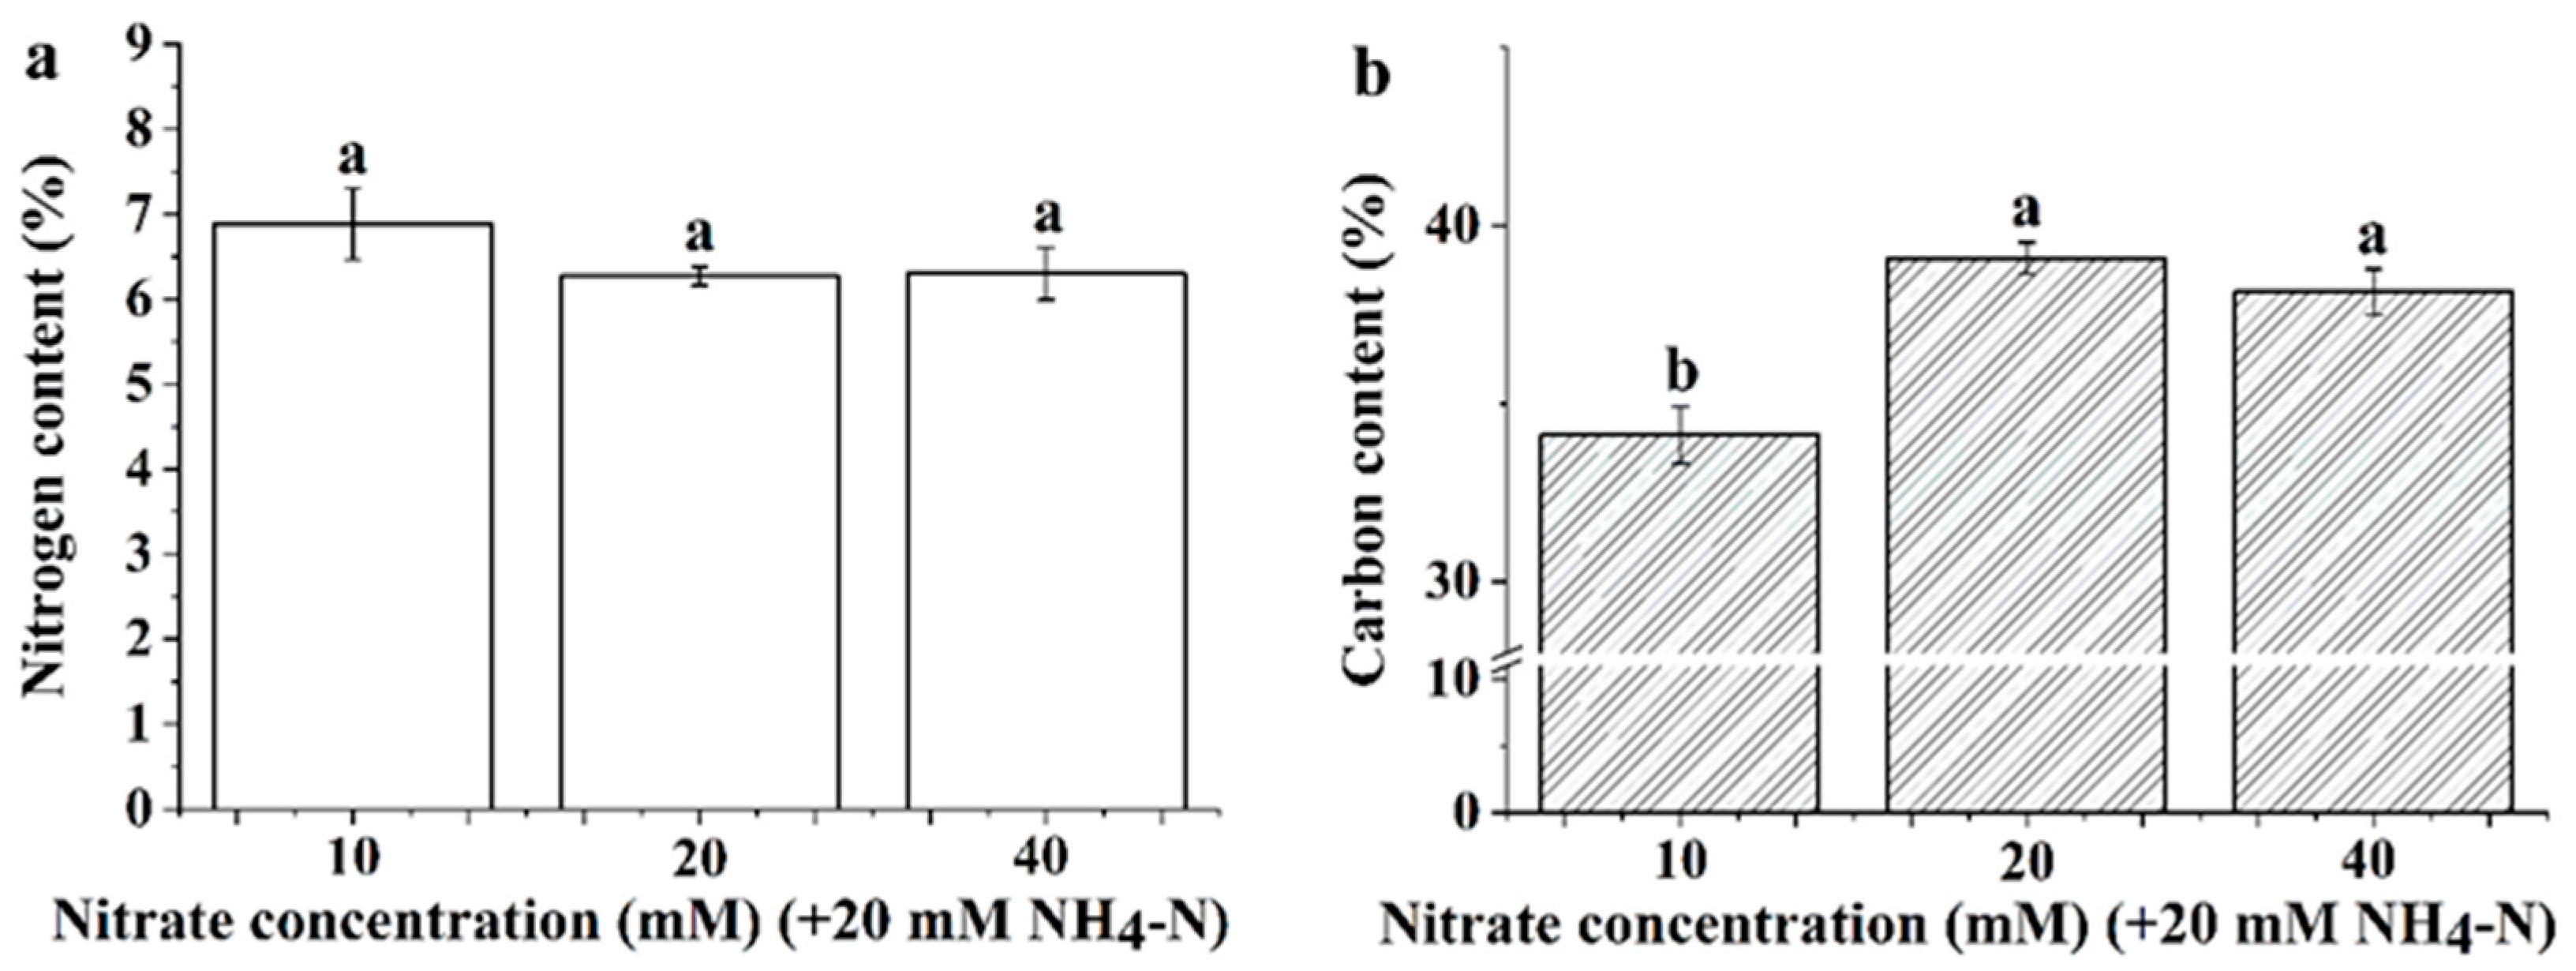
3.3. Leaf Nitrogen and Carbon Content

While increasing NO3 concentrations had no significant effects on leaf N content in O. violaceus plantlets, which remained above 6% across all treatments, they significantly influenced leaf C content. Elevated NO3 supply significantly increased leaf C, with the lowest concentration consistently yielding reduced C content compared to higher concentrations (Figure 1).

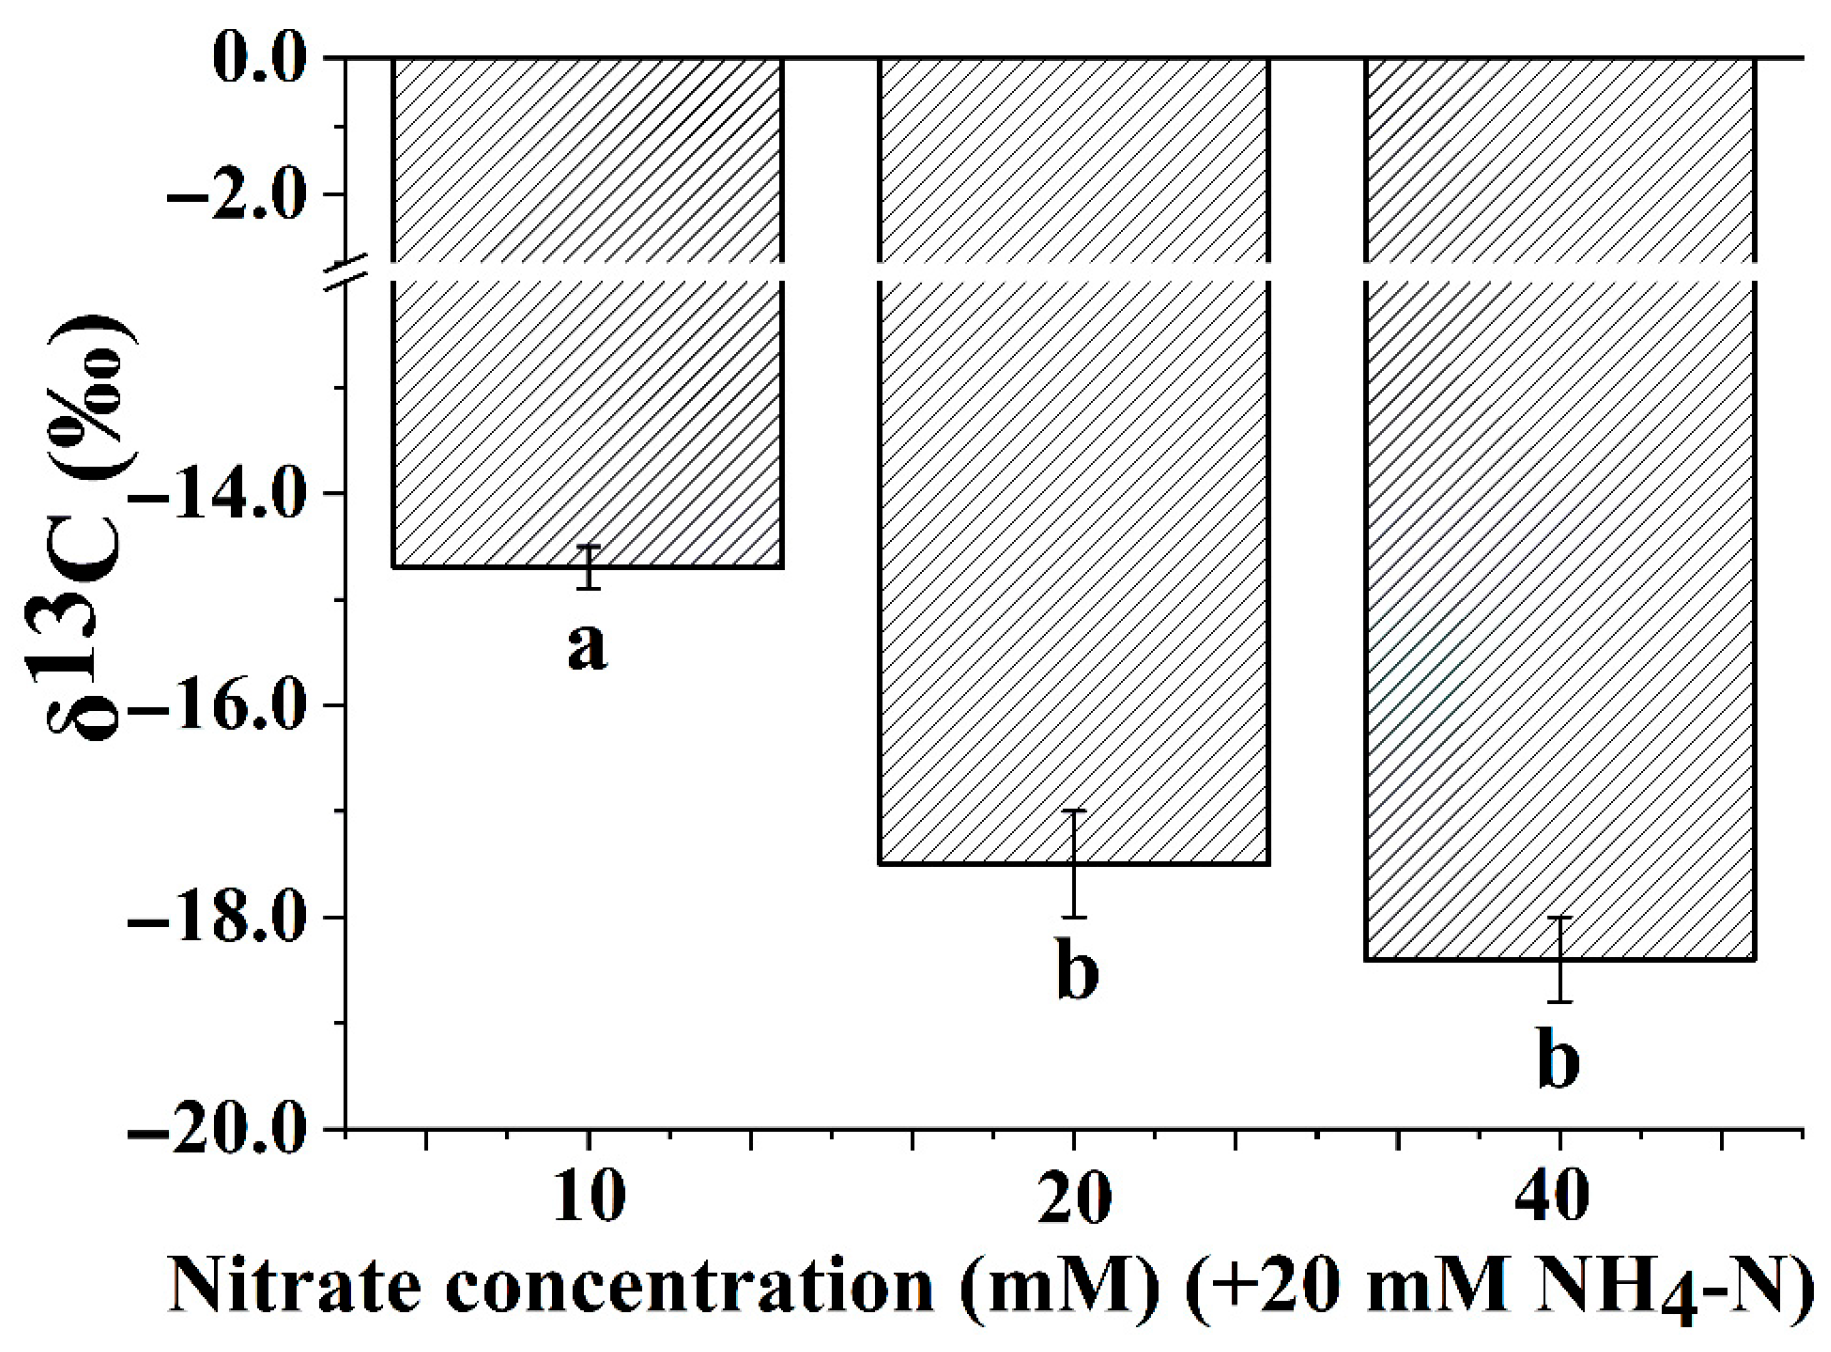
3.4. Leaf Carbon Isotope Composition

While NO3 concentration significantly influenced δ13C values of O. violaceus plantlets, significant differences occurred only at the lowest NO3 concentration. δ13C values remained stable across the 20 to 40 mM NO3 range (Figure 2).

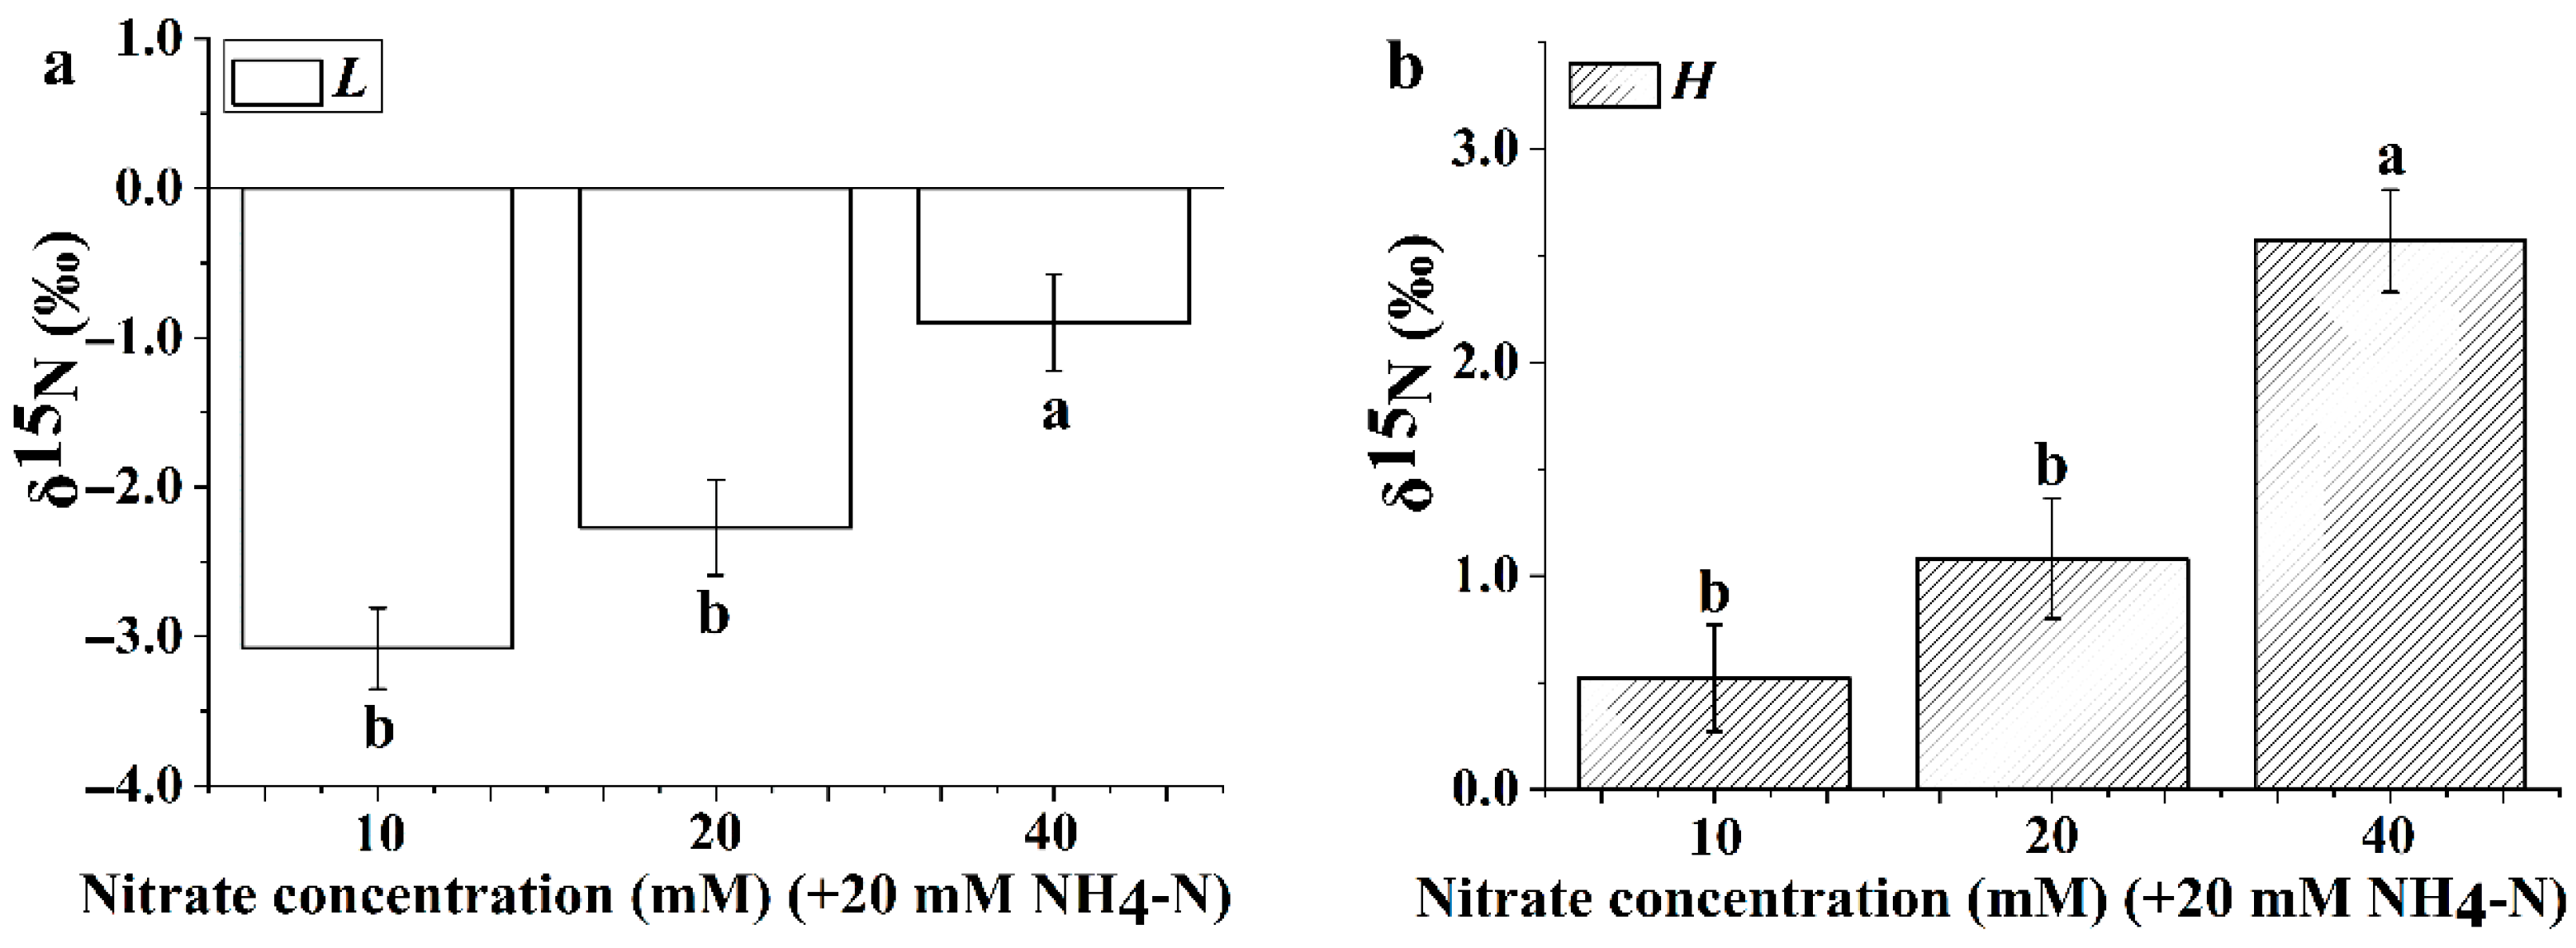
3.5. Leaf Nitrogen Isotope Composition

δ15N values in O. violaceus plantlets were significantly higher in the H treatment than in the L treatment (Figure 3). Increasing NO3 concentration significantly elevated δ15N values in both the L and H treatments. Notably, under the lowest 10 mM NO3 with mixed N source, δ15N values in the L treatment were below −3.0‰. This 15N depletion relative to the N source (−2.64‰) suggests isotopic discrimination during NH4+ assimilation.

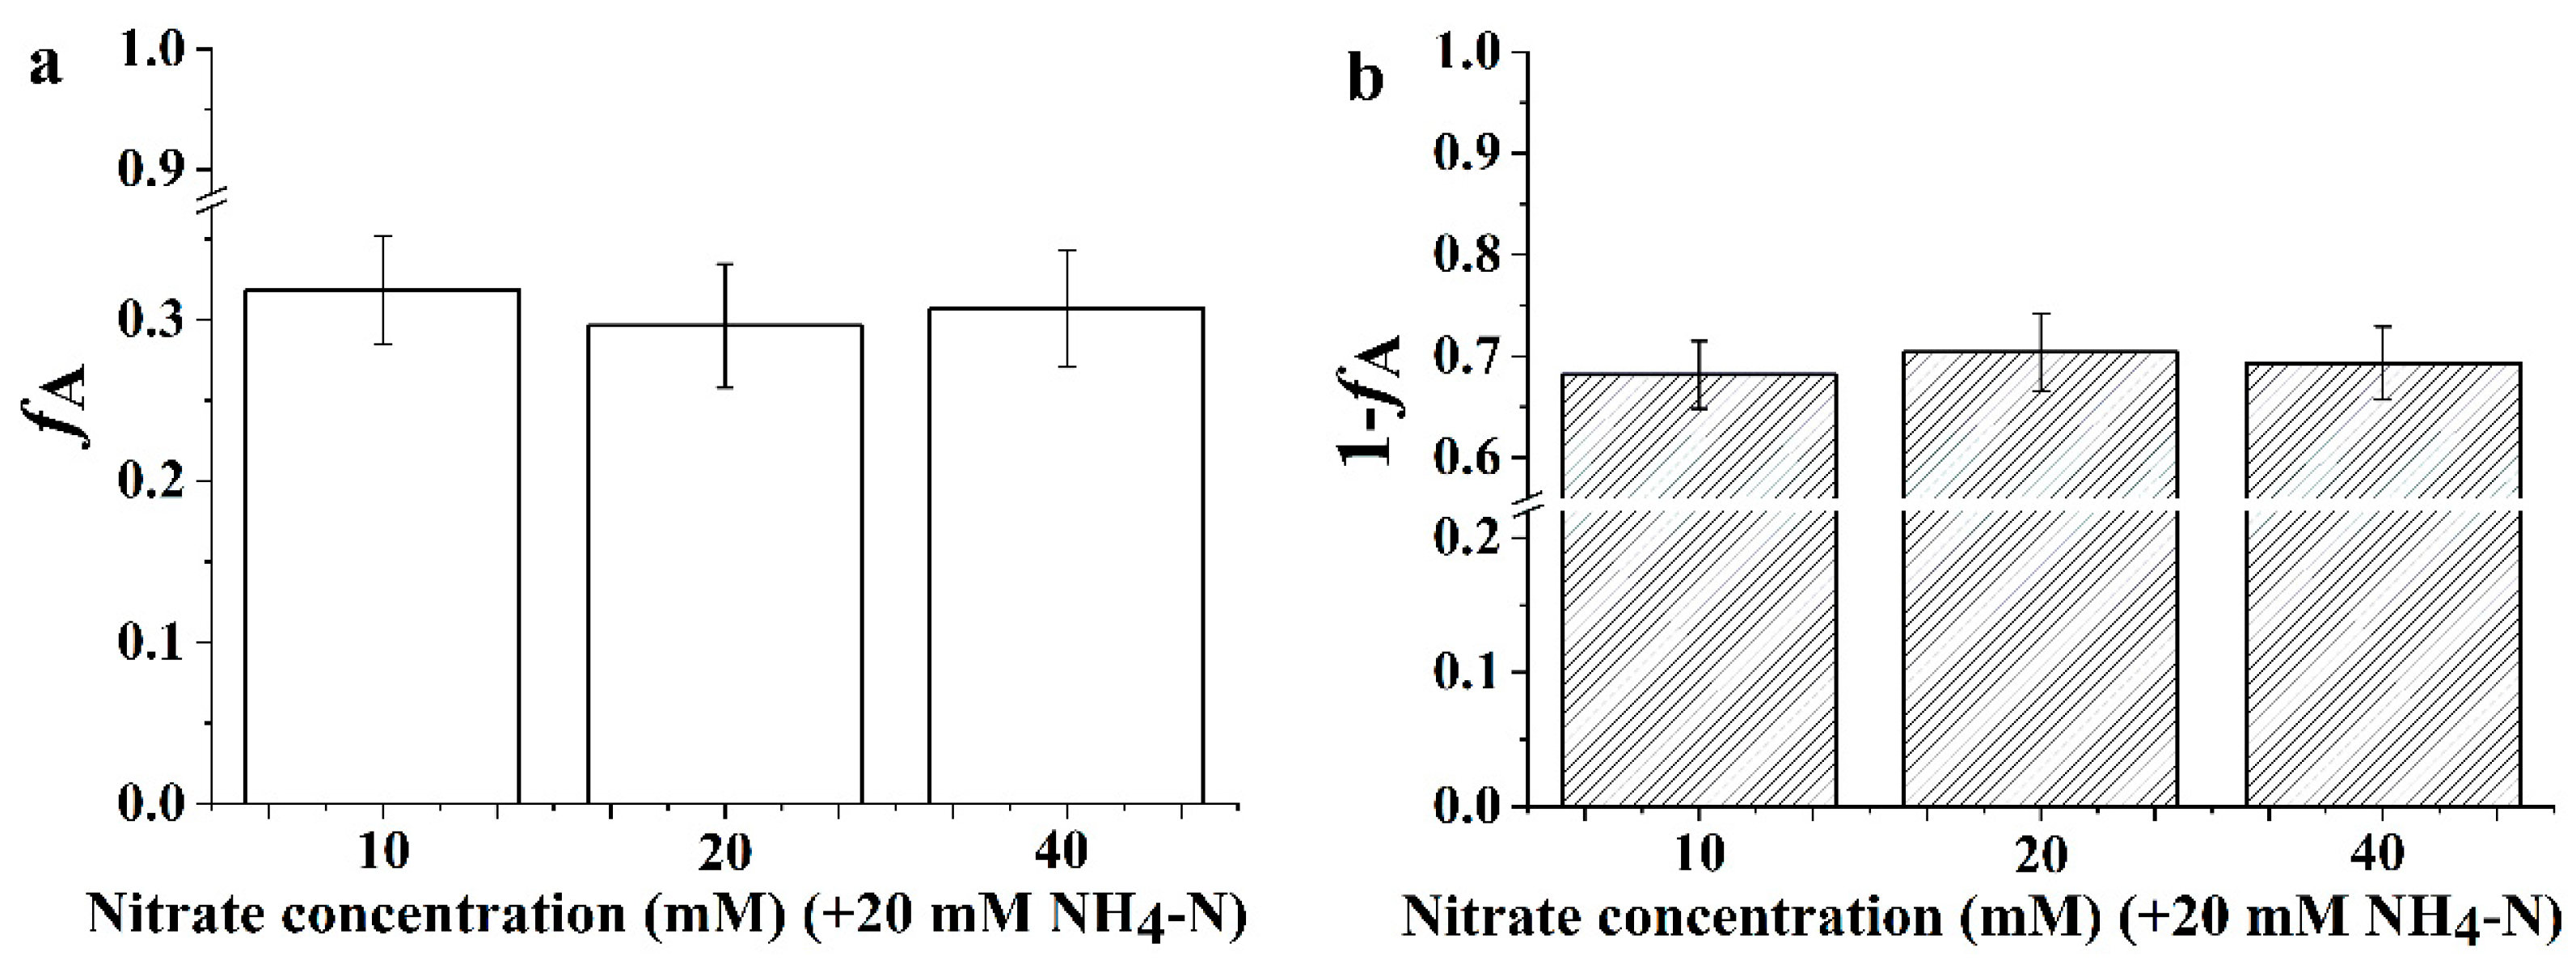
3.6. The Proportion of Inorganic Nitrogen Utilization

Nitrate concentration had no significant effect on NO3 utilization in O. violaceus plantlets (Figure 4). Increasing NO3 levels failed to increase NO3 uptake, as NH4+ remained the preferred N source, evidenced by its significantly higher utilization proportion.

3.7. The δ15N and Δ15N of Ammonium Assimilation

The δ15N values of NH4+ assimilation in the O. violaceus plantlets were consistently depleted relative to the source δ15N across all treatments (Figure 5a), indicating isotopic discrimination during assimilation. However, the magnitude of this discrimination (Δ15N) varied significantly with NO3 concentration. Increasing NO3 levels significantly reduced Δ15N values (Figure 5b), demonstrating an inverse relationship between NO3 availability and isotopic discrimination during NH4+ assimilation.

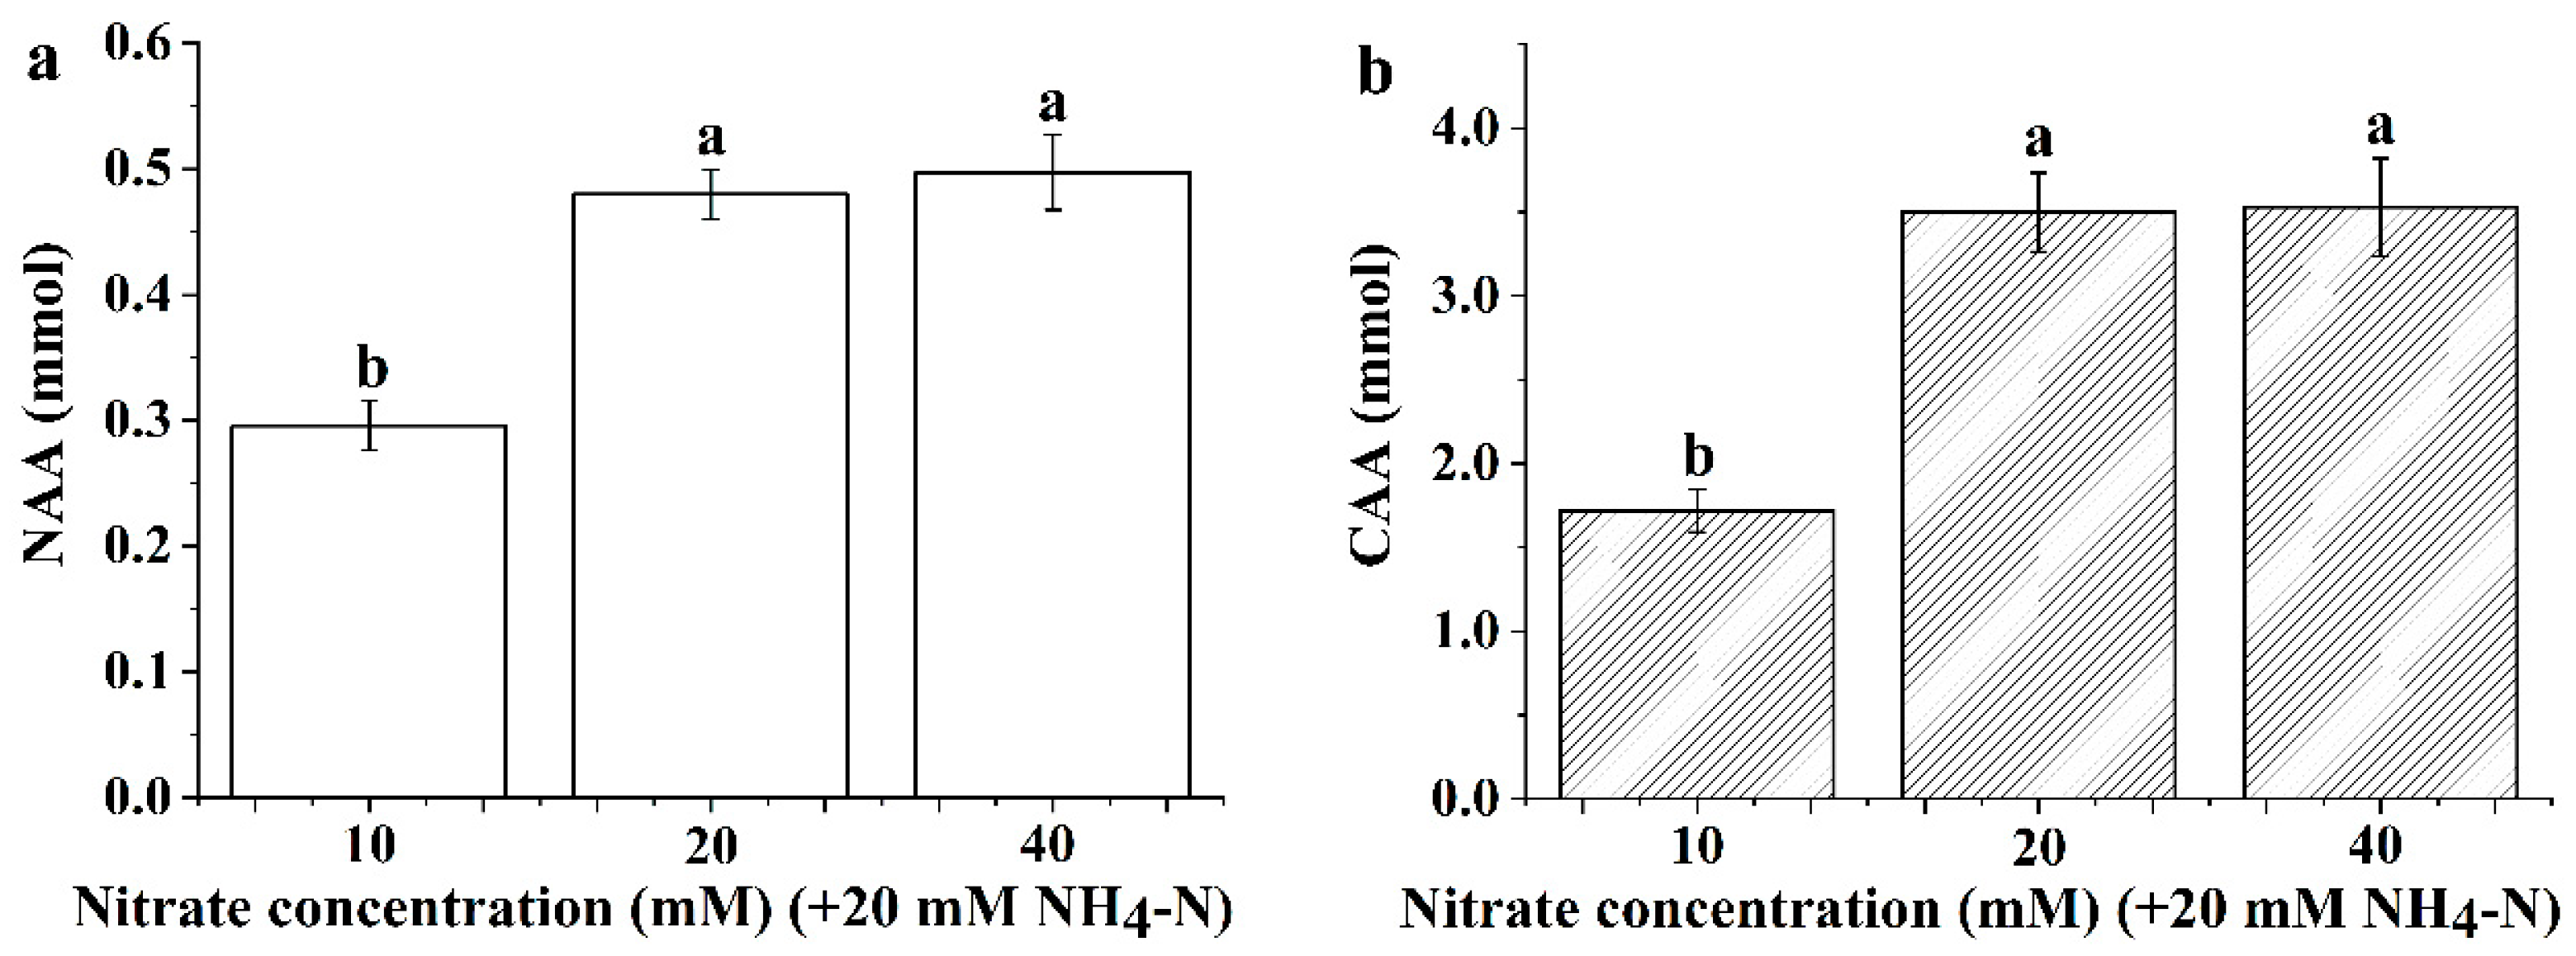
3.8. Absolute Nitrogen and Carbon Accumulation in the Leaves

Leaf N accumulation amount (NAA) in O. violaceus plantlets increased with NO3 availability. Higher NO3 levels significantly enhanced both leaf NAA (Figure 6a) and C accumulation amount (CAA) (Figure 6b). Critically, plantlets grown at the lowest NO3 concentration exhibited significantly lower NAA and CAA compared to higher concentrations.

3.9. Leaf Nitrogen Accumulation Amount Resulting from Nitrate/Ammonium Assimilation

Elevated NO3 concentrations enhanced both NO3 and NH4+ assimilation in O. violaceus plantlets. Leaf NAA from NO3 (NAAnitrate) and NH4+ (NAAammonium) increased progressively with higher NO3 concentrations (Figure 7). Strikingly, doubling NO3 from 10 to 20 mM significantly boosted both NAAnitrate and NAAammonium, demonstrating its role as a key driver of N assimilation efficiency.

4. Discussion

Ammonium is generally preferred over NO3 as a N source due to its lower energy cost during assimilation [1]. However, elevated NH4+ concentrations typically induce growth suppression (NH4+ toxicity) in plants [4,39,40]. While supplying mixed NO3 and NH4+ can alleviate this toxicity [5,8], the precise mechanisms remain unresolved. Notably, NH4+ toxicity symptoms often persist even in the presence of NO3 [10,41,42]. In this study, O. violaceus plantlets supplemented with 20 mM NH4+ exhibited a significant decrease in biomass and chlorophyll concentrations at 10 mM NO3 compared to higher NO3 treatments (Table 1 and Table 2), despite maintaining leaf N levels > 6% across all treatments. These results contrast with the well-documented positive correlations between chlorophyll and leaf N content, where ~75% of leaf N is allocated to chloroplasts [43]. These findings suggest that the capacity of NO3 to mitigate NH4+ toxicity depends on its concentration and may involve mechanisms independent of total N status.
Excessive NH4+ concentrations in growth solutions can induce futile NH4+ cycling [12,44], a process characterized by disproportionately high NH4+ efflux relative to influx. This efflux energetically costly [11,45], leading to significant energy drain that impedes biomass accumulation—a hallmark of NH4+ toxicity [46,47]. Crucially, because effluxed NH4+ is enriched in 15N [31], the futile NH4+ cycling results in 15N-depleted assimilates during NH4+ metabolism. The magnitude of this depletion, quantified as Δ15NB, serves as a proxy for futile cycling activity.
In O. violaceus plantlets grown with mixed N sources, δ15NB values of NH4+ assimilation were consistently more negative than −2.64‰ (Figure 5a), confirming NH4+ efflux across all treatments. Notably, Δ15NB values decreased with increasing NO3 concentrations (Figure 5b), suggesting that elevated NO3 availability suppresses futile NH4+ cycling. These results imply that NO3-mediated mitigation of NH4+ toxicity operates, at least partly, through suppression of futile cycling, with efficacy critically dependent on NO3 concentration.
To mitigate the detrimental effects of high NH4+ concentrations, plants often expel excess NH4+ or enhance its assimilation [26,27]. In O. violaceus plantlets, leaf N derived from NH4+ assimilation (NAAammonium) increased significantly with elevated NO3 concentrations (Figure 7), indicating that higher NO3 availability stimulated NH4+ assimilation [48]. Given the constant 20 mM NH4+ supply across treatments, this rise in NAAammonium reflected improved NH4+ utilization efficiency. This enhanced efficiency likely suppressed futile NH4+ cycling—a key driver of NH4+ toxicity [47].
However, excessive NH4+ assimilation can result in intracellular and extracellular acidification, a primary driver of NH4+ toxicity [13]. Notably, in this study, increased NH4+ assimilation coincided with enhanced NO3 assimilation (Figure 7). Crucially, NO3 reduction consumes protons [1,13], generating hydroxyl ions that neutralize acidity. Concurrently, NO3 uptake via NO3/H+ symporters [21,49,50] further alleviates acidic stress by co-transporting protons into cells. Thus, NO3 assimilation not only improves N utilization but also directly counterbalances acidification from NH4+ assimilation. These findings reveal a dual mechanism for NO3-mediated mitigation of NH4+ toxicity: (1) suppression of futile NH4+ cycling through enhanced assimilation efficiency, and (2) neutralization of acidic stress via proton consumption during NO3 reduction and proton-coupled transport.
While NO3 reduction can alleviate acidic stress, insufficient NO3 availability may fail to effectively mitigate this response [51]. In O. violaceus plantlets, the chlorophyll concentrations significantly decreased at 10 mM NO3 compared to higher NO3 concentrations (Table 2), despite leaf N content reaching its maximum at this same 10 mM NO3. This paradoxical reduction in chlorophyll under lower NO3 likely stems from acidic stress induced by excessive NH4+ assimilation [13].
Chlorophyll concentration serves as an indirect indicator of photosynthetic capacity, as reduced levels directly impede plant photosynthetic potential [52]. In this study, O. violaceus plantlets grown at 10 mM NO3 exhibited the lowest chlorophyll content, indicating severely compromised photosynthetic capacity. These O. violaceus plantlets were grown mixotrophically, utilizing both CO2 and sucrose.
Carbon isotope discrimination during key metabolic processes was characterized as follows. (1) Photosynthetic CO2 assimilation: Discrimination averaged ~20‰ [25]. Given the δ13C value of chamber CO2 was −10.55 ± 0.13‰ (n = 12), the δ13C value of assimilated CO2-derived C is estimated −10.55 + (−20 ‰) = −30.55‰. (2) Sucrose utilization, Discrimination (fractionation) was 2.54 ± 0.13‰ (n = 3) [10]. Given the δ13C value of supplied sucrose was −11.64‰, the δ13C value of metabolized sucrose-derived C is calculated −11.64 + (−2.54‰) = −14.18‰.
Leaf δ13C values reflect the integrated δ13C signatures of assimilated CO2 and metabolized sucrose. Greater reliance on inorganic CO2 assimilation results in lower (more negative) leaf δ13C values due to photosynthetic fractionation, while increased utilization of organic sucrose elevates leaf δ13C [24]. As shown in Figure 2, O. violaceus plantlets grown at 10 mM NO3 exhibited significantly higher leaf δ13C values than those at other NO3 concentrations. These indicate a substantial reduction in photosynthetic CO2 assimilation relative to sucrose utilization. These isotopic data align with the observed photosynthetic deficiency and corroborate the impaired photosynthetic capacity at this NO3. We conclude that insufficient chlorophyll synthesis at 10 mM NO3 directly constrains photosynthetic performance through reduced CO2 assimilation.
As previously established, mitigating NH4+ toxicity in plants—whether through extruding excess NH4+ or enhancing its assimilation—demands substantial energy [4,26,27,53,54]. In this study, the O. violaceus plantlets grown at the lowest 10 mM NO3 concentration exhibited the highest leaf N content (>6.5%, Figure 1a), with ~70% of assimilated N derived from NH4+ (Figure 4b). However, this high-N phenotype incurred significant energy costs, exacerbated by pronounced futile NH4+ cycling—an ATP-intensive process [11]. Concurrently, leaf C content decreased markedly at 10 mM NO3 (Figure 1b), reflecting a metabolic trade-off likely driven by energy depletion [55].
Despite exogenous sucrose supplementation (3% w/v), energy limitation persisted in low-NO3 conditions due to impaired photosynthetic capacity [44]. Increased respiratory activity from sucrose catabolism may further exacerbate oxidative stress via mitochondrial reactive oxygen species generation [8,56], explaining the stunted growth at 10 mM NO3 (Table 1). Thus, even 10 mM NO3 in mixed N sources failed to fully mitigate NH4+ toxicity, as sucrose-derived energy proved insufficient to meet metabolic demands of NH4+ detoxification.
Notably, photosynthetic capacity significantly improved as NO3 increased from 10 to 20 mM (Figure 2). Enhanced photosynthesis likely bolsters cellular energy production through chloroplast electron transport—where the noncyclic pathways generate both ATP and NADPH, while the cyclic pathways produce ATP exclusively [57]. This dynamic modulation of ATP:NADPH output better aligns with the stoichiometric demands of NH4+ detoxification, enabling efficient assimilation without depleting C reserves.

5. Conclusions

Our study demonstrates that futile NH4+ cycling occurs in plants under NH4+ toxicity stress, with its magnitude modulated by NO3 availability. Elevated NO3 concentrations enhance NH4+ utilization efficiency, suppressing futile cycling and its associated energy drain. Concurrently, increased NO3 assimilation alleviates acidic stress via proton-consuming reduction and transport, counteracting acidification from NH4+ assimilation. Crucially, the lowest NO3 concentration (10 mM) proved insufficient to mitigate acidic stress, which results in an inhibition of chlorophyll biosynthesis. The chlorophyll deficiency caused by acidic stress severely impaired photosynthetic capacity, which serves as a core mechanism of NH4+ toxicity. Thus, NO3-mediated mitigation of NH4+ toxicity operates through dual pathways: (1) restoring photosynthetic energy production and (2) enhancing NH4+ utilization efficiency to minimize futile cycling.

Author Contributions

Y.W. and K.Z. designed the experiment; K.Z. performed most of the experiment; H.L. and H.H. performed some of the experiment; K.Z., H.L. and H.H. analyzed experimental data; K.Z. drafted the manuscript; X.H., Y.W. and K.Z. revised the manuscript; All authors have read and agreed to the published version of the manuscript.

Funding

This work was supported by the Guizhou Provincial Science and Technology Foundation ((2020)1Y172); Support Plan Projects of Science and Technology of Guizhou Province ((2021) YB453); and National Natural Science Foundation of China (32001101).

Data Availability Statement

All data generated or analyzed during this study are included in this published article.

Acknowledgments

The work was carried out at State Key Laboratory of Environmental Geochemistry, Institute of Geochemistry, Chinese Academy of Sciences, Guiyang, Guizhou, China. The authors are grateful to Jing Tian for measuring δ15N and δ13C, and Ruqiu Sun for her technical assistance in nitrogen and carbon analysis.

Conflicts of Interest

The authors declare no conflicts of interest.

References

  1. Salsac, L.; Chaillou, S.; Morot-Gaudry, J.F.; Lesaint, C.; Jolivet, E. Nitrate and ammonium nutrition in plants. Plant Physiol. Bioch. 1987, 25, 805–812. Available online: https://hal.science/hal-02727402/ (accessed on 6 July 2025).
  2. Xu, G.H.; Fan, X.R.; Miller, A.J. Plant nitrogen assimilation and use efficiency. Annu. Rev. Plant Biol. 2012, 63, 153–182. [Google Scholar] [CrossRef] [PubMed]
  3. Zaheer, M.; Zafar, Z.U.; Athar, H.U.R.; Bano, H.; Amir, M.; Khalid, A.; Manzoor, H.; Javed, M.; Iqbal, M.; Ogbaga, C.C.; et al. Mixing tannery effluent had fertilizing effect on growth, nutrient accumulation, and photosynthetic capacity of some cucurbitaceous vegetables: A little help from foe. Environ. Sci. Pollut. R. 2023, 30, 28947–28960. [Google Scholar] [CrossRef] [PubMed]
  4. Britto, D.T.; Kronzucker, H.J. NH4+ toxicity in higher plants: A critical review. J. Plant Physiol. 2002, 159, 567–584. [Google Scholar] [CrossRef]
  5. Hachiya, T.; Watanabe, C.K.; Fujimoto, M.; Ishikawa, T.; Takahara, K.; Kawai-Yamada, M.; Uchimiya, H.; Uesono, Y.; Terashima, I.; Noguchi, K. Nitrate addition alleviates ammonium toxicity without lessening ammonium accumulation, organic acid depletion and inorganic cation depletion in Arabidopsis thaliana shoots. Plant Cell Physiol. 2012, 53, 577–591. [Google Scholar] [CrossRef] [PubMed]
  6. Kong, L.G.; Zhang, Y.X.; Zhang, B.; Li, H.W.; Wang, Z.H.; Si, J.H.; Fan, S.J.; Feng, B. Does energy cost constitute the primary cause of ammonium toxicity in plants? Planta 2022, 256, 62. [Google Scholar] [CrossRef] [PubMed]
  7. Sun, D.; Fang, X.M.; Xiao, C.B.; Huang, X.M.; Su, J.R.; Li, J.; Wang, J.F.; Wang, S.M.; Luan, S.; He, K. Kinase SnRK1.1 regulates nitrate channel SLAH3 engaged in nitrate-dependent alleviation of ammonium toxicity. Plant Physiol. 2021, 186, 731–749. [Google Scholar] [CrossRef] [PubMed]
  8. Du, W.Y.; Zhang, Y.X.; Si, J.S.; Zhang, Y.; Fan, S.J.; Xia, H.Y.; Kong, L.A. Nitrate alleviates ammonium toxicity in wheat (Triticum aestivum L.) by regulating tricarboxylic acid cycle and reducing rhizospheric acidification and oxidative damage. Plant Signal Behav. 2021, 16, 1991687. [Google Scholar] [CrossRef] [PubMed]
  9. Zheng, X.; He, K.; Kleist, T.; Chen, F.; Luan, S. Anion channel SLAH3 functions in nitrate-dependent alleviation of ammonium toxicity in Arabidopsis. Plant Cell Environ. 2015, 38, 474–486. [Google Scholar] [CrossRef] [PubMed]
  10. Zhang, K.Y.; Wu, Y.Y.; Su, Y.; Li, H.T. Implication of quantifying nitrate utilization and CO2 assimilation of Brassica napus plantlets in vitro under variable ammonium/nitrate ratios. BMC Plant Biol. 2022, 22, 392. [Google Scholar] [CrossRef] [PubMed]
  11. Britto, D.T.; Kronzucker, H.J. Futile cycling at the plasma membrane: A hallmark of low-affinity nutrient transport. Trends Plant Sci. 2006, 11, 529–534. [Google Scholar] [CrossRef] [PubMed]
  12. Szczerba, M.W.; Britto, D.T.; Balkos, K.D.; Kronzucker, H.J. Alleviation of rapid, futile ammonium cycling at the plasma membrane by potassium reveals K+-sensitive and-insensitive components of NH4+ transport. J. Exp. Bot. 2008, 59, 303–313. [Google Scholar] [CrossRef] [PubMed]
  13. Hachiya, T.; Inaba, J.; Wakazaki, M.; Sato, M.; Toyooka, K.; Miyagi, A.; Kawai-Yamada, M.; Sugiura, D.; Nakagawa, T.; Kiba, T.; et al. Excessive ammonium assimilation by plastidic glutamine synthetase causes ammonium toxicity in Arabidopsis thaliana. Nat. Commun. 2021, 12, 4944. [Google Scholar] [CrossRef] [PubMed]
  14. Zhang, M.X.; Ding, M.D.; Xu, F.Y.; Afzal, M.R.; Chen, X.; Zeng, H.Q.; Yan, F.; Zhu, Y.Y. Involvement of plasma membrane H+-ATPase in the ammonium-nutrition response of barley roots. J. Plant Nutr. Soil Sci. 2018, 181, 878–885. [Google Scholar] [CrossRef]
  15. Esteban, R.; Ariz, I.; Cruz, C.; Moran, J.F. Review: Mechanisms of ammonium toxicity and the quest for tolerance. Plant Sci. 2016, 248, 92–101. [Google Scholar] [CrossRef] [PubMed]
  16. Alencar, V.T.C.B.; Lobo, A.K.M.; Carvalho, F.E.L.; Silveira, J.A.G. High ammonium supply impairs photosynthetic efficiency in rice exposed to excess light. Photosynth Res. 2019, 140, 321–335. [Google Scholar] [CrossRef] [PubMed]
  17. Wang, F.; Gao, J.; Shi, S.; He, X.; Dai, T. Impaired electron transfer accounts for the photosynthesis inhibition in wheat seedlings (Triticum aestivum L.) subjected to ammonium stress. Physiol. Plantarum 2019, 167, 159–172. [Google Scholar] [CrossRef] [PubMed]
  18. Liu, Y.; Li, Y.X.; Li, Y.X.; Tian, Z.W.; Hu, J.L.; Adkins, S.; Dai, T.B. Changes of oxidative metabolism in the roots of wheat (Triticum aestivum L.) seedlings in response to elevated ammonium concentrations. J. Integr. Agri. 2021, 20, 1216–1228. [Google Scholar] [CrossRef]
  19. Murashige, T.; Skoog, F. A revised medium for rapid growth and bio assays with tobacco tissue cultures. Physiol. Plantarum 1962, 15, 473–497. [Google Scholar] [CrossRef]
  20. Hessini, K.; Lachaal, M.; Cruz, C.; Soltani, A. Role of ammonium to limit nitrate accumulation and to increase water economy in Wild Swiss chard. J. Plant Nutr. 2009, 32, 821–836. [Google Scholar] [CrossRef]
  21. Xiao, C.B.; Sun, D.D.; Liu, B.B.; Fang, X.M.; Li, P.C.; Jiang, Y.; He, M.M.; Li, J.; Luan, S.; He, K. Nitrate transporter NRT1. 1 and anion channel SLAH3 form a functional unit to regulate nitrate-dependent alleviation of ammonium toxicity. J. Integr. Plant Biol. 2022, 64, 942–957. [Google Scholar] [CrossRef] [PubMed]
  22. Zhang, K.Y.; Wu, Y.Y.; Hang, H.T. Differential contributions of NO3/NH4+ to nitrogen use in response to a variable inorganic nitrogen supply in plantlets of two Brassicaceae species in vitro. Plant Methods 2019, 15, 86. [Google Scholar] [CrossRef] [PubMed]
  23. Olaitan, M.M.; Mangse, G.; Ogbaga, C.C.; Uthman, T.O. Gibberellic acid influences growth indices and biochemical parameters in micropropagated Ocimum gratissimum L. explants. J. Med. Plants Econ. Dev. 2022, 6, 154. [Google Scholar] [CrossRef]
  24. Serret, M.D.; Trillas, M.I.; Matas, J.; Araus, J. The effect of different closure types, light, and sucrose concentrations on carbon isotope composition and growth of Gardenia jasminoides plantlets during micropropagation and subsequent acclimation ex vitro. Plant Cell Tiss. Org. 1997, 47, 217–230. [Google Scholar] [CrossRef]
  25. O’Leary, M.H. Carbon isotope fractionation in plants. Phytochemistry 1981, 20, 553–567. [Google Scholar] [CrossRef]
  26. Cao, T.E.; Ni, L.Y.; Xie, P.; Xu, J.; Zhang, M. Effects of moderate ammonium enrichment on three submersed macrophytes under contrasting light availability. Freshwater Biol. 2011, 56, 1620–1629. [Google Scholar] [CrossRef]
  27. Yu, Q.; Wang, H.J.; Wang, H.Z.; Li, Y.; Liang, X.M.; Xu, C.; Jeppesen, E. Does the responses of Vallisneria natans (Lour.) Hara to high nitrogen loading differ between the summer high-growth season and the low-growth season? Sci. Total Environ. 2017, 601, 1513–1521. [Google Scholar] [CrossRef] [PubMed]
  28. Evans, R.D. Physiological mechanisms influencing plant nitrogen isotope composition. Trends Plant Sci. 2001, 6, 121–126. [Google Scholar] [CrossRef] [PubMed]
  29. Kalcsits, L.A.; Buschhaus, H.A.; Guy, R.D. Nitrogen isotope discrimination as an integrated measure of nitrogen fluxes, assimilation and allocation in plants. Physiol. Plantarum 2014, 151, 293–304. [Google Scholar] [CrossRef] [PubMed]
  30. Yoneyama, T.; Kamachi, K.; Yamaya, T.; Mae, T. Fractionation of nitrogen isotopes by glutamine synthetase isolated from spinach leaves. Plant Cell Physiol. 1993, 34, 489–491. [Google Scholar] [CrossRef]
  31. Hu, Y.; Guy, R.D. Isotopic composition and concentration of total nitrogen and nitrate in xylem sap under near steady-state hydroponics. Plant Cell Environ. 2020, 43, 2112–2123. [Google Scholar] [CrossRef] [PubMed]
  32. Alsaadawi, I.S.; Al-Hadithy, S.M.; Arif, M.B. Effects of three phenolic acids on chlorophyll content and ions uptake in cowpea seedlings. J. Chem. Ecol. 1986, 12, 221–227. [Google Scholar] [CrossRef] [PubMed]
  33. Yousfi, S.; Serret, M.D.; Araus, J.L. Comparative response of δ13C, δ18O and δ15N in durum wheat exposed to salinity at the vegetative and reproductive stages. Plant Cell Environ. 2013, 36, 1214–1227. [Google Scholar] [CrossRef] [PubMed]
  34. Taylor, J. Introduction to Error Analysis, the Study of Uncertainties in Physical Measurements; University Science Books: Sausalito, CA, USA, 1997; Available online: https://ui.adsabs.harvard.edu/abs/1997ieas.book.....T/abstract (accessed on 6 July 2025).
  35. Evans, R.D.; Bloom, A.J.; Sukrapanna, S.S.; Ehleringer, J.R. Nitrogen isotope composition of tomato (Lycopersicon esculentum Mill. cv. T-5) grown under ammonium or nitrate nutrition. Plant Cell Environ. 1996, 19, 1317–1323. [Google Scholar] [CrossRef]
  36. Cárdenas-Navarro, R.; Adamowicz, S.; Robin, P. Diurnal nitrate uptake in young tomato (Lycopersicon esculentum Mill.) plants: Test of a feedback-based model. J. Exp. Bot. 1998, 49, 721–730. [Google Scholar] [CrossRef]
  37. Matt, P.; Geiger, M.; Walch-Liu, P.; Engels, C.; Krapp, A.; Stitt, M. The immediate cause of the diurnal changes of nitrogen metabolism in leaves of nitrate-replete tobacco: A major imbalance between the rate of nitrate reduction and the rates of nitrate uptake and ammonium metabolism during the first part of the light period. Plant Cell Environ. 2001, 24, 177–190. [Google Scholar] [CrossRef]
  38. Zhang, K.Y.; Wu, Y.Y. The δ15N response and nitrate assimilation of Orychophragmus violaceus and Brassica napus plantlets in vitro during the multiplication stage cultured under different nitrate concentrations. Acta Geochim. 2017, 36, 190–197. [Google Scholar] [CrossRef]
  39. Boschiero, B.N.; Mariano, E.; Azevedo, R.A.; Trivelin, P.C.O. Influence of nitrate-ammonium ratio on the growth, nutrition, and metabolism of sugarcane. Plant Physiol. Bioch. 2019, 139, 246–255. [Google Scholar] [CrossRef] [PubMed]
  40. Sarasketa, A.; González-Moro, M.B.; González-Murua, C.; Marino, D. Nitrogen source and external medium pH interaction differentially affects root and shoot metabolism in Arabidopsis. Front. Plant Sci. 2016, 7, 29. [Google Scholar] [CrossRef] [PubMed]
  41. Li, B.H.; Li, G.J.; Kronzucker, H.J.; Baluška, F.; Shi, W.M. Ammonium stress in Arabidopsis: Signaling, genetic loci, and physiological targets. Trends Plant Sci. 2014, 19, 107–114. [Google Scholar] [CrossRef] [PubMed]
  42. Safaei, F.; Alirezalu, A.; Noruzi, P.; Alirezalu, K. Phytochemical and morpho-physiological response of Melissa officinalis L. to different NH4+ to NO3-ratios under hydroponic cultivation. BMC Plant Biol. 2024, 24, 968. [Google Scholar] [CrossRef] [PubMed]
  43. Mu, X.H.; Chen, Y.L. The physiological response of photosynthesis to nitrogen deficiency. Plant Physiol. Bioch. 2021, 158, 76–82. [Google Scholar] [CrossRef] [PubMed]
  44. Shilpha, J.; Song, J.; Jeong, B.R. Ammonium phytotoxicity and tolerance: An insight into ammonium nutrition to improve crop productivity. Agronomy 2023, 13, 1487. [Google Scholar] [CrossRef]
  45. Kronzucker, H.J.; Britto, D.T.; Davenport, R.J.; Tester, M. Ammonium toxicity and the real cost of transport. Trends Plant Sci. 2001, 6, 335–337. [Google Scholar] [CrossRef] [PubMed]
  46. Hachiya, T.; Noguchi, K. Integrative response of plant mitochondrial electron transport chain to nitrogen source. Plant Cell Rep. 2011, 30, 195–204. [Google Scholar] [CrossRef] [PubMed]
  47. Xiao, C.B.; Fang, Y.; Wang, S.M.; He, K. The alleviation of ammonium toxicity in plants. J. Integr. Plant Biol. 2023, 65, 1362–1368. [Google Scholar] [CrossRef] [PubMed]
  48. Li, S.; Yan, L.; Zhang, W.; Yi, C.; Haider, S.; Wang, C.; Liu, Y.; Xu, F.S.; Ding, G. Nitrate alleviates ammonium toxicity in Brassica napus by coordinating rhizosphere and cell pH and ammonium assimilation. Plant J. 2024, 117, 786–804. [Google Scholar] [CrossRef] [PubMed]
  49. Feng, H.M.; Fan, X.R.; Miller, A.J.; Xu, G.H. Plant nitrogen uptake and assimilation: Regulation of cellular pH homeostasis. J. Exp. Bot. 2020, 71, 4380–4392. [Google Scholar] [CrossRef] [PubMed]
  50. Wang, Y.Y.; Hsu, P.K.; Tsay, Y.F. Uptake, allocation and signaling of nitrate. Trends Plant Sci. 2012, 17, 458–467. [Google Scholar] [CrossRef] [PubMed]
  51. Fang, X.Z.; Tian, W.H.; Liu, X.X.; Lin, X.Y.; Jin, C.W.; Zheng, S.J. Alleviation of proton toxicity by nitrate uptake specifically depends on nitrate transporter 1.1 in Arabidopsis. New Phytol. 2016, 211, 149–158. [Google Scholar] [CrossRef] [PubMed]
  52. Filella, I.; Serrano, L.; Serra, J.; Peñuelas, J. Evaluating wheat nitrogen status with canopy reflectance indices and discriminant analysis. Crop Sci. 1995, 35, 1400–1405. [Google Scholar] [CrossRef]
  53. Ochieng, W.A.; Xian, L.; Nasimiyu, A.T.; Muthui, S.W.; Ndirangu, L.N.; Otieno, D.O.; Wan, T.; Liu, F. Exploring the ammonium detoxification mechanism of young and mature leaves of the macrophyte Potamogeton lucens. Aquat. Toxicol. 2021, 237, 105879. [Google Scholar] [CrossRef] [PubMed]
  54. Wang, F.; Gao, J.W.; Yong, J.W.H.; Liu, Y.F.; Cao, D.; He, X.H. Glutamate over-accumulation may serve as an endogenous indicator of tricarboxylic acid (TCA) cycle suppression under NH4+ nutrition in wheat (Triticum aestivum L.) seedlings. Environ. Exp. Bot. 2020, 177, 104130. [Google Scholar] [CrossRef]
  55. Tavakoli, F.; Hajiboland, R.; Nikolic, M. Multiple mechanisms are involved in the alleviation of ammonium toxicity by nitrate in cucumber (Cucumis sativus L.). Plant Soil 2024, 503, 451–473. [Google Scholar] [CrossRef]
  56. Szal, B.; Podgórska, A. The role of mitochondria in leaf nitrogen metabolism. Plant Cell Environ. 2012, 35, 1756–1768. [Google Scholar] [CrossRef] [PubMed]
  57. Buchanan, B.B.; Gruissem, W.; Jones, R.L. Biochemistry and Molecular Biology of Plants, 2nd ed.; John Wiley & Sons: West Sussex, UK, 2015; Available online: https://www.wiley.com/en-us/Biochemistry+and+Molecular+Biology+of+Plants%2C+2nd+Edition-p-9781118502198 (accessed on 6 July 2025).
Figure 1. Effects of nitrate concentrations on leaf N (a) and C (b) content in 35-day-old Orychophragmus violaceus. Plantlets were grown with mixed N source (fixed 20 mM NH4+-N). Data indicate means ± SE (n = 3) and different letters above the bar indicate significant differences at p < 0.05.
Agronomy 15 01789 g001
Figure 2. Effects of nitrate concentrations on leaf carbon isotope composition (δ13C) in 35-day-old Orychophragmus violaceus. Plantlets were grown with mixed N source (fixed 20 mM NH4+-N). Data indicate means ± SE (n = 3) and different letters above the bar indicate significant differences at p < 0.05.
Agronomy 15 01789 g002
Figure 3. Effects of nitrate concentrations on leaf nitrogen isotope composition (δ15N) ((a), L-labeled treatment, low δ15N-NO3 = 8.08‰) and ((b), H-labeled treatment, high δ15N-NO3 = 22.67‰) in 35-day-old Orychophragmus violaceus. Plantlets were grown with mixed N source (fixed 20 mM NH4+-N). Data indicate means ± SE (n = 3) and different letters above the bar indicate significant differences at p < 0.05.
Agronomy 15 01789 g003
Figure 4. Effects of nitrate concentrations on the proportion of nitrate (a) and ammonium (b) utilization by the 35-day-old Orychophragmus violaceus. Plantlets were grown with mixed N source (fixed 20 mM NH4+-N). A formula based on error propagation was used to calculate the error bars.
Agronomy 15 01789 g004
Figure 5. Effects of nitrate concentrations on the δ15N (a) and Δ15N (b) of ammonium assimilation in 35-day-old Orychophragmus violaceus. Plantlets were grown with mixed N source (fixed 20 mM NH4+-N). A formula based on error propagation was used to calculate the error bars.
Agronomy 15 01789 g005
Figure 6. Effects of nitrate concentrations on the leaf nitrogen (a) and carbon (b) accumulation amount in 35-day-old Orychophragmus violaceus. Plantlets were grown with mixed N source (fixed 20 mM NH4+-N). Data indicate means ± SE (n = 3) and different letters above the bar indicate significant differences at p < 0.05.
Agronomy 15 01789 g006
Figure 7. Effects of nitrate concentrations on the leaf nitrogen accumulation amount resulting from nitrate (NAAnitrate) and ammonium (NAAammonium) assimilation in the 35-day-old Orychophragmus violaceus. Plantlets were grown with mixed N source (fixed 20 mM NH4+-N). A formula based on error propagation was used to calculate the error bars.
Agronomy 15 01789 g007
Table 1. Effects of nitrate levels on biomass production in 35-day-old Orychophragmus violaceus plantlets grown under a combined inorganic nitrogen source with a fixed 20 mM NH4-N.
ParametersInorganic Nitrogen Concentration
10 mM NO3-N +
20 mM NH4-N
20 mM NO3-N +
20 mM NH4-N
40 mM NO3-N +
20 mM NH4-N
Increased biomass (g/plantlet FW)2.525 ± 0.084 b4.178 ± 0.369 a4.070 ± 0.251 a
Leaf DW (g)0.060 ± 0.003 b0.107 ± 0.006 a0.111 ± 0.008 a
Data indicate means ± SE (n = 3). Values in the same row followed by different letters are significantly different at p < 0.05.
Table 2. Effects of nitrate levels on chlorophyll concentration in 35-day-old Orychophragmus violaceus plantlets grown under a combined inorganic nitrogen source with a fixed 20 mM NH4-N.
ParametersInorganic Nitrogen Concentration
10 mM NO3-N +
20 mM NH4-N
20 mM NO3-N +
20 mM NH4-N
40 mM NO3-N +
20 mM NH4-N
Chl a (mg/g FW)0.163 ± 0.008 b0.564 ± 0.037 a0.647 ± 0.047 a
Chl b (mg/g FW)0.081 ± 0.005 b0.295 ± 0.013 a0.322 ± 0.012 a
Chl a + b (mg/g FW)0.243 ± 0.004 b0.859 ± 0.049 a0.969 ± 0.057 a
Data indicate means ± SE (n = 3). Values in the same row followed by different letters are significantly different at p < 0.05.
Disclaimer/Publisher’s Note: The statements, opinions and data contained in all publications are solely those of the individual author(s) and contributor(s) and not of MDPI and/or the editor(s). MDPI and/or the editor(s) disclaim responsibility for any injury to people or property resulting from any ideas, methods, instructions or products referred to in the content.

