Article

Synergistic Effects of Bicarbonate and Selenium on Cadmium Transport in Karst-Adaptable Plants Based on Plant Electrical Signals

1
Enshi Tujia & Miao Autonomous Prefecture Academy of Agricultural Sciences, Enshi 445000, China
2
State Key Laboratory of Environmental Geochemistry, Institute of Geochemistry, Chinese Academy of Sciences, Guiyang 550081, China
3
College of Forestry, Guizhou University, Guiyang 550081, China
4
Department of Botany and Microbiology, Faculty of Science, South Valley University, Qena 83523, Egypt
*
Authors to whom correspondence should be addressed.
Agronomy 2024, 14(1), 218; https://doi.org/10.3390/agronomy14010218
Submission received: 31 October 2023 / Revised: 3 December 2023 / Accepted: 12 December 2023 / Published: 19 January 2024
(This article belongs to the Special Issue Emerging Research on Adaptive Plants in Karst Ecosystems—Volume II)

Abstract

:
High cadmium (Cd) concentrations associated with geochemical anomalies are prevalent in carbonate-rich karstic areas, posing serious ecological risks, while the karstic soils are rich in bicarbonate (HCO3). It is known that Selenium (Se) is a mineral element that effectively mitigates the Cd transport in plant species. However, the synergistic effects of HCO3 and Se on Cd translocation in plant species have not yet been indicated. In this study, based on plant electrophysiological measurements, we chose Orychophragmus violaceus (Ov) as experimental material and determined the growth potential, water metabolism, and nutrient translocation capacity under HCO3-Se6+-Cd2+ treatment to identify the synergistic effects of bicarbonate and selenium on cadmium transport in karst-adaptable plants. We found 5 mM HCO3 and 0.46 mM Se6+ synergistically alleviated the Cd2+ stress on Ov, promoting growth, intracellular water metabolism, nutrient translocation efficiency, and total Se accumulation, and inhibiting the uptake of Cd in Ov. Nevertheless, 15 mM HCO3 and 0.46 mM Se6+ synergistically augmented Cd transport on Ov, resulting in growth reduction, intracellular water metabolism, nutrient translocation efficiency, and total Se concentration. Hence, it not only provides a frontier approach for the real-time monitoring of intracellular water and nutrient utilization capacity in plant species, but is also even more a theoretical idea that reveals the synergistic effects of bicarbonate and selenium on cadmium transport of plants to precisely indicate selenium supplementation to ameliorate cadmium pollution and construct a sustainable karst ecosystem in the future.

1. Introduction

Rapid urbanization has led to the increasing pollution of soils with heavy metals, especially “cadmium” (Cd) pollution [1]. Compared to non-karst areas, Cd pollution is more severe in karst environments, attributed to high geological background values, soil formation processes, and low heavy metal activity in the karst soil [2]. Plant passivation is an essential tool for soil heavy metal remediation, and hyperaccumulator plants can effectively reduce Cd transport, which has limited negative impacts on the environment [3]. Therefore, screening suitable hyperaccumulator plants is important for efficiently remedying soil Cd pollution [4].
There is an antagonistic effect between selenium (Se) and cadmium (Cd), and appropriately providing exogenous Se reduced Cd toxicity [5,6]. In karst areas, the large dissolution of carbonate rock led to soil containing abundant bicarbonate (HCO3) [7], which was a major soil carbon sink, and significantly influenced the secondary bioconcentration process of elements, such as Se and Cd in the soil–plant interface [8]. Accordingly, we presumed HCO3 and Se may interactively influence the translocation of Cd in plant species; however, its effect remains unclear in current research.
There is no doubt that the soil ionic environment determines the transport of metal ions in plant cells [9]. However, due to the long complex growth processes of plant species, it appears to be too dissimilar to judge sensitive reactions to the soil ionic environment only on its outward morphology. Furthermore, electrical impulses, which are closely associated with complicated metabolism processes, have the potential to regulate plant growth and even real-time reactions to altering soil environments [10]. Under abiotic stress conditions, electrical signals of plant species were generated in continuous coplanar bodies, such as the cells of plant tissues, leading to transient changes in potential electrical gradients, which appeared in the vesicles and cell membranes of plant species [11,12]. Consequently, we knew plant electrical signals were able to decode information exchanges between cells and organs, so as to clarify the responses of growth to the external environment. It was reported that electrical signals were found throughout various physiological processes, such as intracellular water metabolism, nutrient transport, and response to abiotic stresses in plant species [13]. For example, plant electrical signals were used to characterize leaf tensity, in order to rapidly determine the adaptation capacity for drought stress and precise irrigation in agriculture [14]. Hence, plant electrophysiological techniques provide a feasible approach for exploring the synergistic effects of HCO3 and Se on the transport of Cd in plant species.
Compared to conventional techniques, plant electrophysiology ensures the integrity of the cytosol and cellular activities of plant cells, and even analyzes intracellular water metabolism and nutrient translocation, which were never directly measured in previous research [15,16]. Its principle is as follows: based on the basic structural properties of plant cells, the phospholipid bilayer, which belongs to the cell membrane, is the source of cellular electrical properties, endowing the cell with functions, such as the storage of electrical charges, and capacitive and resistor values similar to electrical properties, including capacitance (C), resistance (R), impedance (Z), capacitive reactance (Xc), and inductive reactance (XL) [16,17]. Dielectric substances, such as organic and inorganic ions present in plants, generated electrical currents, and the electrophysiological current could reflect the polar substances’ translocation properties in plant species, which depended on the inductance and capacitance of per unit biomembranes [18]. Among them, the capacitance (C) originated from the bilayer structure of the cell membrane, both resistance (R) and impedance (Z), and capacitive reactance (Xc) indicated resistances to the electrical current and characterized environmental or biological stressors, which affected the cell membrane. In addition, inductive reactance (XL) originated from carrier and channel proteins of plant cells, etc. [19,20]. By determining C, R, Z, Xc, and XL, we could calculate the intracellular water and nutrient transport capacity, revealing the responses of Cd transport to interactions of HCO3 and Se in plant species.
It is widely known that Brassicaceae Burnett has a strong bioconcentration of heavy metal elements [21], therefore, we chose Orychophragmus violaceus (Ov), a typical karst-adaptable horticultural plant, as an experimental plant in this study. We determined the electrical signals, intracellular water metabolism capacity, nutrient translocation, total Se, and Cd concentration using the electrophysiological measurement technique. We also estimated the connection between Ov at different HCO3 levels, intrinsic Se6+, and Cd2+. We hope to investigate the following queries in this study: the electrophysiological reactions to varying HCO3, intrinsic Se6+, and Cd2+ levels in Ov; and the combined effects of HCO3 and Se6+ on Ov’s Cd2+ translocation.

2. Materials and Methods

2.1. Plant Materials

Orychophragmus violaceus (Ov), a typical karst-adaptable plant, was the selected material for this experiment, and the seeds of Ov were collected from the Institute of Geochemistry, Chinese Academy of Sciences (Guiyang, China). The experiments were conducted in a greenhouse with a length, width, and height of 10 × 5 × 4 m at the Institute of Geochemistry, Chinese Academy of Sciences (Guiyang, China). Metal halide lamps (HPI-T400 W/645, Philips, Amsterdam, Netherlands) were used as a light source, and the temperature was controlled by air conditioning. The greenhouse was kept at the following conditions: temperature (day/night): 25/19 °C, light intensity (500 ± 23 μmol m−2·s−1), constant light period (12 h per day), and relative humidity (between 55 and 60%). The Ov seeds were uniformly mixed with 70% ethanol, sterilized for one minute, rinsed three times with sterile water, and then steeped for 6 to 8 h. The Ov seedlings were grown in germination trays (twelve-hole size, 19 × 15 × 9.5 cm), filled with perlite:vermiculite at a 1:3 ratio, and irrigated with a modified Hogland solution, which provided the nutrients. The nutrient solution was changed every 3 days, and the seedlings were transplanted after 28 days for the subsequent experiment. The Ov seedlings with uniform growth were categorized as 3 plants/pot, 3 pots/group, and 3 groups/treatment for the differential bicarbonate treatments, which were carried out for 21 days, followed by the HCO3 Se6+-Cd2+ treatment.

2.2. Bicarbonate–Selenium–Cadmium Treatment

In Table 1, NaHCO3, Na2Se2O4, and CdSO4 were used for the HCO3, Se6+, and Cd2+ treatments, which were set at 0.46 mM Se6+ and 0.27 mM Cd2+, and the pH was adjusted to 7.9 ± 0.35. There were five treatments, including Cd (0.27 mM Cd2+), SC (Se6+:Cd2+, 0.46 mM:0.27 mM), HSC1 (HCO3:Se6+:Cd2+, 1 mM:0.46 mM:0.27 mM), HSC2 (HCO3:Se6+:Cd2+, 5 mM:0.46 mM:0.27 mM), and HSC3 (HCO3:Se6+:Cd2+, 15 mM:0.46 mM:0.27 mM). Six replicates were established for each group, and the treatment duration was 10 days in this experiment.

2.3. Plant Growth Conditions

Harvested plants were divided into tissue parts, root, stem, and leaves, exposed to 108 °C for 30 min, and then dried at 70 °C until reaching a constant weight (dried weight, DW). The root, stem, leaf, plant biomass, and root/shoot ratio (R/S ratio) were obtained with an electronic balance (Denver Instrument, 0.0001 g) as Equation (1).
R S r a t i o % = D w r o o t D w s h o o t × 100   R / S   r a t i o : r o o t / s h o o t   r a t i o

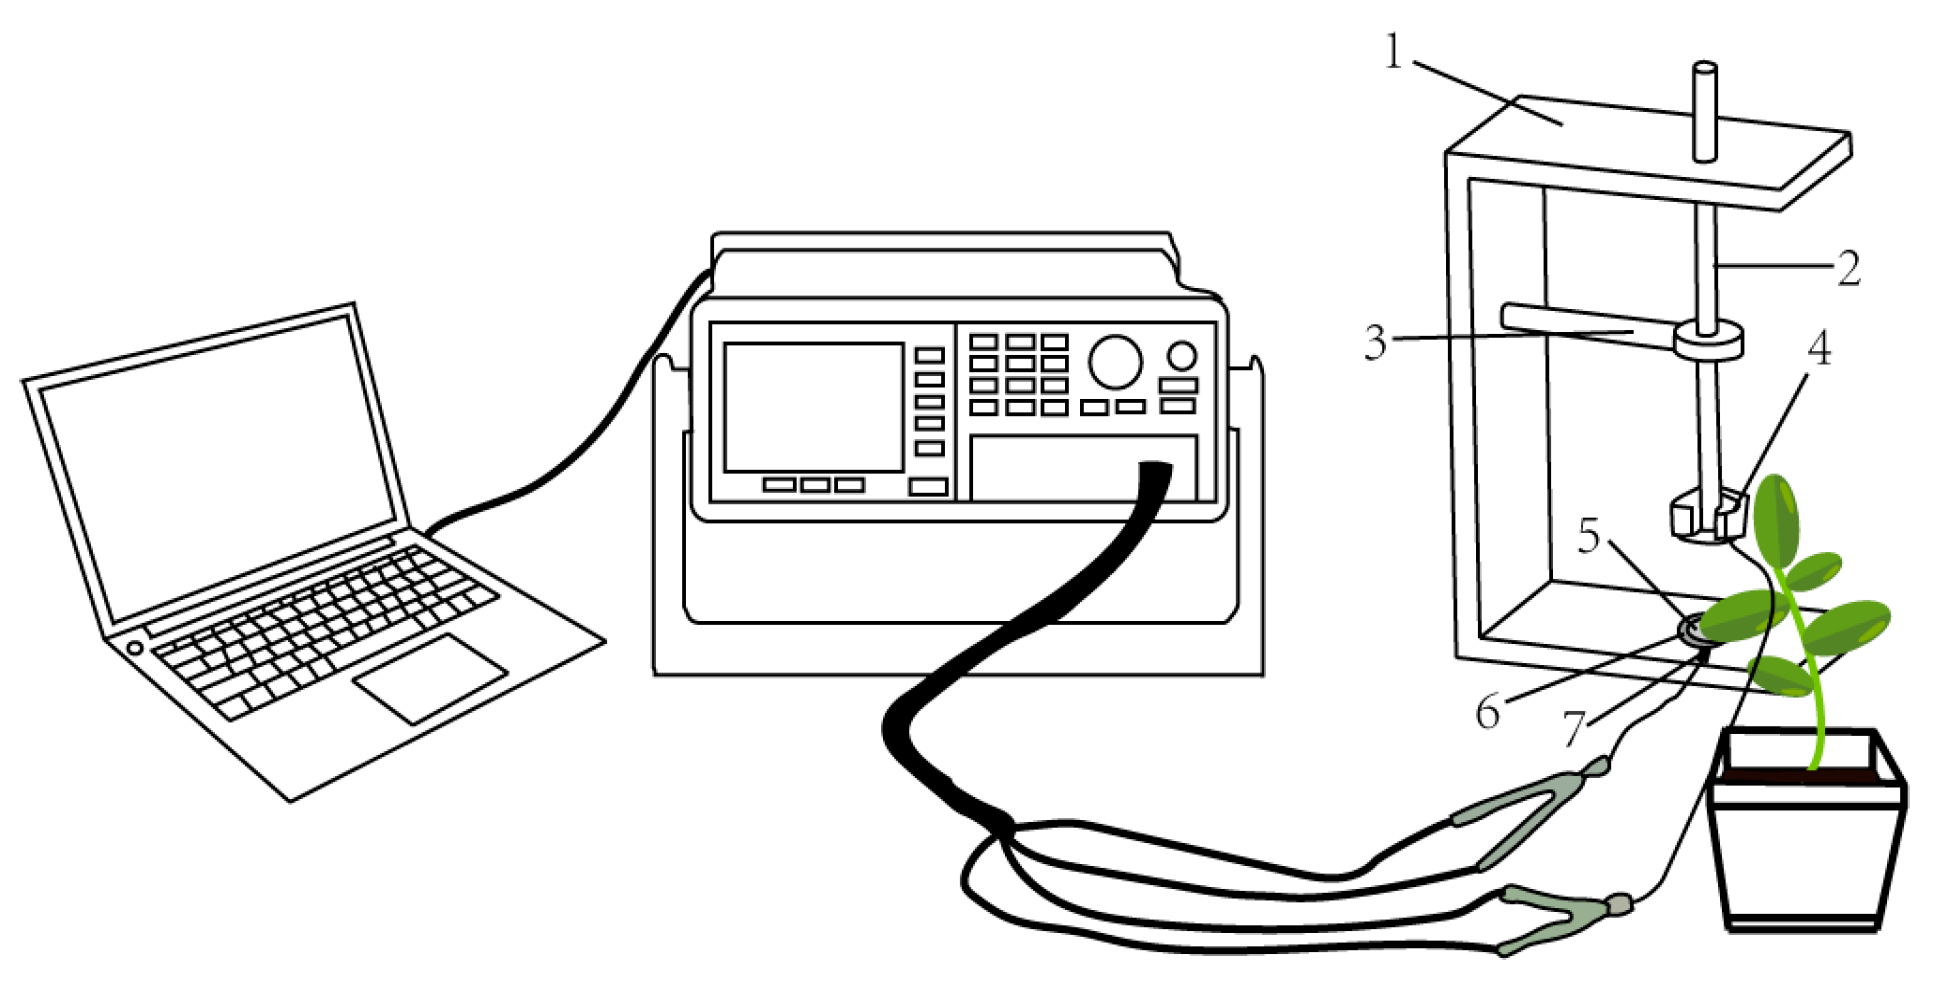
2.4. Measurement of Electrophysiological Information of Plants

In this experiment, the second unfolded leaf of each plant was selected for electrophysiological parameters. The plant cells’ ions, ionic groups, and electric dipoles were considered electrolytes. Subsequently, the leaves were placed between the two poles of a parallel plate capacitor, which formed a parallel plate capacitor sensor. The LCR-6100 (made in Suzhou, China), of which frequency (F) and voltage (U) were set to 3 kHz and 1.5 V, respectively, was used for this experiment. In addition, the measurement equipment consisted of a holder, electrode plates, wires, iron blocks, and plastic rods. Subsequently, the electrode plates were set in the holder and the base of the plastic bar (Figure 1), and the electrode plates were connected to the LCR-6100. The Ov leaves were clamped with two electrode plates. Therefore, we analyzed the physiological resistance (R), physiological impedance (Z), and physiological capacitance (C) of Ov with fixed clamping force (1 N, 2 N, 3 N, 5 N, and 7 N), which was measured 15 times. Eventually, we established Equations (1)–(8) for the electrophysiological signals of Ov under each treatment.

2.5. Calculation of Plant Electrophysiological Parameters

Usually, we considered the chloroplasts of leaves as capacitors, which changed along with the clamping forces, resulting in alterations of electrical signals in plant cells. It was constructed as Equation (2):
F = M + m g × 100
In Equation (2), “F” is the clamping force applied with the iron block (N), “M” is the mass of the iron block, “m” is the mass of the plastic rod and electrode sheet (kg), and “g” is the acceleration of gravity (9.8 N/kg). Based on the equation of Gibbs free energy and the Nernst, we obtained a plant model of R, Z, and C. The procedure for deriving the Equations (3)–(5) is as follows:
C = x 0 + h F
R = y 0 + k 1 e b 1 F
Z = p 0 + k 2 e b 2 F
The capacitive resistance (Xc) was calculated as Equation (6):
X c = 1 2 π f C
In Equation (6), “π” is 3.1416, and “f” is 3 kHZ, and we obtained the Xc of plants as Equation (7):
X c = q 0 + k 3 e b 3 F
The inductive reactance (XL) was analyzed as Equations (8) and (9):
1 X L = 1 Z 1 R 1 X c
X L = a 0 + k 4 e b 4 F
When F is 0, we calculated the intrinsic resistance (IR), intrinsic capacitive reactance (IXc), and intrinsic inductive reactance (IXL) of the plant from Equations (10)–(12):
I R = y 0 + k 1
I X c = q 0 + k 3
I X L = a 0 + k 4
The intrinsic impedance (IZ) and intrinsic capacitance (IC) were calculated from the IR, IXc, and IXL as Equations (13) and (14):
1 I Z = 1 I R + 1 I X c 1 I X L
I C = 1 2 π f I X L

2.6. Estimation of Intracellular Water Metabolism Capacity Based on Electrical Signals of Plant Species

The cells (organelles) of the same type in the same plant tissues and organs are fixed. The volume of cells (organelles) in an expanded leaf blade is proportional to the water-holding capacity (IWHC), which is proportional to C3. The intracellular water-holding capacity (IWHC) of plant species can be defined and calculated as Equation (15):
I W H C = C 3
Based on the constructed model parameters for capacitance with clamping force, we obtained Equation (16):
k 0 = U 2 2 d
The specific effective thickness (d) of the plant was calculated as Equation (17):
d = U 2 h 2
The intracellular water-use efficiency (IWUE) of the plant was calculated as Equation (18):
I W U E = d I W H C
The intracellular water-holding time (IWHT) of the plant was calculated as Equation (19):
I W H T = C × Z
The water-transfer rate (WRT) was calculated as Equation (20):
W R T = I W H C I W H T

2.7. Characterization of Nutrient Translocation Capacity BASED on Electrophysiological Signals of Plant Species

Based on the inherent electrophysiological signals, the unit nutrient transfer (UNF) was defined as Equation (21):
U N F = R I X c + R I X L
The nutrient transport rate (NTR) was defined as Equation (22):
N T R = I W H C I W H T
The nutrient transport capacity (NTC) was defined as Equation (23):
N T C = U N F × N T R
The nutrient active flow (UAF) was defined as Equation (24):
U A F = I X C I X L
The nutrient active transport capacity (NAC) was defined as Equation (25):
N A C = U A F × N T R

2.8. Selenium and Cadmium Content of Plants

Plant samples were digested using an automatic microwave digestion system, and the total Se and total Cd contents were determined by inductively coupled plasma mass spectrometry (ICP-MS). We weighed 0.4000 g of the sample and added 10 mL HNO3 and 2 mL H2O2 to a Teflon digestion tank for 0.5 h. The temperature was increased to 160 °C after 10 min, and further raised to 200 °C, which was maintained for 0.5 h. After cooling to 25 °C, the sample was diluted to 100 mL (ultrapure water) for measurement. The measurement conditions of ICP-MS were set as follows: spectral mode, RF power of 1550 W, gas temperature of 2 °C, sampling depth of 8 mm, carrier gas flow rate of 0.95 L/min, plasma gas flow rate of 15 L/min, and auxiliary gas flow rate of 0.10 L/min.

2.9. Selenium–Cadmium Bio Transfer/Bioconcentration Factor

The translocation factor (TF), which was equal to the element’s content in the shoot divided by that in the root, characterized the capacity of heavy metal element concentration in the plant species. The bioconcentration factor (BCF), which was equal to the element’s content in the organ (root, shoot, and leaves) divided by that in the environment, indicated the tendency of heavy metal element accumulation from the environment to the organ. Therefore, the translocation factor (TF) and bioconcentration factor (BCF) of Se and Cd of plants were calculated as Equations (26) and (27):
T F = S h o o t [ S e , C d ] R o o t [ S e , C d ]
B C F = O r g a n [ S e , C d ] E n v i r o n [ S e , C d ]

2.10. Statistical Analysis

The experimental data were evaluated for statistical differences using analysis of variance (ANOVA). Moreover, Tukey’s test (p < 0.05) was performed for the pair-wise comparisons between the different experimental treatments. The results are presented as the mean ± standard deviation (SD), and the figures were designed using Origin 2021 Pro.

3. Results

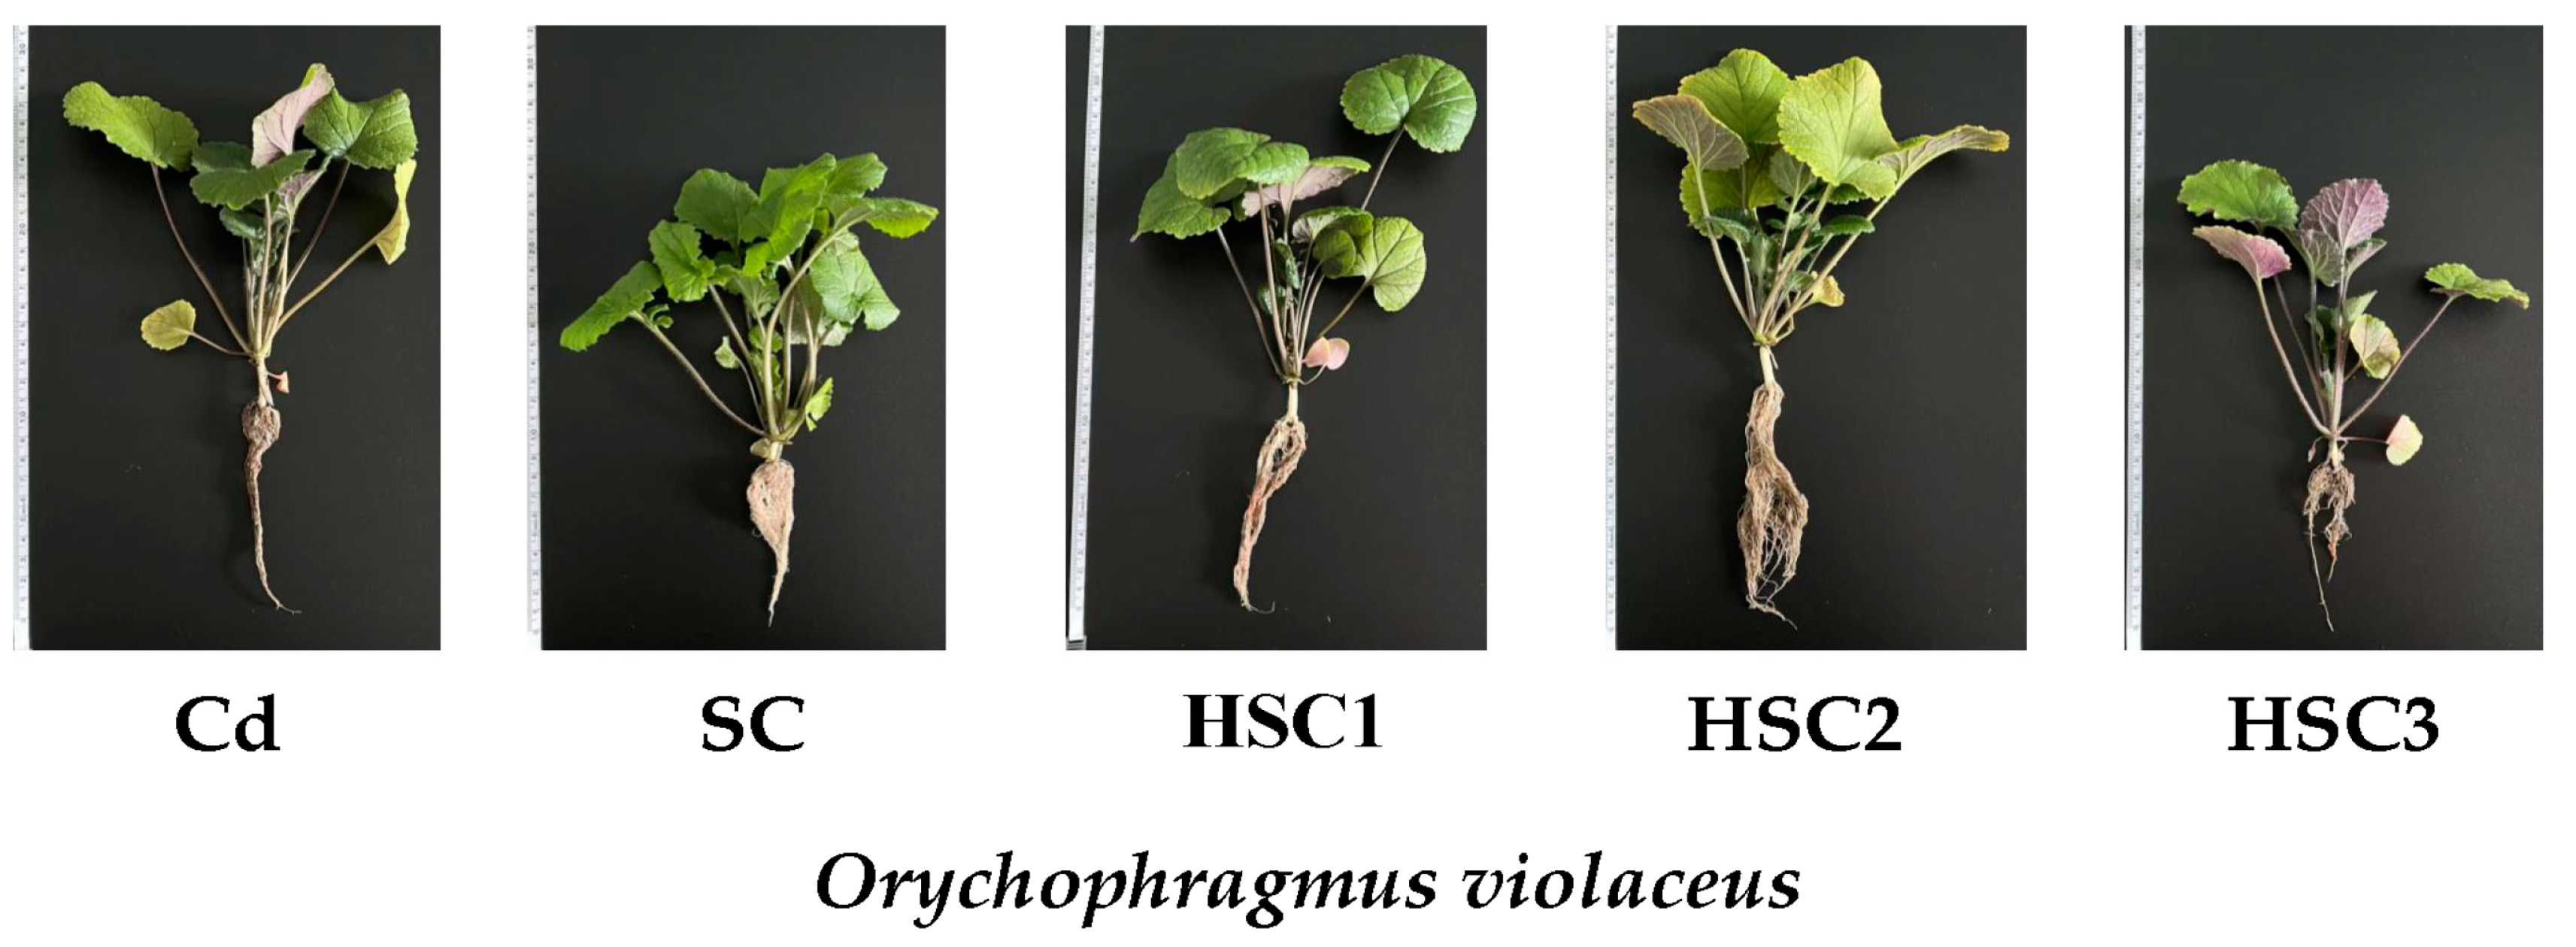
3.1. Plant Growth Features

The biomass parameters of Ov under bicarbonate–selenium–cadmium are presented in Table 2 and Figure 2 (the raw data see as Table S1). At HSC2, the root, stem, leaf, and total biomass of Ov reached the maximum level, while the R/S ratio was the lowest. Compared to Cd treatment alone, the root, stem, leaf, and total biomass under HSC2 treatment increased by 82.36%, 85.75%, 140.60%, and 108.09%, respectively, and the R/S ratio decreased by 15.43%. However, the root, stem, leaf, and total biomass of Ov were significantly reduced, and the R/S ratio reached its maximum at HSC3, where the root, stem, leaf, and total biomass decreased by 46.87%, 59.40%, 56.88%, and 56.68%, and the R/S ratio increased by 17.39%.

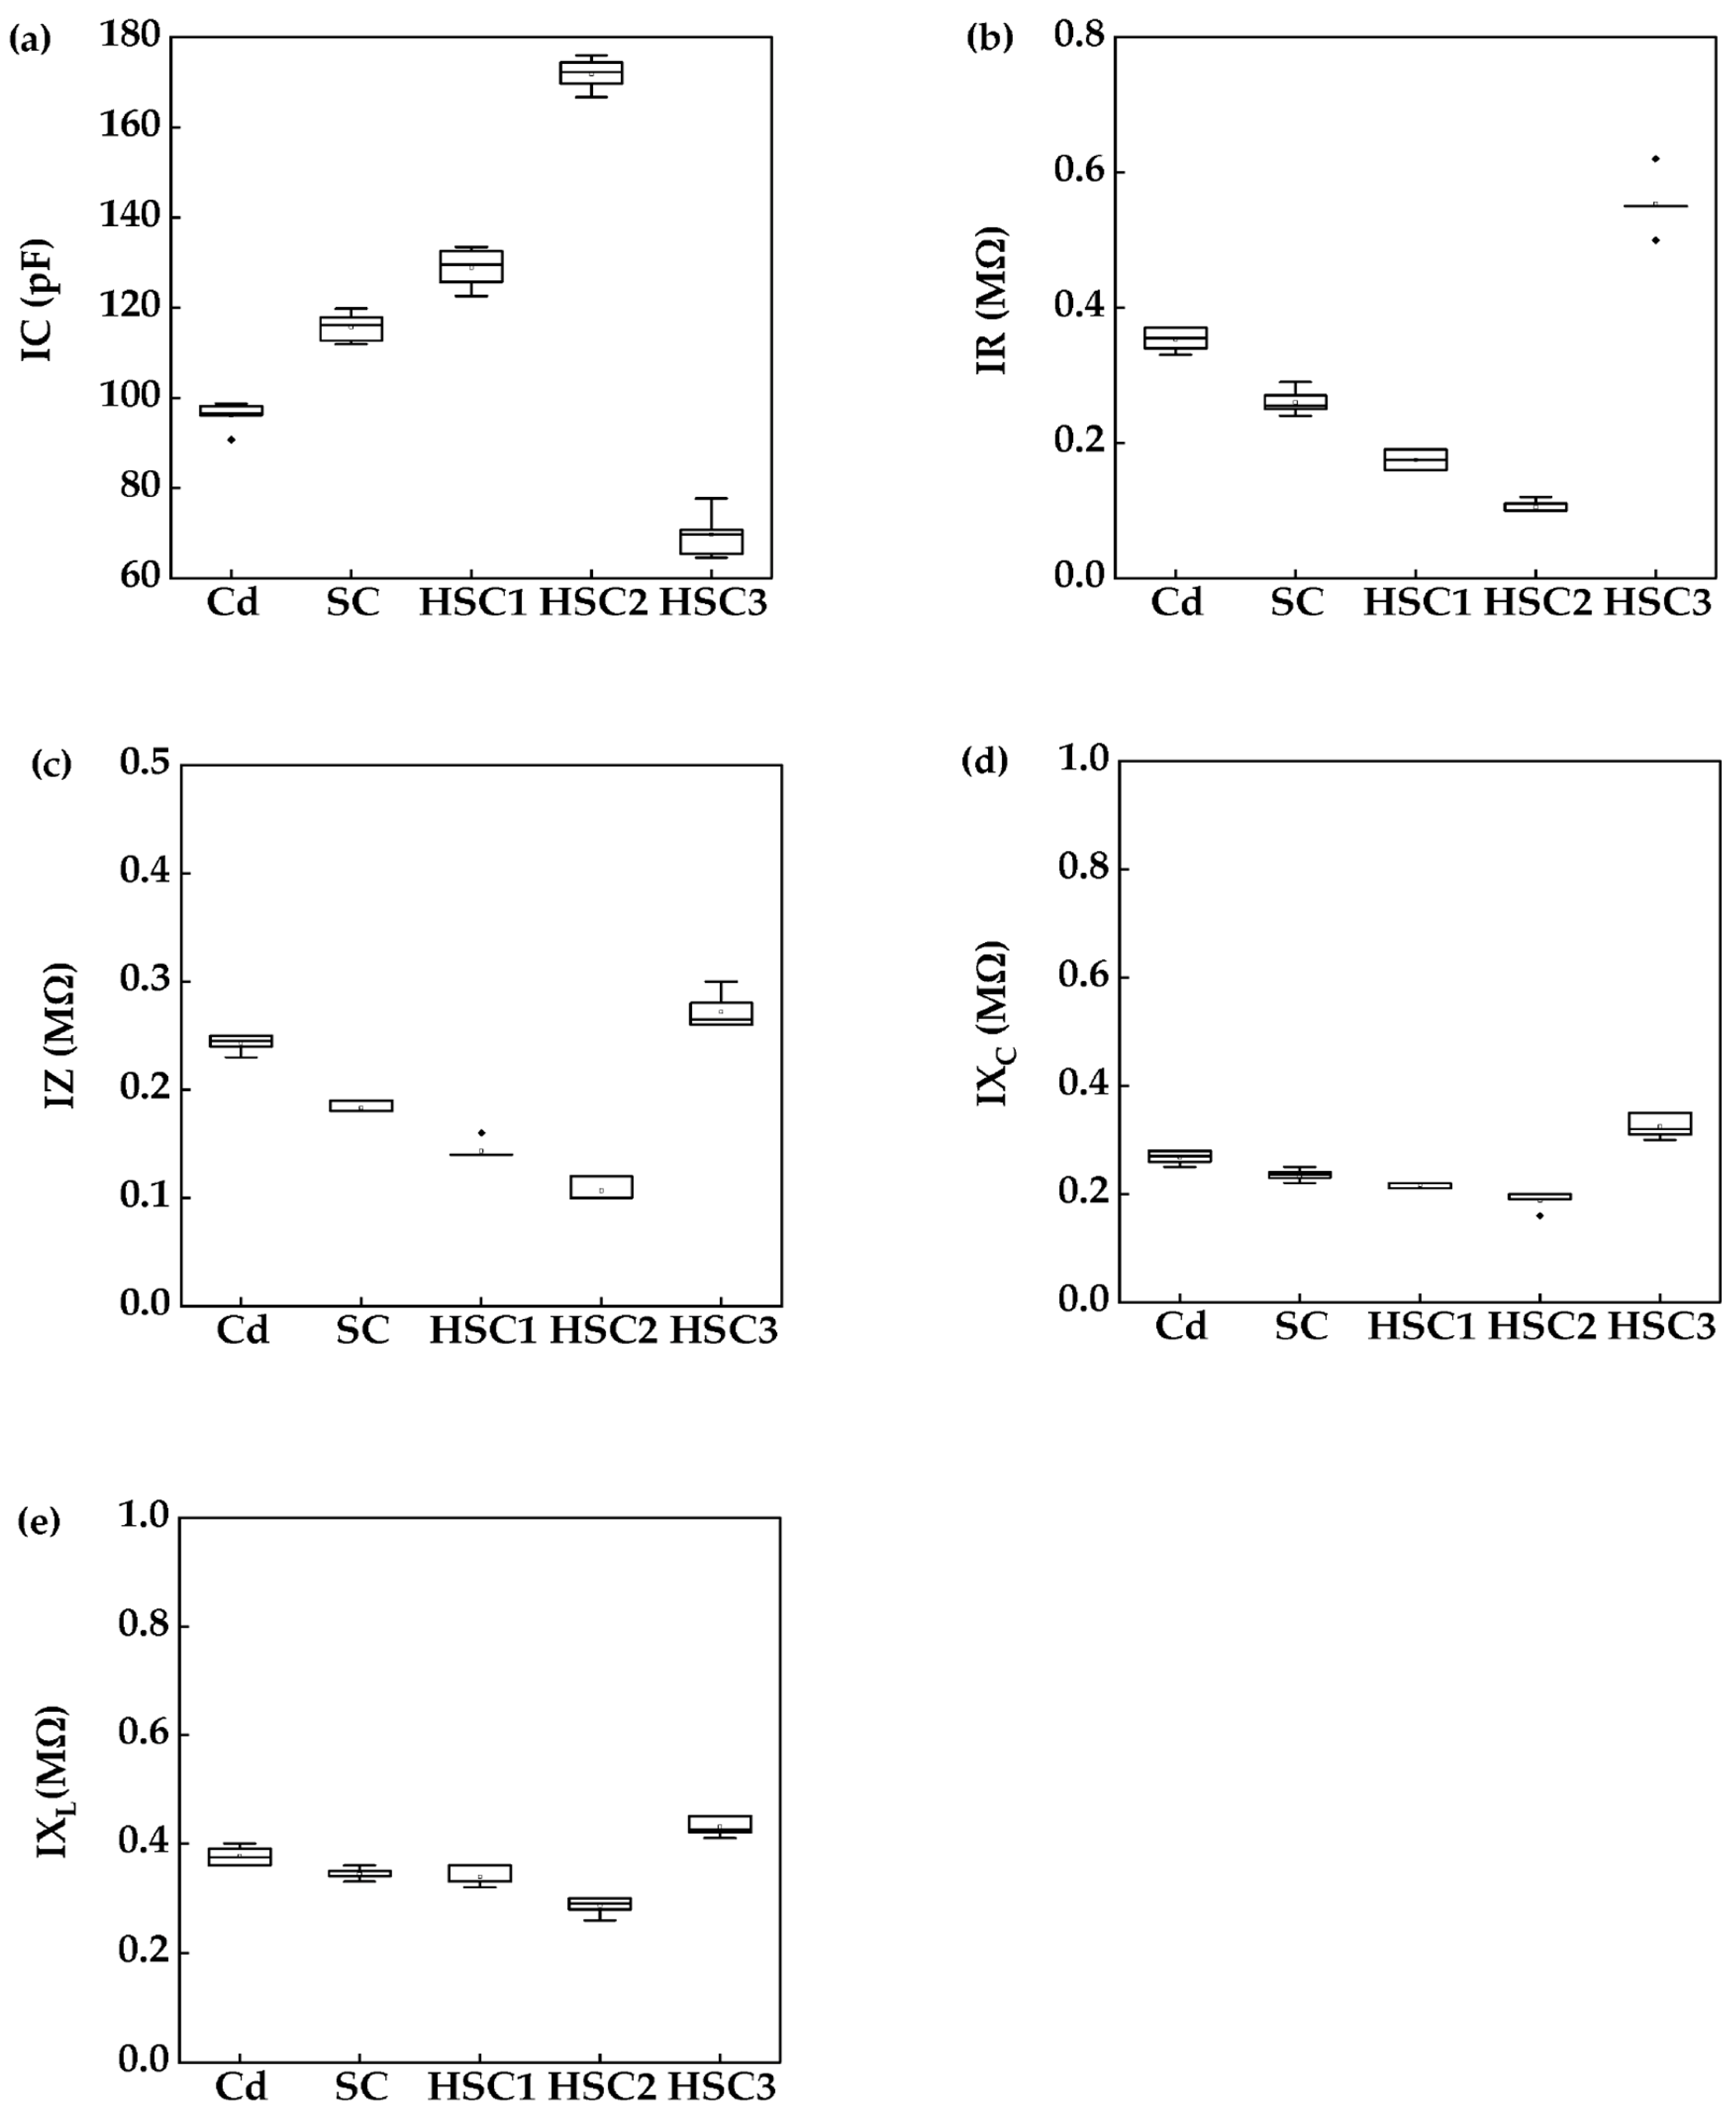
3.2. Electrophysiological Parameters of the Plants

In this study, we obtained the intrinsic electrophysiological parameters in Figure 3 (the raw data see as Table S1), which showed intrinsic capacitance (IC), resistance (IR), impedance (IZ), capacitive reactance (IXc), and inductive reactance (IXL) of Ov. It was found that Ov’s growth significantly increased at HSC1 and HSC2, with the greatest growth at HSC2. The IC of Ov was ranked as HSC2 > HSC1 > SC > Cd > HSC3, which showed the highest level at HSC2, and decreased to the lowest level at HSC3, respectively, increasing by 76.66% and decreasing by 25.49% more than the Cd treatment. However, the IR, IZ, IXc, and IXL of Ov showed opposite trends: HSC2 < HSC1 < SC < Cd < HSC3. The lowest values were observed at HSC2, and the highest value was at HSC3.

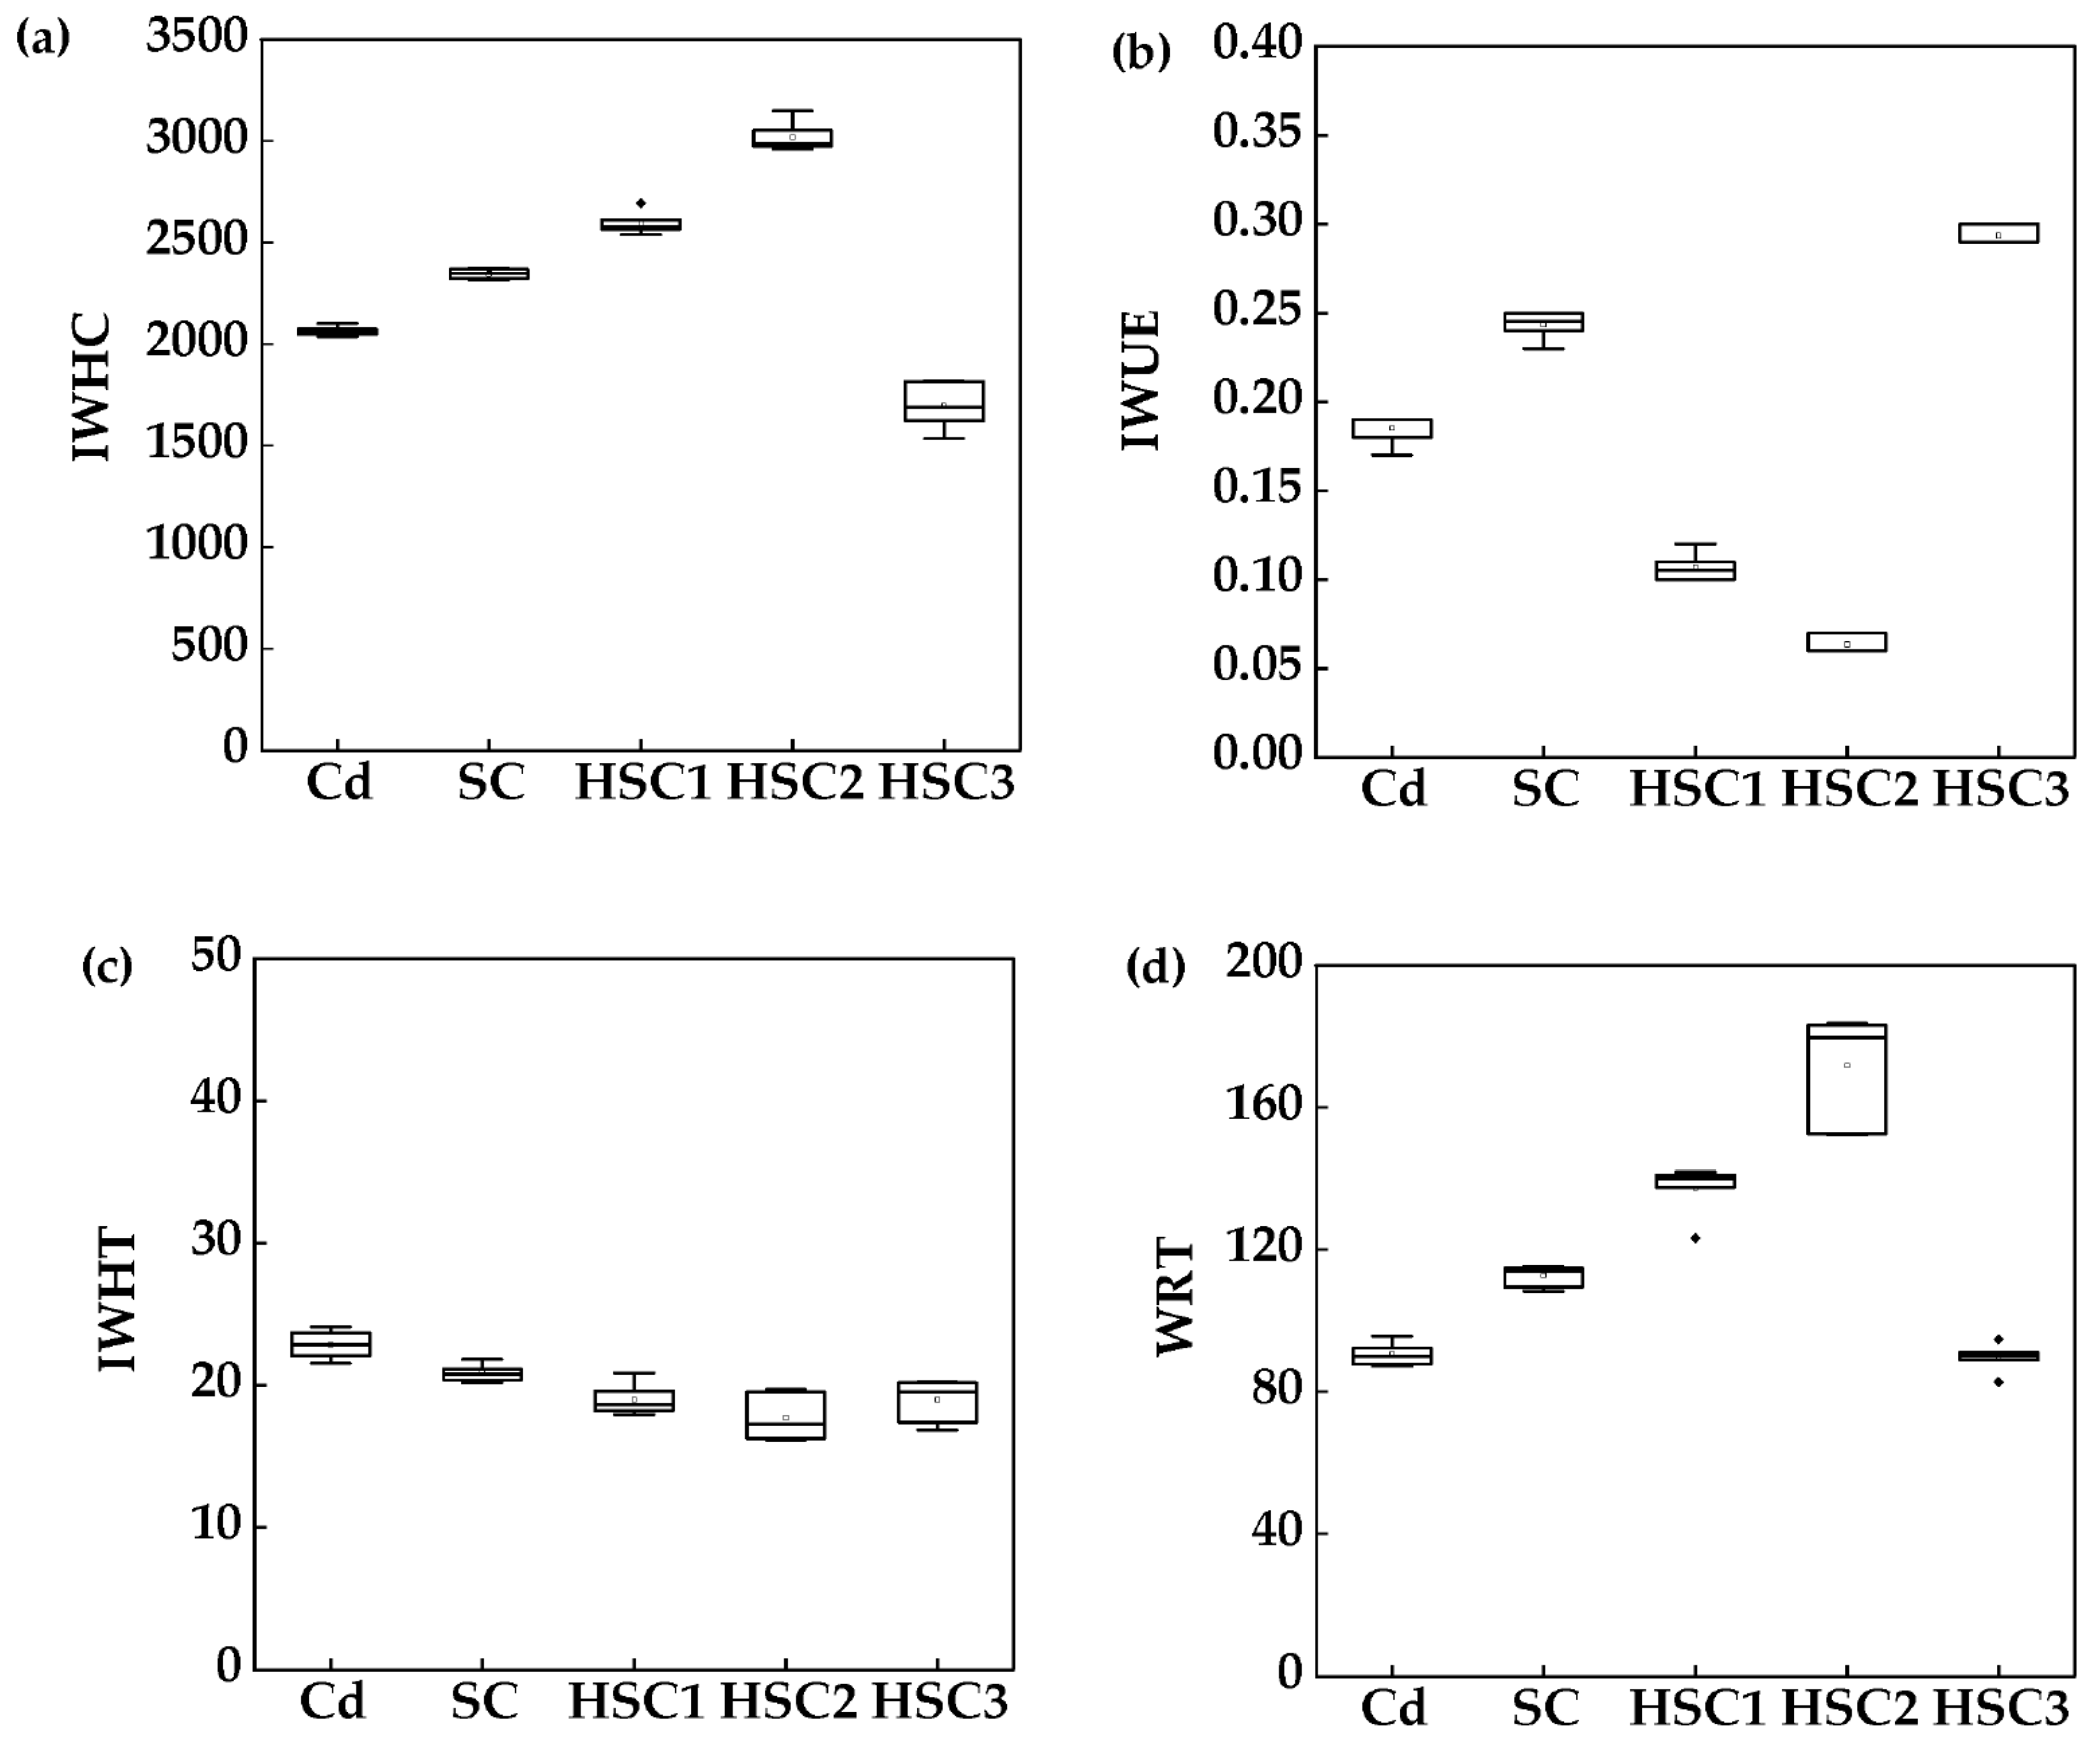
3.3. Intracellular Water Metabolism Capacity

The intracellular water metabolism capacity was calculated by the electrical signals of Ov (Figure 4, the raw data see as Table S1), involving the intracellular water-holding capacity (IWHC), intracellular water-use efficiency (IWUE), intracellular water-holding time (IWHT), and intracellular water translocation rate (WRT). Compared to the Cd group, the IWHC and WRT of Ov increased, while the IWUE and IWHT decreased at HSC1 and HSC2. Moreover, the HSC2 had an increase of 46.13% and 89.89% in IWHC and WRT, respectively, and a decrease of 66.61% and 22.64% in IWUE and IWHT, respectively. At HSC3, the IWHC decreased by 17.88%, and the IWUE increased by 56.64% compared to the group of Cd. Thus, HSC2 was promoted to the greatest level of the IWHC and WRT. In contrast, HSC3 synergistically inhibited IWHC and IWHT of Ov, but the significant increase in IWUE resulted in a stable WRT of Ov.

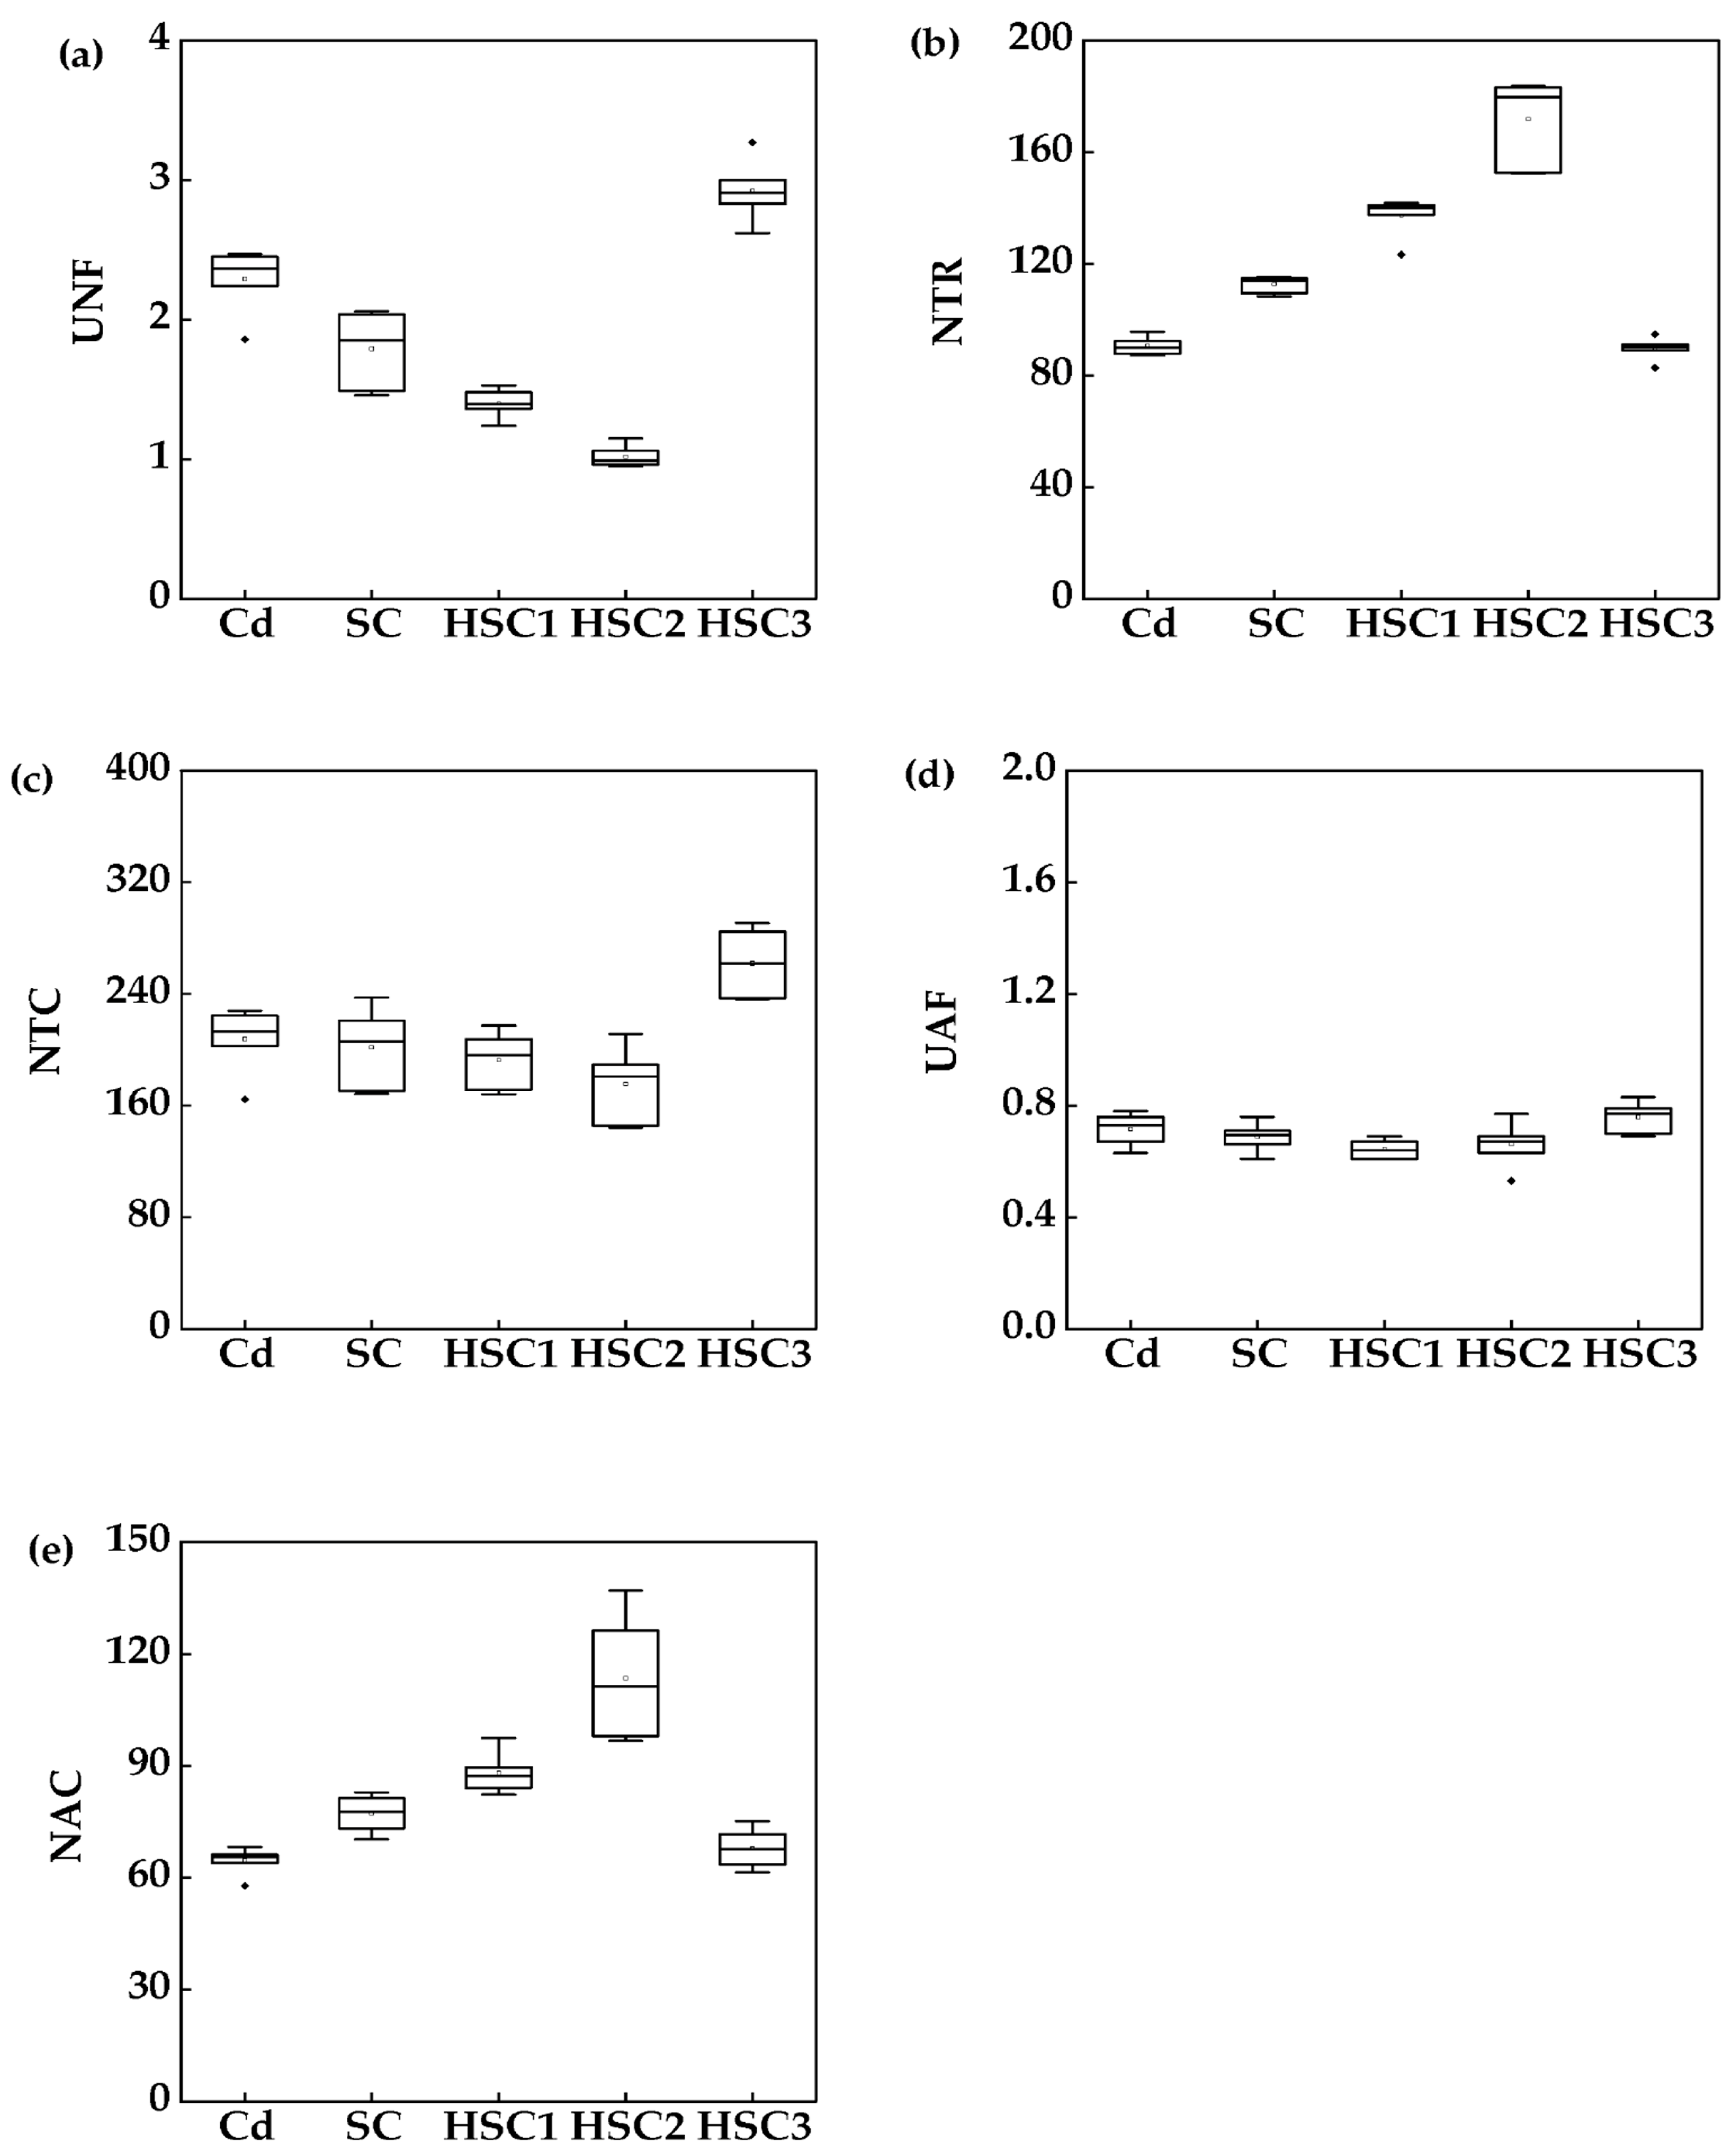
3.4. Nutrient Translocation Capacity

Relying on the electrophysiological information, we obtained the nutrient translocation capacity of Ov (Figure 5, the raw data see as Table S1), including the relative-unit translocation of nutrients (UNF), nutrient translocation rate (NTR), nutrient translocation capacity (NTC), nutrient unit active flow (UAF), and nutrient active translocation capacity (NAC). In this study, we found HSC2 obtained the highest NTR and NAC. Compared to the Cd, the NTR and NAC increased, while the UNF, NTC, and UAF decreased at HSC1 and HSC2, and the greatest changes were observed at HSC2, where the NTR and NAC increased by 89.89% and 75.87%, but the UNF, NTC, and UAF decreased by 55.66%, 15.53%, and 7.61%, respectively. At HSC3, the UNF and NTC increased by 27.43% and 26.17%, while the others did not significantly change compared to the Cd treatment.

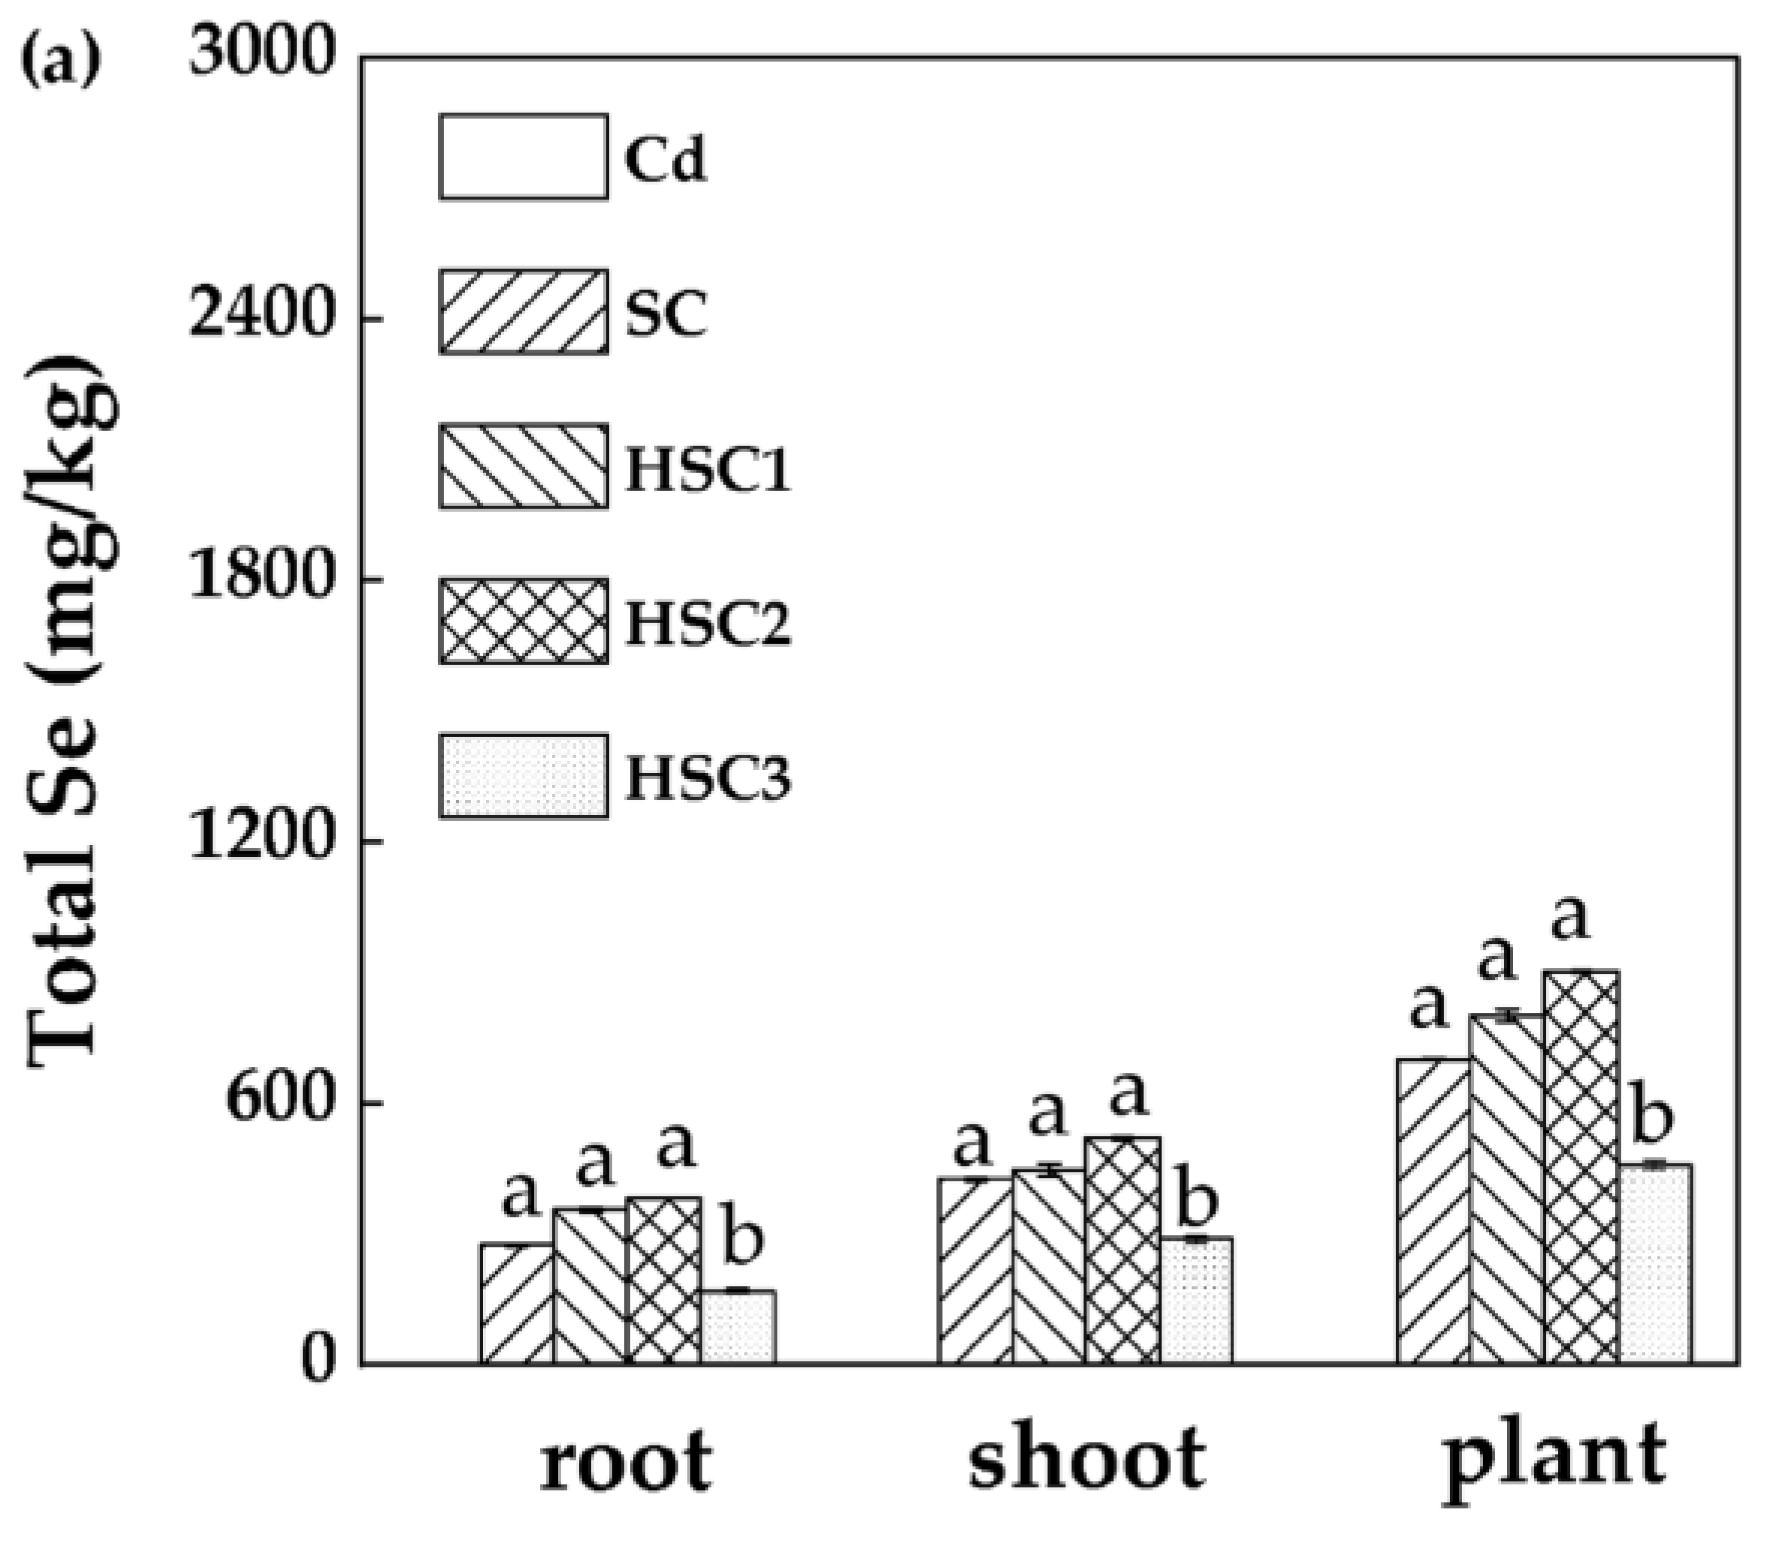
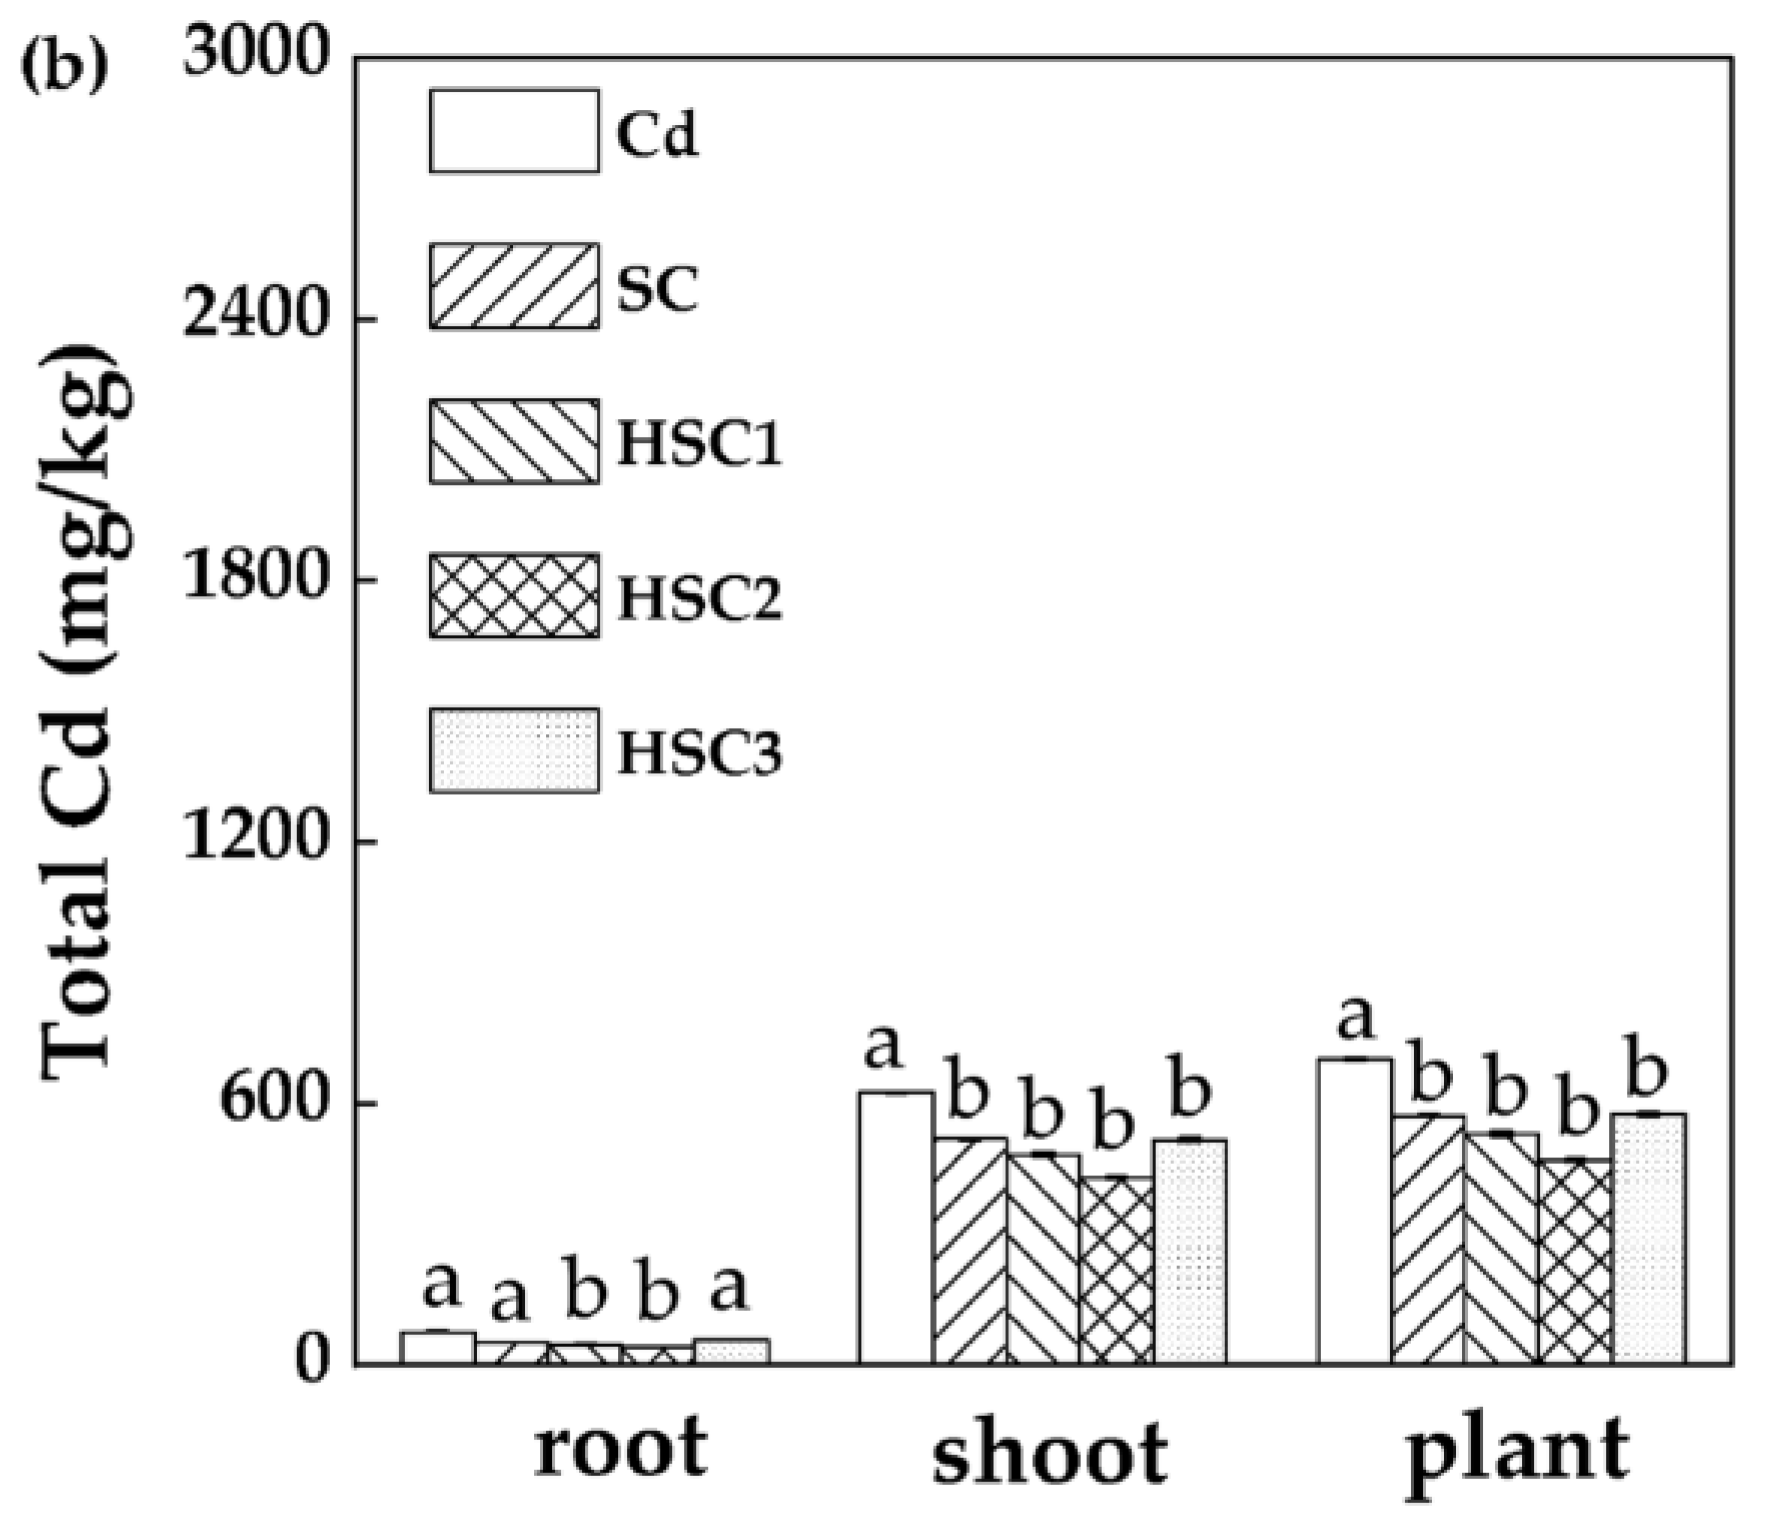
3.5. Characterization of the Selenium–Cadmium Translocation in Plants under the Influence of Bicarbonate

Figure 6 (the raw data see as Table S1) illustrates the total Se and Cd content of the root, shoot, and plant of Ov. The total Se distribution in Ov plants was higher in the root than in the shoot. The total Cd distribution was higher in the shoot than that of the root, indicating that the root was enriched in Se, while the shoot was enriched in Cd. As the HCO3 increased, the total Se content in roots, shoot, and the whole plant exhibited a trend of initially increasing and then decreasing in Ov. The HSC2 treatment resulted in the highest promotion of total Se content, while the decline of total Cd content showed that 10 mM HCO3 and 0.46 mM Se6+ promoted total Se but reduced total Cd of Ov.

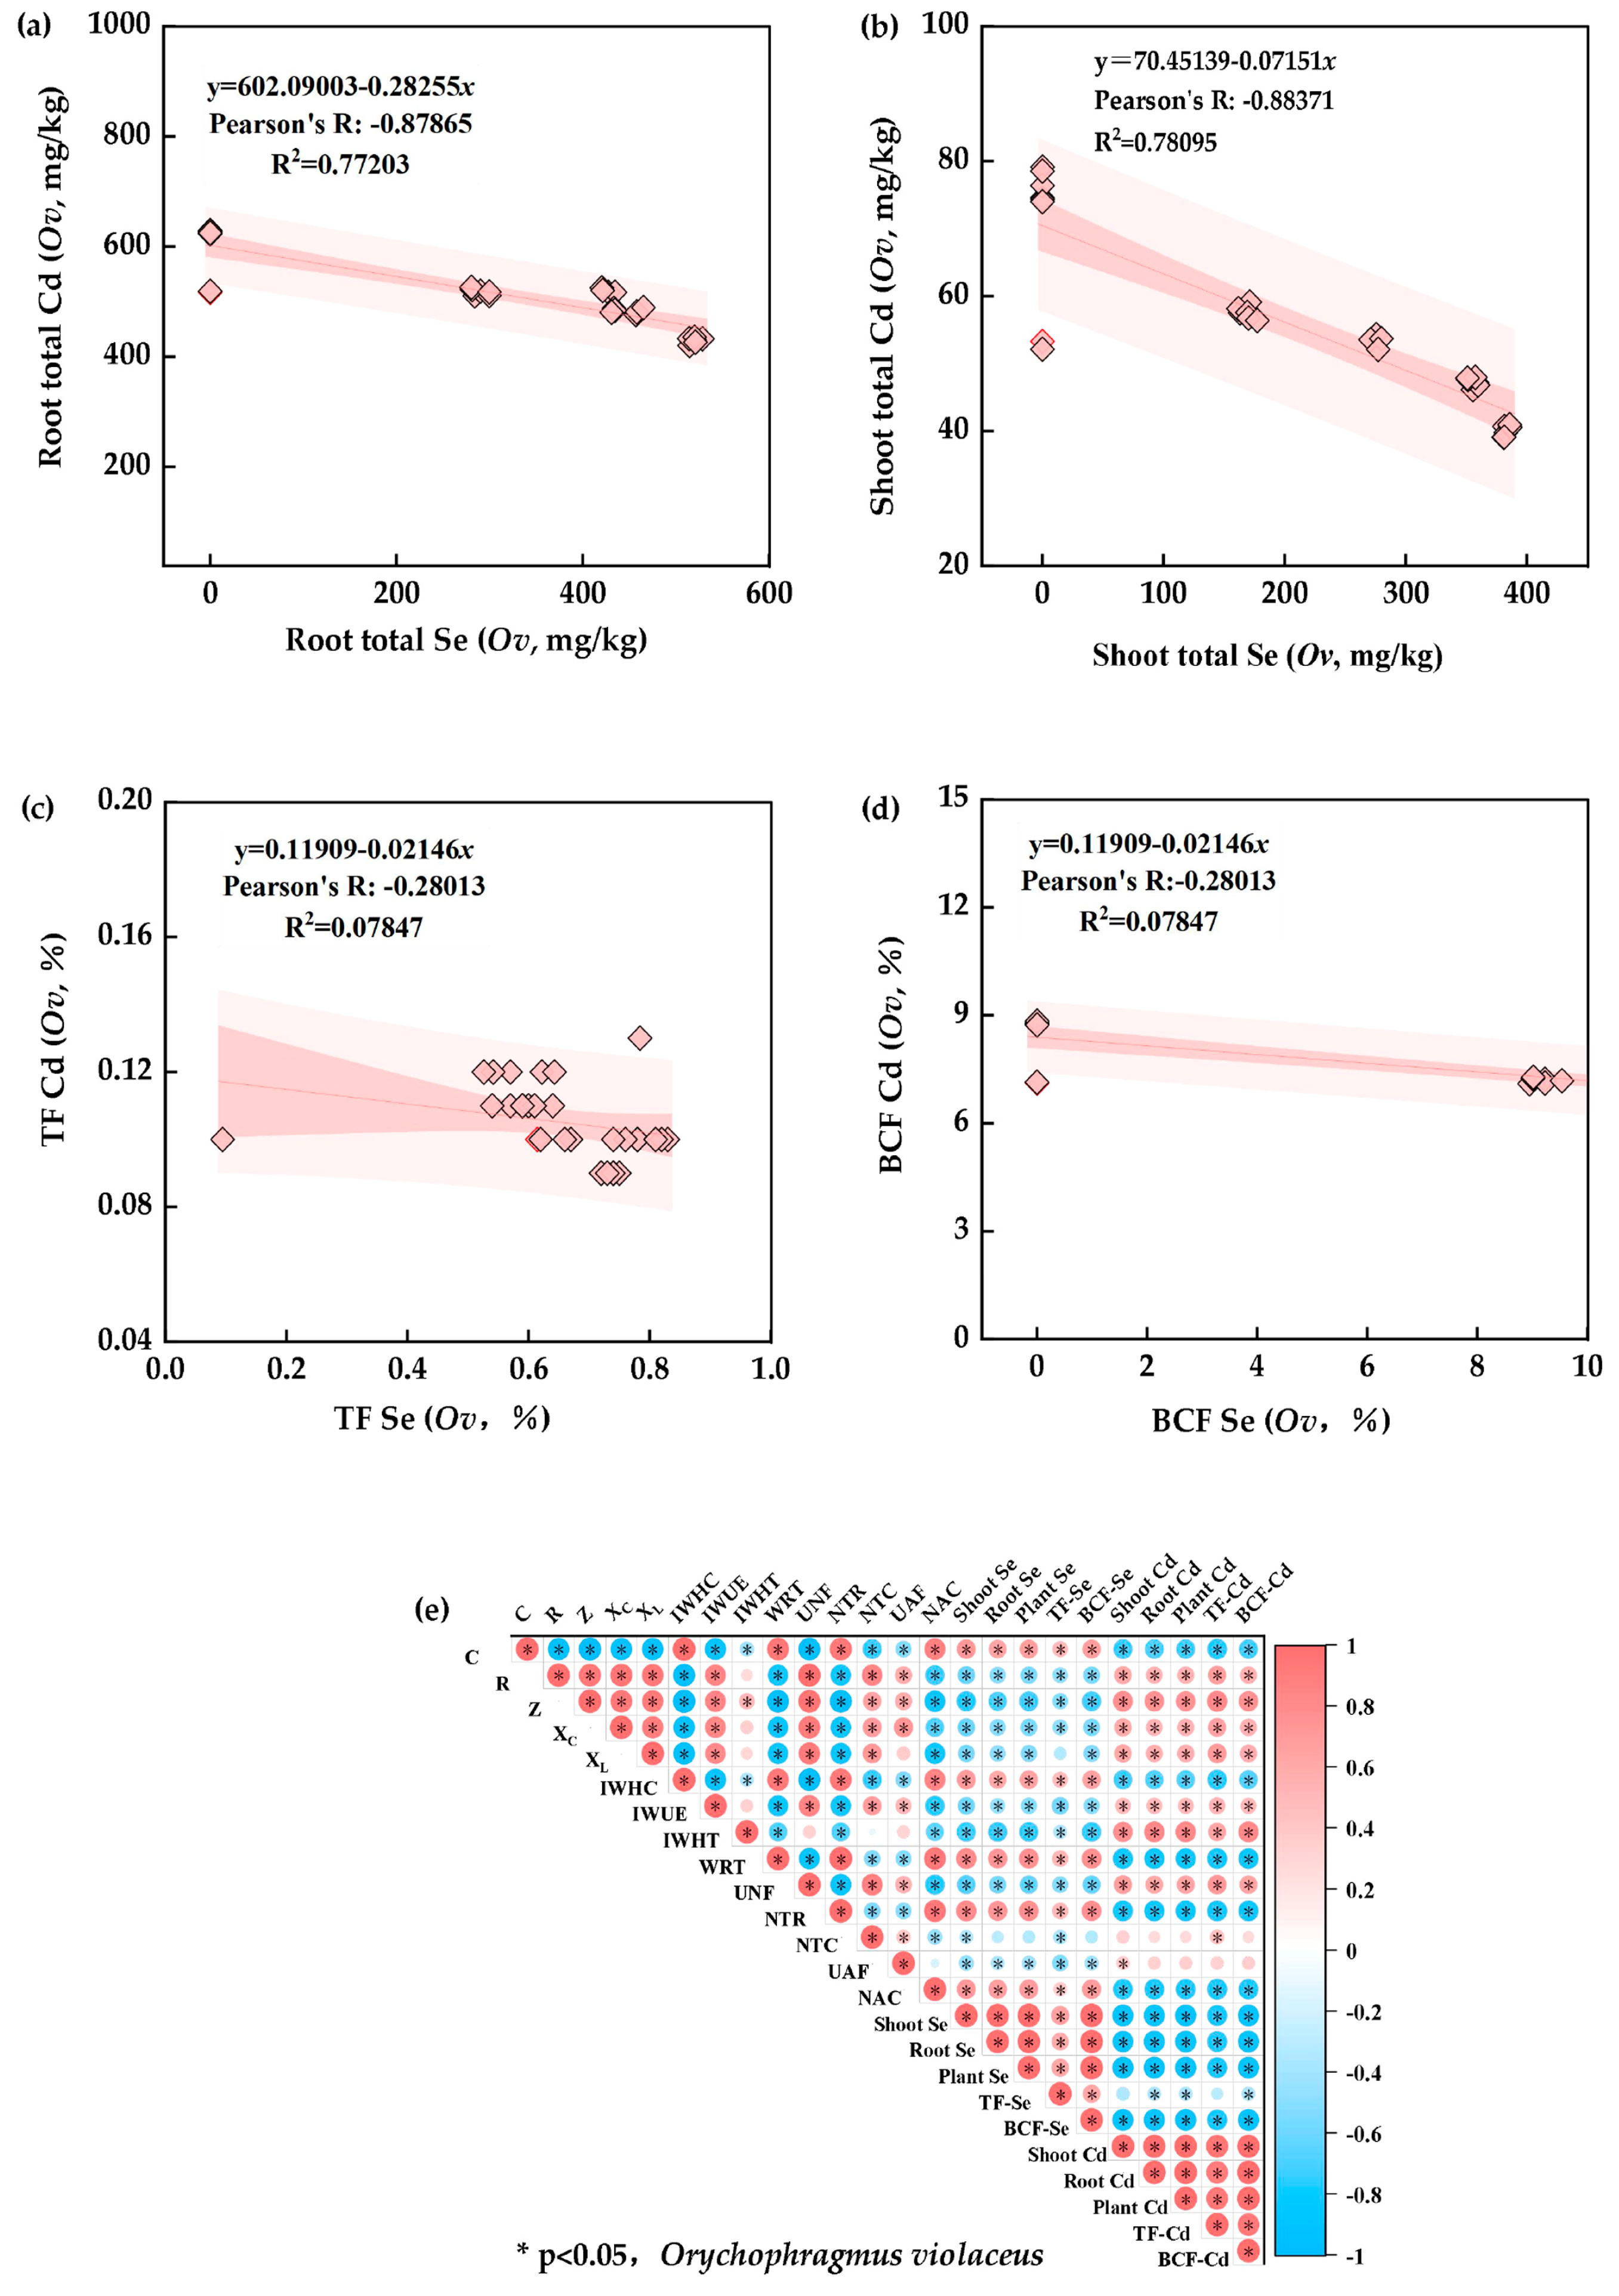
3.6. Correlation between Plant Electrical Signals and Selenium–Cadmium Translocation

In Figure 7 (the raw data see as Table S1), the TF (Se) of Ov was in the range of 0.6–0.8, while the TF (Cd) was at 0.08–0.12. Moreover, the BCF (Se) in Ov was in the range of 8–10, while the TF (Cd) was primarily in the range of 6–9, indicating a high BCF of Ov for both Se and Cd. According to the linear fits of Se and Cd in Ov, there were significant antagonistic relationships between the total Se and total Cd contents in each organ of Ov. Among them, the negative correlation coefficients between total Se and total Cd on roots and shoots were 0.77 and 0.78, respectively. However, there was no significant correlation between the translocation factors and bioconcentration factors for Se and Cd. The correlation analysis showed the C, IWHC, WRT, and NTR of Ov were significantly positively correlated with total Se, TF Se and BCF Se (p < 0.05), and significantly negatively correlated (p < 0.05) with R, Z, XC, XL, total Cd, TF Cd, and BCF Cd of Ov.

4. Discussion

4.1. Characteristics in the Electrical Signals of Ov

The metabolic functions of plants are closely intertwined with complex processes such as charge separation, ion translocation, and proton translocation. In general, the precise characterization of these processes is challenging. However, in this study, the fitting equations of clamping force (F) and plant capacitance (IC), resistance (IR), impedance (IZ), capacitive resistance (IXC), and inductive resistance (IXL) were established using electrophysiological techniques of plants, which can be used to rapidly and precisely obtain the inherent electrophysiological information of plant species [21]. Stronger plant growth capacity leads to higher growth potential and capacitance and lower resistance, impedance, capacitive, and inductive resistance [15,18]. Compared to the Cd treatment, the 5 mM HCO3 and 0.46 mM Se6+ resulted in the highest IC and the growth of Ov, but in the lowest IR, IZ, IXC, and IXL. Thus, the above HCO3 and Se6+ synergistically promoted Ov’s growth. In addition, membrane proteins and lipid composition are highly associated with plant electrophysiological information [19]. The IXC of Ov was lower than IXL, which is consistent with the fact that plant cell membrane surface proteins are lower than bound proteins. The dissolved ionic state Se and carbonate Se are bioeffective states of Se that can be used by plants [21,22]. However, heavy metal-bound Se, such as CdSe, is not bioeffective, i.e., it is not readily absorbed and used by plants [23]. Se6+ is the Se form that plants mainly utilize in an alkaline environment. Therefore, increasing Se6+ is beneficial to antagonize the uptake of Cd by Ov and alleviate the transport of Cd, increasing Ov’s growth potential [24]. In addition, under a nonabundant soil organic matter environment, the repulsion of SeO42− from anionic functional groups such as OH and HCO3 increased with increasing pH [25,26]. The adsorbed Se6+ decreased, promoting the content of bioeffective Se in the root, which might promote the formation of CdSe, leading to reduced Cd uptake by plant species [27], Therefore, the IC increased while the IR, IZ, IXC, and IXL decreased in Ov. However, HCO3 and Se6+ did not consistently promote the growth of Ov. In this study, Ov’s growth and C decreased, reaching their lowest level at 15 mM HCO3 and 0.46 mM Se6+, while IR, IZ, IXC, and IXL reached their highest values, indicating that the treatment inhibited growth of Ov. This phenomenon may be related to the peroxidation of plant cell membrane lipids caused by excess HCO3 under high Se and Cd environmental concentrations. Increased environmental salinity led to peroxidation of plant membrane lipids and increased superoxide anion production and electrolyte leakage [28], resulting in decreased IC and increased impedance (IR, IZ, IXC, and IXL) in plants. Thus, higher HCO3 of the environment led to more severe cell membrane damage and depolarization in Ov plants, resulting in more significant electrophysiological signals. Therefore, the electrophysiological information can well reflect the interactions of HCO3, Se6+, and Cd2+ on Ov’s growth, confirming its feasibility for selenium supplementation and cadmium suppression in the early planting period.

4.2. Responses of Intracellular Water Capacity by Electrical Signal Analyses in Ov

The intracellular water metabolism of plants is essential for many of their metabolic growth processes, such as photosynthesis, respiration, and nutrient translocation and metabolism [29]. However, intracellular water homeostasis is difficult to measure directly, which is attributed to two factors. On the one hand, the intracellular water metabolism accounts for only a very small fraction (about 1–5%) of the overall water metabolism of plants, and most of the water (about 95–99%) is dissipated by plant transpiration. Moreover, weighing, spectroscopy, water potential measurements, and hydrogen and oxygen stable isotope methods are commonly used to measure plant water-use efficiency [30,31]. In this study, we characterized the intracellular water metabolism based on plant electrical signals, including intracellular water-holding capacity (IWHC), intracellular water-use efficiency (IWUE), intracellular water-holding time (IWHT), and intracellular water translocation rate (WRT). Compared to the Cd treatment, 5 mM HCO3 with 0.46 Mm Se6+ promoted, to the greatest extent, the IWHC and WRT of Ov (Figure 4) (the raw data see as Table S1), indicating that bicarbonate and selenium synergistically promoted intracellular water metabolism. The cell water-holding capacity and intracellular water translocation rate of plants were significantly and positively correlated with the plant growth potential, while leaf cells with larger capacitance had a higher water and nutrient translocation capacity [30]. The uninfected Brassica napus leaves had greater C, IWHC, and WRT compared to those infected by Sclerotinia sclerotiorum, in agreement with the results of this study [18]. Such parameters in the Ov result in the greatest growth and the least impedance (Figure 3) (the raw data see as Table S1). However, the increasing bicarbonate significantly inhibited cell water-holding capacity and cell water-holding time; 15 mM HCO3 with 50 mg/L Se6+ resulted in the lowest IWHC and IWHT in Ov leaves (Figure 4). However, the water translocation rate (WRT) of Ov leaves was unchanged (Figure 4), which might be attributed to the significant increase in intracellular water-use efficiency (IWUE) and adaptive growth (Figure 4) (the raw data see as Table S1). Excessive abiotic stress in the environment increases plant cell membrane permeability; therefore, plants mitigate water loss due to cell membrane damage and ensure plant growth by rapidly increasing their intracellular water use efficiency in the short term [17]. Consequently, the higher IWUE of Ov under these conditions is also a strategy to improve water-use efficiency to cope with high external salt stress.

4.3. Nutrient Translocation Capacity as Characterized by Plant Electrical Signals

The plant cell membrane is an important barrier for maintaining cellular homeostasis and an important site for nutrient translocation in plant cells, and the cell membrane surface and the bound proteins are closely involved in nutrient translocation in plant cells [31]. Therefore, nutrient translocation capacity also reflects the composition and distribution of plant cell membrane proteins. However, most traditional methods for plant nutrient status evaluation are limited to the determination of single proteins or the ratio of total nutrients to total inputs [32]. Moreover, only a few research studies reported nutrient translocation capacity and the overall membrane protein composition. In this study, we characterized the intracellular water metabolism of Ov plants based on their electrical signals, including the nutrient relative unit translocation (UNF), nutrient translocation rate (NTR), nutrient translocation capacity (NTC), nutrient unit active flow (UAF), and nutrient active translocation capacity (NAC). Compared to the Cd treatment, 5 mM HCO3 with 0.46mM Se6+ resulted in the greatest increase in NTR and NAC, while they inhibited UNF, NTC, and UAF (Figure 5), indicating that bicarbonate and selenium synergistically promoted the nutrient translocation rate and nutrient active translocation capacity of Ov. Plant translocation of metal ions is primarily an active translocation process dependent on functional proteins and energy, while Cd is a nonessential and toxic element for plants [32,33]. Therefore, plant species block the entry of Cd into cells by localizing Cd efflux proteins such as HMA (heavy metal transporting ATPase), CAX (Cation/H+ exchanger antiporter), and ABC (ATP binding cassette) in subcellular structures such as vesicles and cytoplasmic membranes [34,35], so that both the HCO3 and Se6+ might increase the Cd efflux protein abundance, facilitating the compartmentalization of Cd2+ outside the cell membrane and increasing the nutrient active translocation capacity of Ov. In addition, plants adapt to abiotic stresses by increasing their active nutrient translocation capacity, such as rice, which adapted to drought stress by increasing nutrient translocation and water utilization [36]. Consequently, the reduced NTC and UAF suggest that Ov were more likely to preferentially allocate functional proteins to Cd excretion processes. In addition, Ov had the highest cell water-holding capacity and intracellular water translocation rate under both HCO3 and Se6+ (Figure 4) (the raw data see as Table S1), which indicated a high nutrient translocation rate and active nutrient translocation capacity of Ov. However, the NTC of Ov did not continuously increase with the increasing bicarbonate supply (Figure 5). In this study, the NTC of Ov did not change significantly under 15 mM HCO3 and 0.46 mM Se6+, even though the relative nutrient unit translocation and active nutrient unit flow exhibited a significant increase (Figure 5) (the raw data see as Table S1), which might be attributed to the high tolerance to bicarbonate of Ov. Hence, plants preferentially deploy translocation proteins and metabolic processes in response to high HCO3 and Cd2+ levels to increase their compartmentalization and enhance adaptive growth.

4.4. Effect of Bicarbonate on Selenium–Cadmium Interactions in Plants

In this study, the Se-Cd translocation of Ov showed Se bioconcentration in the roots and Cd bioconcentration in the rhizosphere regions, indicating that Cd accumulation might be restricted to the roots of Ov, thus reducing its translocation in the roots (Figure 6). In addition, there was a significant negative correlation (p < 0.05) between the total Se and total Cd content in specific Ov tissues and the whole plant under each bicarbonate treatment (Figure 7) (the raw data see as Table S1). The 5 mM HCO3 and 0.46 mM Se6+ resulted in the highest total Se and the lowest total Cd in Ov (Figure 6) (the raw data see as Table S1), indicating the most significant antagonistic relationship between Se and Cd. Moreover, the correlation analysis showed a significant positive correlation (p < 0.05) with the total Se, the TF (Se), and BCF (Se) in Ov (Figure 7) (the raw data see as Table S1). However, it showed significant negative correlations (p < 0.05) with IR, IZ, IXC, and IXL, as well as the total (Cd), the TF (Cd), and BCF (Cd) in each organ of Ov. Thus, we found high capacitance, cell water-holding capacity, water, and nutrient translocation rates, and low resistance, impedance, capacitive resistance, and inductive resistance that favored Se bioconcentration and inhibition of Cd accumulation in Ov. It has been reported that Se is a beneficial nutrient for plant growth, and the Ov promoted Se uptake by increasing physiological capacitance, intracellular water-use efficiency, and nutrient translocation capacity. In addition, the Ov plants could potentially reduce the uptake of translocated Cd and maintain their growth by increasing Cd translocation–efflux proteins in subcellular structures such as vesicles (Figure 8) (the raw data see as Table S1). However, high bicarbonate levels inhibited Ov’s growth, reduced its growth potential, intracellular water-use efficiency, and nutrient translocation capacity, increased cellular energy consumption, and reduced the production of Cd translocation–efflux proteins, so that the Ov showed a reduced uptake of Se and decreased efflux capacity of Cd (Figure 8) (the raw data see as Table S1).

5. Conclusions

Based on plant electrophysiological techniques, we found that Se6+ improved growth, intracellular water metabolism, and nutrient translocation efficiency under the Cd treatment in Ov. In addition, Se6+ and low HCO3 synergistically promoted the growth of Ov, leading to an increase in capacitance, intracellular water capacity, nutrient translocation efficiency, and total Se accumulation, as well as the excretion of Cd at 5 mM HCO3 and 0.46 mM Se6+. However, Se6+ and high HCO3 inhibited Ov’s growth, resulting in the decline of capacitance, intracellular water capacity, nutrient translocation efficiency, and total Se accumulation of Ov at 15 mM HCO3 and 0.46 mM Se6+. Hence, it provided an innovative approach to rapidly detect the intracellular water capacity and nutrient translocation efficiency of plant species, so as to precisely provide selenium to ameliorate cadmium pollution in karst areas.

Supplementary Materials

The following supporting information can be downloaded at: https://www.mdpi.com/article/10.3390/agronomy14010218/s1.

Author Contributions

A.X., Y.W., Z.Q., Y.Z., L.L., J.X. (Juyue Xiao), M.A., H.W., J.M. and J.X. (Jiqian Xiang) cooperated to complete this article. A.X.determined the experimental outline and analyzed the original data to design this article. Furthermore, Y.W. and J.X. (Jiqian Xiang) conceived and funded the research and carefully participated in guiding and revising this article. J.X. (Juyue Xiao), Z.Q., L.L.and J.M. make contributions to the culture Ov plants and experiment of this article. Y.Z., M.A. and H.W. gave some valuable suggestions when the first author revised this paper. All authors have read and agreed to the published version of the manuscript.

Funding

This work was supported by the Postdoctoral Innovative Practice Post Funding Program (Hubei Province, China, 2022–2023.in China), the Key Research and Development Project of Hubei Province (number 2022BBA0059), National Natural Science Foundation of China (number U1612441-2), and Support Plan Projects of Science and Technology of Guizhou Province (number 2021YB453) (in China).

Data Availability Statement

Data are contained within the article and Supplementary Materials.

Acknowledgments

We deeply appreciate the essential experimental platform from the Research Center for Environmental Bioscience and Technology, State Key Laboratory of Environmental Geochemistry, Institute of Geochemistry, Chinese Academy of Sciences. Furthermore, We thank Bullet Edits Limited for the linguistic editing and proofreading of the manuscript.

Conflicts of Interest

We declare that we do not have any commercial or associative interests and that represent a conflict of interest in connection with the work submitted.

References

  1. He, Y.; Zhang, Y.; Peng, C.; Wan, X.; Guo, Z.; Xiao, X. Distribution characteristics and risk assessment of heavy metals in soil and street dust with different land uses, a case in Changsha, China. Int. J. Environ. Res. Public Health 2021, 18, 10733. [Google Scholar] [CrossRef] [PubMed]
  2. Li, C.; Zhang, C.C.; Yu, T.; Liu, X.; Xia, X.; Hou, Q.; Yang, Y.; Yang, Z.; Wang, L. Annual net input fluxes of cadmium in paddy soils in karst and non-karst areas of Guangxi, China. J. Geochem. Explor. 2022, 241, 107072. [Google Scholar] [CrossRef]
  3. Schneeweiss, S.; Avorn, J. A review of uses of health care utilization databases for epidemiologic research on therapeutics. J. Clin. Epidemiol. 2005, 58, 323–337. [Google Scholar] [CrossRef] [PubMed]
  4. Soubasakou, G.; Cavoura, O.; Damikouka, I. Phytoremediation of cadmium-contaminated soils: A review of new cadmium hyperaccumulators and factors affecting their efficiency. Bull. Environ. Contam. Toxicol. 2022, 109, 783–787. [Google Scholar] [CrossRef] [PubMed]
  5. Ahmad, P.; Abdallah, E.; Hashem, A.; Sarwat, M.; Gucel, S. Exogenous application of selenium mitigates cadmium toxicity in Brassica juncea L. (Czern & Cross) by up-regulating antioxidative system and secondary metabolites. J. Plant Growth Regul. 2016, 35, 936–950. [Google Scholar] [CrossRef]
  6. Huang, Q.; Xu, Y.; Liu, Y.; Qin, X.; Huang, R.; Liang, X. Selenium application alters soil cadmium bioavailability and reduces its accumulation in rice grown in Cd-contaminated soil. Environ. Sci. Pollut. Res. Int. 2018, 25, 31175–31182. [Google Scholar] [CrossRef]
  7. Kyriaki, P.; Mertzanis, A.; Dimitris, V.; Evripides, V.; Vasileios, K. The contribution of karstic rocks to soil quality, Ioannina plain (Epirus, Hellas). J. Geochem. Explor. 2015, 154, 224–237. [Google Scholar] [CrossRef]
  8. Reza, K.; Santos, R. Natural and human-induced factors on the accumulation and migration of pedogenic carbonate in soil: A review. Land 2022, 11, 1448. [Google Scholar] [CrossRef]
  9. Dubey, S.; Shri, M.; Gupta, A.; Rani, V.; Chakrabarty, D. Toxicity and detoxification of heavy metals during plant growth and metabolism. Environ. Chem. Lett. 2018, 16, 1169–1192. [Google Scholar] [CrossRef]
  10. Koselski, M.; Wasko, P.; Derylo, K.; Tchorzewski, M.; Trebacz, K. Glutamate-induced electrical and calcium signals in the moss physcomitrella patens. Plant Cell Physiol. 2020, 61, 1807–1817. [Google Scholar] [CrossRef]
  11. Volkov, A.; Nyasani, E.; Tuckett, C.; Scott, J.; Jackson, M.; Greeman, E.; Greenidge, A.; Cohen, D.; Volkova, M.; Shtessel, Y. Electrotonic potentials in Aloe vera L.: Effects of intercellular and external electrodes arrangement. Bioelectrochemistry 2017, 113, 60–68. [Google Scholar] [CrossRef] [PubMed]
  12. Ekaterina, S.; Vladimir, S. Electrical signals, plant tolerance to actions of stressors, and programmed cell death: Is interaction possible? Plants 2021, 10, 1704. [Google Scholar] [CrossRef]
  13. Canales, J.; Henriquez, V.; Brauchi, S. The integration of electrical signals originating in the root of vascular plants. Front. Plant Sci. 2018, 8, 2173. [Google Scholar] [CrossRef] [PubMed]
  14. Xing, D.; Mao, R.; Li, Z.; Wu, Y.; Qin, X.; Fu, W. Leaf intracellular water transport rate based on physiological impedance: A possible role of leaf internal retained water in photosynthesis and growth of tomatoes. Front. Plant Sci. 2022, 13, 845628. [Google Scholar] [CrossRef] [PubMed]
  15. Novacky, A.; Karr, A.; Van, J. Using electrophysiology to study plant disease development. Bioscience 1976, 26, 499–504. [Google Scholar] [CrossRef]
  16. Kashif, A.; Wu, Y.; Chen, Q.; Qureshi, W.; Xing, D.; Mazhar, H.; Sher, A. The differential responses of Aegiceras corniculatum and Kandelia candel under salt stress and re-watering phase. A study of leaf electrophysiological and growth parameters. J. Plant Interact. 2021, 16, 307–320. [Google Scholar] [CrossRef]
  17. Xie, J.; Wu, Y.; Xing, D.; Li, Z.; Chen, T.; Duan, R.; Zhu, X. A comparative study on the circadian rhythm of the electrical signals of Broussonetia papyrifera and Morus alba. Plant Signal Behav. 2021, 16, 1950899. [Google Scholar] [CrossRef]
  18. Xing, D.; Chen, X.; Wu, Y.; Xu, X.; Chen, Q.; Li, L.; Zhang, C. Rapid prediction of the re-watering time point of Orychophragmus violaceus L. based on the online monitoring of electrophysiological indexes. Sci. Hortic. 2019, 256, 108642. [Google Scholar] [CrossRef]
  19. Palmer, C.; Warwick, S.; Keller, W. Brassicaceae (Cruciferae) family, plant biotechnology, and phytoremediation. Int. J. Phytoremediation 2001, 3, 245–287. [Google Scholar] [CrossRef]
  20. Kovács, Z.; Soós, Á.; Kovács, B.; Kaszás, L.; Elhawat, N.; Bákonyi, N.; Razem, M.; Fári, M.; Prokisch, J.; Domokos, S.; et al. Uptake dynamics of ionic and elemental selenium forms and their metabolism in multiple-harvested alfalfa (Medicago sativa L.). Plants 2021, 10, 1277. [Google Scholar] [CrossRef]
  21. Kong, W.; Hou, X.; Wei, L.; Chen, W.; Liu, J.; Schnoor, J.; Jiang, G. Accumulation, translocation, and transformation of two CdSe/ZnS quantum dots in rice and pumpkin plants. Sci. Total Environ. 2023, 864, 161156. [Google Scholar] [CrossRef] [PubMed]
  22. Zhao, Y.; Hu, C.; Wu, Z.; Liu, X.; Cai, M.; Jia, W.; Zhao, X. Selenium reduces cadmium accumulation in seed by increasing cadmium retention in root of oilseed rape (Brassica napus L.). Environ. Exp. Bot. 2019, 158, 161–170. [Google Scholar] [CrossRef]
  23. Grybos, M.; Davranche, M.; Gruau, G.; Petitjean, P.; Pédrot, M. Increasing pH drives organic matter solubilization from wetland soils under reducing conditions. Geoderma 2009, 154, 13–19. [Google Scholar] [CrossRef]
  24. Wang, F.; Wang, X.; Chen, Q.; Song, N. Extension of a biotic ligand model for predicting the toxicity of metalloid selenate to wheat: The effects of pH, phosphate and sulphate. Chemosphere 2021, 264, 128424. [Google Scholar] [CrossRef] [PubMed]
  25. Camara, A.; Wan, Y.; Yu, Y.; Wang, Q.; Li, H. Effect of selenium on uptake and translocation of arsenic in rice seedlings (Oryza sativa L.). Ecotox. Environ. Saf. 2018, 148, 869–875. [Google Scholar] [CrossRef]
  26. Sakouhi, L.; Mahjoubi, Y.; Labben, A.; Kharbech, O.; Chaoui, A.; Djebali, W. Effects of cadmium-selenium interaction on glyoxalase and antioxidant systems of pisum sativum germinating seeds. J. Plant Growth Regul. 2022, 42, 3084–3099. [Google Scholar] [CrossRef]
  27. Chrispeels, M.; Crawford, N.; Schroeder, J. Proteins for transport of water and mineral nutrients across the membranes of plant cells. Plant Cell 1999, 11, 661. [Google Scholar] [CrossRef]
  28. Ghosh, U.; Chatterjee, A.; Bremer, E. Determining the moisture and plant effect on nutrient release, and plant nutrient uptake using ion exchange resin membrane. Commun. Soil Sci. Plant Anal. 2018, 49, 782–790. [Google Scholar] [CrossRef]
  29. Dadmohammadi, Y.; Datta, A. Prediction of effective moisture diffusivity in plant tissue food materials over extended moisture range. Dry. Technol. 2019, 38, 1–15. [Google Scholar] [CrossRef]
  30. Li, H.; Lv, J.; Su, Y.; Wu, Y. Appropriate sodium bicarbonate concentration enhances the intracellular water metabolism, nutrient transport and photosynthesis capacities of Coix Iacryma-jobi L. Agronomy 2023, 13, 1790–1804. [Google Scholar] [CrossRef]
  31. Dreyer, I. Nutrient cycling is an important mechanism for homeostasis in plant cells. Plant Physiol. 2021, 187, 2246–2261. [Google Scholar] [CrossRef] [PubMed]
  32. Rasheed, F.; Markgren, J.; Hedenqvist, M.; Johansson, E. Modeling to understand plant protein structure-function relationships-implications for seed storage proteins. Molecules 2020, 25, 873. [Google Scholar] [CrossRef] [PubMed]
  33. Decaroli, M.; Furini, A.; Dalcorso, G.; Rojas, M.; Di, S. Endomembrane reorganization induced by heavy metals. Plants 2020, 9, 482. [Google Scholar] [CrossRef] [PubMed]
  34. Tang, Z.; Wang, H.; Chen, J.; Chang, J.; Zhao, F. Molecular mechanisms underlying the toxicity and detoxification of trace metals and metalloids in plants. J. Integr. Plant Biol. 2023, 65, 570–593. [Google Scholar] [CrossRef]
  35. Li, D.; He, T.; Saleem, M.; He, G. Metalloprotein-specific or critical amino acid residues: Perspectives on plant-precise detoxification and recognition mechanisms under cadmium stress. Int. J. Mol. Sci. 2022, 23, 1734. [Google Scholar] [CrossRef]
  36. Miyoshi, Y.; Soma, F.; Yin, Y.; Nobuo, S.; Enomoto, K.; Nagao, Y.; Yamaguchi, M.; Kawachi, N.; Yoshida, E.; Tashima, H.; et al. Rice immediately adapts the dynamics of photosynthates translocation to roots in response to changes in soil water environment. Front. Plant Sci. 2023, 13, 1024144. [Google Scholar] [CrossRef]
Figure 1. Measurement of electrophysiological information of Ov. Ov-Orychophragmusviolaceus, 1—holder, 2—plastic rod, 3—bench hold, 4—iron block, 5—electrical conductor, 6—cystosepiment, and 7—plate electrode.
Agronomy 14 00218 g001
Figure 2. The growth status of Ov under bicarbonate–selenium–cadmium treatment. Ov-Orychophragmus violaceus, the ratio of Se6+ and Cd2+ of Hogland solution was 0.46 mM:0.27 mM under various bicarbonate treatments. Cd-CdSO4 (0.27 mM); SC-Na2Se2O4:CdSO4 (0.46 mM:0.27 mM); HSC1-HCO3:Se6+:Cd2+ (1 mM:0.46 mM:0.27 mM); HSC2-HCO3:Se6+:Cd2+ (5 mM:0.46 mM:0.27 mM); and HSC3-HCO3:Se6+:Cd2+ (15 mM:0.46 mM:0.27 mM).
Agronomy 14 00218 g002
Figure 3. The electrophysiological information of Ov, (a) IC-intrinsic capacitance, (b) IR-intrinsic resistance, (c) IZ-intrinsic impedance, (d) IXc-intrinsic capacitive reactance, and (e) IXL-inductive reactance. Cd-CdSO4 (0.27 mM); SC-Na2Se2O4:CdSO4 (0.46 mM:0.27 mM); HSC1-HCO3:Se6+:Cd2+ (1 mM:0.46 mM:0.27 mM); HSC2-HCO3:Se6+:Cd2+ (5 mM:0.46 mM:0.27 mM); and HSC3-HCO3:Se6+:Cd2+ (15 mM:0.46 mM:0.27 mM).
Agronomy 14 00218 g003
Figure 4. The intracellular water metabolism capacity of Ov. Ov-Orychophragmus violaceus, (a) IWHC-intracellular water-holding capacity, (b) IWUE-intracellular water-use efficiency, (c) IWHT-intracellular water-holding time, (d) WRT-water rate translocation. Cd-CdSO4 (0.2 mM); SC-Na2Se2O4:CdSO4 (0.46 mM:0.27 mM); HSC1-HCO3:Se6+:Cd2+ (1 mM:0.46 mM:0.27 mM); HSC2-HCO3:Se6+:Cd2+ (5 mM:0.46 mM:0.27 mM); and HSC3-HCO3:Se6+:Cd2+ (15 mM:0.46 mM:0.27 mM).
Agronomy 14 00218 g004
Figure 5. The nutrient transport capacity of cells in Ov. Ov-Orychophragmus violaceus, (a) UNF-Unit translocation of nutrients. (b) NTR-nutrient translocation rate, (c) NTC-nutrient translocation capacity, (d) UAF-nutrient active flow, (e) NAC-nutrient active translocation capacity. Cd-CdSO4 (0.27 mM); SC-Na2Se2O4:CdSO4 (0.46 mM:0.27 mM); HSC1-HCO3:Se6+:Cd2+ (1 mM:0.46 mM:0.27 mM); HSC2-HCO3:Se6+:Cd2+ (5 mM:0.46 mM:0.27 mM); and HSC3-HCO3:Se6+:Cd2+ (15 mM:0.46 mM:0.27 mM).
Agronomy 14 00218 g005
Figure 6. The total cadmium (Cd) content and total selenium (Se) content for selenium and cadmium under different bicarbonate levels of Ov. (a) Total cadmium content, (b) Total selenium content. Ov Orychophragmus violaceus, Cd-CdSO4 (0.27 mM); SC-Na2Se2O4:CdSO4 (0.46 mM:0.27 mM; HSC1-HCO3:Se6+:Cd2+ (1 mM:0.46 mM:0.27 mM); HSC2-HCO3:Se6+:Cd2+ (5 mM:0.46 mM:0.27 mM); and HSC3-HCO3:Se6+:Cd2+ (15 mM:0.46 mM:0.27 mM). Each value represents the mean ± SD (n = 3), and diverse letters in each value are significantly different by ANOVA (p < 0.05).
Agronomy 14 00218 g006aAgronomy 14 00218 g006b
Figure 7. The correlation analysis of Ov. (a) Correlation between total cadmium (Cd) and selenium content of root, (b) correlation between total cadmium (Cd) and selenium content of shoot, (c) translocation factor (TF) between total cadmium (Cd) and selenium content, (d) bioconcentration factor (BCF) between total cadmium (Cd) and selenium content, (e) correlation analysis of the electrophysiology, the intracellular water metabolism, nutrient translocation, and Se-Cd translocation of Ov. Ov Orychophragmus violaceus, Cd-CdSO4 (0.2 mM); SC-Na2Se2O4:CdSO4 (0.46 mM:0.27 mM; HSC1-HCO3:Se6+:Cd2+ (1 mM:0.46 mM:0.27 mM); HSC2-HCO3:Se6+:Cd2+ (5 mM:0.46 mM:0.27 mM); HSC3-HCO3:Se6+:Cd2+ (15 mM:0.46 mM:0.27 mM).“*“ means the p value of the correlation was less than 0.05.
Agronomy 14 00218 g007
Figure 8. The Synergistic effect of bicarbonate–selenium on cadmium transport of Ov. ↑: Increase, ↓: Decrease. The blue, green, yellow, purple, and red arrows represent different bicarbonate treatments at groups of Cd, SC, HSC1, HSC2, and HSC3. Cd-CdSO4 (0.2 mM); SC-Na2Se2O4:CdSO4 (0.46 mM:0.27 mM; HSC1-HCO3:Se6+:Cd2+ (1 mM:0.46 mM:0.27 mM); HSC2-HCO3:Se6+:Cd2+ (5 mM:0.46 mM:0.27 mM); HSC3-HCO3:Se6+:Cd2+ (15 mM:0.46 mM:0.27 mM). C-capacitance, R-resistance, Z-impedance, Xc-capacitive reactance, XL-reactance, IWHC-water-holding capacity, IWUE-intracellular water-use efficiency, IWHT-intracellular water-holding time, WRT-water rate translocation, UNF-Unit translocation of nutrients. NTR-nutrient translocation rate, NTC-nutrient translocation capacity, UAF-nutrient active flow, NAC-nutrient active translocation capacity.
Agronomy 14 00218 g008
Table 1. Bicarbonate–selenium–cadmium treatment.
TreatmentReagentSubstance Content
HCO3NaHCO31/5/15 mM
Se6+Na2Se2O40.46 mM
Cd2+CdSO40.27 mM
CdCd2+0.27 mM
SCSe6+:Cd2+0.46 mM:0.27 mM
HSC1HCO3:Se6+:Cd2+1 mM:0.46 mM:0.27 mM
HSC2HCO3:Se6+:Cd2+5 mM:0.46 mM:0.27 mM
HSC3HCO3:Se6+:Cd2+15 mM:0.46 mM:0.27 mM
pHKOH7.9 ± 0.35
Table 2. The growth status of Ov under bicarbonate–selenium–cadmium treatment.
TreatmentRoot
Dw, mg/Plant
Stem
Dw, mg/Plant
Leaves
Dw, mg/Plant
Plant
Dw, mg/Plant
Root/Shoot Ratio
R/S, %
Cd70.85 ± 7.83 b119.92 ± 10.23 c138.53 ± 10.76 d329.3 ± 16.86 d27.48 ± 3.31 a
SC76.71 ± 4.88 b148.51 ± 6.14 b190.87 ± 4.31 c416.08 ± 12.24 c22.6 ± 1.29 c
HSC1117.42 ± 10.93 a213.5 ± 6.78 a278.99 ± 8.56 b609.91 ± 14.56 b23.87 ± 2.44 b
HSC2129.2 ± 5.68 a222.75 ± 8.46 a333.3 ± 10.13 a685.25 ± 18.47 a23.24 ± 0.95 b
HSC337.64 ± 6.85 c60.3 ± 6.74 d82.3 ± 3.22 e180.24 ± 7.96 e26.53 ± 5.47 a
Each value represents the mean ± SD (n = 3), and diverse letters in each value are significantly different by ANOVA (p < 0.05).
Disclaimer/Publisher’s Note: The statements, opinions and data contained in all publications are solely those of the individual author(s) and contributor(s) and not of MDPI and/or the editor(s). MDPI and/or the editor(s) disclaim responsibility for any injury to people or property resulting from any ideas, methods, instructions or products referred to in the content.

