
A Comprehensive Review of Optical and AI-Based Approaches for Plant Growth Assessment

 , ,
, ,  ,
,  and
and 
Abstract
1. Introduction
- 1.
- What characteristics have been achieved in the development of methods for measuring plant growth?
- 2.
- What are the main data and image processing techniques for plant growth measurement?
- 3.
- How do artificial vision and optics contribute to the identification of plant growth measurements?
- 4.
- Which sectors show the most significant advances or potential in the use of artificial vision and optics in plant growth?
- 5.
- What are the main challenges to be addressed in the area of plant biology and horticulture from the use of artificial vision and optical techniques in the future society?
2. Background Knowledge and Key Concepts
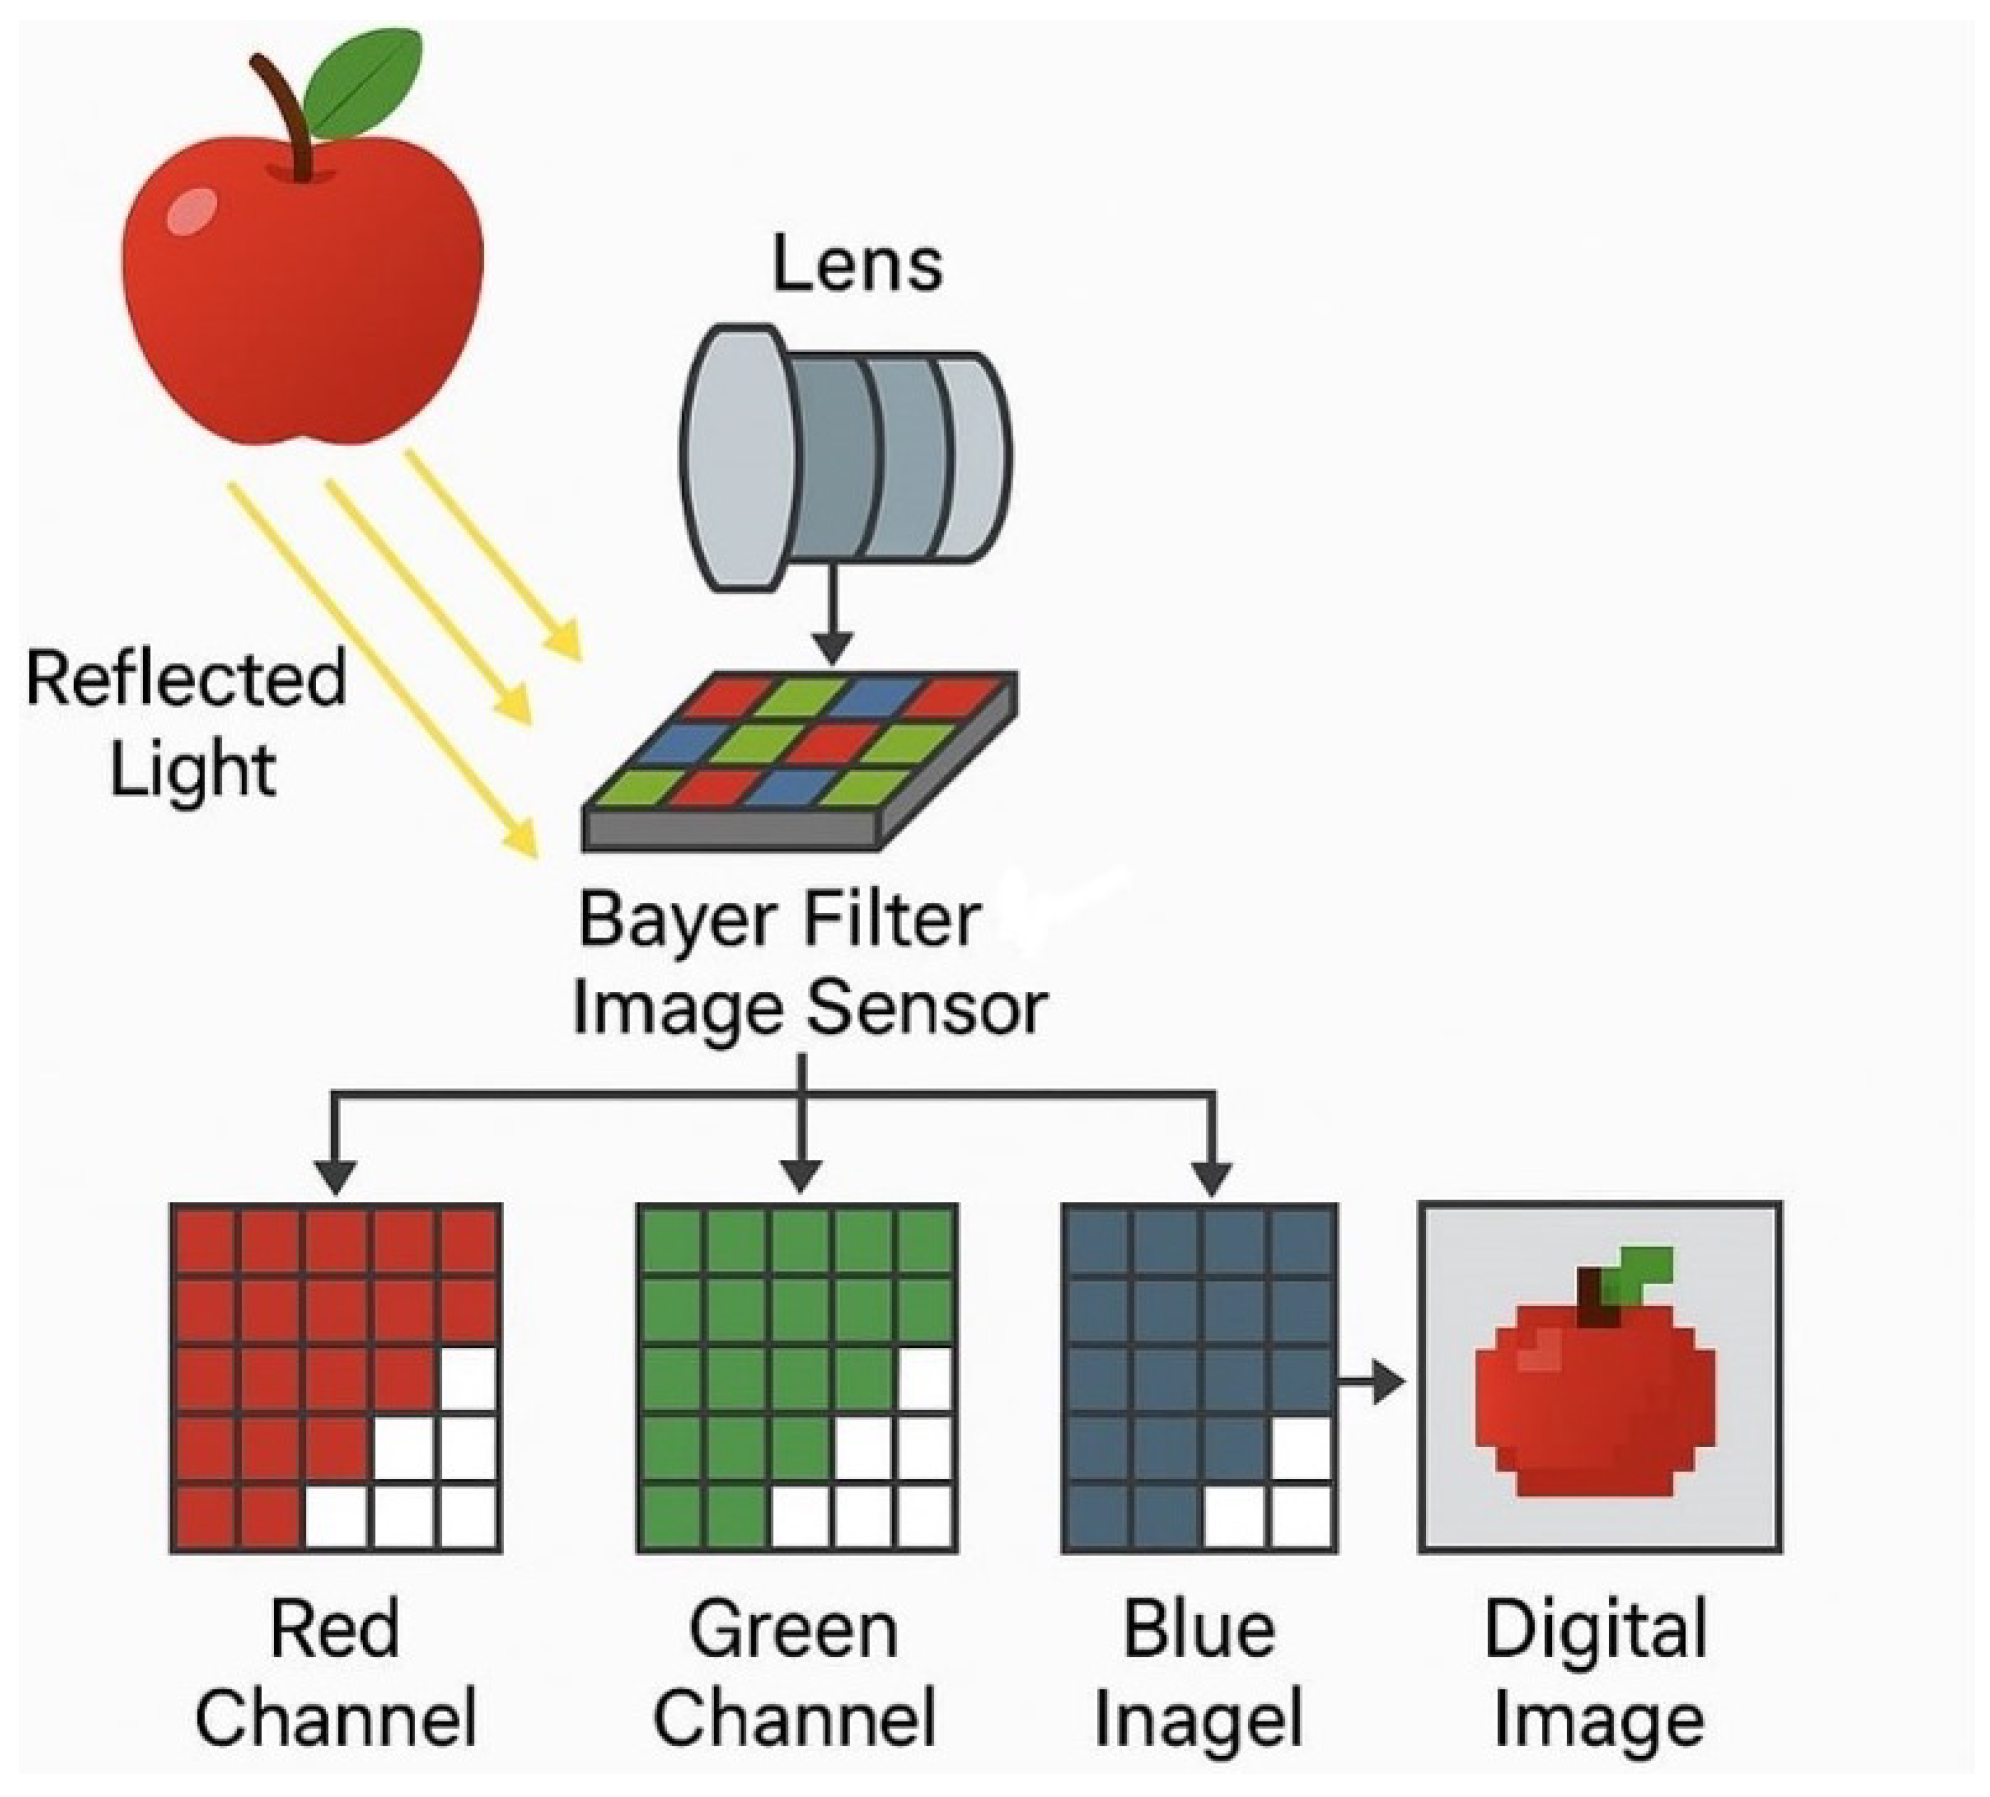
2.1. RGB Optical Sensors
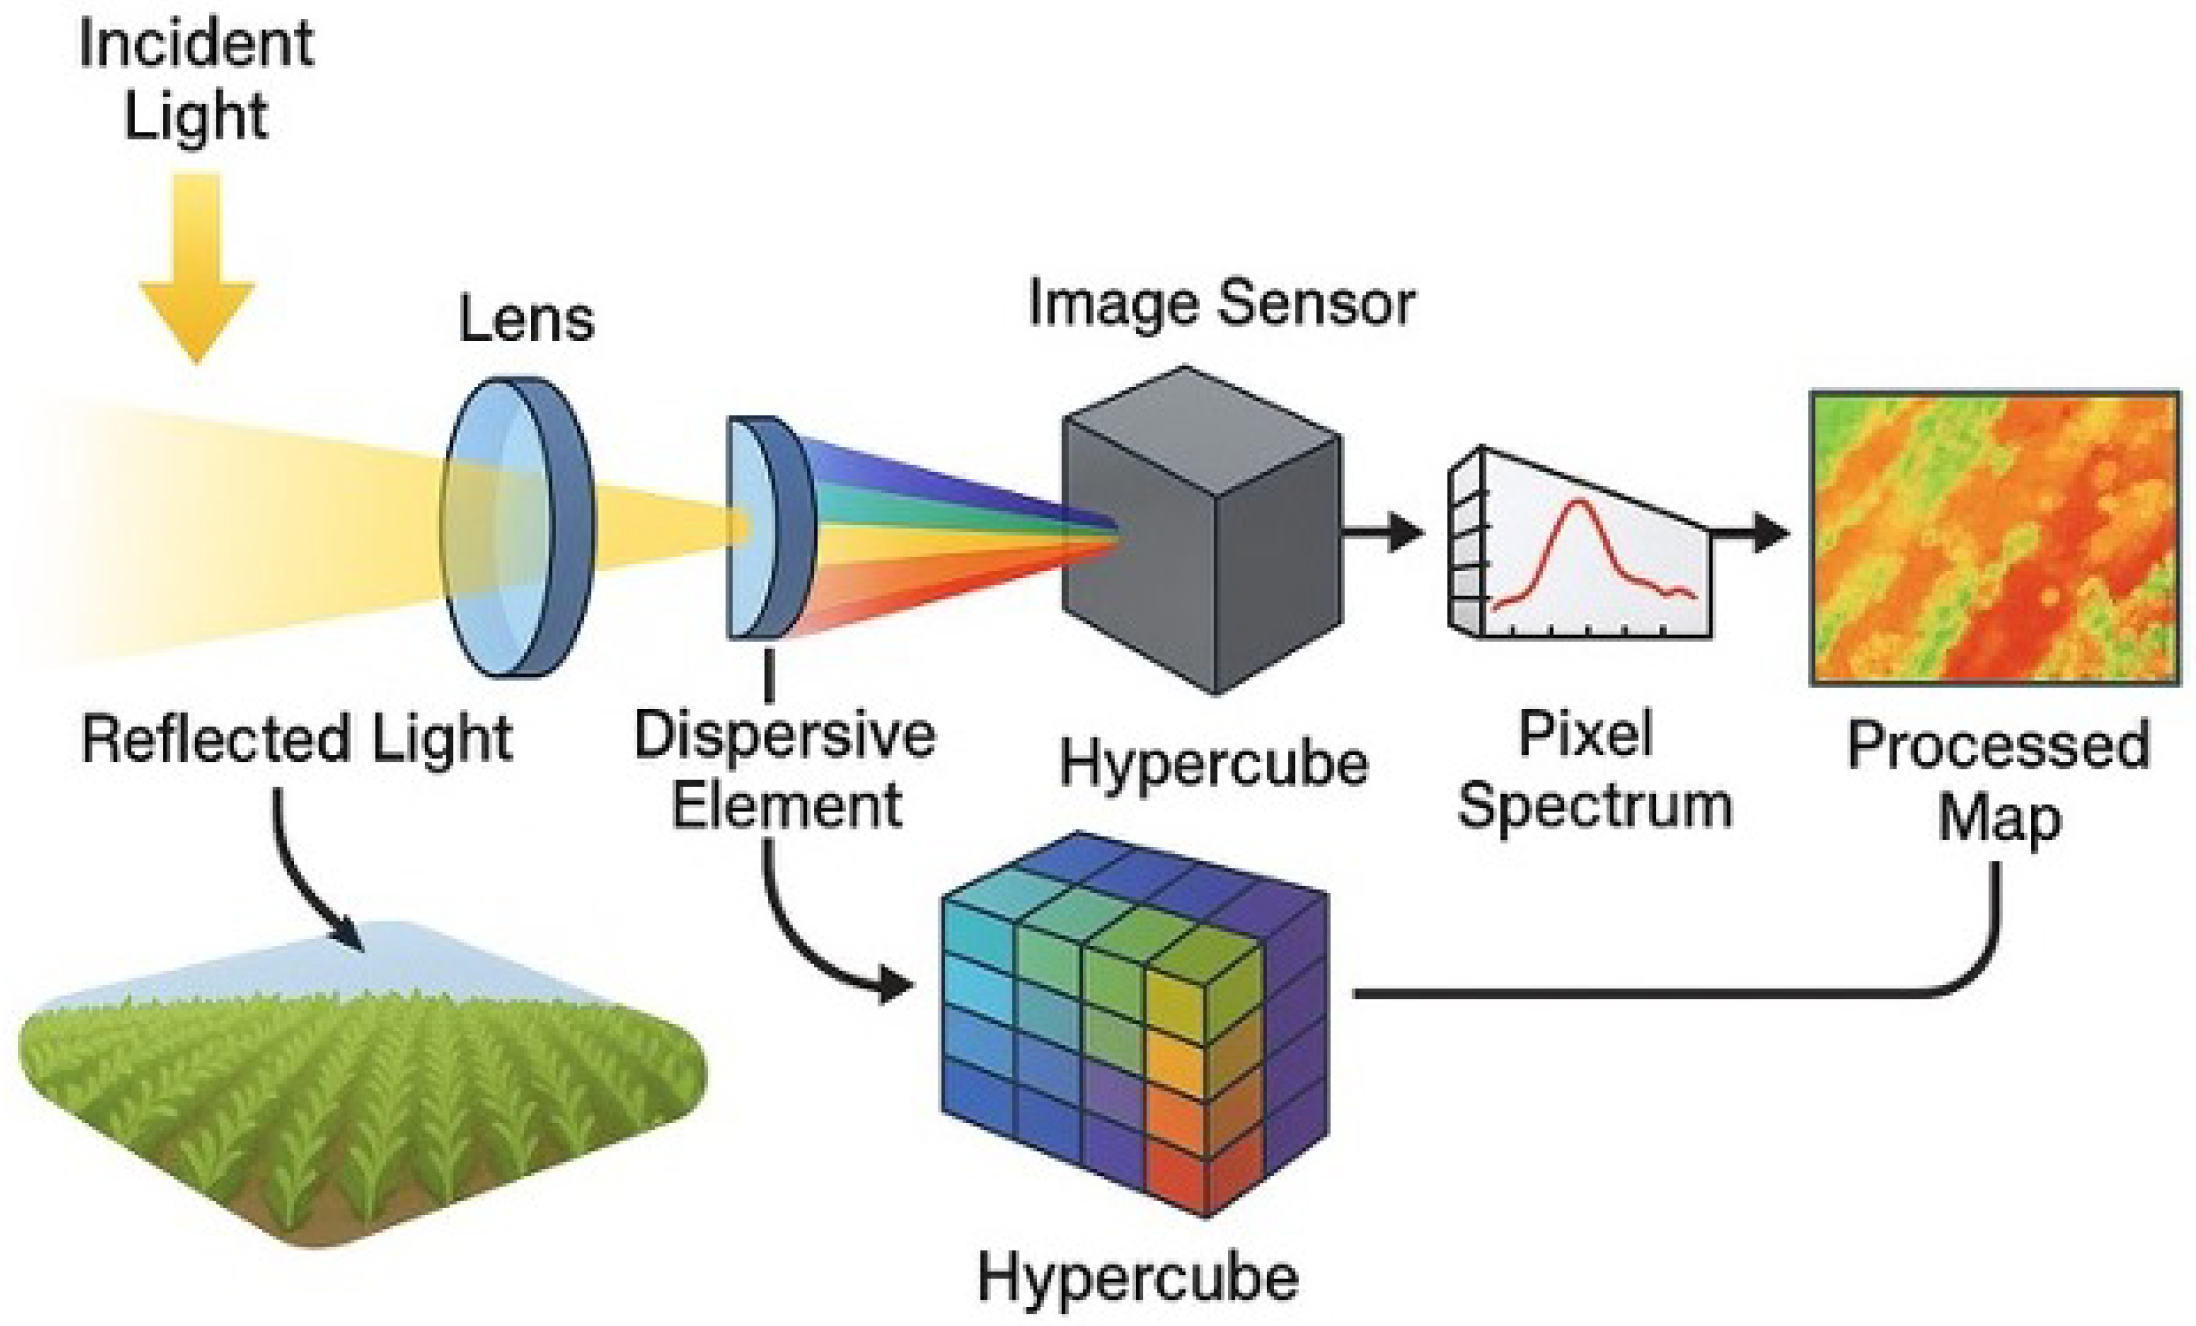
2.2. Hyperspectral Sensors
2.3. 3D Sensors
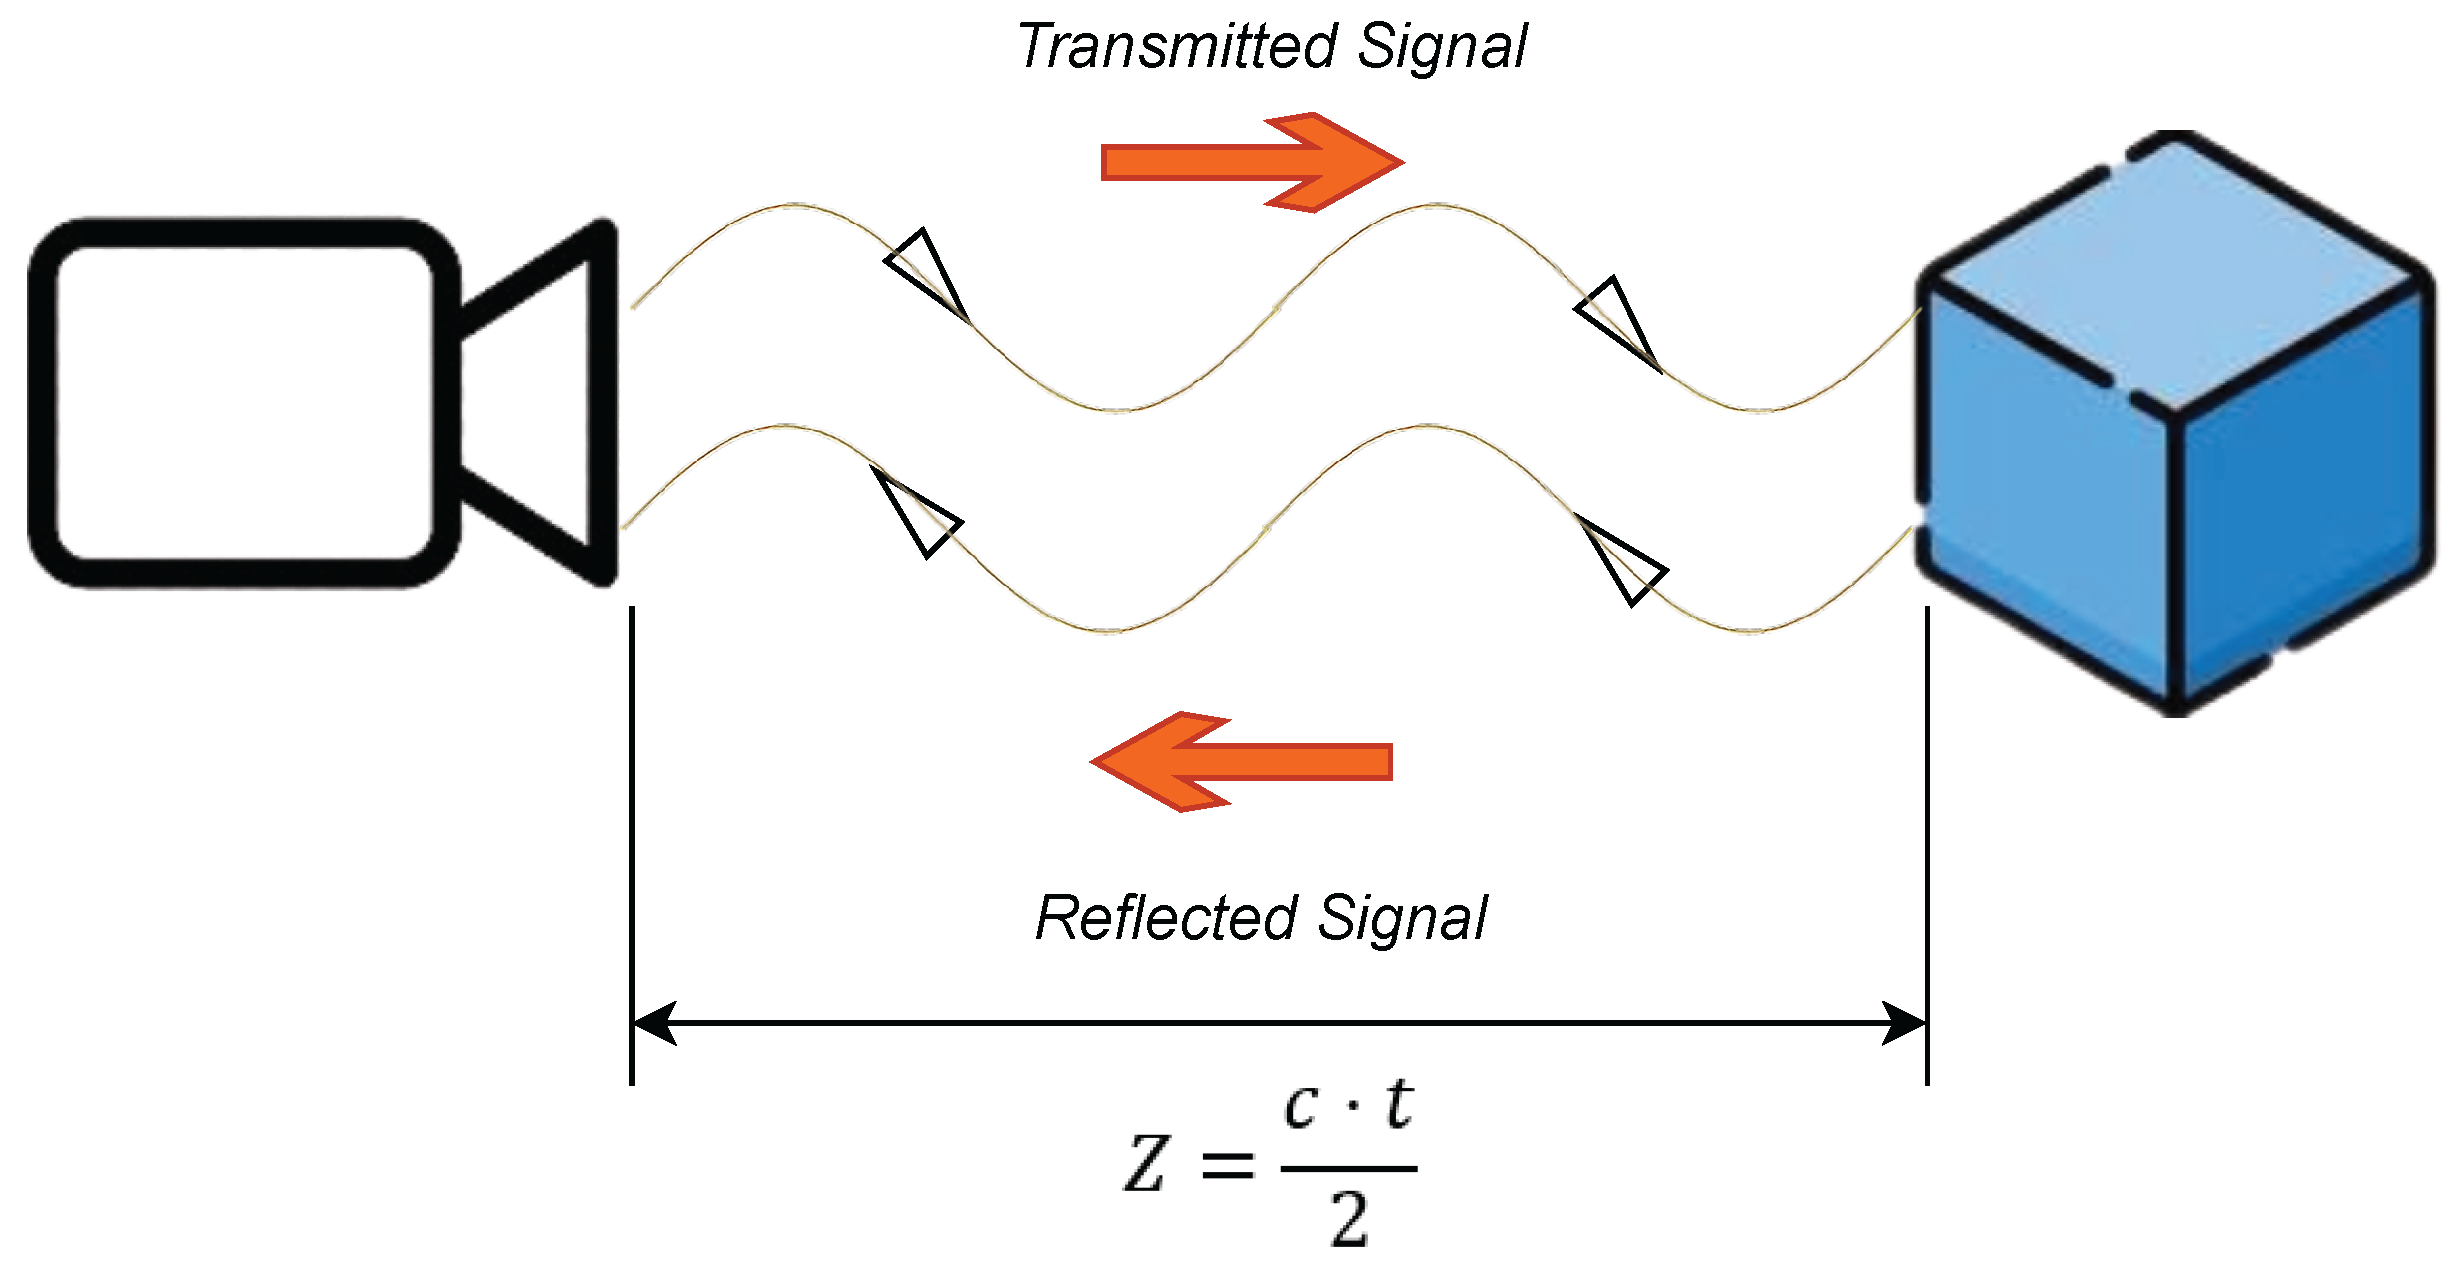
2.4. Time-of-Flight Cameras
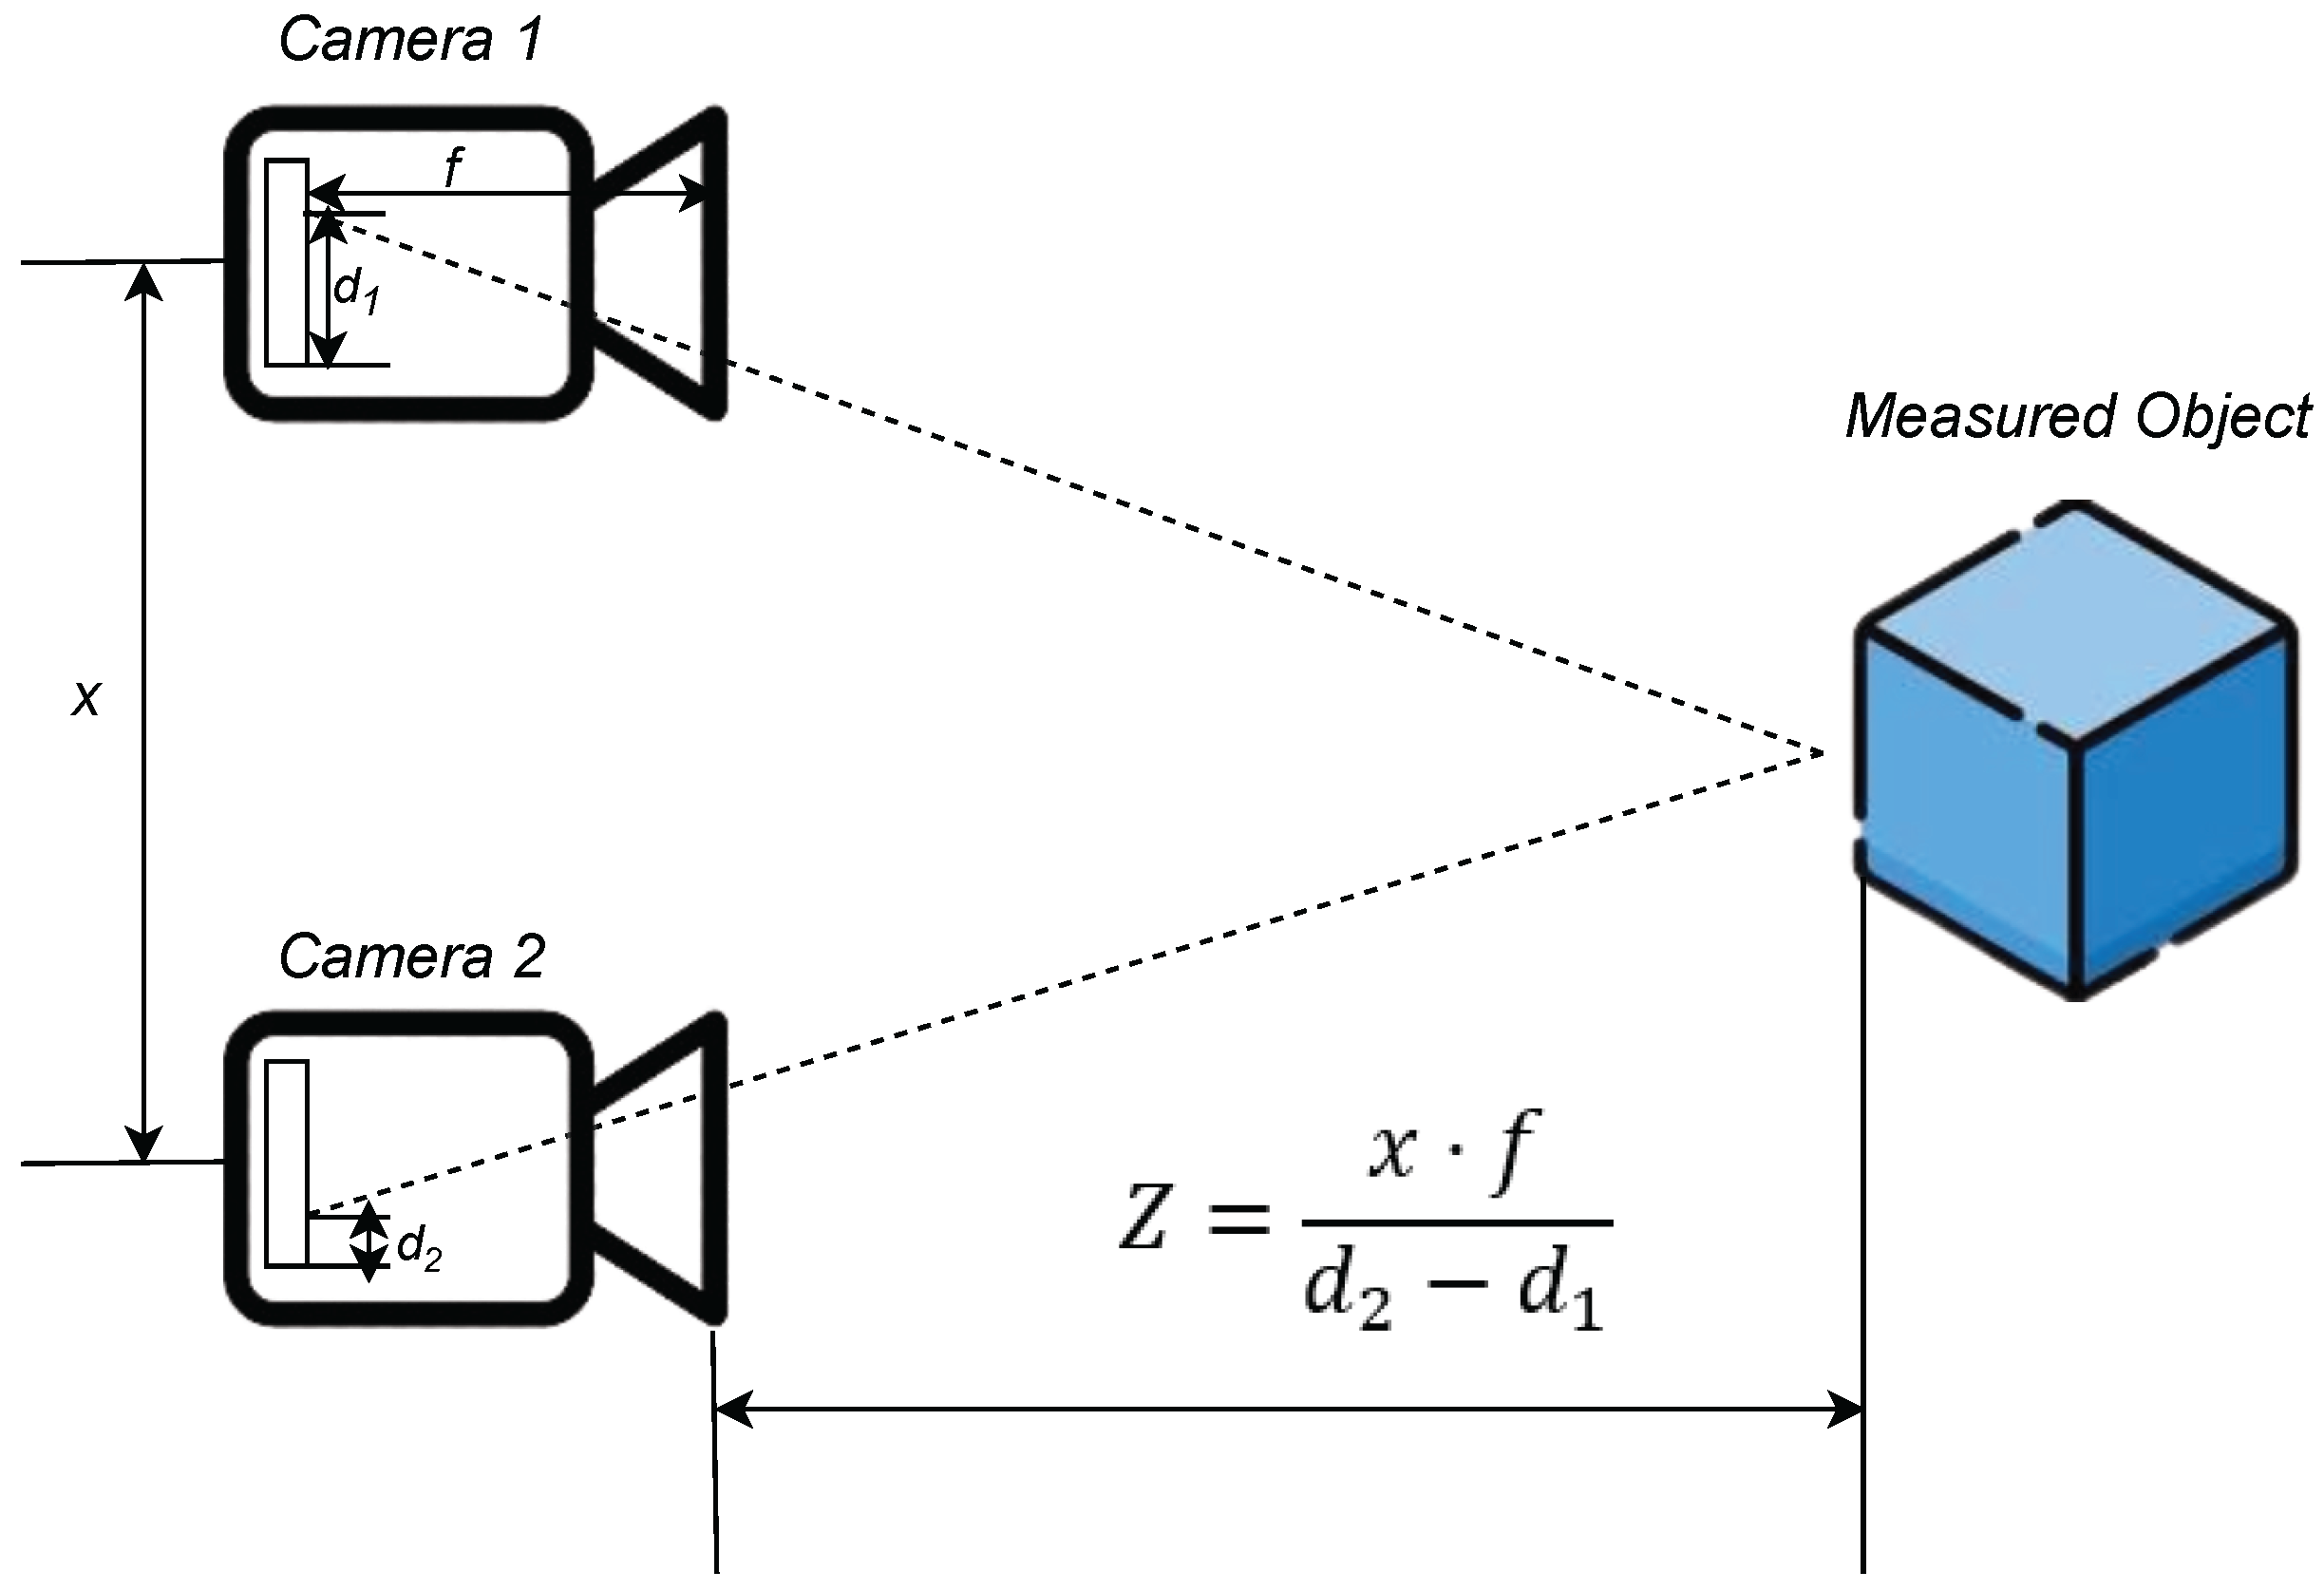
2.5. Stereo Vision and Triangulation
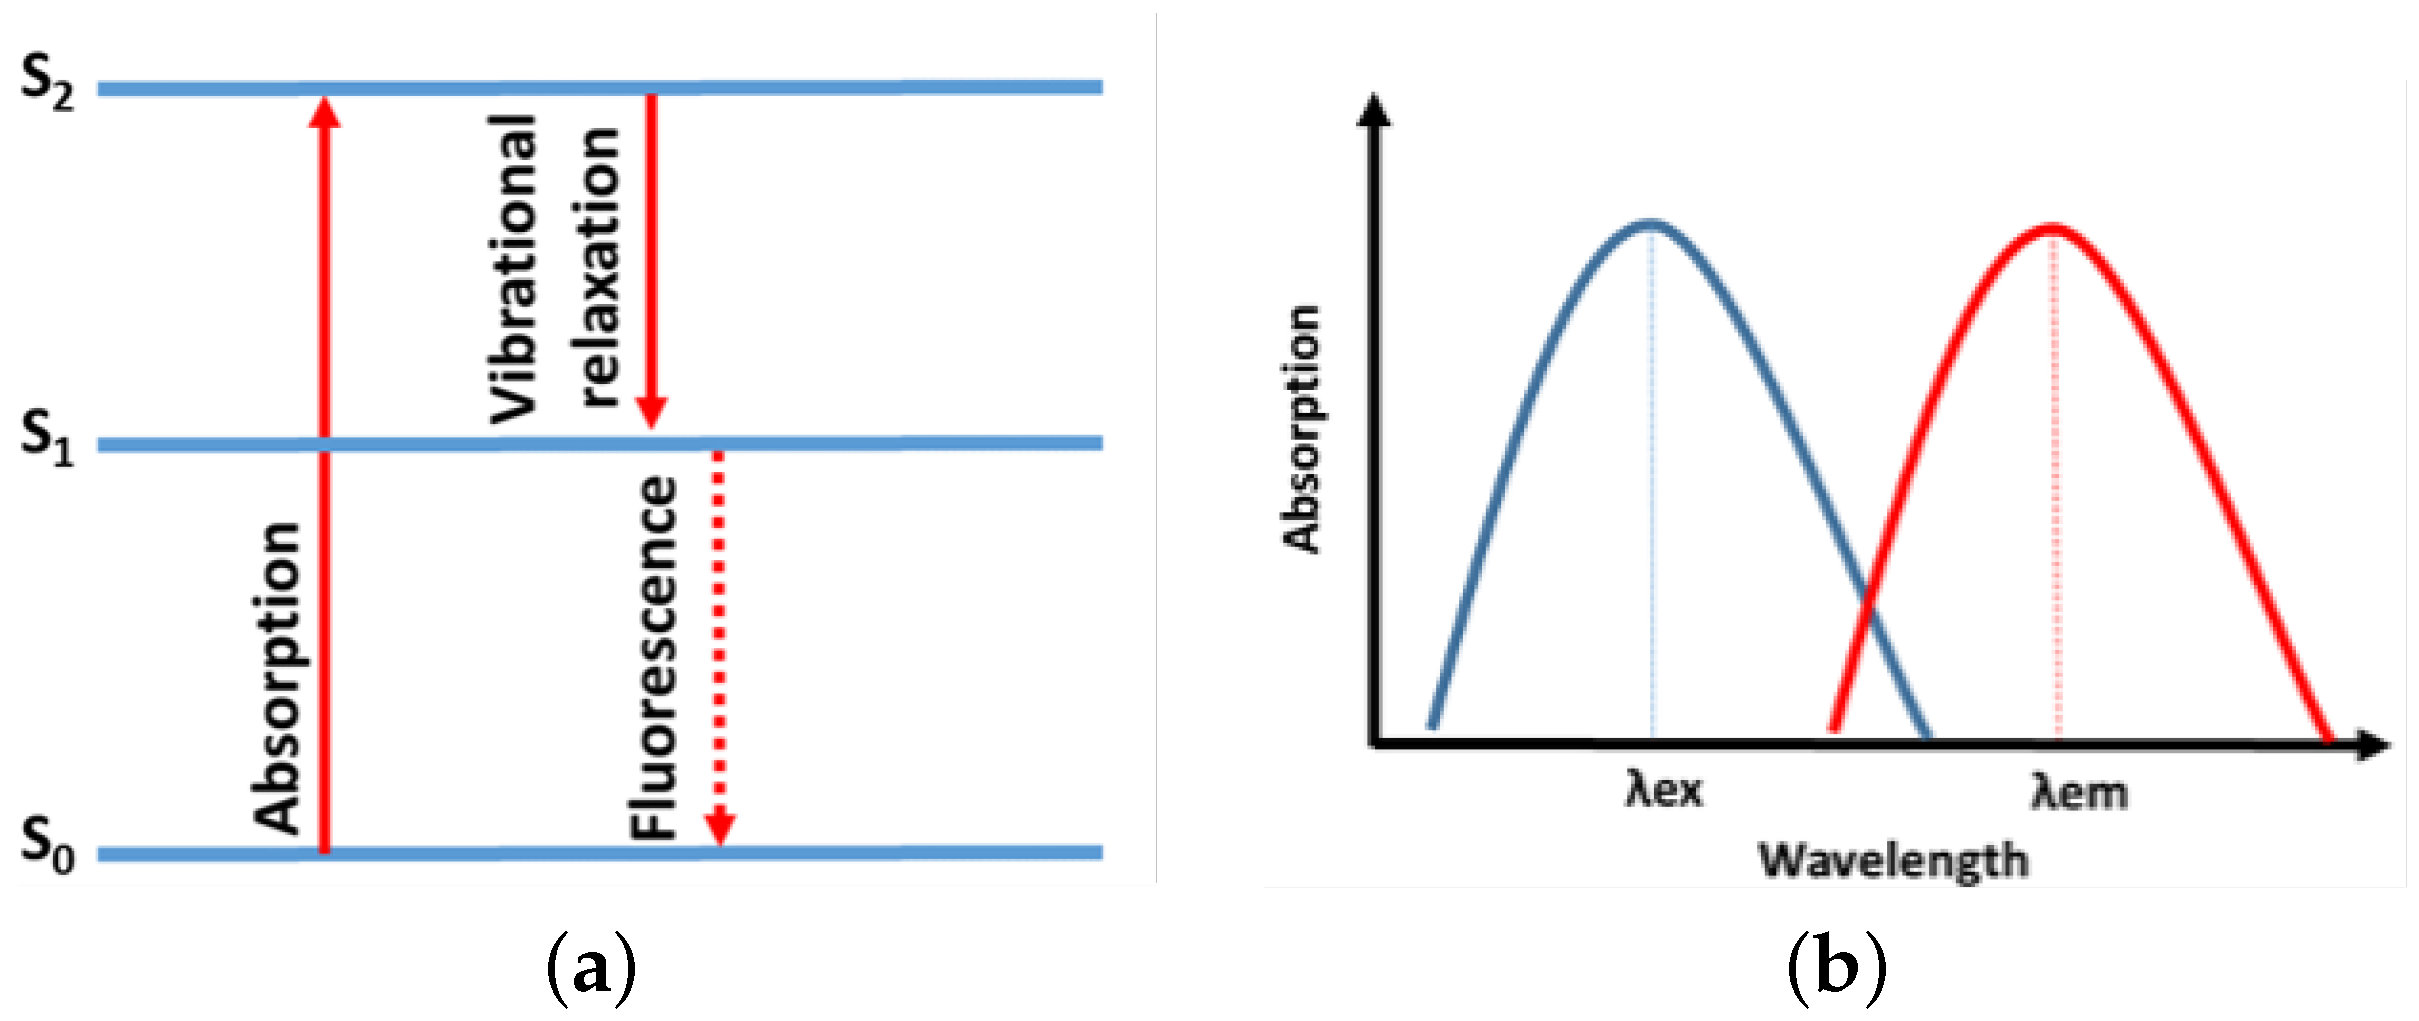
2.6. Fluorescence Spectroscopy
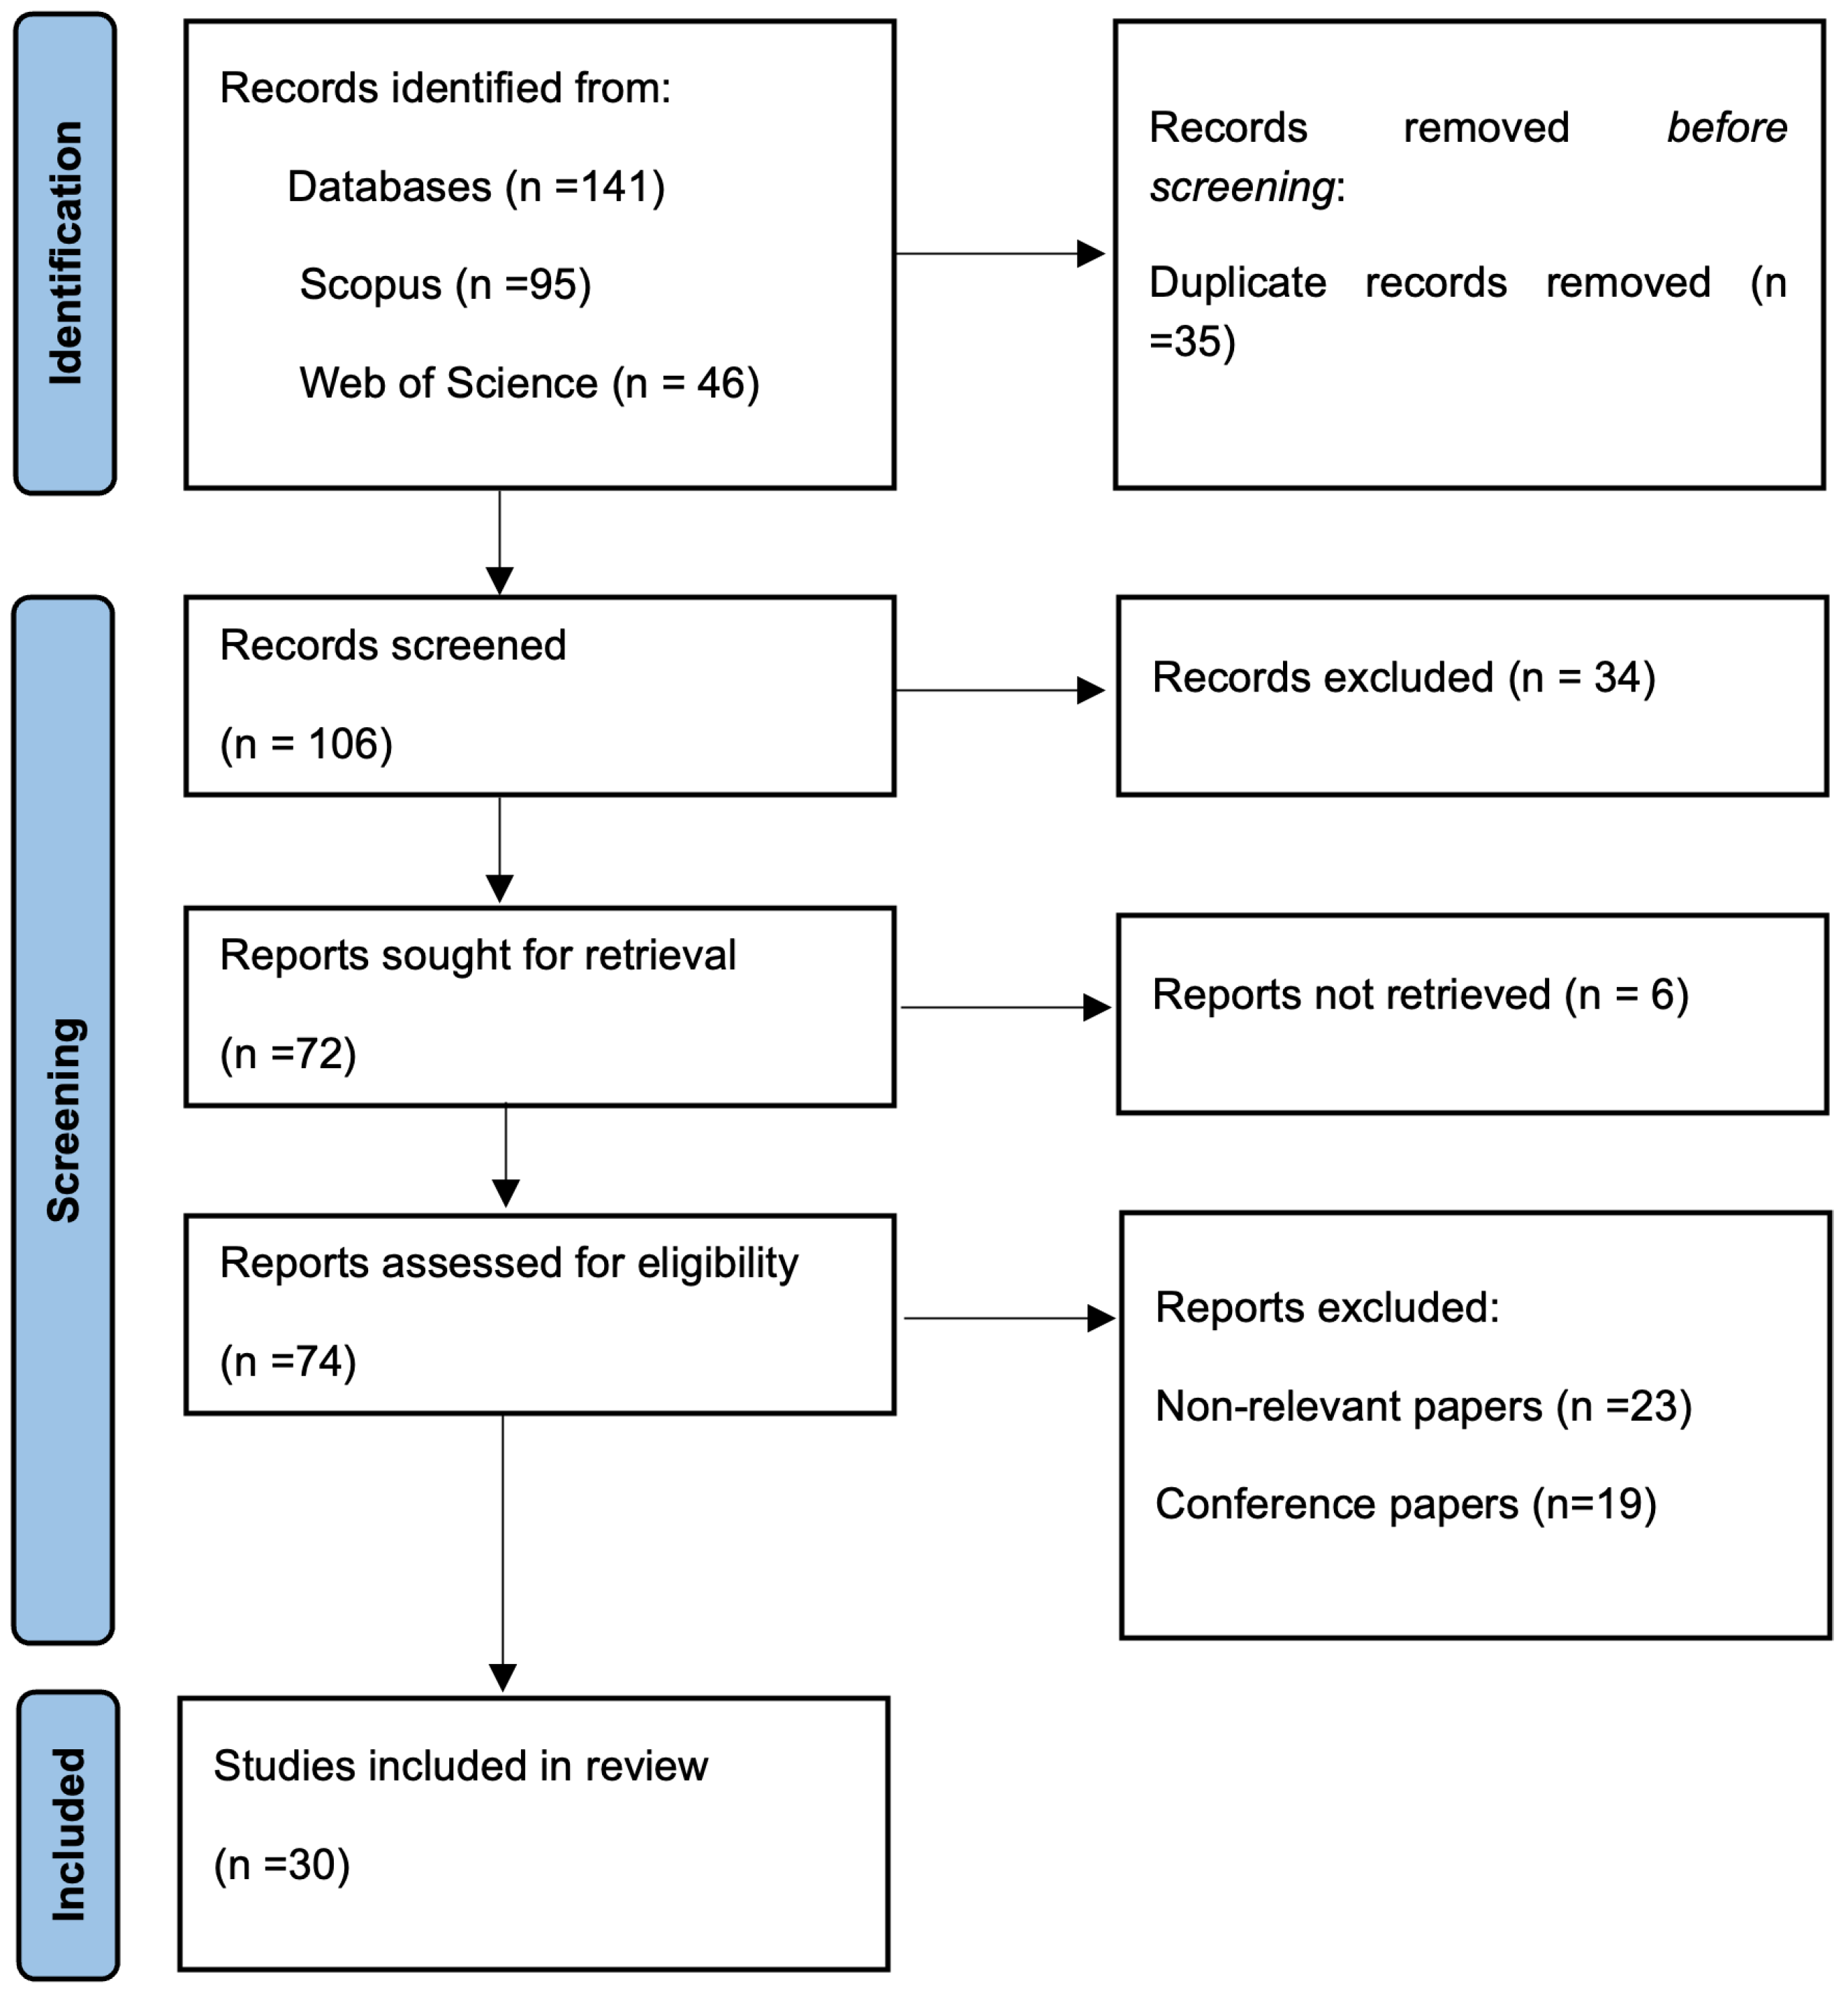
3. Methodology
3.1. Eligibility Criteria
3.2. Information Sources
3.3. Search Strategy
- In Scopus, the search equation applied was (TITLE (“grow*” OR “develop*”)) AND (TITLE (“artificial* vision*” OR “optic*”)) AND (TITLE (“flor*” OR “plant*”)) AND NOT (TITLE (thermometric)), focusing on article titles to prioritize studies directly relevant to the topic.
- In Web of Science, the equation was adapted to its specific syntax as TI = (“grow*” OR “develop*”) AND (TI = (“artificial* vision*” OR “optic*”)) AND (TI = (“flor*” OR “plant*”)) NOT (TS = (thermometric)), aligning with the required search fields for this platform. These adaptations ensured consistency across both databases and alignment with the inclusion criteria.
3.4. Selection Process
3.5. Data Management
3.6. Bias Risk Assessment
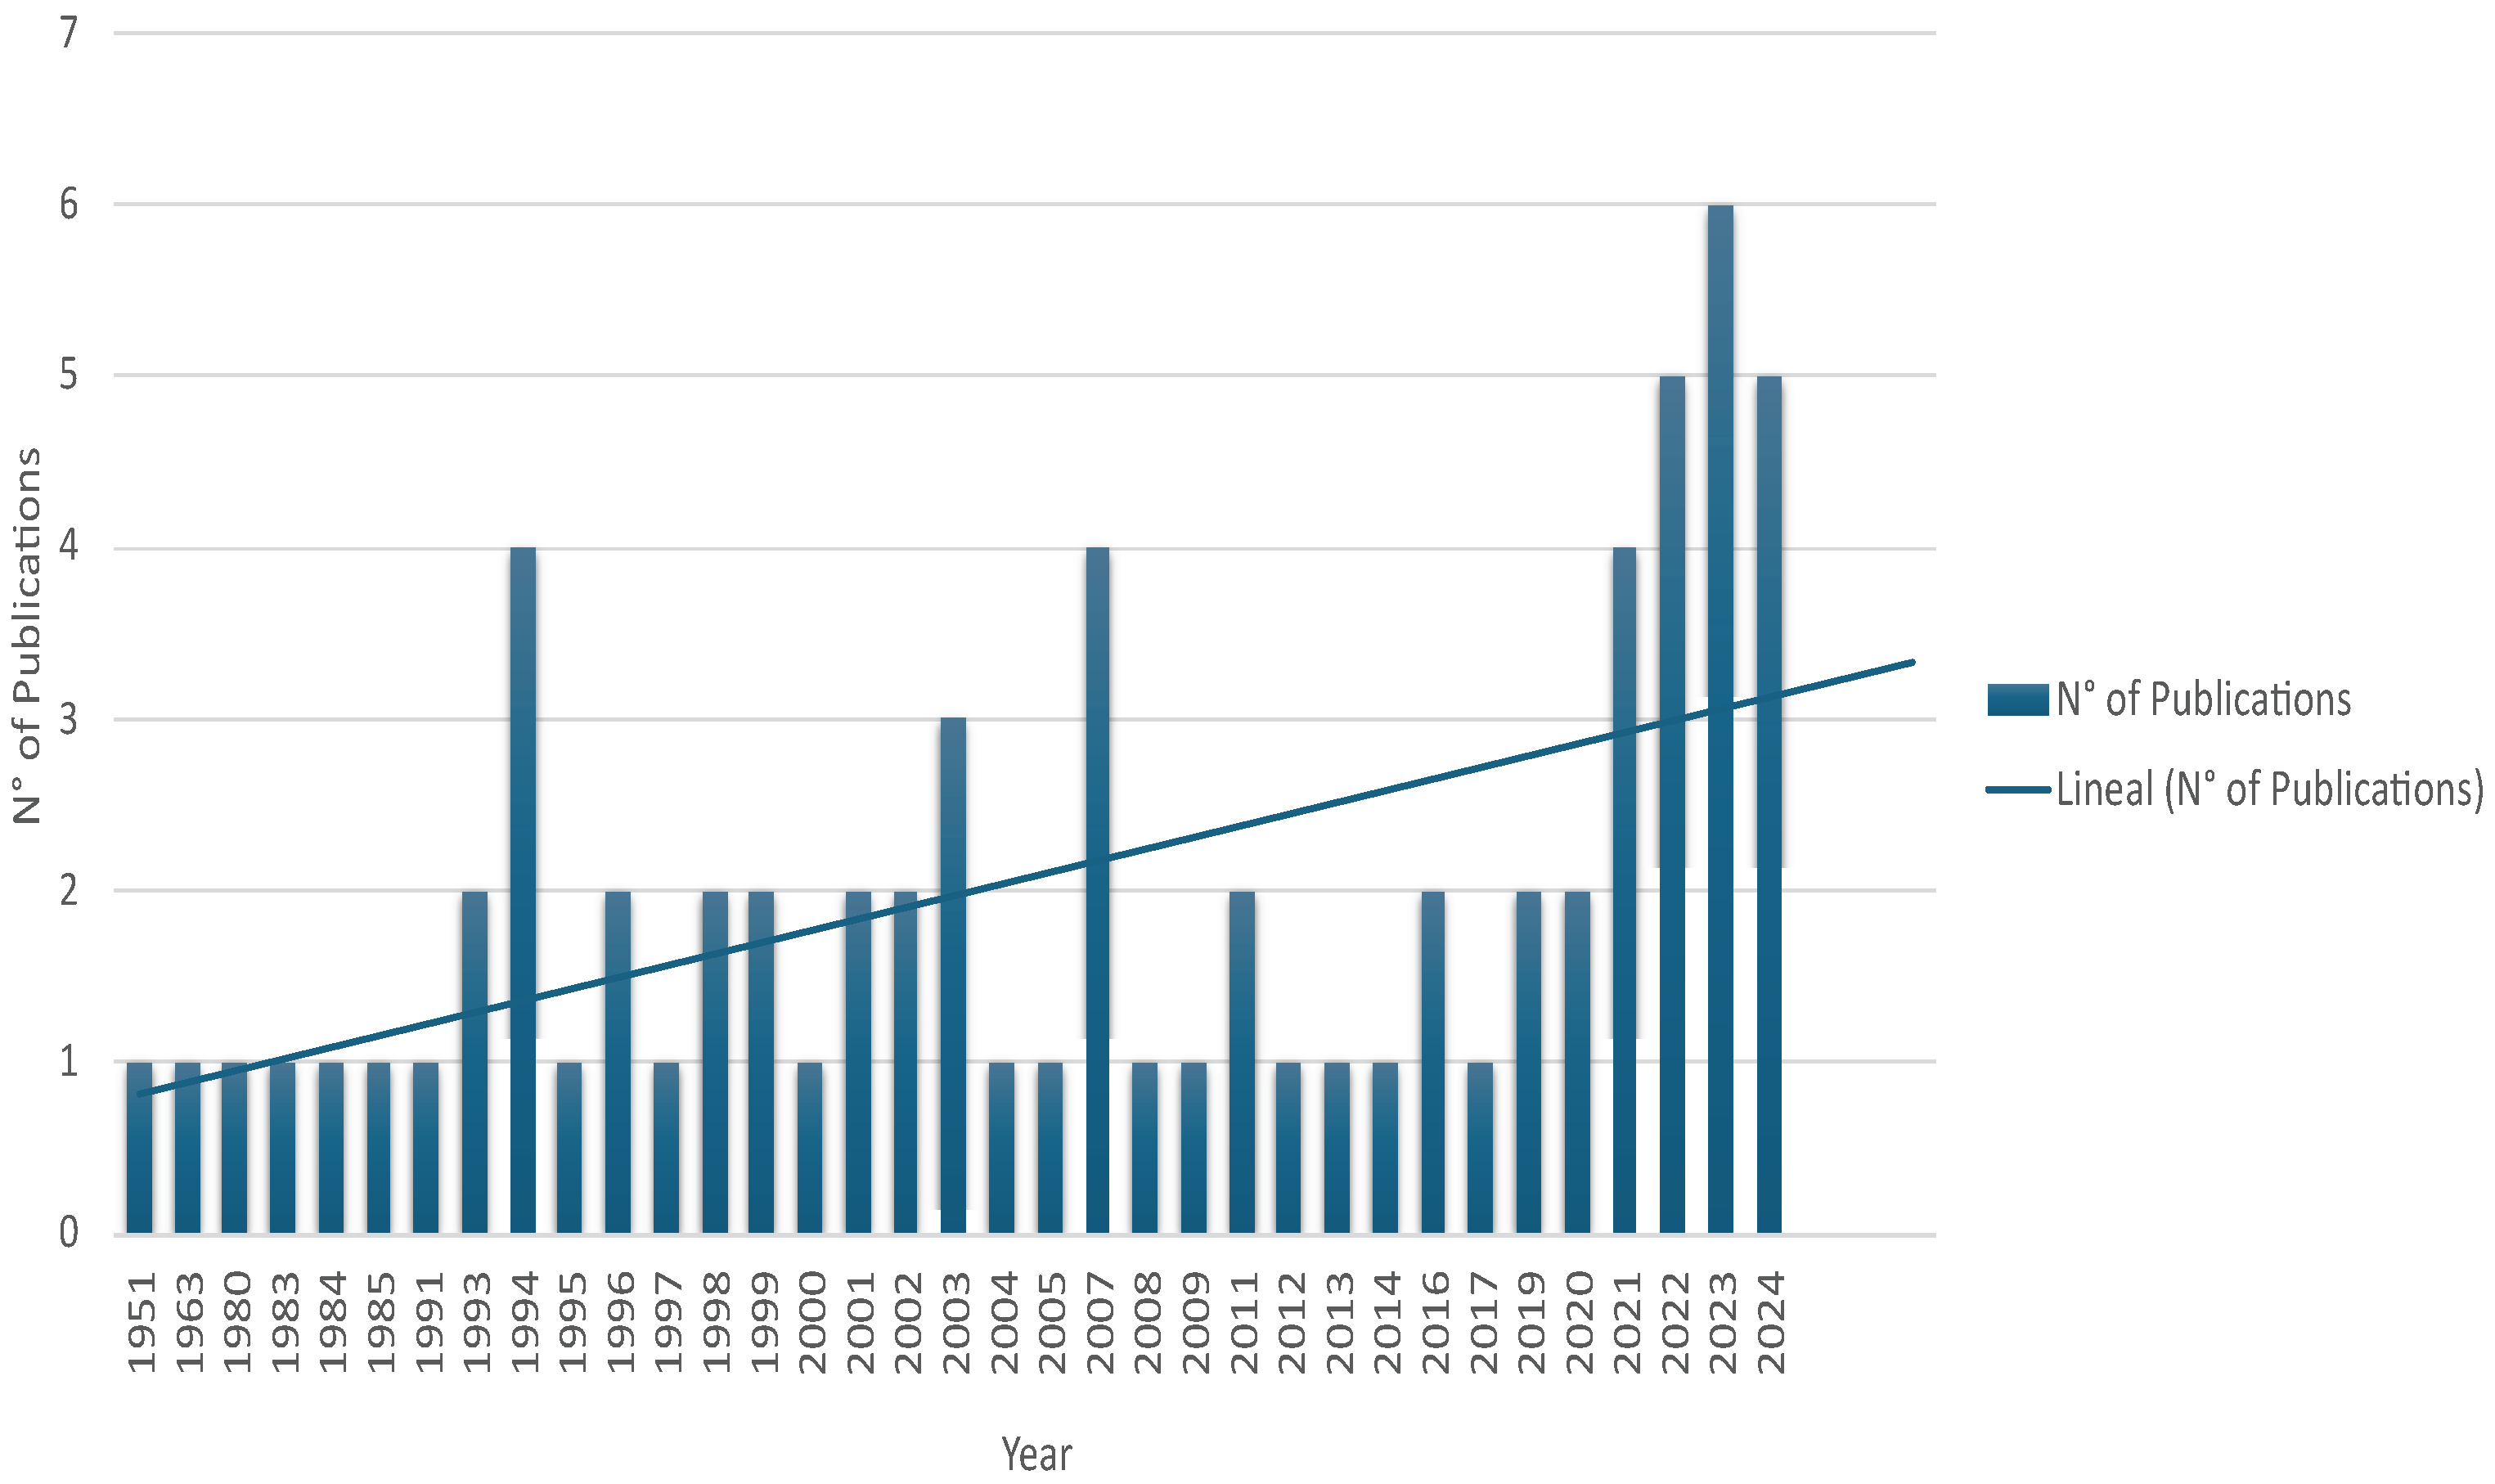
4. Results
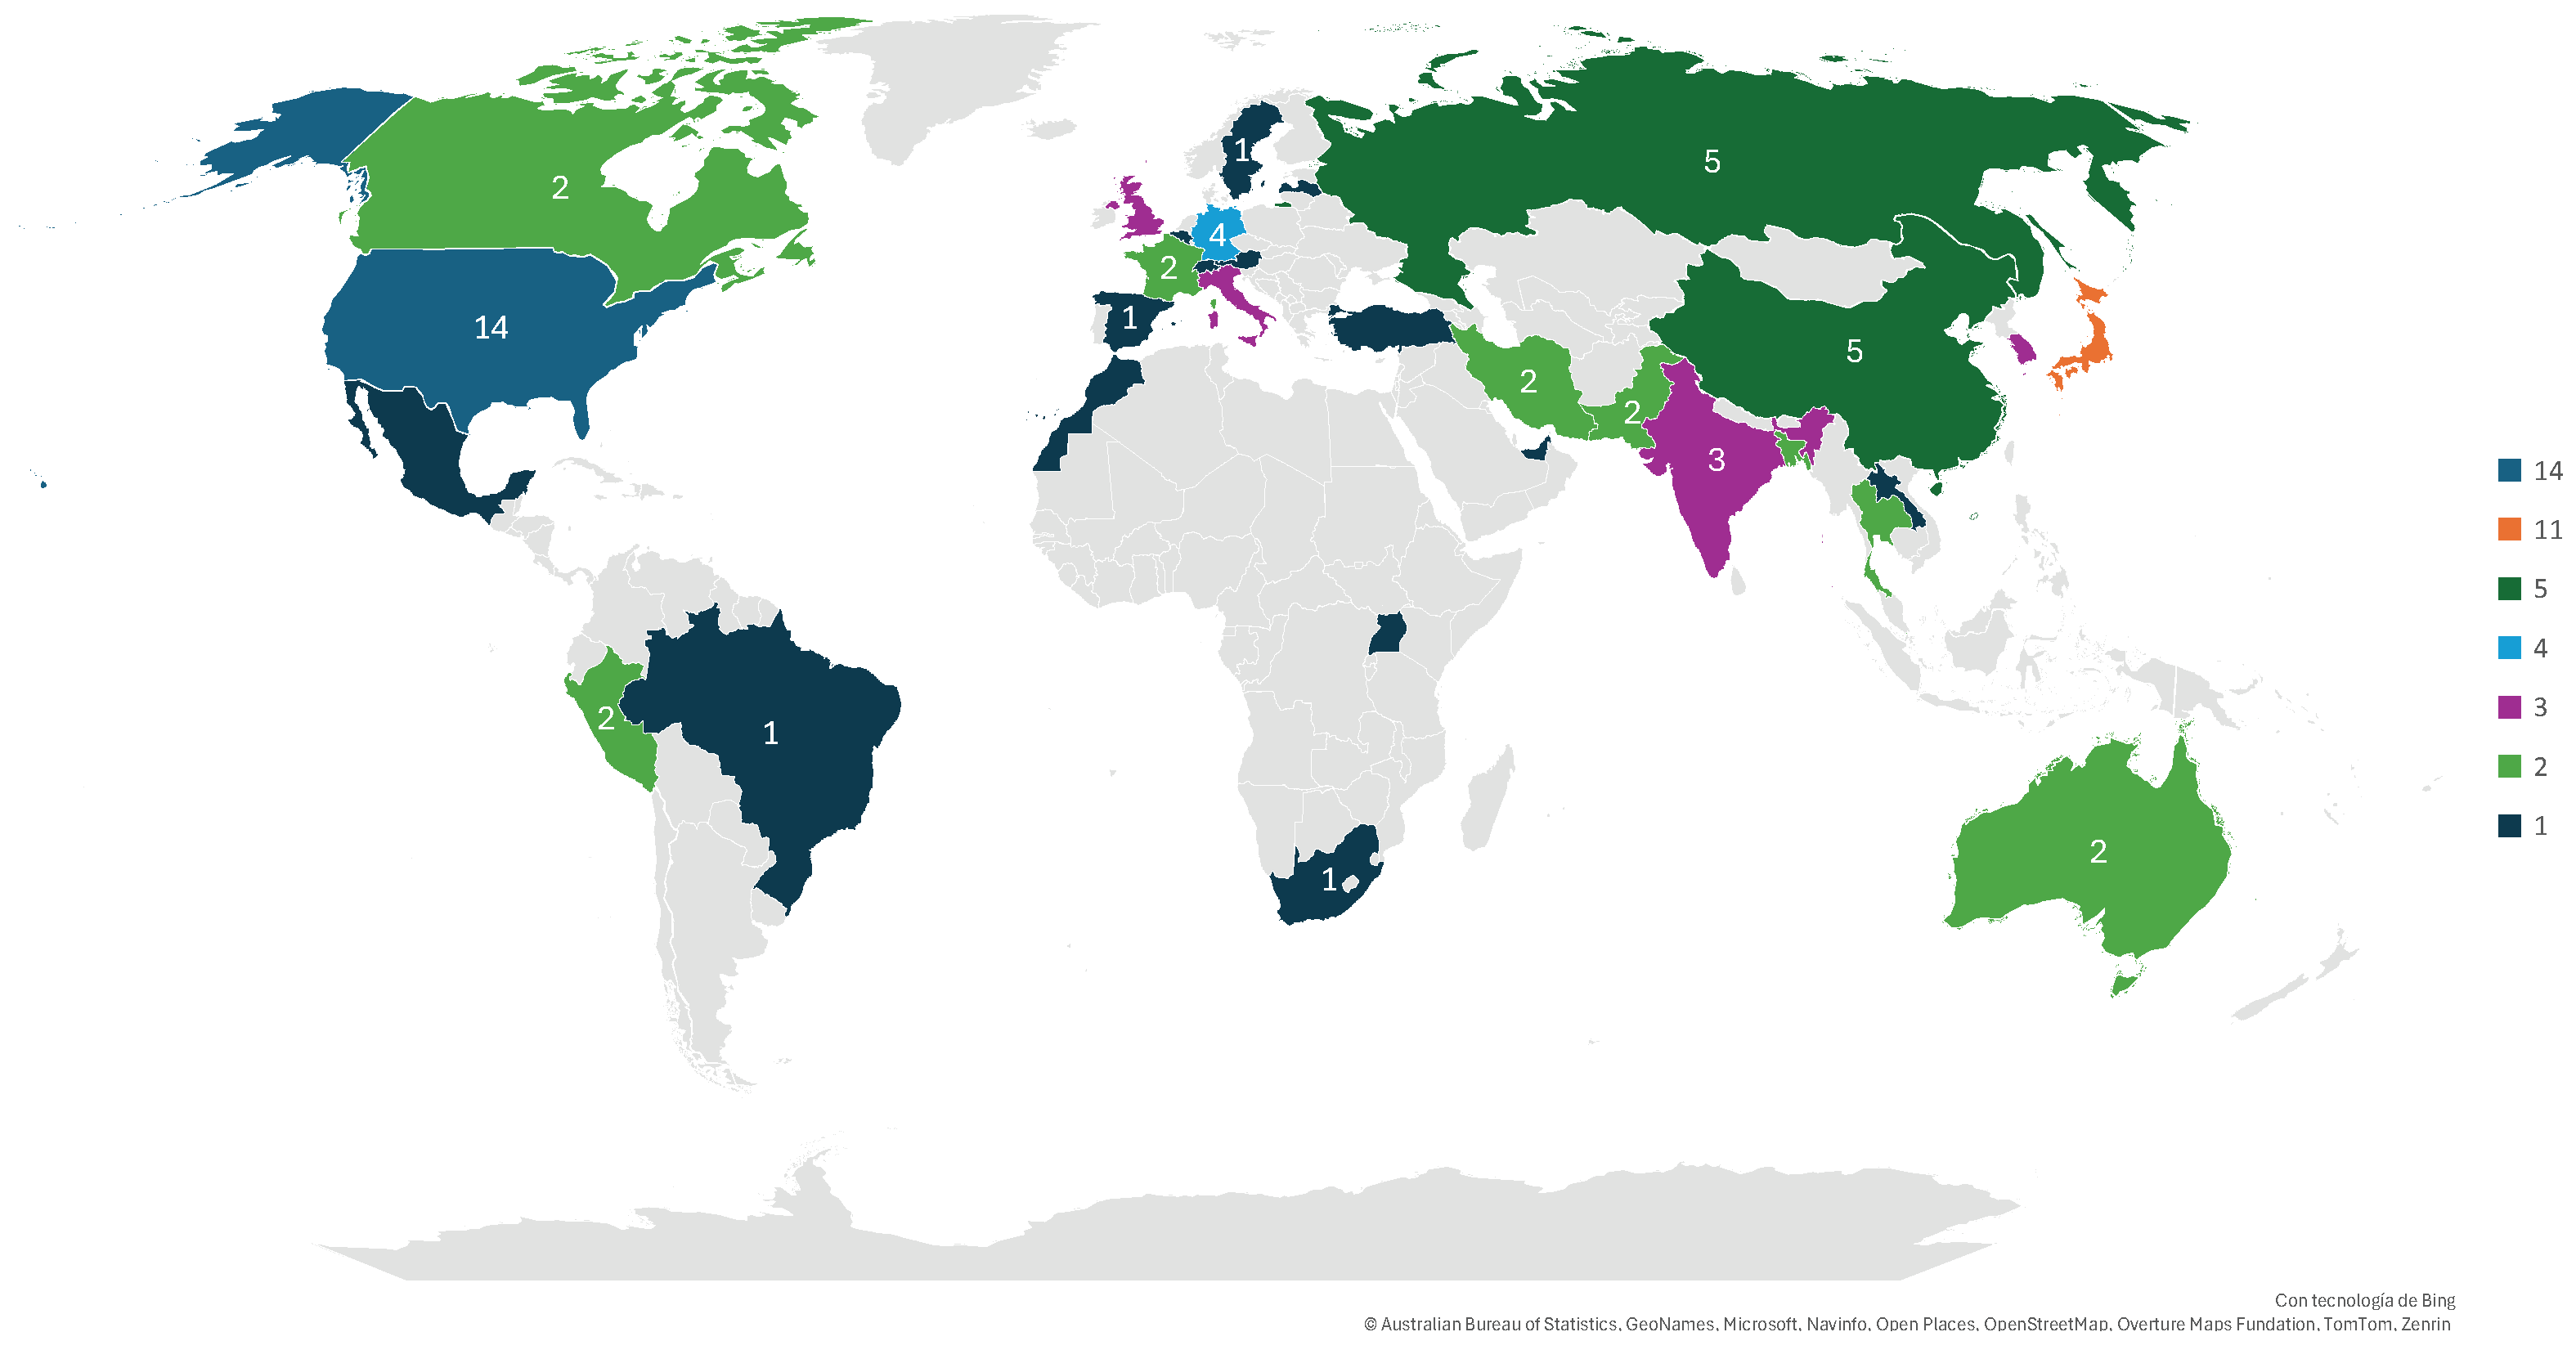
- United States (14 publications): The U.S. maintains its leadership in this field, supported by a robust academic infrastructure and close collaboration between universities, research centers, and the technological and agricultural industries. This synergy has enabled significant advances in the application of artificial vision and optical sensors in precision agriculture. Moreover, the country has pioneered the integration of emerging technologies, such as machine learning and artificial intelligence, into the monitoring and analysis of plant growth.
- Japan (11 publications): Japan has distinguished itself with its innovative approach to miniaturization and hardware optimization for agricultural applications. Its ability to integrate advanced technologies into agriculture, with a focus on energy efficiency and sustainability, has led to significant progress in automation and plant growth monitoring. Additionally, Japan has been at the forefront of developing artificial vision systems for automated crop classification and harvesting.
- China (5 publications): With its rapid growth in artificial intelligence and agricultural robotics, China is beginning to establish itself as a key player in research related to artificial vision for agriculture. Although its contribution to scientific publications remains limited, the country has demonstrated a strong drive for technological innovation. This trend is particularly evident in areas such as precision farming and AI-driven systems.
- Russian Federation (5 publications): Russia’s contributions have focused on combining optical techniques with thermal sensors and spectroscopy for monitoring plant growth in extreme environments, such as cold or arid climates. Although these contributions are valuable, they have been constrained by limited international collaboration and a lack of resources for large-scale adoption of these technologies in recent years.
- Canada (2 publications): Canada has developed significant research on the application of optical methods and artificial vision for the three-dimensional measurement of plant growth. These contributions are noteworthy in the field of agricultural phenotyping. However, the relatively low number of publications suggests that there is still room for further development in this area.
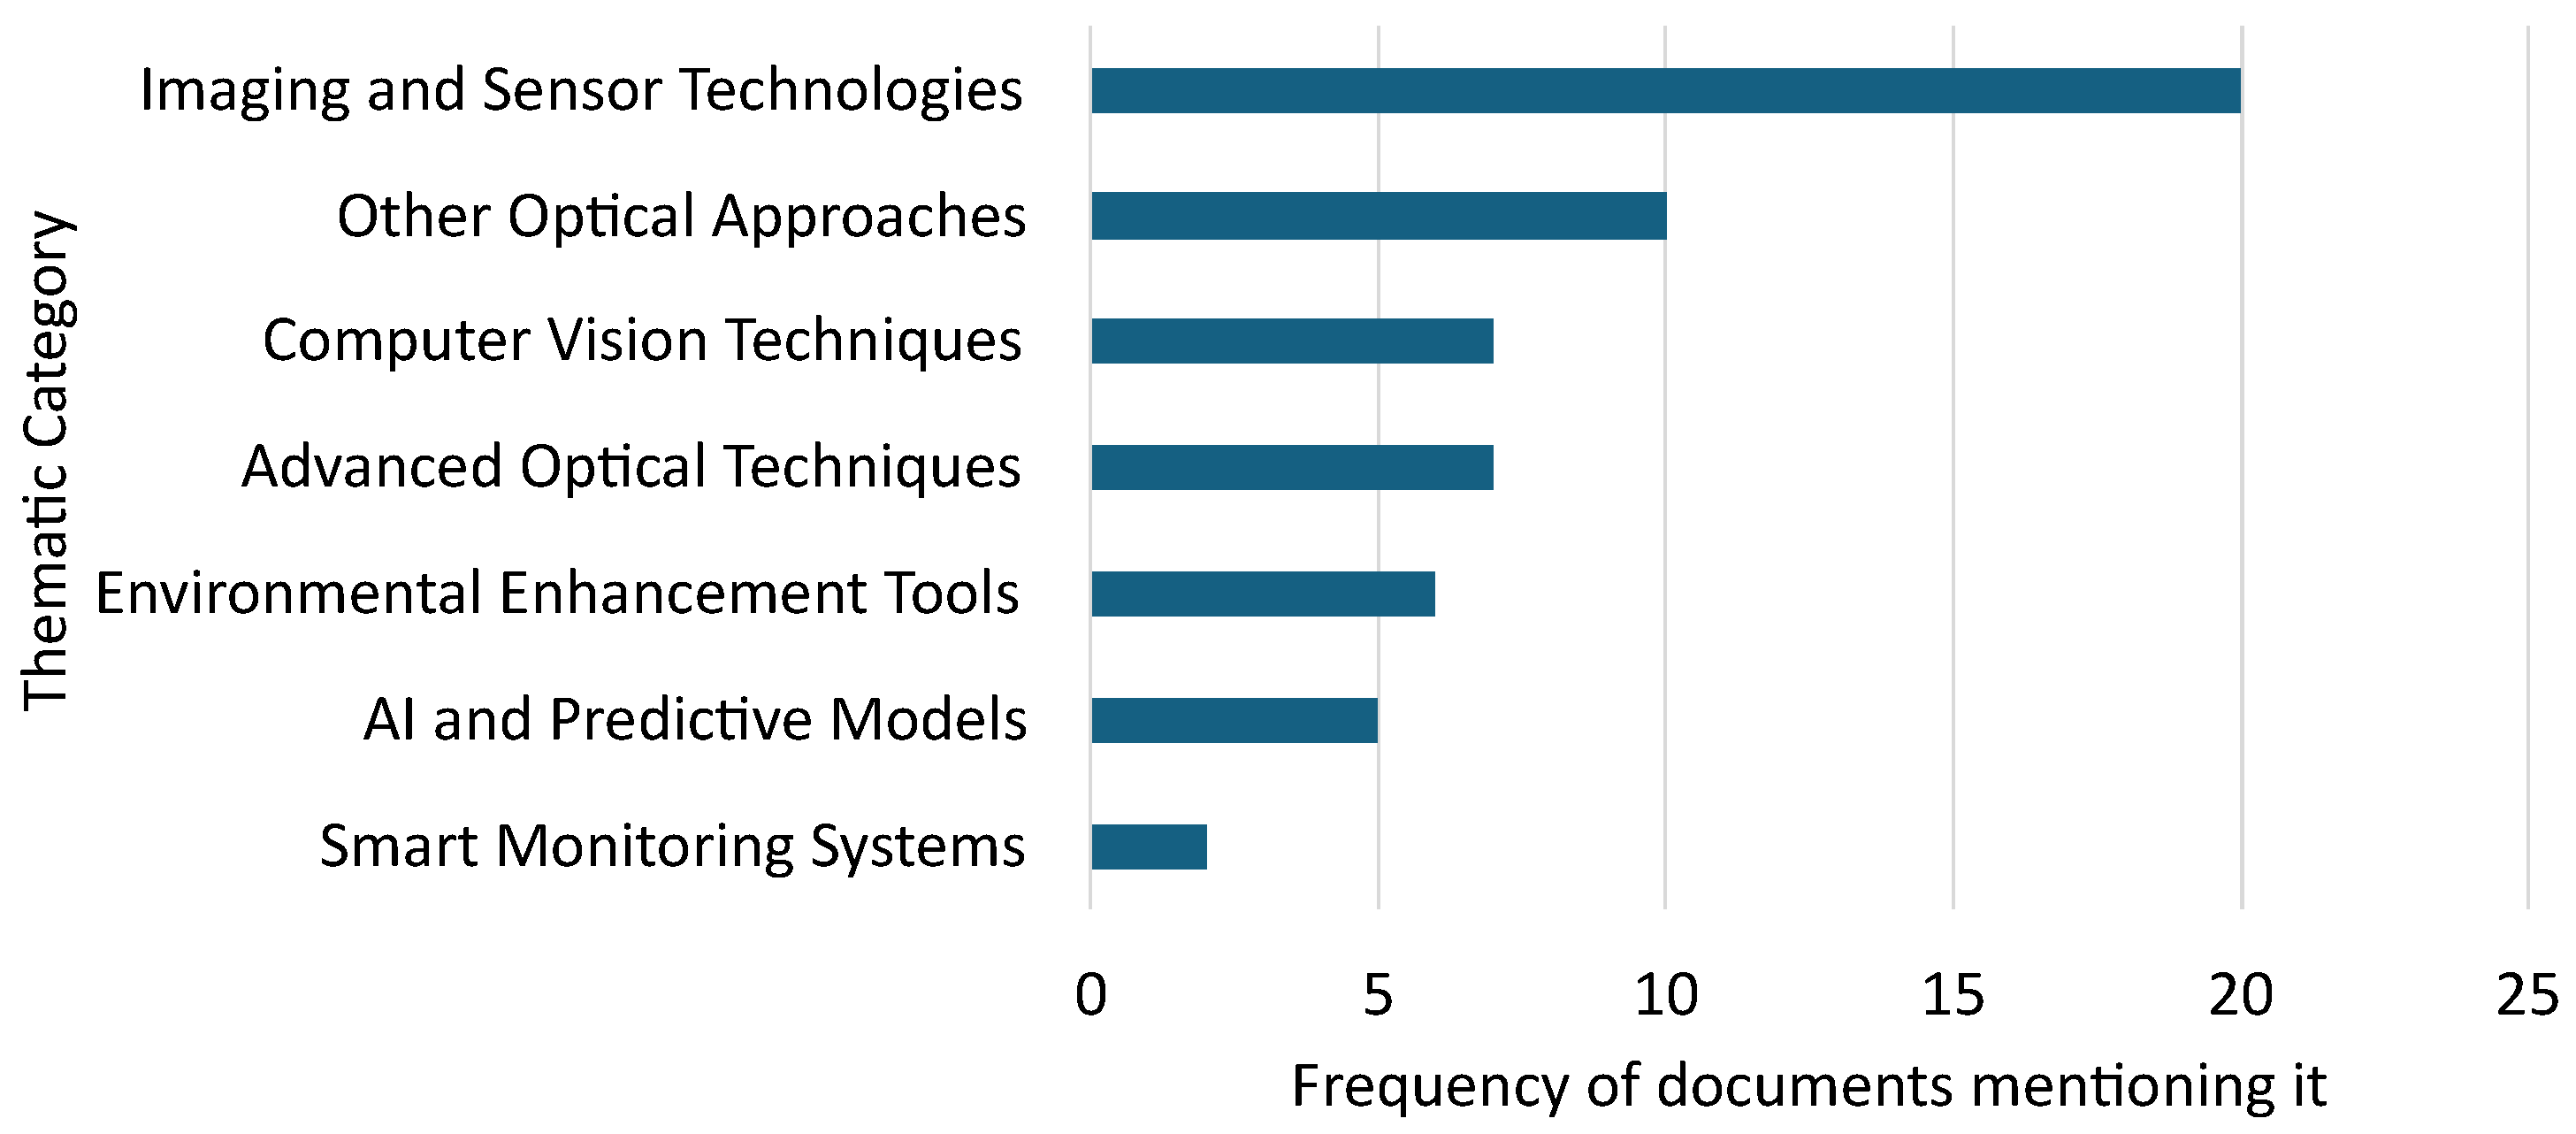
- Imaging and Sensor Technologies, which includes tools such as RGB cameras, depth sensors, multispectral sensors, hyperspectral sensors, fiber optic sensors, quantum sensors, electro-optical sensors, thermal imaging systems, chlorophyll fluorescence, and terahertz imaging technologies.
- AI and Predictive Models, which comprises predictive machine learning models and neural networks for phenological pattern recognition.
- Artificial Vision Techniques, oriented toward image processing using optical flow, image correlation, and contour analysis.
- Advanced Optical Techniques, such as inductively coupled plasma optical emission spectroscopy (ICP-OES), photoluminescence, near-infrared spectroscopy, and ultraviolet-induced fluorescence.
- Environmental Enhancement Tools, which includes elements such as structured lighting, artificial lighting systems, and passive fiber optic lighting systems.
- Smart Monitoring Systems, offering functionalities such as automatic alerts to environmental changes.
- Other Optical Approaches, which encompasses diverse techniques such as remote sensing, protoplast monitoring, self-aligning optical particle analyzers, spectral absorption analysis, and the use of LIDAR to assess structural growth.
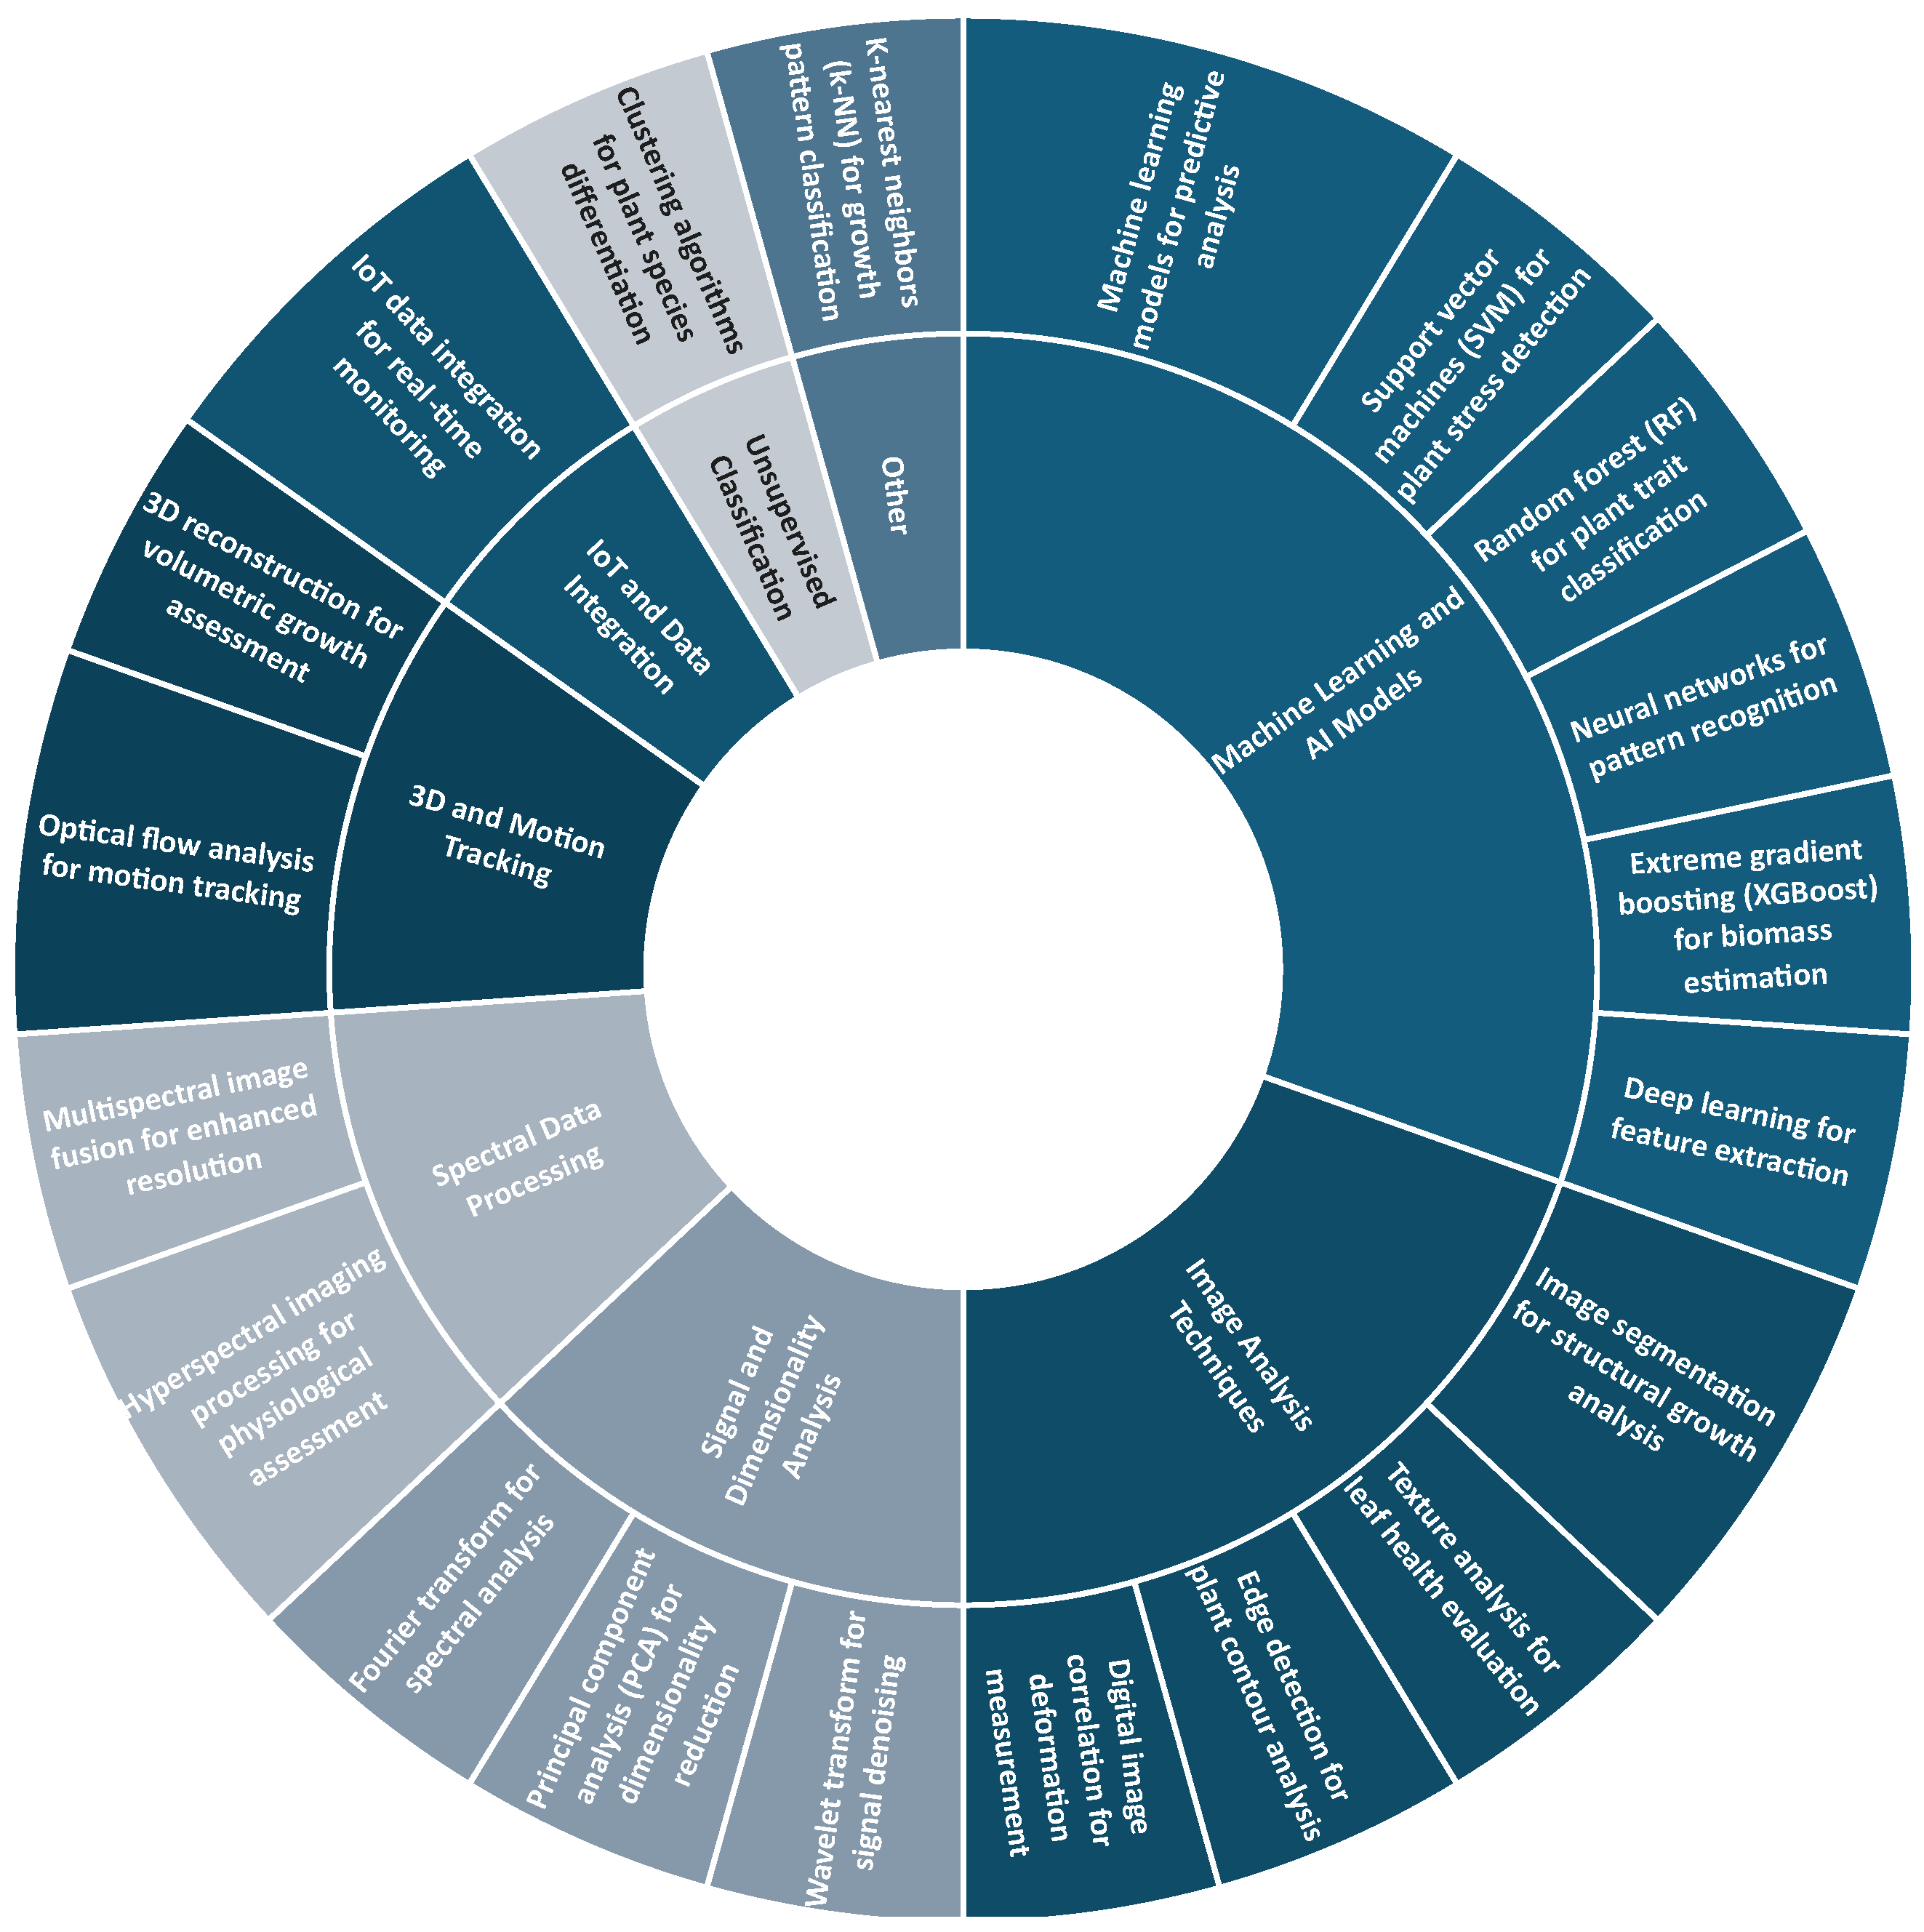
- Machine learning and AI models: This category includes the use of machine learning models, neural networks, support vector machines (SVMs), random forests, deep learning, and XGBoost for classification and biomass estimation tasks.
- Image analysis techniques: This group comprises image segmentation, edge detection, digital image correlation, and texture analysis, all of which are applied to assess leaf health and structural characteristics.
- Three-dimensional and motion tracking: Techniques such as optical flow analysis and 3D reconstruction are used to assess volumetric growth and the motion tracking of plant structures.
- Signal and dimensionality analysis: This includes methods like principal component analysis (PCA), Fourier transforms, and wavelet transforms, which serve to reduce dimensionality and eliminate noise from signals.
- Spectral data processing: Multispectral image fusion and hyperspectral imaging techniques are employed for detailed physiological analysis of plant health and stress responses.
- IoT and data integration: This category involves integrated real-time monitoring platforms utilizing smart sensors to collect and process environmental and plant-related data continuously.
- Unsupervised classification: This group includes clustering algorithms designed for species differentiation and grouping based on spectral and visual patterns.
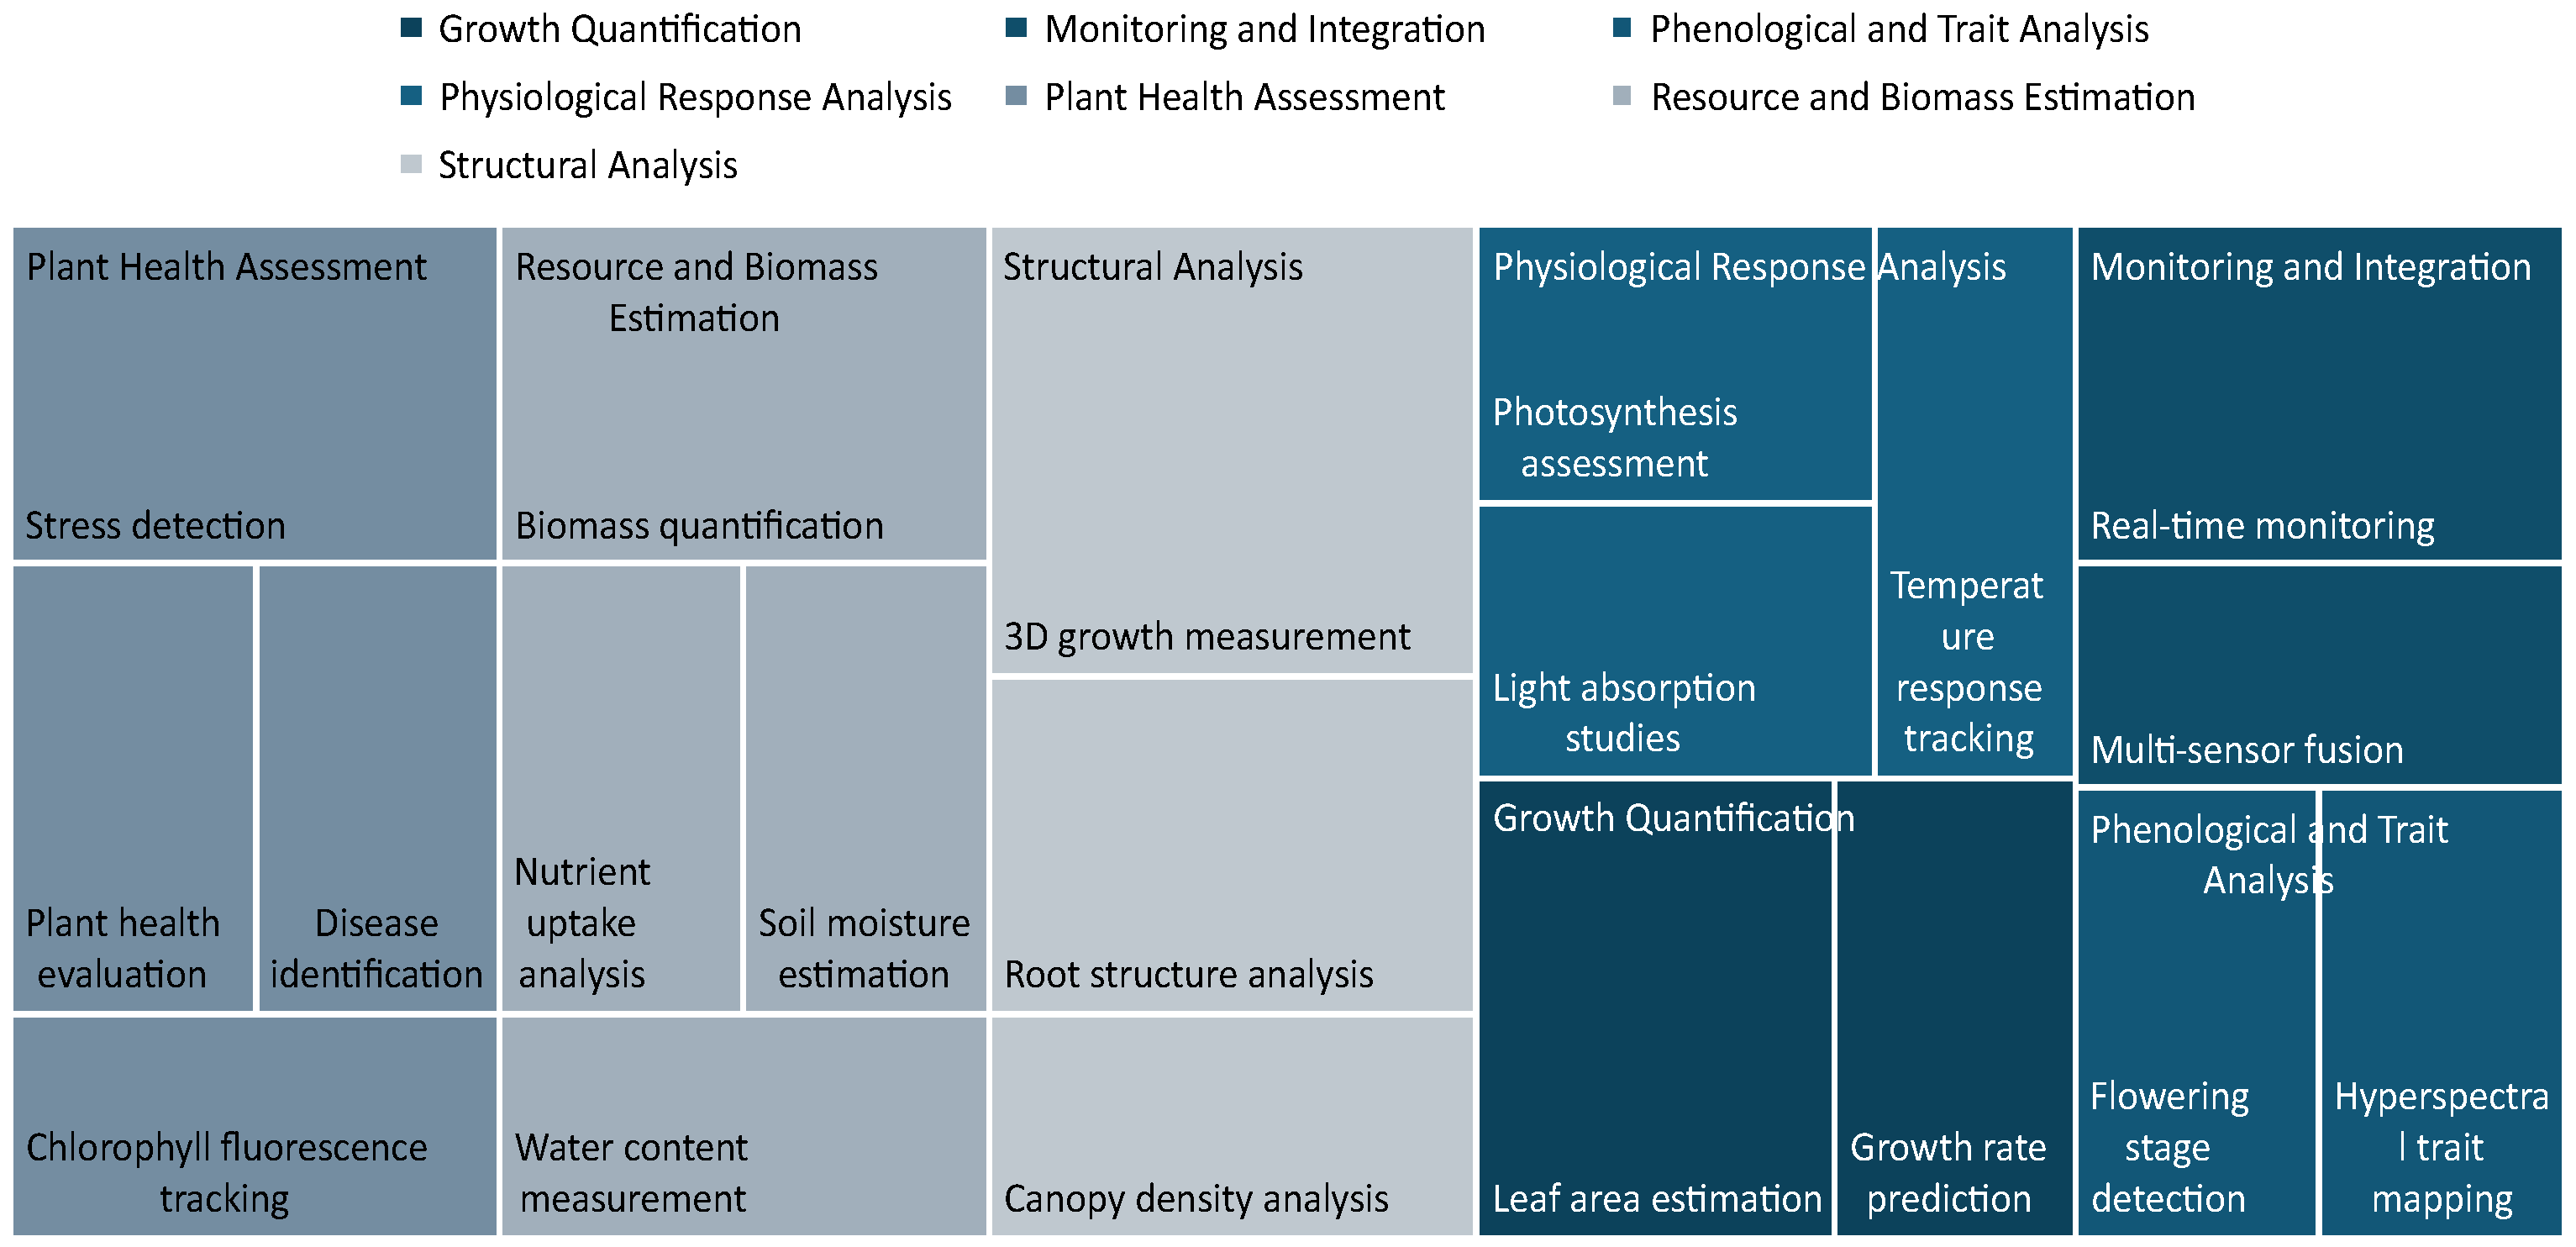
- Structural Analysis, which includes three-dimensional growth measurement, crown density analysis, and root structure.
- Monitoring and Integration, which encompasses sensor integration and real-time monitoring with multichannel fusion.
- Growth Quantification, aimed at estimating leaf area and predicting growth rates.
- Resource and Biomass Estimation, with emphasis on biomass quantification, nutrient uptake analysis, water content, and soil moisture.
- Plant Health Assessment, with emphasis on disease and stress detection, health assessment, and chlorophyll fluorescence.
- Physiological Response Analysis, which includes photosynthesis assessments, light absorption studies, and temperature response.
- Phenological and Trait Analysis, focused on detecting phenological phases such as flowering and trait mapping using hyperspectral sensors.
5. Discussion
5.1. Results Analysis
5.2. Main Findings and Limitations
5.3. Future Research Directions
6. Conclusions
Author Contributions
Funding
Data Availability Statement
Conflicts of Interest
Abbreviations
| CNN | Convolutional Neural Network |
| DTI | Difference Texture Index |
| IoT | Internet of Things |
| LAI | Leaf Area Index |
| LiDAR | Light Detection and Ranging |
| PRISMA | Preferred Reporting Items for Systematic Reviews and Meta-Analyses |
| SVM | Support Vector Machines |
| ToF | Time-of-Flight |
| TCSPC | Time-Correlated Single-Photon Counting |
| UAVs | Unmanned Aerial Vehicles |
References
- Morales-Guerra, J.; Suarez-Cortez, S.; Morales-Duran, J.; Reyes-Vera, E.; Botero-Valencia, J. SmartGrow DataControl: An IoT architecture for the acquisition of environmental physiological parameters in Cannabis sativa cultivations. SoftwareX 2024, 27, 101880. [Google Scholar] [CrossRef]
- Lai, X.; Ge, X.; Li, J.; Zhu, J.; Du, P. Regulating the luminescence properties of Eu2W3O12 red-emitting phosphor via rare-earth ions doping for optical thermometry, white light-emitting diode and plant growth applications. J. Lumin. 2024, 275, 120815. [Google Scholar] [CrossRef]
- Peng, Y.; Ma, X.; Wang, Y.; Li, M.; Gao, F.; Zhou, K.; Aemixay, V. Energy performance assessment of photovoltaic greenhouses in summer based on coupled optical-electrical-thermal models and plant growth requirements. Energy Convers. Manag. 2023, 287, 117086. [Google Scholar] [CrossRef]
- Chakradhar, S.P.; Krushna, B.R.; Sharma, S.; Tripathi, S.; Indhu, C.; Jaiganesh, I.; Manjunatha, K.; Wu, S.Y.; Das, B.; Nagabhushana, H. Novel red-emitting CDs@LaCaAl3O7:Eu3+ nanocomposites: A sustainable breakthrough for optical thermometry, indoor plant growth and intelligent security labels. Mater. Chem. Phys. 2025, 335, 130540. [Google Scholar] [CrossRef]
- Dandrifosse, S.; Bouvry, A.; Leemans, V.; Dumont, B.; Mercatoris, B. Imaging wheat canopy through stereo vision: Overcoming the challenges of the laboratory to field transition for morphological features extraction. Front. Plant Sci. 2020, 11, 96. [Google Scholar] [CrossRef] [PubMed]
- Sampaio, G.S.; Silva, L.A.; Marengoni, M. 3D Reconstruction of Non-Rigid Plants and Sensor Data Fusion for Agriculture Phenotyping. Sensors 2021, 21, 4115. [Google Scholar] [CrossRef] [PubMed]
- Song, P.; Li, Z.; Yang, M.; Shao, Y.; Pu, Z.; Yang, W.; Zhai, R. Dynamic detection of three-dimensional crop phenotypes based on a consumer-grade RGB-D camera. Front. Plant Sci. 2023, 14, 1097725. [Google Scholar] [CrossRef] [PubMed]
- Kim, W.S.; Lee, D.H.; Kim, Y.J.; Kim, T.; Lee, W.S.; Choi, C.H. Stereo-vision-based crop height estimation for agricultural robots. Comput. Electron. Agric. 2021, 181, 105937. [Google Scholar] [CrossRef]
- Zhu, Q.; Bai, M.; Yu, M. Maize Phenotypic Parameters Based on the Constrained Region Point Cloud Phenotyping Algorithm as a Developed Method. Agronomy 2024, 14, 2446. [Google Scholar] [CrossRef]
- Bao, Y.; Tang, L.; Srinivasan, S.; Schnable, P.S. Field-based architectural traits characterisation of maize plant using time-of-flight 3D imaging. Biosyst. Eng. 2019, 178, 86–101. [Google Scholar] [CrossRef]
- Wang, C.; Yang, S.; Zhu, P.; Zhang, L. Extraction of Winter Wheat Planting Plots with Complex Structures from Multispectral Remote Sensing Images Based on the Modified Segformer Model. Agronomy 2024, 14, 2433. [Google Scholar] [CrossRef]
- Franchetti, B.; Ntouskos, V.; Giuliani, P.; Herman, T.; Barnes, L.; Pirri, F. Vision based modeling of plants phenotyping in vertical farming under artificial lighting. Sensors 2019, 19, 4378. [Google Scholar] [CrossRef] [PubMed]
- Paulus, S. Measuring crops in 3D: Using geometry for plant phenotyping. Plant Methods 2019, 15, 103. [Google Scholar] [CrossRef] [PubMed]
- Akhtar, M.S.; Zafar, Z.; Nawaz, R.; Fraz, M.M. Unlocking plant secrets: A systematic review of 3D imaging in plant phenotyping techniques. Comput. Electron. Agric. 2024, 222, 109033. [Google Scholar] [CrossRef]
- Li, Y.; Li, C.; Cheng, Q.; Duan, F.; Zhai, W.; Li, Z.; Mao, B.; Ding, F.; Kuang, X.; Chen, Z. Estimating Maize Crop Height and Aboveground Biomass Using Multi-Source Unmanned Aerial Vehicle Remote Sensing and Optuna-Optimized Ensemble Learning Algorithms. Remote Sens. 2024, 16, 3176. [Google Scholar] [CrossRef]
- Sun, X.; Yang, Z.; Su, P.; Wei, K.; Wang, Z.; Yang, C.; Wang, C.; Qin, M.; Xiao, L.; Yang, W.; et al. Non-destructive monitoring of maize LAI by fusing UAV spectral and textural features. Front. Plant Sci. 2023, 14, 1158837. [Google Scholar] [CrossRef] [PubMed]
- Wang, W.; Xie, J.; Zhong, Y.; Su, T.; Li, X.; Pan, Y.; Wei, X.; Li, Y. BaGa12O19: Cr3+/Mn2+ phosphors for optical thermometry and plant growth lighting applications. J. Photochem. Photobiol. A Chem. 2025, 462, 116223. [Google Scholar] [CrossRef]
- Mitra, M.; Haldar, D.; Patel, N. Understanding tea plantation growth stages and cultural operations by synergy of optical and Synthetic Aperture Radar (SAR) indices. J. Spat. Sci. 2024, 1–12. [Google Scholar] [CrossRef]
- Varas, S.; Rodríguez, J.; Santos Gonzales, C. Development of an artificial vision algorithm to detect the Huanglonbing disease in the citrus lemon plant of the “Fundo Amada”. In Proceedings of the 22nd LACCEI International Multi-Conference for Engineering, Education and Technology (LACCEI 2024), San Jose, Costa Rica, 17–19 July 2024. [Google Scholar] [CrossRef]
- Gonzalez, R.C. Digital Image Processing; Springer: Berlin/Heidelberg, Germany, 2009. [Google Scholar]
- Sun, D.W. Hyperspectral Imaging for Food Quality Analysis and Control; Elsevier: Amsterdam, The Netherlands, 2010. [Google Scholar]
- Lu, B.; Dao, P.D.; Liu, J.; He, Y.; Shang, J. Recent advances of hyperspectral imaging technology and applications in agriculture. Remote Sens. 2020, 12, 2659. [Google Scholar] [CrossRef]
- Ram, B.G.; Oduor, P.; Igathinathane, C.; Howatt, K.; Sun, X. A systematic review of hyperspectral imaging in precision agriculture: Analysis of its current state and future prospects. Comput. Electron. Agric. 2024, 222, 109037. [Google Scholar] [CrossRef]
- Guo, Q.; Wu, F.; Pang, S.; Zhao, X.; Chen, L.; Liu, J.; Xue, B.; Xu, G.; Li, L.; Jing, H.; et al. Crop 3D—A LiDAR based platform for 3D high-throughput crop phenotyping. Sci. China Life Sci. 2018, 61, 328–339. [Google Scholar] [CrossRef] [PubMed]
- Forero, M.G.; Murcia, H.F.; Méndez, D.; Betancourt-Lozano, J. LiDAR platform for acquisition of 3D plant phenotyping database. Plants 2022, 11, 2199. [Google Scholar] [CrossRef] [PubMed]
- Ruigrok, T.; van Henten, E.J.; Kootstra, G. Stereo Vision for Plant Detection in Dense Scenes. Sensors 2024, 24, 1942. [Google Scholar] [CrossRef] [PubMed]
- Albani, J.R. Principles and Applications of Fluorescence Spectroscopy; John Wiley & Sons: Hoboken, NJ, USA, 2008. [Google Scholar]
- Zacharioudaki, D.E.; Fitilis, I.; Kotti, M. Review of fluorescence spectroscopy in environmental quality applications. Molecules 2022, 27, 4801. [Google Scholar] [CrossRef] [PubMed]
- Belasque Jr, J.; Gasparoto, M.; Marcassa, L.G. Detection of mechanical and disease stresses in citrus plants by fluorescence spectroscopy. Appl. Opt. 2008, 47, 1922–1926. [Google Scholar] [CrossRef] [PubMed]
- Xia, Q.; Tang, H.; Fu, L.; Tan, J.; Govindjee, G.; Guo, Y. Determination of Fv/Fm from chlorophyll a fluorescence without dark adaptation by an LSSVM model. Plant Phenomics 2023, 5, 0034. [Google Scholar] [CrossRef] [PubMed]
- Arya, S.; Sahoo, R.N.; Sehgal, V.; Bandyopadhyay, K.; Rejith, R.; Chinnusamy, V.; Kumar, S.; Kumar, S.; Manjaiah, K. High-throughput chlorophyll fluorescence image-based phenotyping for water deficit stress tolerance in wheat. Plant Physiol. Rep. 2024, 29, 278–293. [Google Scholar] [CrossRef]
- Page, M.J.; McKenzie, J.E.; Bossuyt, P.M.; Boutron, I.; Hoffmann, T.C.; Mulrow, C.D.; Shamseer, L.; Tetzlaff, J.M.; Akl, E.A.; Brennan, S.E.; et al. The PRISMA 2020 statement: An updated guideline for reporting systematic reviews. BMJ 2021, 372, n71. [Google Scholar] [CrossRef] [PubMed]
- Zapata-Londoño, J.D.; Botero-Valencia, J.S.; García-Pineda, V.; Vera, E.R.; Hernández-García, R. A Comprehensive Review of Optical and AI-based Approaches for Plant Growth Assessment. 2025. Available online: https://doi.org/10.17605/osf.io/g4hkq (accessed on 18 July 2025).
- Mongeon, P.; Paul-Hus, A. The journal coverage of Web of Science and Scopus: A comparative analysis. Scientometrics 2016, 106, 213–228. [Google Scholar] [CrossRef]
- Oyege, I.; Balaji Bhaskar, M.S. Evaluation of vermicompost and vermicompost tea application on corn (Zea mays) growth and physiology using optical plant sensors. J. Plant Nutr. 2025, 48, 1275–1293. [Google Scholar] [CrossRef]
- El-naggar, A.M.; Heiba, Z.K.; Kamal, A.M.; Mohamed, M.B. Adaptation and development in the optical and fluorescence features of PMMA-ZnMoO4 nanocomposites films. J. Mater. Sci. Mater. Electron. 2025, 36, 1006–1022. [Google Scholar] [CrossRef]
- Walter, A.; Scharr, H.; Gilmer, F.; Zierer, R.; Nagel, K.A.; Ernst, M.; Wiese, A.; Virnich, O.; Christ, M.M.; Uhlig, B.; et al. Dynamics of seedling growth acclimation towards altered light conditions can be quantified via GROWSCREEN: A setup and procedure designed for rapid optical phenotyping of different plant species. New Phytol. 2007, 174, 447–455. [Google Scholar] [CrossRef] [PubMed]
- Wang, M.; Han, Z.; Huang, J.; Liao, J.; Sun, Y.; Huang, H.; Wen, H.R. NaLaMgWO6:Mn4+/Pr3+/Bi3+ bifunctional phosphors for optical thermometer and plant growth illumination matching phytochrome PR and PFR. Spectrochim. Acta Part A Mol. Biomol. Spectrosc. 2021, 259, 119915. [Google Scholar] [CrossRef] [PubMed]
- MANDOLI, D.F.; BRIGGS, W.R. Fiber-optic plant tissues: Spectral dependence in dark-grown and green tissues. Photochem. Photobiol. 1984, 39, 419–424. [Google Scholar] [CrossRef]
- Barron, J.; Liptay, A. Measuring 3-D plant growth using optical flow. Bioimaging 1997, 5, 82–86. [Google Scholar] [CrossRef]
- Murabayashi, A.; Masuko, M.; Niikawa, M.; Shirane, N.; Furuta, T.; Hayashi, Y.; Makisumi, Y. Antifungal and plant growth inhibitory activities of stereo and optical isomers of 2-triazolylcycloalkanol derivatives. J. Pestic. Sci. 1991, 16, 419–427. [Google Scholar] [CrossRef]
- Barron, J.; Liptay, A. Optical flow to measure minute increments in plant growth. Bioimaging 1994, 2, 57–61. [Google Scholar] [CrossRef]
- Han, B.; Zhu, J.; Chu, C.; Yang, X.; Wang, Y.; Li, K.; Hou, Y.; Li, K.; Copner, N.; Teng, P. Sm3+-Mn4+ activated Sr2GdTaO6 red phosphor for plant growth lighting and optical temperature sensing. Sens. Actuators A Phys. 2023, 349, 114089. [Google Scholar] [CrossRef]
- Aoyagi, H.; Jitsufuchi, T.; Tanaka, H. Development of an optical method for monitoring protoplast formation from cultured plant cells. J. Ferment. Bioeng. 1993, 75, 201–206. [Google Scholar] [CrossRef]
- Kato, K.; Tanaka, S.; Fujii, S.; Katayama, M.; Kimoto, H. Preparation of optically active trifluoromethylated (3′-indolyl) thiacarboxylic acids, novel plant growth regulators, through lipase-catalyzed enantioselective hydrolysis. J. Biosci. Bioeng. 1999, 87, 76–81. [Google Scholar] [CrossRef] [PubMed]
- Mi, R.; Liu, Y.g.; Mei, L.; Huang, Z.; Fang, M.; Wu, X.; Min, X. Multi-site occupancies and dependent photoluminescence of Ca9Mg1.5(PO4)7:Eu2+ phosphors: A bifunctional platform for optical thermometer and plant growth lighting. J. Rare Earths 2023, 41, 1503–1511. [Google Scholar] [CrossRef]
- Rofkar, J.R.; Dwyer, D.F.; Frantz, J.M. Analysis of arsenic uptake by plant species selected for growth in Northwest Ohio by inductively coupled plasma–optical emission spectroscopy. Commun. Soil Sci. Plant Anal. 2007, 38, 2505–2517. [Google Scholar] [CrossRef]
- Zhou, J.; Proisy, C.; Couteron, P.; Descombes, X.; Zerubia, J.; le Maire, G.; Nouvellon, Y. Tree crown detection in high resolution optical images during the early growth stages of eucalyptus plantations in Brazil. In Proceedings of the The First Asian Conference on Pattern Recognition, Beijing, China, 28 November 2011; pp. 623–627. [Google Scholar]
- Kato, K.; Katayama, M.; Fujii, S.; Kimoto, H. Effective preparation of optically active 4,4,4-trifluoro-3-(indole-3-)butyric acid, a novel plant growth regulator, using lipase from Pseudomonas fluorescens. J. Ferment. Bioeng. 1996, 82, 355–360. [Google Scholar] [CrossRef]
- Tikhomirov, A.; Sidko, F.Y. Optical characteristics of individual plant elements and plant canopies grown under radiation regimes of different spectral composition and intensity. Appl. Opt. 1983, 22, 2874–2881. [Google Scholar] [CrossRef] [PubMed]
- Aoyagi, H.; Takayanagi, T.; Jitsufuchi, T.; Tanaka, H. Development of an apparatus for monitoring protoplast isolation from plant tissues based on both dielectric and optical methods. J. Biosci. Bioeng. 1999, 87, 762–768. [Google Scholar] [CrossRef] [PubMed]
- Liew, O.W.; Chen, J.W.; Asundi, A.K. Development of fiber optic spectroscopy for in-vitro and in-planta detection of fluorescent proteins. In Advanced Photonic Sensors and Applications II; SPIE: Bellingham, WA, USA, 2001; Volume 4596, pp. 208–218. [Google Scholar]
- Halmann, M. Synthetic plant growth regulators. Adv. Agron. 1990, 43, 47–105. [Google Scholar]
- Tabacco, M.; Zhou, Q.; DiGiuseppe, T. Optical sensors for monitoring and control of plant growth systems. Adv. Space Res. 1994, 14, 223–226. [Google Scholar] [CrossRef] [PubMed]
- Bassini, A.; Musazzi, S.; Paganini, E.; Perini, U.; Ferri, F. Self-aligning optical particle sizer for the monitoring of particle growth processes in industrial plants. Rev. Sci. Instrum. 1998, 69, 2484–2494. [Google Scholar] [CrossRef]
- Ausanka, K.; Asiabanpour, B. Evaluation of a passive optical fiber daylighting system for plant growth. In Proceedings of the 2019 IEEE Texas Power and Energy Conference (TPEC), College Station, TX, USA, 7–8 February 2019; IEEE: Piscataway, NJ, USA, 2019; pp. 1–6. [Google Scholar]
- Leal, M.; Toranzo, A.; Lopez, Y.; Vargas, A. Smart agriculture: An alternative with more efficiency and quality. Ser. Científica Fac. Cienc. Técnicas 2024, 17, 86–98. [Google Scholar]
- Shimizu, H.; Heins, R. Computer-vision-based system for plant growth analysis. Trans. ASAE 1995, 38, 959–964. [Google Scholar] [CrossRef]
- Rabhi, L.; Jabir, B.; Falih, N.; Afraites, L.; Bouikhalene, B. Digital transformation metamodel in smart farming: Crop classification prediction based on recurrent neural network. Foods Raw Mater. 2025, 13, 107–118. [Google Scholar] [CrossRef]
- Bernotas, G.; Scorza, L.C.; Hansen, M.F.; Hales, I.J.; Halliday, K.J.; Smith, L.N.; Smith, M.L.; McCormick, A.J. A photometric stereo-based 3D imaging system using computer vision and deep learning for tracking plant growth. GigaScience 2019, 8, giz056. [Google Scholar] [CrossRef] [PubMed]
- Li, X.; Liu, Z.; Lin, H.; Wang, G.; Sun, H.; Long, J.; Zhang, M. Estimating the growing stem volume of Chinese pine and larch plantations based on fused optical data using an improved variable screening method and stacking algorithm. Remote Sens. 2020, 12, 871. [Google Scholar] [CrossRef]
- Pilipova, V.; Davydov, V.; Rud, V. Development of a fiber-optic system for testing instruments for monitoring nuclear power plants. J. Phys. Conf. Ser. 2021, 2086, 012160. [Google Scholar] [CrossRef]
- Mijares, N.; González, E.; Alaniz, D.; Olvera, E.; Ivanov, R.; De la Rosa, I. Growth Sphere for Optical Measurements in Plants. In Proceedings of the 2020 International Conference on Mechatronics, Electronics and Automotive Engineering (ICMEAE), Cuernavaca, Mexico, 16–21 November 2020; pp. 131–136. [Google Scholar]
- Wu, W.; Zhao, J. 2D Kinematic Quantification of Soil Particles around Growing Plant Root based on Optical Mechanics. Am. J. Biochem. Biotechnol. 2020, 16, 494–506. [Google Scholar] [CrossRef]
- Dutta, P.K.; Mitra, S. Application of agricultural drones and IoT to understand food supply chain during post COVID-19. In Agricultural Informatics: Automation Using the IoT and Machine Learning; Wiley: Hoboken, NJ, USA, 2021; pp. 67–87. [Google Scholar]
- Kawata, Y.; Koizumi, K.; Hashimoto, M.; Sakaya, H. 3D Modeling of Kanazawa City Center from Airborne LiDAR Data. In Proceedings of the 34th Asian Conference on Remote Sensing (ACRS 2013), Bali, Indonesia, 20–24 October 2013; pp. 1372–1379. [Google Scholar]
- Saha, J.K.; Dutta, A. A review of graphene: Material synthesis from biomass sources. Waste and Biomass Valorization; Springer: Berlin/Heidelberg, Germany, 2022; pp. 1–45. [Google Scholar]
- León León, R.A.; Nicolle, G.M.N.; Tirado Palacios, E.T. Development an artificial vision algorithm to detect the Alternaria Alternata disease in the citrus limon plant of the “Fundo Amada”. In Proceedings of the 22nd LACCEI International Multi-Conference for Engineering, Education, and Technology, LACCEI, San Jose, Costa Rica, 17–19 July 2024. [Google Scholar]
- Zheng, C.; Abd-Elrahman, A.; Whitaker, V. Remote sensing and machine learning in crop phenotyping and management, with an emphasis on applications in strawberry farming. Remote Sens. 2021, 13, 531. [Google Scholar] [CrossRef]
- Botero-Valencia, J.; Valencia-Aguirre, J.; Gonzalez-Montoya, D.; Ramos-Paja, C. A low-cost system for real-time measuring of the sunlight incident angle using IoT. HardwareX 2022, 11, e00272. [Google Scholar] [CrossRef] [PubMed]
- Zhao, X.; Ren, L.; Zhang, Y.; Liu, R.; Wang, X. Multi-modal sensing fusion for AI-based phenotyping: Challenges and future directions. Mater. Lett. 2025, 355, 134022. [Google Scholar]
- Yu, H.; Wang, K.; Xie, L.; Zhang, P.; Hu, Y. Sustainable irrigation control using embedded AI and low-cost optical sensors. J. Mater. Sci. Mater. Electron. 2024, 35, 14734–14749. [Google Scholar]
- Jo, H.; Kim, E. New Monte Carlo localization using deep initialization: A three-dimensional LiDAR and a camera fusion approach. IEEE Access 2020, 8, 74485–74496. [Google Scholar] [CrossRef]
- Yang, T.; Jay, S.; Gao, Y.; Liu, S.; Baret, F. The balance between spectral and spatial information to estimate straw cereal plant density at early growth stages from optical sensors. Comput. Electron. Agric. 2023, 215, 108458. [Google Scholar] [CrossRef]
- Ashooriyan, P.; Mohammadi, M.; Darzi, G.N.; Nikzad, M. Development of Plantago ovata seed mucilage and xanthan gum-based edible coating with prominent optical and barrier properties. Int. J. Biol. Macromol. 2023, 248, 125938. [Google Scholar] [CrossRef] [PubMed]
- Yang, C.; Long, J.; Li, B.; Ma, R.; Cao, B.; Deng, C.; Huang, W. Highly thermally stable CaLaMgSbO6:Sm3+ double perovskite phosphors for optical thermometer and plant growth. J. Alloys Compd. 2025, 1010, 177035. [Google Scholar] [CrossRef]
- Wang, F.; Chen, H. Optical properties of novel deep-red phosphor LaMg3SbO7:Mn4+ for temperature sensing and plant growth illumination. J. Alloy. Compd. 2025, 1020, 179582. [Google Scholar] [CrossRef]
- Wang, Z.; Zhou, R.; Liu, N.; Kong, J.; Wang, Y. Remarkable thermal stability of Ca9MgK(VO4)7:Sm3+ phosphor for sensitive optical thermometry and plant-growth lighting. Mater. Res. Bull. 2026, 193, 113647. [Google Scholar] [CrossRef]
- Liu, Q.; Li, X.; Zhang, J.; Sun, W.; Feng, L. Real-time implementation of machine learning-based weed detection using hyperspectral sensors. J. Environ. Chem. Eng. 2025, 13, 109621. [Google Scholar]
- Zhou, J.; He, Q.; Wu, S.; Zhang, L. Characterization of rice crop stages using deep learning with UAV-derived multispectral data. Opt. Laser Technol. 2024, 171, 110132. [Google Scholar]
- Martínez, D.; Valero, C.; Pastor, G.; Gómez, J. Optical-thermal fusion models for biomass prediction in grapevines. Biosyst. Eng. 2025, 230, 34–45. [Google Scholar] [CrossRef]

| Work Title | Country | Methodology | Applications | Key Factors Analyzed |
|---|---|---|---|---|
| Dynamics of seedling growth acclimation towards altered light conditions can be quantified via GROWSCREEN: A setup and procedure designed for rapid optical phenotyping of different plant species [37] | Germany | Image analysis and color segmentation to assess seedling growth Color-based segmentation using HSV to distinguish plants from background | Rapid phenotyping of seedling growth under different light conditions. | Optical phenotyping, Plant growth, Light conditions, Nutrients, Plant growth |
| NaLaMgWO6: Mn4+/Pr3+/Bi3+ bifunctional phosphors for optical thermometer and plant growth illumination matching phytochrome and [38] | China | Synthesis by sol-gel method and spectroscopic analysis | Plant growth illumination and optical thermometry | Photoluminescence, Plant growth illumination, Rare-earth phosphors, Optical sensors |
| Fiber optic plant tissues: spectral dependence in dark-grown and green tissues [39] | United Kingdom | Optical experiments and spectrophotometry on etiolated and green plant tissues | Analysis of light transmission in plant tissues to understand phytochrome-mediated physiological responses | Optical properties, Spectrophotometry, Photobiology, Phytochemistry |
| Measuring 3D plant growth using optical flow [40] | Canada | Optical flow analysis in three-dimensional images | Non-contact 3D measurement of plant growth | artificial vision, Plant growth, 3D analysis, Optical flow |
| Antifungal and Plant Growth Inhibitory Activities of Stereo and Optical Isomers of 2-Triazolylcycloalkanol Derivatives [41] | Japan | Comparison of stereochemical and optical isomers in growth inhibition assays | Evaluation of antifungal and growth-regulating activity in plants | Antifungal activity, Growth regulation, Optical isomerism, Triazolylcycloalkanol |
| Optical flow to measure minute increments in plant growth [42] | Canada | Optical flow analysis in imaging sequences for growth measurement | Accurate non-contact seedling growth measurement | artificial vision, Plant growth, Image analysis, Optical flow |
| Sm3+-Mn4+ activated Sr2GdTaO6 red phosphor for plant growth lighting and optical temperature sensing [43] | China | Rare-earth phosphor synthesis and spectroscopic analysis | Illumination for plant growth and optical temperature sensing | Photoluminescence, Plant growth illumination, Optical thermometry, Rare-earth phosphors |
| Development of an optical method for monitoring protoplast formation from cultured plant cells [44] | Japan | Optical spectrophotometry for optical density monitoring in protoplast formation | Monitoring of cellular processes in plant biotechnology | Plant biotechnology, Protoplasts, Optical monitoring, Enzymatic and Enzyme digestion |
| Preparation of optically active trifluoromethylated (3’-indolyl) thiacarboxylic acids, novel plant growth regulators, through lipase-catalyzed enantioselective hydrolysis [45] | Japan | Enantioselective enzymatic hydrolysis of fluorinated carboxylic acids | Plant growth regulators | Growth regulation, Chemical synthesis, Enantioselectivity, Fluorinated carboxylic acids |
| Multi-site occupancies and dependent photoluminescence of Ca9Mg1.5(PO4)7:Eu2+ phosphors: A bifunctional platform for optical thermometer and plant growth lighting [46] | China | Luminescent materials synthesis and spectroscopic analysis Eu2+-doped phosphors for optical thermometry and plant growth lighting | Illumination for plant growth and optical thermometry | Photoluminescence, Optical thermometry, Illumination of plant growth, Rare-earth phosphors |
| Analysis of arsenic uptake by plant species selected for growth in northwest Ohio by inductively coupled plasma-optical emission spectroscopy [47] | USA | Inductively coupled plasma-optical emission spectroscopy (ICP-OES) for the measurement of arsenic in plant tissues | Evaluation of arsenic phytoremediation in native Ohio plant species | Phytoremediation, Arsenic accumulation, Arsenic accumulation, Optical spectroscopy, Native species |
| Tree crown detection in high resolution optical images during the early growth stages of Eucalyptus plantations in Brazil [48] | Brazil | High resolution optical image analysis Multi-date tree crown detection using marked point process modeling | Tree canopy detection in growing eucalyptus plantations | artificial vision, Optics, Plant growth |
| Effective preparation of optically active 4,4,4-trifluoro-3-(indole-3-)butyric acid, a novel plant growth regulator, using lipase from Pseudomonas fluorescens [49] | USA | Inductively coupled plasma optical emission spectroscopy | Phytoremediation of arsenic in plant species | Optics, Plant growth, Phytoremediation |
| Optical characteristics of individual plant elements and plant canopies grown under radiation regimes of different spectral composition and intensity [50] | USSR | Spectrophotometric reflectance and absorption measurements | Analysis of the impact of different radiation regimes on photosynthesis | Plant optics, Radiation regimes, Spectral analysis, Photosynthesis, Plant optics, Photosynthesis |
| Development of an apparatus for monitoring protoplast isolation from plant tissues based on both dielectric and optical methods [51] | Japan | Optical and dielectric method for protoplast isolation monitoring | Isolation and monitoring of protoplasts in cultures | Optics, Biotechnology, Plant growth |
| Development of fiber optic spectroscopy for in vitro and in planta detection of fluorescent proteins [52] | Singapore | Fiber optic spectroscopy for fluorescent protein detection | Protein monitoring in genetically engineered plants | Optics, Spectroscopy, Transgenic crops |
| Synthetic plant growth regulators [53] | Israel | Analysis of synthetic plant growth regulators | Optimization of crop growth by chemical regulators | Plant growth, Plant growth regulators, Agricultural chemistry |
| Optical sensors for monitoring and control of plant growth systems [54] | USA | Optical sensors with optical fibers and porous polymers | Nutrient and contaminant monitoring in plant growth systems | Optics, Crop monitoring, Plant growth |
| Self-aligning optical particle sizer for the monitoring of particle growth processes in industrial plants [55] | Italy | Optical particle measurement system Diffraction and extinction based particle sizing for process monitoring | Particulate growth monitoring in industrial plants | Optics, Particle measurement, Industry |
| Evaluation of a passive optical fiber daylighting system for plant growth [56] | USA | Passive fiber optic lighting system | Cultivation of plants in closed environments | Optics, Illumination, Plant growth |
| Smart agriculture: an alternative with more efficiency and quality [57] | Cuba | Intelligent farming system with sensors and machine learning | Resource optimization and agricultural production | artificial vision, Automation, Plant growth |
| Computer-vision-based system for plant growth analysis [58] | USA | Computer vision and automatic analysis Infrared-based 3D computer vision for plant growth analysis | Computer vision analysis of plant growth | Artificial vision, Plant growth, Automated analysis |
| Digital transformation metamodel in smart farming: Crop classification prediction based on recurrent neural network [59] | Morocco | Recurrent neural networks for crop classification | Crop prediction and classification in digital agriculture | Digital agriculture, Neural networks, Crop classification, Business modeling |
| A photometric stereo-based 3D imaging system using computer vision and deep learning for tracking plant growth [60] | China | Photometric stereo and deep learning | Three-dimensional plant growth monitoring | Three-dimensional imaging, Deep learning, artificial vision, Plant growth |
| Estimating the Growing Stem Volume of Chinese Pine and Larch Plantations based on Fused Optical Data Using an Improved Variable Screening Method and Stacking Algorithm [61] | Russia | Remote sensing and machine learning algorithms | Estimation of stem growth volume in forest plantations | Remote sensing, Machine learning, Forestry management |
| Regulating the luminescence properties of Eu2W3O12 red-emitting phosphor via rare-earth ions doping for optical thermometry [2] | China | Luminescence and doping of rare earth ions | Optical thermometry and plant growth enhancement | Luminescence, Optical thermometry, Plant growth, Rare-earth ions |
| Development of a fiber-optic system for testing instruments for monitoring nuclear power plants [62] | Russia | Fiber optics and pulsed laser radiation | Testing of instruments for monitoring nuclear power plants | Fiber optics, Laser radiation, Instrumentation, Nuclear monitoring |
| Growth Sphere for Optical Measurements in Plants [63] | Mexico | Optical measurement techniques | Measuring plant growth with optical technologies | Plant growth, Optical measurements, Growth analysis |
| Development of an artificial vision algorithm to detect the Huanglonbing (HLB) disease in the citrus lemon plant of the “Fundo Amada” [19] | Peru | Convolutional neural networks | Detection of citrus diseases by artificial vision | artificial vision, Disease detection, Neural networks, Citrus plants |
| 2D kinematic quantification of soil particles around growing plant root based on optical mechanics [64] | China | Digital image correlation for ground deformation measurement | Analysis of soil deformation around roots using optical mechanics | Soil deformation, Root interaction, Digital image correlation, Kinematic analysis |
| Applications | Vision AI Tools | Optical Tools | AI Techniques |
|---|---|---|---|
| Real-time Crop Monitoring [54] | Multi-spectral image classification | Near-infrared spectroscopy | Support Vector Machines (SVM) |
| Leaf Area Estimation [15] | Hyperspectral image processing | Multispectral cameras | Random Forest (RF) |
| Root Structure Analysis [69] | LIDAR-based root mapping | Laser scanning systems | Reinforcement Learning |
| Early Disease Detection [19] | CNN for disease identification | UV-induced fluorescence | Neural Networks |
| Photosynthesis Efficiency Assessment [60] | AI-driven chlorophyll fluorescence tracking | Passive optical fiber daylighting | Principal Component Analysis (PCA) |
| Soil Moisture Estimation [64] | Remote sensing image fusion | Thermal imaging | Clustering Algorithms |
| Automated Phenotyping [50] | AI-driven phenotypic trait analysis | Structured lighting systems | Self-learning AI models |
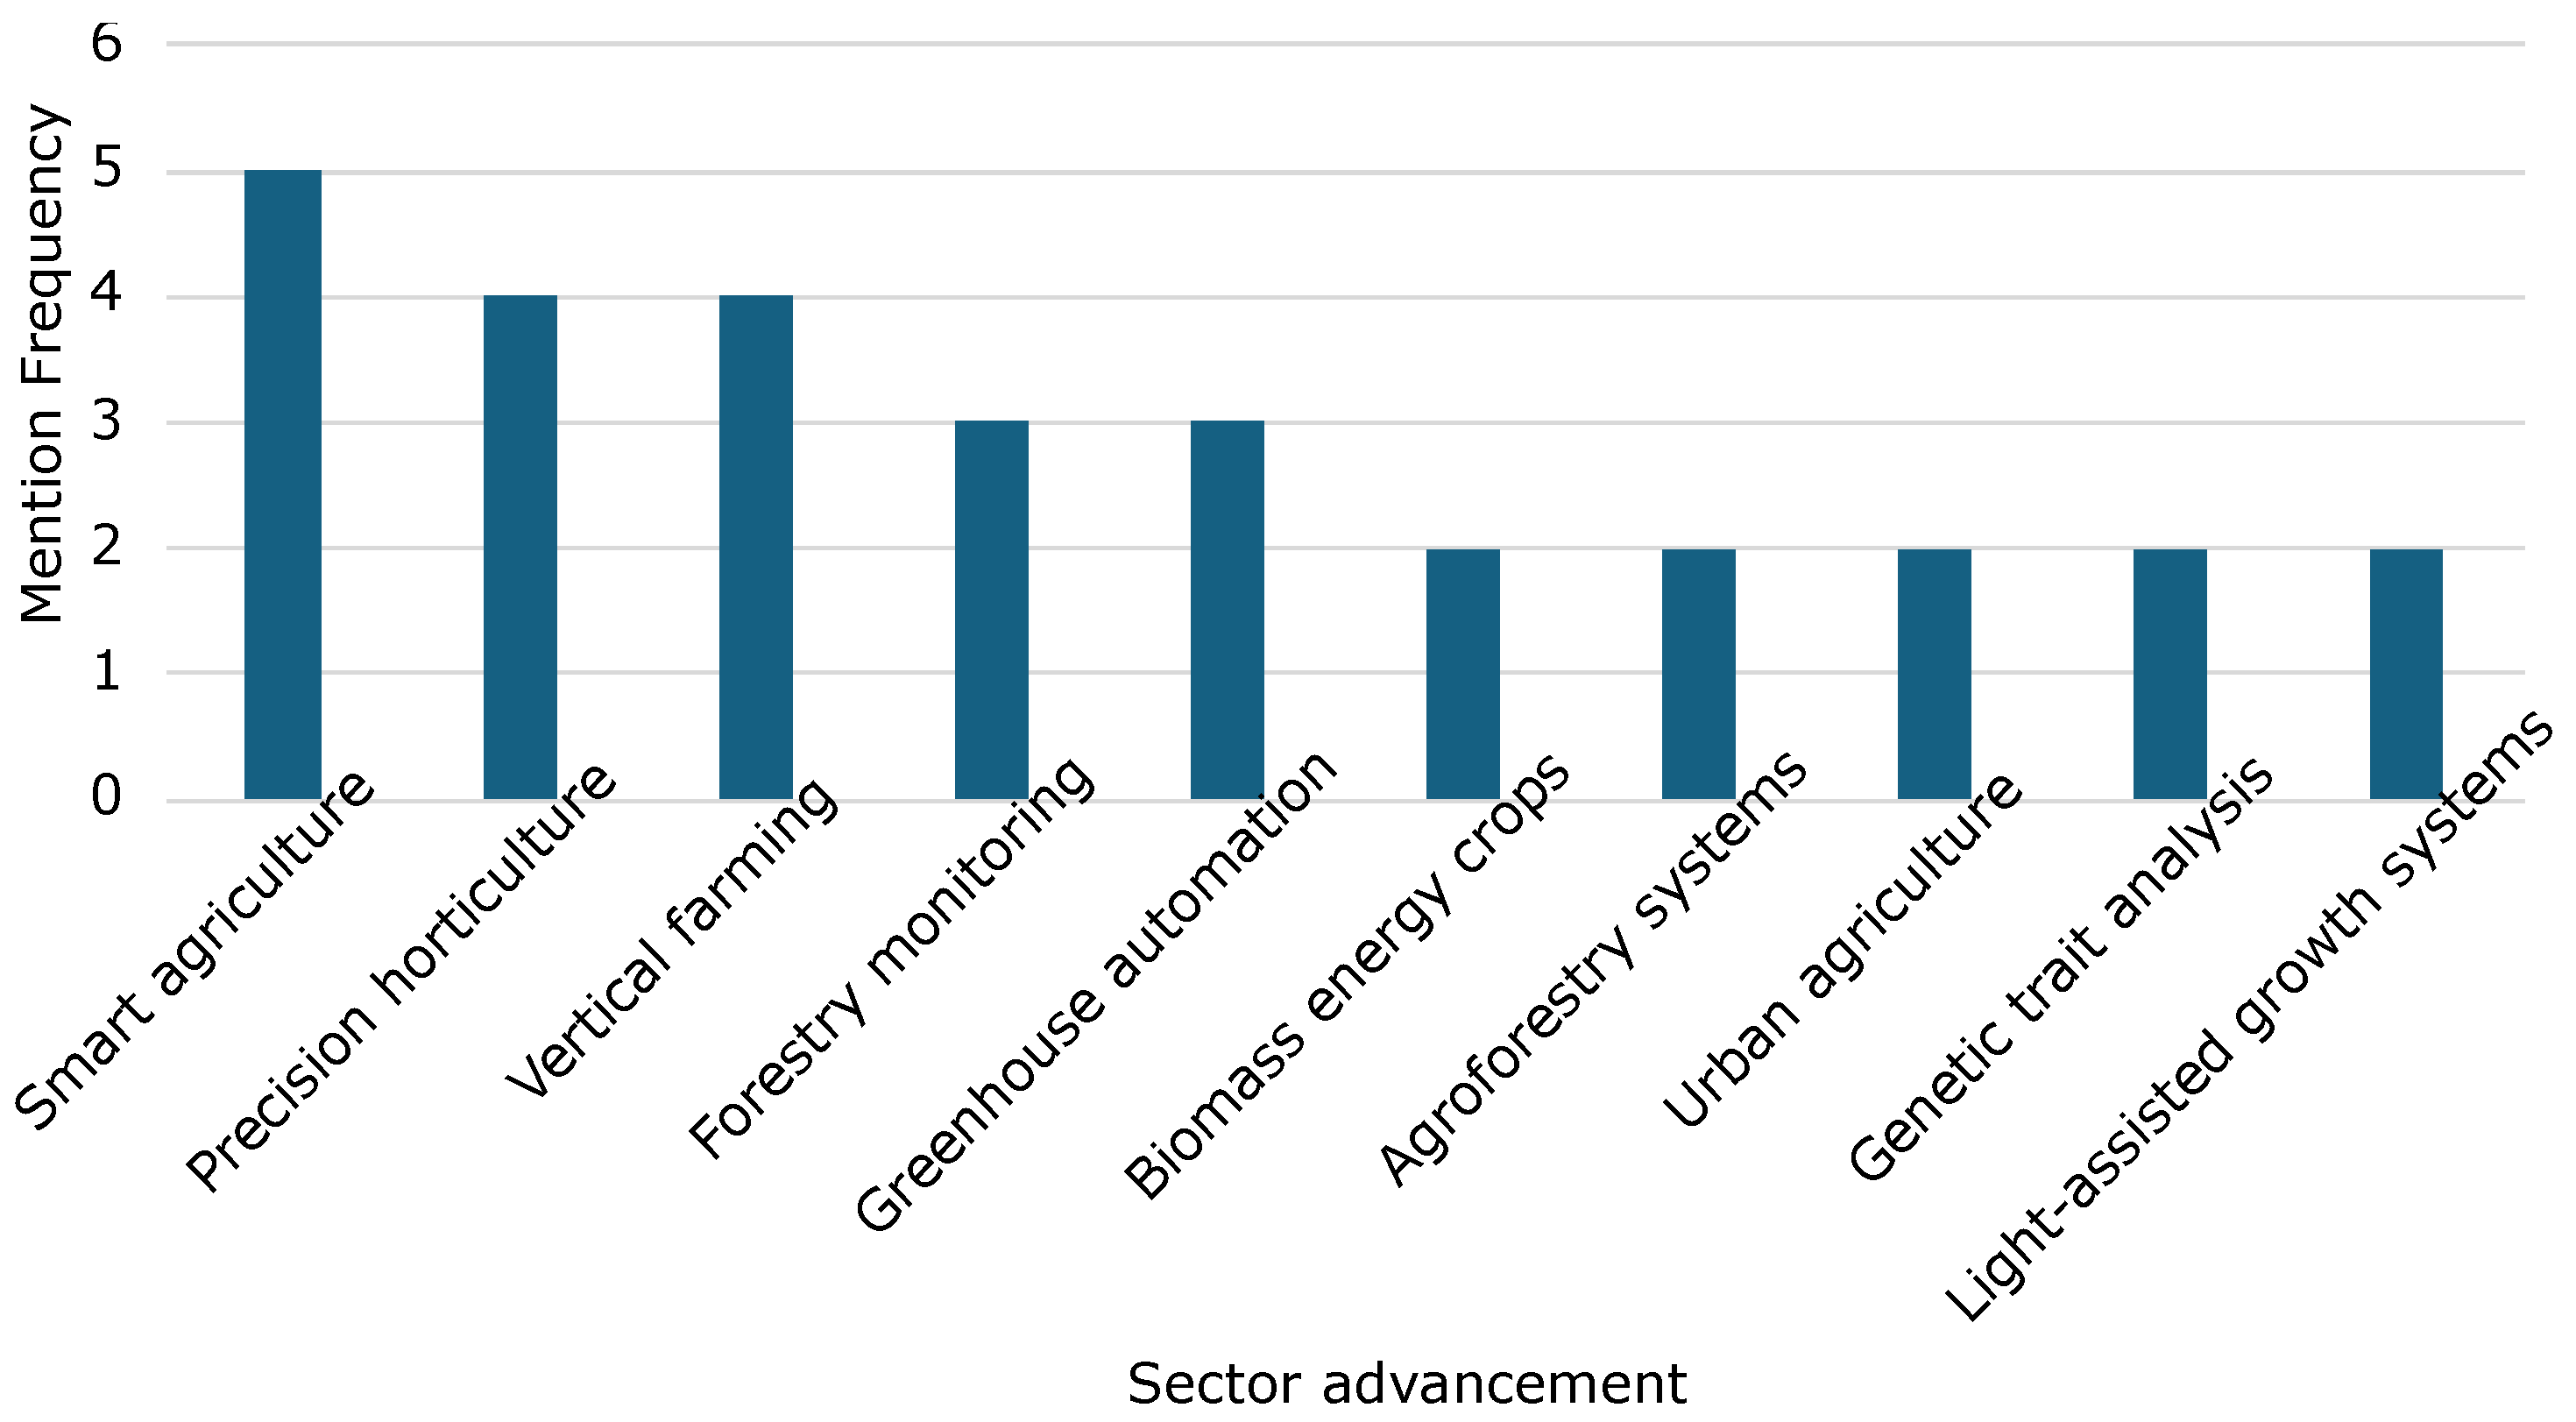
| Challenge | Description | Sector |
|---|---|---|
| Real-time plant monitoring [1,70] | Ensuring continuous, real-time plant growth monitoring | Smart agriculture |
| High-resolution imaging costs [8] | Reducing the cost of high-resolution imaging technologies | Precision horticulture |
| Data processing scalability [48,69] | Managing large-scale plant imaging and processing efficiently | Data science in agriculture |
| Multi-sensor data fusion [71] | Integrating data from multiple imaging and sensor sources | Remote sensing |
| Light spectrum optimization [2] | Optimizing light conditions for maximum plant growth | Greenhouse automation |
| Disease early detection [19] | Detecting diseases at early stages for proactive treatment | Crop protection |
| Automated phenotyping [69] | Automating the collection of plant traits using AI | Plant breeding |
| Plant-water interaction analysis [72] | Analyzing how plants interact with water at a micro-level | Water resource management |
| Environmental variability impact [3] | Understanding how environmental changes affect plant growth | Climate adaptation studies |
| Non-invasive nutrient assessment [35] | Developing non-invasive methods for analyzing plant nutrients | Soil and nutrient management |
Disclaimer/Publisher’s Note: The statements, opinions and data contained in all publications are solely those of the individual author(s) and contributor(s) and not of MDPI and/or the editor(s). MDPI and/or the editor(s) disclaim responsibility for any injury to people or property resulting from any ideas, methods, instructions or products referred to in the content. |
© 2025 by the authors. Licensee MDPI, Basel, Switzerland. This article is an open access article distributed under the terms and conditions of the Creative Commons Attribution (CC BY) license (https://creativecommons.org/licenses/by/4.0/).
Share and Cite
Zapata-Londoño, J.; Botero-Valencia, J.; García-Pineda, V.; Reyes-Vera, E.; Hernández-García, R. A Comprehensive Review of Optical and AI-Based Approaches for Plant Growth Assessment. Agronomy 2025, 15, 1781. https://doi.org/10.3390/agronomy15081781
Zapata-Londoño J, Botero-Valencia J, García-Pineda V, Reyes-Vera E, Hernández-García R. A Comprehensive Review of Optical and AI-Based Approaches for Plant Growth Assessment. Agronomy. 2025; 15(8):1781. https://doi.org/10.3390/agronomy15081781
Chicago/Turabian StyleZapata-Londoño, Juan, Juan Botero-Valencia, Vanessa García-Pineda, Erick Reyes-Vera, and Ruber Hernández-García. 2025. "A Comprehensive Review of Optical and AI-Based Approaches for Plant Growth Assessment" Agronomy 15, no. 8: 1781. https://doi.org/10.3390/agronomy15081781
APA StyleZapata-Londoño, J., Botero-Valencia, J., García-Pineda, V., Reyes-Vera, E., & Hernández-García, R. (2025). A Comprehensive Review of Optical and AI-Based Approaches for Plant Growth Assessment. Agronomy, 15(8), 1781. https://doi.org/10.3390/agronomy15081781