Article

Carbon Footprint and Energy Balance Analysis of Rice-Wheat Rotation System in East China

1
Jiangsu Key Laboratory of Crop Genetics and Physiology/Jiangsu Key Laboratory of Crop Cultivation and Physiology, Agricultural College of Yangzhou University, Yangzhou 225009, China
2
Jiangsu Co-Innovation Center for Modern Production Technology of Grain Crops, Yangzhou University, Yangzhou 225009, China
3
Research Institute of Rice Industrial Engineering Technology, Yangzhou University, Yangzhou 225009, China
*
Author to whom correspondence should be addressed.
Agronomy 2025, 15(8), 1778; https://doi.org/10.3390/agronomy15081778
Submission received: 30 May 2025 / Revised: 16 July 2025 / Accepted: 20 July 2025 / Published: 24 July 2025
(This article belongs to the Section Agroecology Innovation: Achieving System Resilience)

Abstract

The rice-wheat rotation is the main agricultural cropping system in Jiangsu Province, playing a vital role in ensuring food security and promoting economic development. However, current research on rice-wheat systems mainly focuses on in-situ controlled experiments at the point scale, with limited studies addressing carbon footprint (CF) and energy balance (EB) at the regional scale and long time series. Therefore, we analyzed the evolution patterns of the CF and EB of the rice-wheat system in Jiangsu Province from 1980 to 2022, as well as their influencing factors. The results showed that the sown area and total yield of rice and wheat exhibited an increasing–decreasing–increasing trend during 1980–2022, while the yield per unit area increased continuously. The CF of rice and wheat increased by 4172.27 kg CO2 eq ha−1 and 2729.18 kg CO2 eq ha−1, respectively, with the greenhouse gas emissions intensity (GHGI) showing a fluctuating upward trend. Furthermore, CH4 emission, nitrogen (N) fertilizer, and irrigation were the main factors affecting the CF of rice, with proportions of 36%, 20.26%, and 17.34%, respectively. For wheat, N fertilizer, agricultural diesel, compound fertilizer, and total N2O emission were the primary contributors, accounting for 42.39%, 22.54%, 13.65%, and 13.14%, respectively. Among energy balances, the net energy (NE) of rice exhibited an increasing and then fluctuating trend, while that of wheat remained relatively stable. The energy utilization efficiency (EUE), energy productivity (EPD), and energy profitability (EPF) of rice showed an increasing and then decreasing trend, while wheat decreased by 46.31%, 46.31%, and 60.62% during 43 years, respectively. Additionally, N fertilizer, agricultural diesel, and compound fertilizer accounted for 43.91–45.37%, 21.63–25.81%, and 12.46–20.37% of energy input for rice and wheat, respectively. Moreover, emission factors and energy coefficients may vary over time, which is an important consideration in the analysis of long-term time series. This study analyzes the ecological and environmental effects of the rice-wheat system in Jiangsu Province, which helps to promote the development of agriculture in a green, low-carbon, and high-efficiency direction. It also offers a theoretical basis for constructing a low-carbon sustainable agricultural production system.

1. Introduction

Rice and wheat, as the main food crops in China, play an important role in ensuring national food security and supporting economic development [1]. The rice-wheat system is the predominant agricultural rotation pattern in Jiangsu Province, and the sown areas of rice and wheat reached 2.34 × 10⁶ ha and 2.21 × 10⁶ ha, with total yields of 13.47 × 10⁶ t and 19.99 × 10⁶ t in 2022, respectively [2]. However, this rotation system faces several challenges, including excessive nitrogen (N) fertilizer application and high methane (CH4) emission [3]. Additionally, the substantial use of irrigation water, diesel fuel, and other agricultural materials leads to an increase in energy consumption and greenhouse gas (GHG) emissions, which not only threaten the sustainable development of agroecosystems but also contribute negatively to global climate change [4]. Therefore, how to improve resource utilization efficiency, reduce energy consumption, and reduce GHG emissions has become a pressing issue.
Carbon footprint (CF) is defined as the aggregate quantity of greenhouse gases released, both directly and indirectly, over the entire life cycle of crop production, and this concept has been widely used globally to quantify the carbon inputs associated with agricultural production over the past few decades [5,6,7]. In recent years, increasing attention has been given to studying agricultural production from the perspective of CF [8]. Studies have shown that the CF per unit of yield of the rice-wheat rotation system increased by 38% and 50% in Jiangsu Province, respectively, compared with the rice-oil and the rice-green manure rotation systems [9]. Among various agricultural materials, N fertilizer and agricultural diesel are the main factors affecting the CF [10]. Therefore, there is a need for a systematic study of this system to promote its development in a low-carbon direction.
Energy analysis of agricultural systems involves a comprehensive assessment of energy input and energy output, which helps to improve resource use efficiency and promote the development of agriculture in a sustainable direction. Agricultural energy demand has surged markedly during the past several years, rising from 42.33 × 10⁶ t in 2000 to 80.55 × 10⁶ t in 2013 [11,12,13,14]. Yang et al. (2015) and Jin et al. (2021) demonstrated that the rice–wheat rotation exhibits pronounced reliance on non-renewable energy, particularly N fertilizer and irrigation water [15,16]. Therefore, there is an urgent need to optimize the structure of agricultural energy use, improve energy use efficiency, and reduce energy input from non-renewable resources.
An integrated analysis of CF and energy balance (EB) can help reduce GHG emissions and improve energy utilization efficiency, thereby promoting the sustainable development of agroecosystems. Wu et al. (2017) reported that both GHG emissions and energy consumption of crop production increased from 1990 to 2014, primarily driven by the rapid growth of agricultural machinery and synthetic fertilizer application [17]. Choudhary et al. (2022) also showed that conventional tillage required 17.2% more energy than no-tillage, and the energy utilization efficiency (EUE), energy productivity (EPD), energy profitability (EPF), and carbon use efficiency of no-tillage increased by 16.60%, 21%, 16.60%, and 8.24%, respectively [18]. Combining CF and energy analyses is an important approach to studying the ecological effects of agricultural systems, but current research focusing on rice-wheat systems is inadequate. Therefore, we analyze the changes in sown area, total yield, and yield per unit area of rice and wheat in Jiangsu Province from 1980 to 2022, explore the interannual changes in the CF and EB of the rice-wheat system, and elucidate the key factors affecting GHG emissions and energy input. This not only contributes to advancing low-carbon, green, and sustainable agriculture but also facilitates the construction of sustainable agricultural systems that are resource-saving, production-efficient, and eco-friendly.

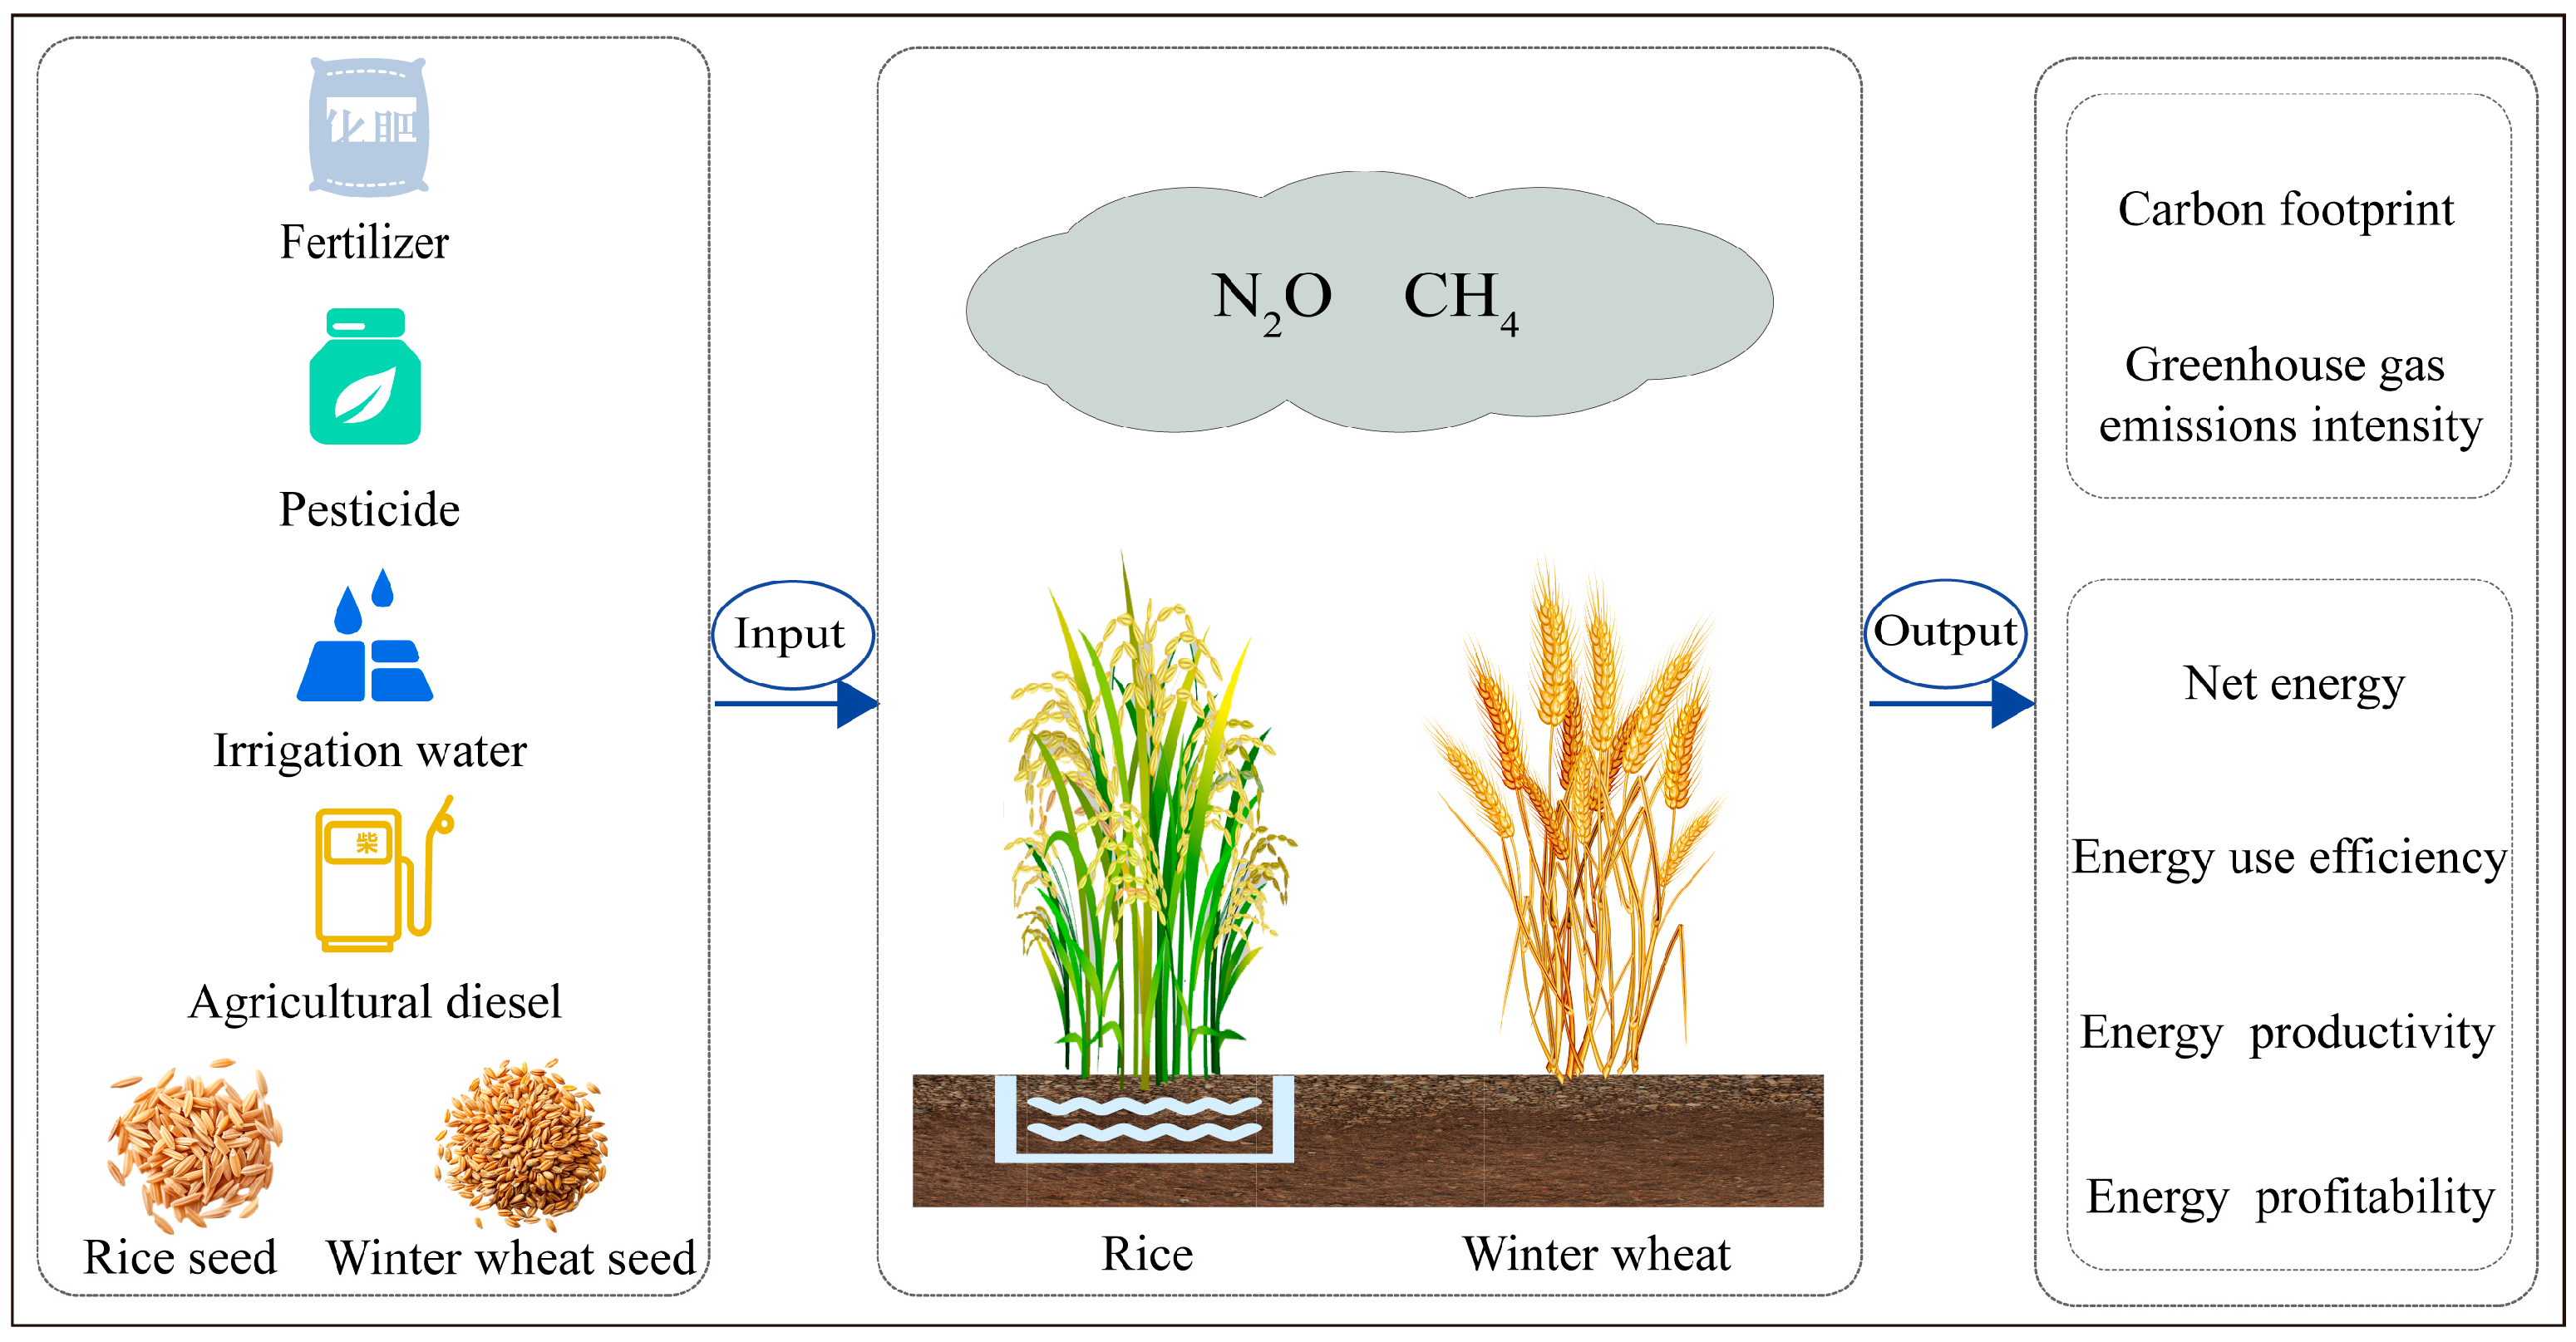
2. Materials and Methods

2.1. Data Sources

In this study, the sown area, yield per unit area, and total yield of rice and wheat from 1980 to 2022 were obtained from the statistical yearbook of Jiangsu Province, and the number of inputs and input costs of each agricultural material in rice and wheat cultivation were collected in the cost-benefit data of national agricultural products (Table 1). The amount of pesticides and agricultural diesel is calculated from the cost of both and the sales price for the year, and the data on selling prices were obtained from the China Price Yearbook. Agricultural irrigation water use per unit area of rice was obtained from the water resources bulletin of Jiangsu Province (http://jswater.jiangsu.gov.cn/col/col84437/index.html, accessed on 29 May 2025). In addition, we fit the collected year data to the time series either linearly or nonlinearly and obtained data for missing years according to the formula [19]. The system boundary of the rice-wheat rotation system is shown in Figure 1.

2.2. Carbon Footprint

CF denotes the cumulative greenhouse gas emissions generated during the cultivation of rice and wheat, which are categorized into direct GHG emissions and indirect GHG emissions [20]. It was calculated as follows:
C F = G W P i n d i r e c t + G W P d i r e c t
where, GWPdirect (kg CO2 eq ha−1) is the direct GHG emissions. GWPindirect (kg CO2 eq ha−1) is the indirect GHG emissions, and it represents the GHG emissions from the production and transportation of agricultural materials (Table 1), which is calculated as follows:
G W P i n d i r e c t = Q i × E F i
where, Qi and EFi represent the input quantities and corresponding emission factors for various agricultural materials (Table 1).
Table 1. Emission factors of agricultural materials in indirect greenhouse gas emissions.
Emission SourceEmission FactorUnitSource
Nitrogen fertilizer production and transportation8.3kg CO2 eq kg−1[21,22,23,24,25,26,27]
Phosphate fertilizer production and transportation0.79kg CO2 eq kg−1[21,23,24,25,26,27,28]
Potassium fertilizer production and transportation0.55kg CO2 eq kg−1[21,23,24,25,26,27,28]
Compound fertilizer production and transportation2.47kg CO2 eq kg−1[22,29]
Pesticide production and transportation19.12kg CO2 eq kg−1[21,30]
Irrigation water0.29kg CO2 eq m−3[31]
Agricultural diesel3.75kg CO2 eq kg−1[32]
Winter wheat seed transportation0.11kg CO2 eq kg−1[33]
Rice seed transportation0.78kg CO2 eq kg−1[34,35]
GWPdirect consists of two components, total N2O emission and CH4 emission, and it is calculated as follows:
G W P d i r e c t = N 2 O t o t a l + C H 4
where, N2Ototal (kg CO2 eq ha−1) is the total N2O emission, and CH4 (kg CO2 eq ha−1) is the CH4 emission from paddy fields.

2.2.1. N2O Direct and Indirect Emissions

N2Ototal is categorized into N2Odirect (kg CO2 eq ha−1) and N2Oindirect (kg CO2 eq ha−1), and it is calculated as follows:
N 2 O t o t a l = N 2 O d i r e c t + N 2 O i n d i r e c t
N 2 O d i r e c t = N f e r t l i z e r × 0.0041 × 44 28 × 273
where, Nfertlizer (kg ha−1 yr−1) is the amount of N fertilizer, and 0.0041 is the emission factor of N2O from the application of N fertilizer [22]. A 44/28 is the conversion coefficient of N2O-N to N2O, and 273 is the global warming potential (GWP) of N2O [36].
N2Oindirect represents N2O emission from ammonia volatilization (N2OVolatillizd, kg CO2 eq ha−1) and nitrogen leaching (N2Oleached, kg CO2 eq ha−1) [37,38], which is calculated as follows:
N 2 O i n d i r e c t = N 2 O V o l a t i l l i z d + N 2 O l e a c h e d
N 2 O V o l a t i l l i z d = N f e r t l i z e r × 0.179 × 0.010 × 44 28 × 273
where, 0.179 is the fraction of N2OVolatillizd [22], and 0.010 denotes the ratio of NH3-N and NOX-N per kg converted to N2O-N by volatilization [24]. In addition, N2Oleached is calculated by Equation (8):
N 2 O l e a c h e d = N f e r t l i z e r × 0.014 × 0.0075 × 44 28 × 273
where, 0.014 is the fraction of N2Oleached [22], and 0.0075 denotes the ratio of NH3-N and NOX-N per kg converted to N2O-N by volatilization [24].

2.2.2. CH4 Emission

CH4 emission from paddy fields was calculated according to the IPCC method [39], as shown in Equation (9):
C H 4 = T × E F c × S F W × S F p × S F O × 27.9
where, T represents the fertility period (d) of rice as 180 [40]. EFc is the baseline emission factor specific to continuously irrigated rice paddies that do not incorporate organic amendments, which is 1.30 kg CH4 ha−1 d−1 [24]. SFw represents the conversion factor applied to account for varying moisture conditions throughout the planting period, and its value is determined to be 0.78 [24]. SFp is the conversion factor for different moisture conditions before the planting period, and it is 0.68 because this study was conducted in a rice-wheat system with no irrigation for more than 180 days before the rice season [40]. A total of 27.9 is the GWP of CH4 [36]. SFO represents the conversion factor for the change in type and the amounts of organic additives, and it is calculated as follows:
S F o = 1 + i R O A i × C F O A i 0.59
where, ROAi (t ha−1) denotes the quantity of organic amendments applied (compost, farmyard manure, green manure, and rice straw), and CFOAi is the conversion factor of organic amendments. The amounts of different types of organic additives applied were not taken into account in this study, as they cannot be accurately captured in the statistical data, SFO = 1.

2.2.3. Greenhouse Gas Emissions Intensity

The greenhouse gas emissions intensity (GHGI) is employed as an indicator to evaluate the efficiency of GHG [20], and it is calculated as follows:
G H G I = C F / G Y i
where GYi (kg ha−1) represents the yield per unit area of rice or wheat.

2.3. Energy Balance

The EB consists of energy input (Ei) and energy output (Eo), where Ei refers to the energy consumed in the production and transportation of agricultural materials, and it is calculated as follows:
E i = Q i × E E i
where, Qi (kg ha−1) and EEi (MJ Unit−1) are the amount of inputs and energy coefficients of agricultural materials, respectively (Table 2).
Eo is the energy of harvesting rice or wheat yield [41], and it is calculated as follows:
E o = G Y i × E Y i
where, EYi (MJ kg−1) is the energy coefficient of the rice or wheat yield (Table 2).
In this study, we calculated four energy balance indicators, including net energy (NE, MJ ha−1), energy use efficiency (EUE), energy productivity (EPD, kg MJ−1), and energy profitability (EPF), which were calculated as follows:
N E = E 0 E i
E U E = E o E i
E P D = G Y i E i
E P F = N E E i
Table 2. Energy coefficient of agricultural materials.
Energy Input/OutputEnergy FactorUnitSource
Nitrogen fertilizer production and transportation91.0MJ kg−1[42]
Phosphate fertilizer production and transportation13.3MJ kg−1[42]
Potassium fertilizer production and transportation9.0MJ kg−1[42]
Compound fertilizer production and transportation37.77MJ kg−1[42]
Pesticide production and transportation102.0MJ kg−1[42]
Irrigation water1.02MJ m−3[43]
Agricultural diesel44MJ kg−1[42]
Winter wheat seed transportation5.57MJ kg−1[42]
Rice seed transportation15.1MJ kg−1[42]
Energy Output
Wheat yield16.3MJ kg−1[42]
Rice yield15.9MJ kg−1[44]

2.4. Statistics and Analysis of Data

In this study, the data were organized using Microsoft Excel and visualized using the ggplot2 package in R software (version 3.6.1).

3. Results

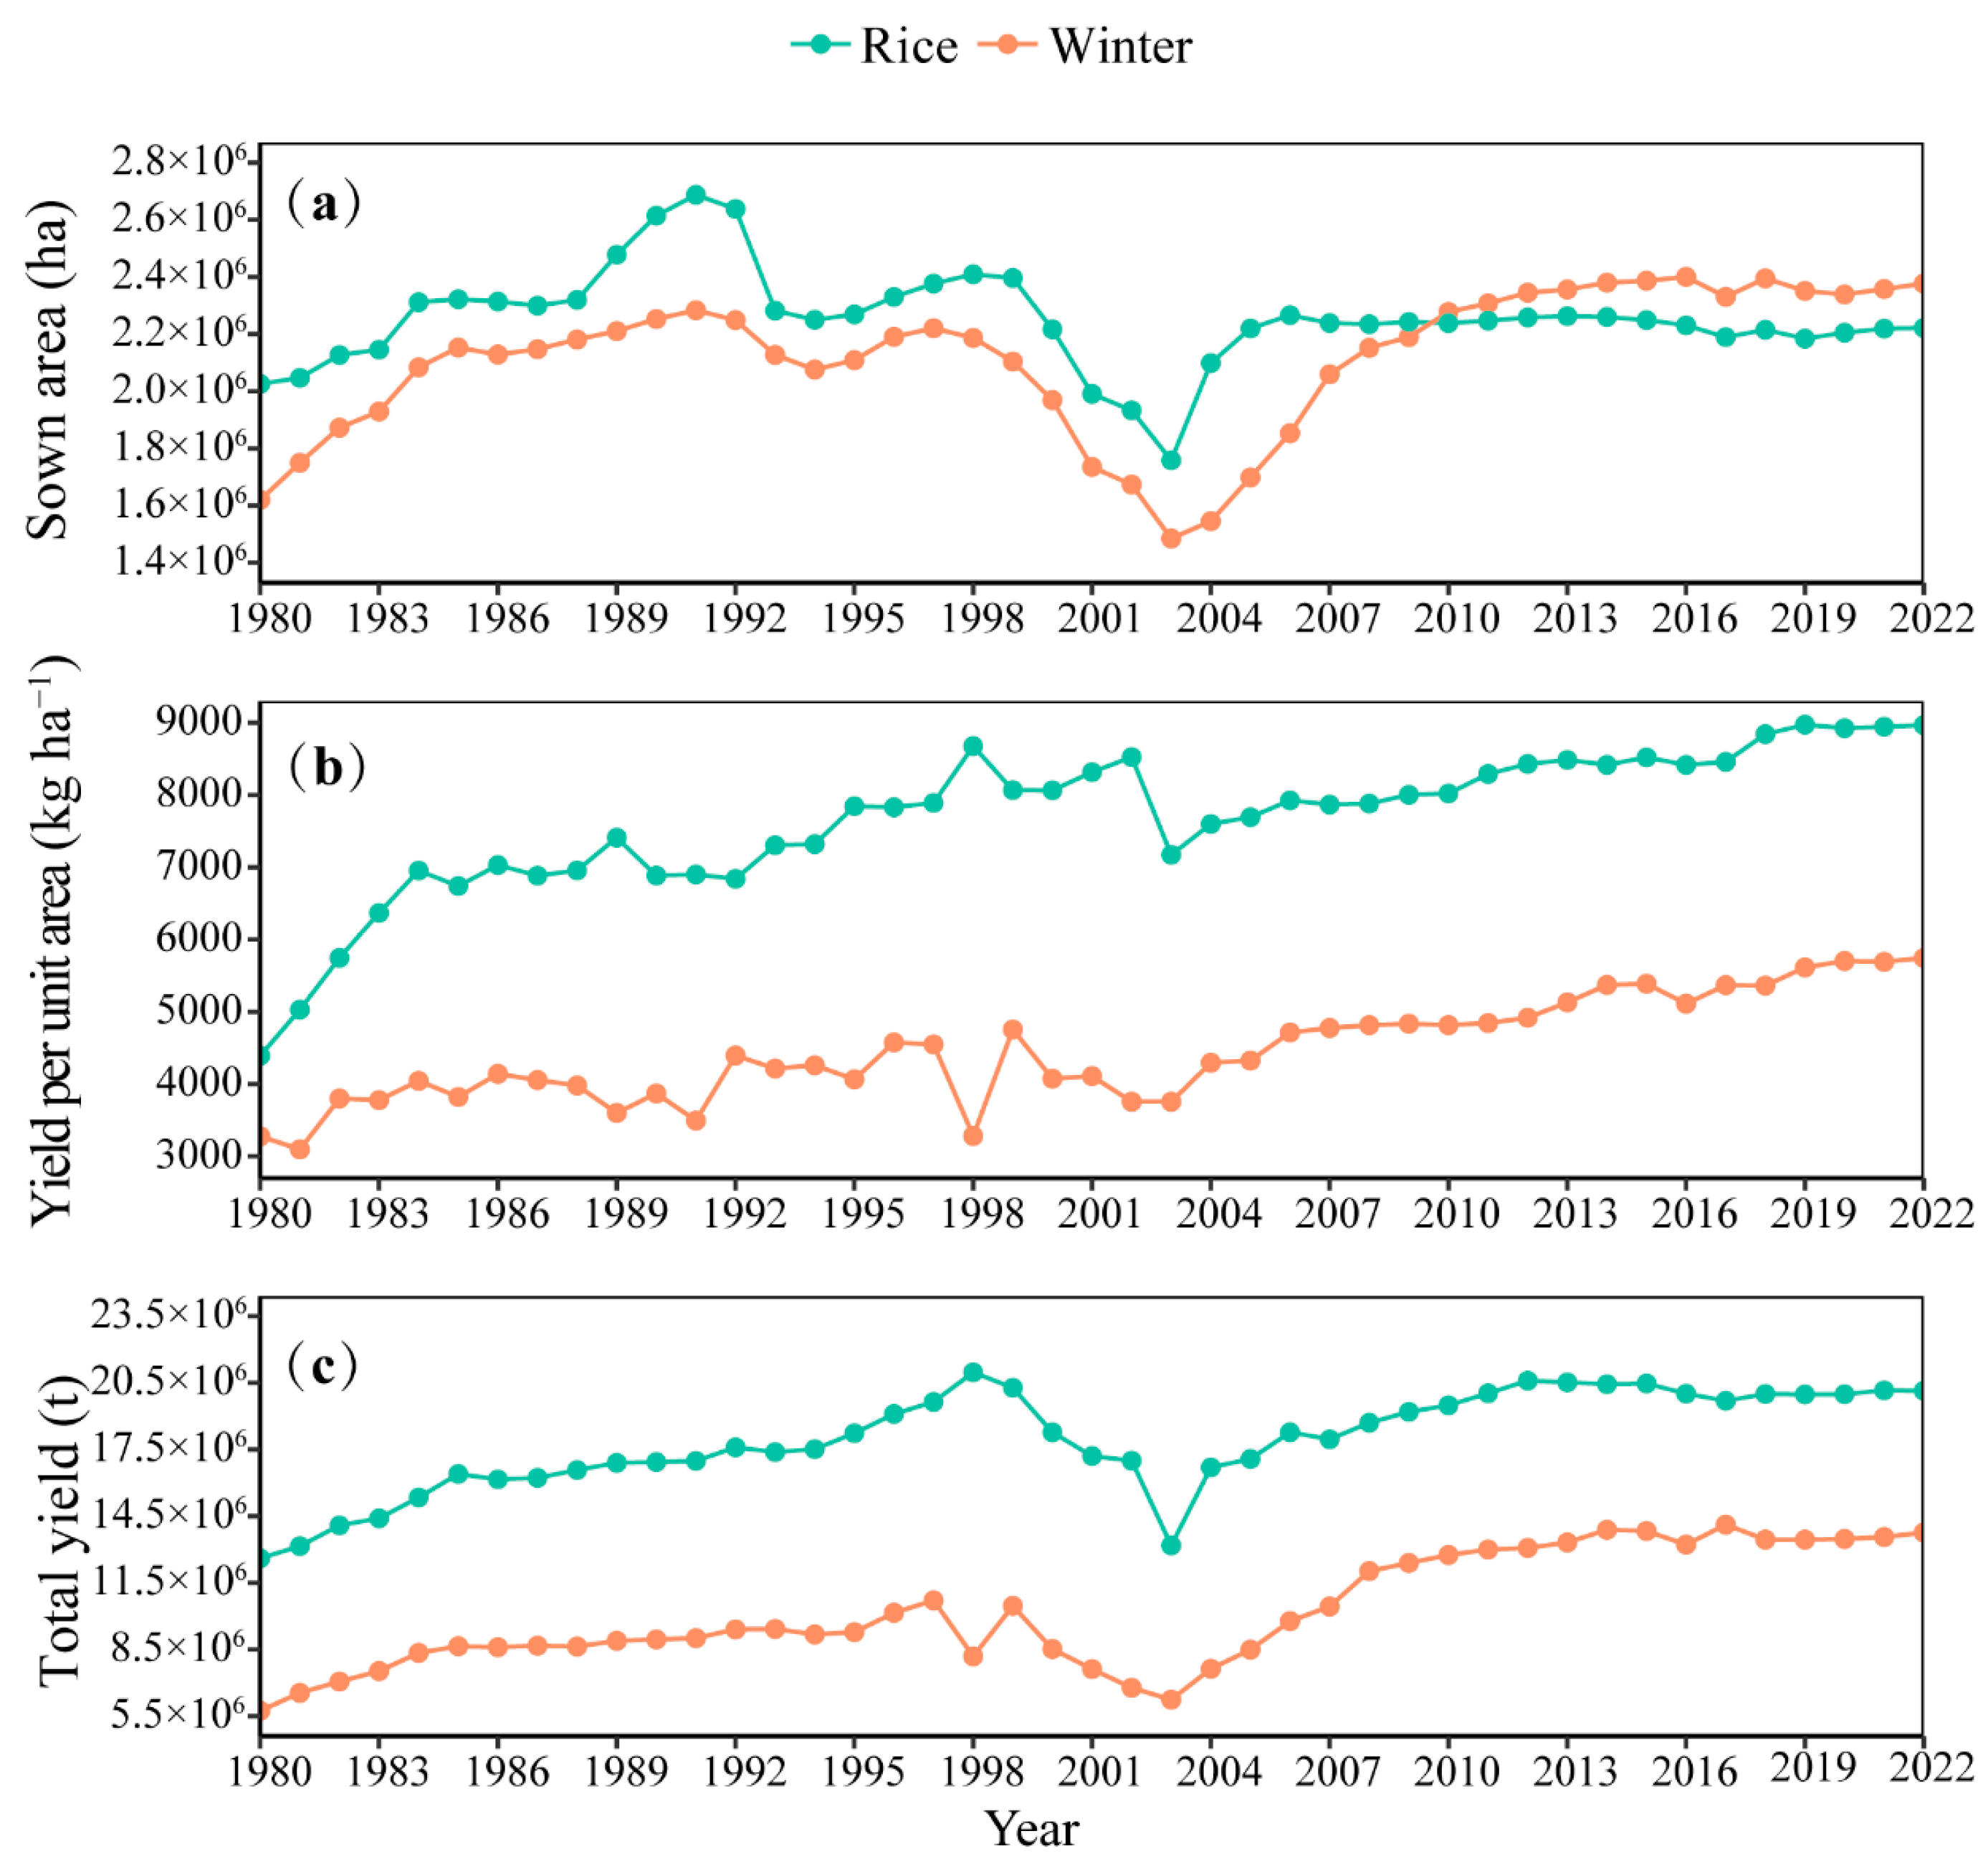
3.1. Sown Area, Yield per Unit Area, Total Yield of Rice-Wheat System

The sown area and total yield of rice exhibited an increasing-decreasing-increasing pattern during 1980–2022 (Figure 2a). Specifically, they increased by 17.33% and 55.85% during 1980–1997, decreased by 27.02% and 37.16% during 1998–2003, and then increased again by 5.86% and 20.66% during 2004–2022, respectively. In addition, rice yield per unit area demonstrated a sustained upward trend, with a cumulative increase of 104.13% during 1980–2022 (Figure 2b).
Similarly, the sown area and total yield of wheat also followed an increasing-decreasing-increasing trend during 1980–2022 (Figure 2a–c). Both of them increased by 37.09% and 86.56% during 1980–1997, declined by 32.09% and 23.81% during 1998–2003, and then increased significantly by 53.80% and 80.33% during 2004–2022, respectively. Moreover, the yield per unit area of wheat showed a fluctuating upward trend during the last 43 years, and it has increased by a total of 2467.62 kg ha1 up to 2022 (Figure 2b).

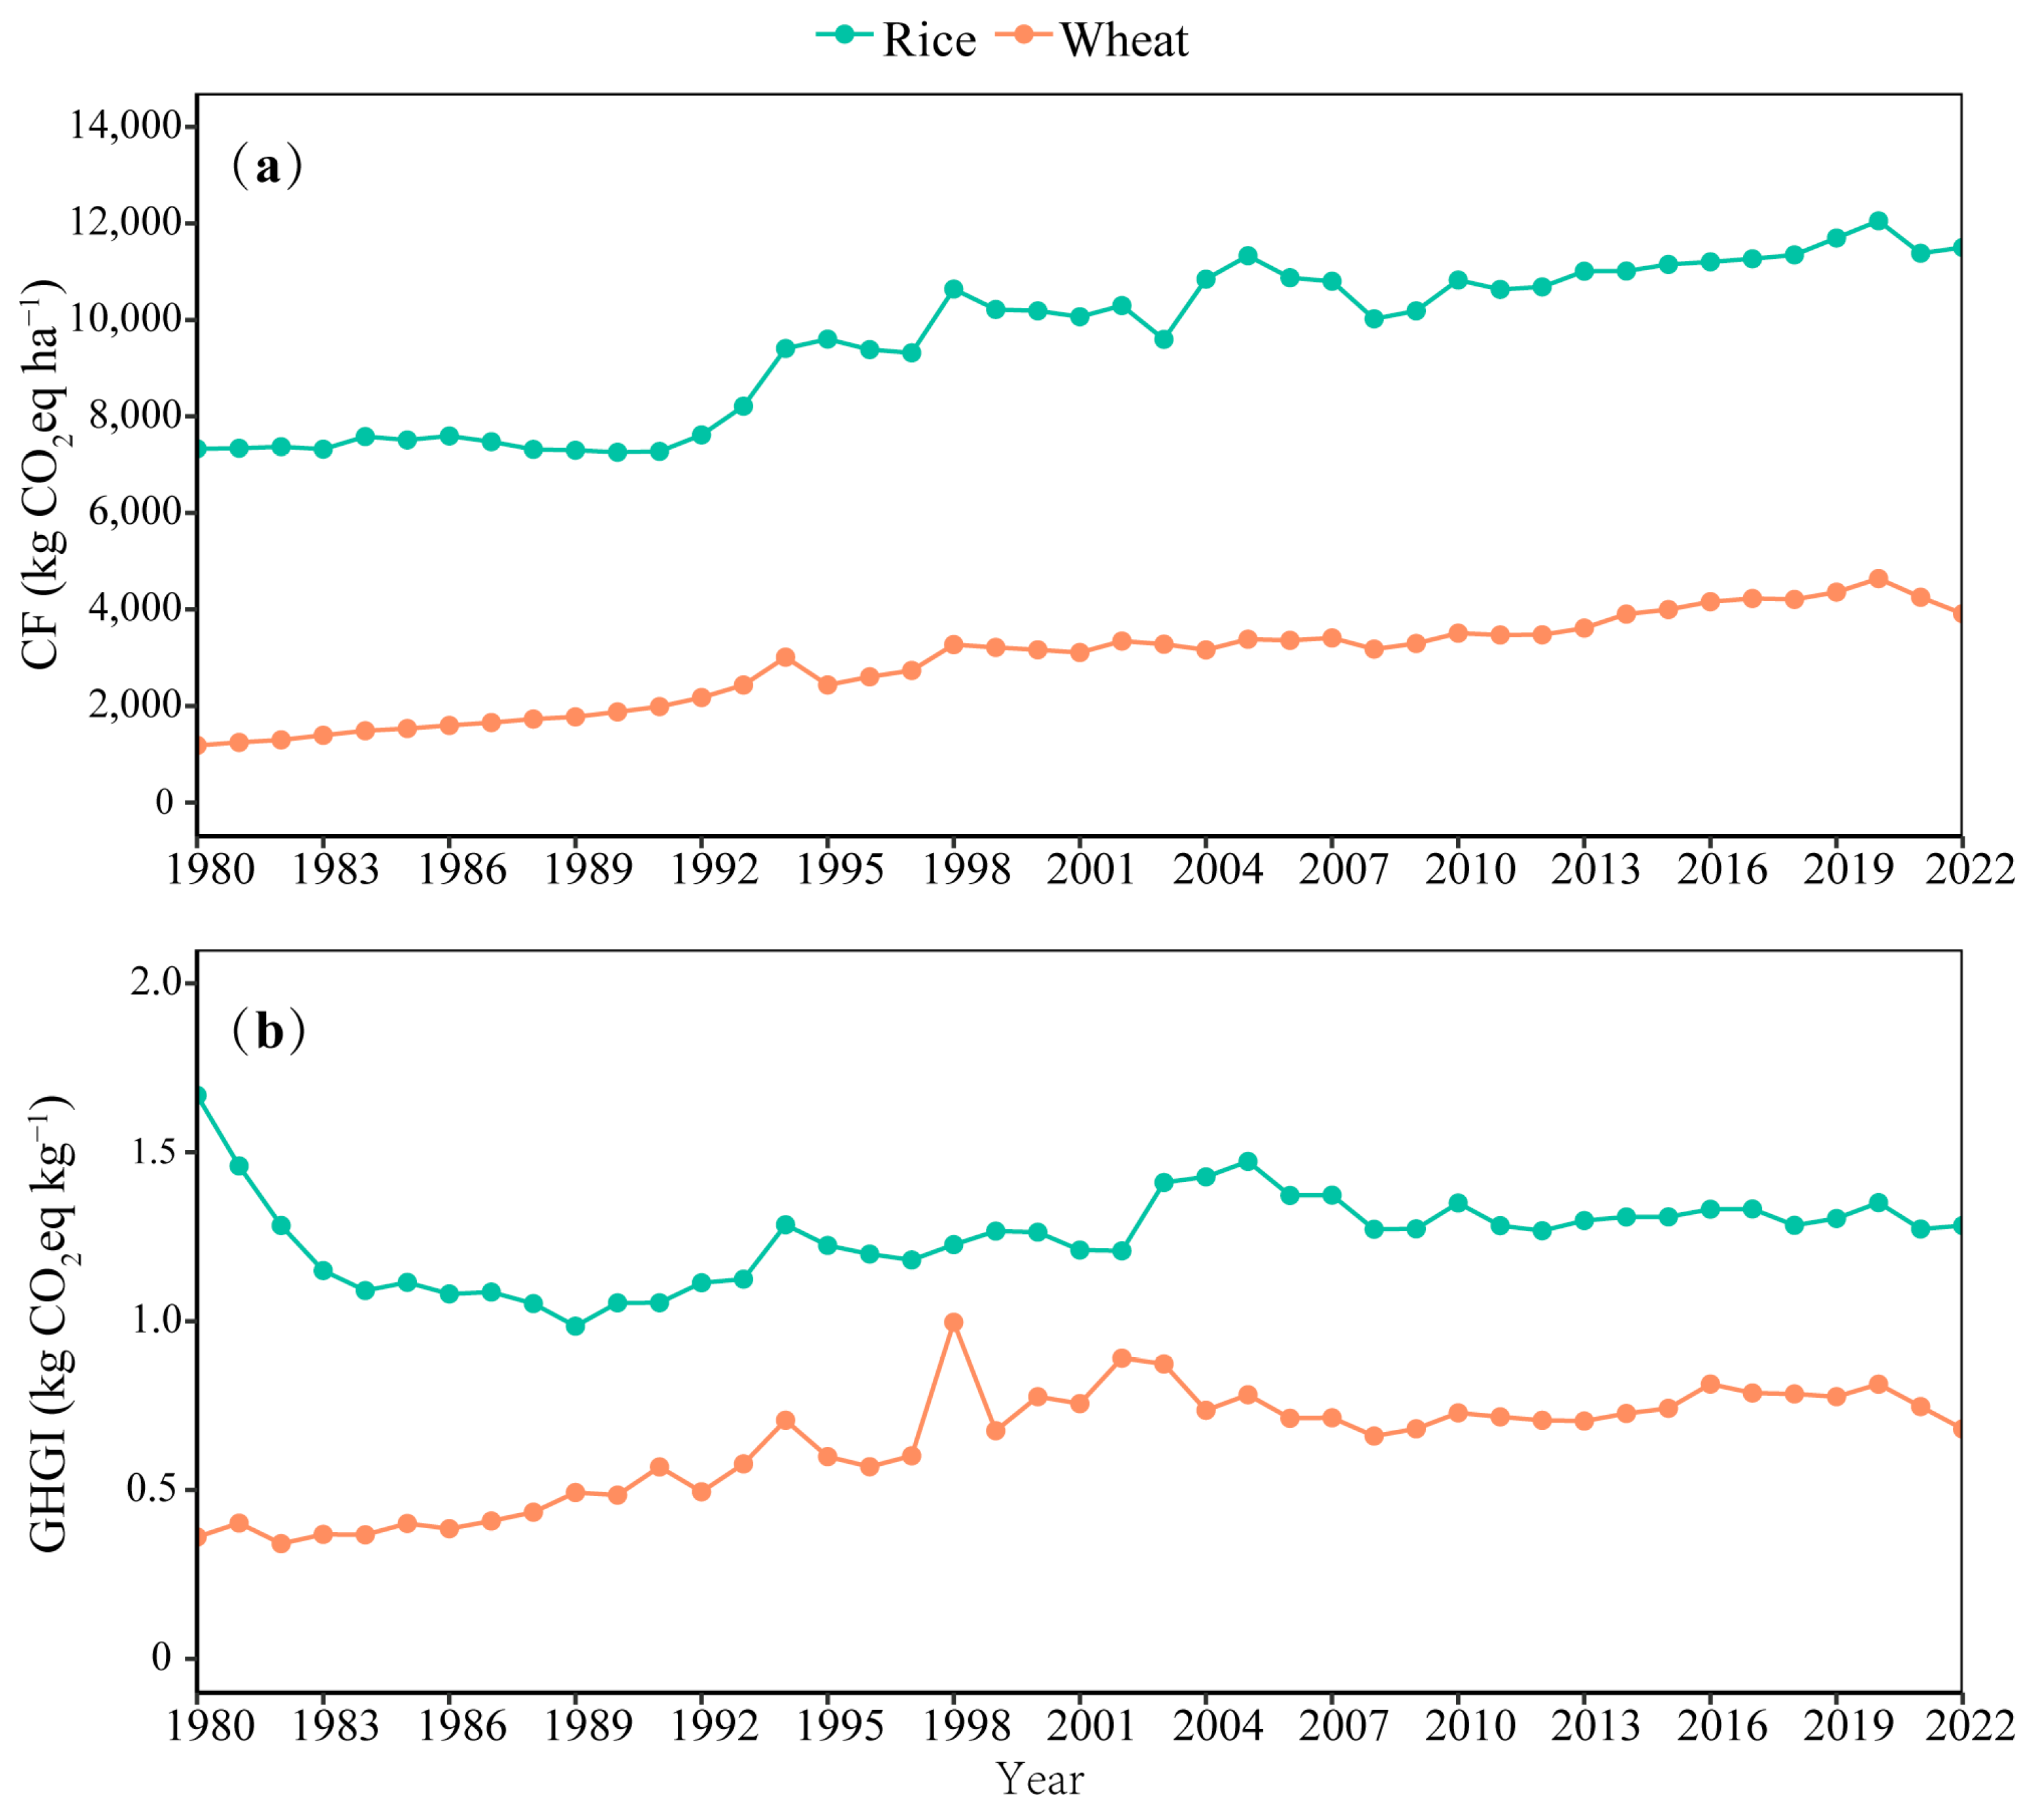
3.2. Carbon Footprint of Rice-Wheat System

3.2.1. Carbon Footprint and Greenhouse Gas Emissions Intensity

The CF of both rice and wheat exhibited an upward trend from 1980 to 2022 (Figure 3a). Among them, the CF of rice increased from 7329 kg CO2 eq ha−1 to 11,501 kg CO2 eq ha−1, with an increase of 56.93%. The CF of wheat increased from 1182 kg CO2 eq ha−1 in 1980 to 3911 kg CO2 eq ha−1 in 2020, with a total increase of 230.85%.
The GHGI of rice generally exhibited an overall decreasing and then fluctuating upward trend during 1980–2022, while that of wheat showed a fluctuating upward trend (Figure 3b). Among them, the GHGI of rice decreased by 0.68 kg CO2 eq kg−1 from 1980 to 1989 and increased by 21.70% from 1990 to 2022. Moreover, the GHGI of wheat increased from 0.36 kg CO2 eq kg−1 in 1980 to 0.68 kg CO2 eq kg−1 in 2022, an increase of 88.74%.

3.2.2. Direct and Indirect Greenhouse Gas Emissions

The GHG emissions of N fertilizer and compound fertilizer at the production and transportation stages, CH4 emission from paddy fields, alongside emissions associated with diesel fuel consumption by agricultural machinery, emerged as the dominant contributors to the CF within the rice-wheat cropping system (Figure 4). Among them, CH4 emission, N fertilizer, and irrigation were the main components of the CF of rice, with shares of 36%, 20.26%, and 17.34%, respectively. Additionally, the main components of the CF of wheat were N fertilizer, agricultural fuel, compound fertilizer, and N2Ototal, accounting for 42.39%, 22.54%, 13.65%, and 13.14%, respectively.

3.3. Energy Balance of Rice-Wheat System

3.3.1. Net Energy, Energy Use Efficiency, Energy Productivity, and Energy Profitability

The NE of rice showed an increasing and then fluctuating change from 1980 to 2022 (Figure 5a). This can be divided into 2 phases: first, the NE increased rapidly in 1980–1989, reaching a maximum of 88,854 MJ ha−1 in 1989, an increase of 112.33%. Second, there are smaller variations between 1990–2000 and 2001–2022, varying between 69,303–81,529 MJ ha−1 and 61,951–82,589 MJ ha−1, respectively. Both EUE and EPF of rice displayed an increasing and then decreasing trend, rising by 63.03% and 105.19% in 1980–1989 and subsequently declining by 45.77% and 62.27% in 1990–2022, respectively (Figure 5b–d). Across the 43-year interval, the EPD first ascended and subsequently declined, with a fluctuating increase of 14.62% from 1980 to 1989, reaching a maximum of 0.43 kg MJ−1 in 1984, followed by a 39.12% from 1990 to 2020 (Figure 5c).
The NE of wheat showed moderate variation from 1980 to 2022, ranging between 20,701 and 52,471 MJ ha−1 (Figure 5a). Specifically, NE remained relatively low at 20,701–45,733 MJ ha−1 during 1998–2004, followed by a gradual upward trend from 36,844 MJ ha−1 in 2005 to 52,471 MJ ha−1 in 2022, an increase of 42.42% (Figure 5a). Moreover, the EUE, EPD, and EPF of wheat all showed a decreasing trend during the last 43 years (Figure 5b–d). From 1980 to 2022, these three indicators decreased by 46.31%, 46.31%, and 60.62%, respectively. However, their variations were relatively smaller during 2004–2022, with EUE ranging from 1.95 to 2.41, EPD from 0.12 to 0.15 kg MJ−1, and EPF from 0.95 to 1.41, respectively.

3.3.2. The Energy Input of Rice and Wheat

N fertilizer and compound fertilizer during the production and transportation phases, coupled with diesel consumption in agricultural machinery operations, were identified as the primary contributors to energy input within the rice-wheat system (Figure 6). Among them, N fertilizer, agricultural diesel, irrigation, and compound fertilizer were the main components of energy input to rice, accounting for 43.91%, 21.63%, 13.23%, and 12.46%, respectively. For wheat, N fertilizer, agricultural diesel, and compound fertilizer were the key factors affecting energy input, accounting for 45.37%, 25.81%, and 20.37%, respectively.

4. Discussion

4.1. Sown Area and Yield of Rice and Wheat

The yield per unit area of rice and wheat in Jiangsu Province has increased by 104.13% and 75.29% during the last 43 years, respectively (Figure 2b). This growth is mainly attributed to the advancement in agricultural technology, the breeding of high-yielding varieties, and the optimization of field management measures. Shi et al. (2022) reported that applying micro-spraying irrigation and water-fertilizer integration technology in wheat cultivation can increase yields by 15–30% [45]. Additionally, the adoption of rice potting blanket seedling machine insertion technology achieved the highest rice yield record of 10,926.74 kg ha−1 [46], and the yield of Yongyou 2640 with potting seedling machine insertion high-yield precise quantitative cultivation technology also exceeded 13,499.99 kg ha−1 [47]. In the cultivation of high-yielding varieties, Tang et al. (2024) indicated that the average yield of Yang Xiangyu No. 1 and Ningxiang Japonica No. 9 reached 11,062.49 kg ha−1 and 9562.50 kg ha−1, respectively [48]. In addition, the average yield of Yang Mai No. 20 reached 8284.50 kg ha−1, and wheat varieties such as Yang Mai No. 33 and Yang Mai No. 34 also set the Jiangsu wheat yield record and the highest yield record in the Huainan wheat area, respectively [49,50]. In terms of field management practices, Xu et al. (2020) showed that the combined application of N, P, and K fertilizers increased rice yield to 9606 kg ha−1 [51]. Similarly, Tao et al. (2024) reported that controlled irrigation and controlled-release fertilizer increased rice yield by 6.3% [52].
The sown area and total yield of rice increased by 17.33% and 55.85%, and those of wheat by 37.09% and 86.56% during 1980–1997, respectively. Meanwhile, rice increased by 5.86% and 20.66%, and wheat increased by 12.70% and 80.33% from 2004 to 2022, respectively (Figure 2). This can be attributed to two main factors. First, from 1980 to 1997, the implementation of the household contract responsibility system significantly boosted farmers’ production enthusiasm, and the government took effective measures to promote food production, realizing a rapid increase in the sown area and yield of rice and wheat [53]. Second, since 2004, Jiangsu Province has rolled out a suite of policies to bolster food production, including direct grain subsidies, seed subsidies, agricultural machinery subsidies, and agricultural tax reductions. These measures not only reduced farmers’ financial burdens but also greatly enhanced their motivation to cultivate grain crops [54]. However, the sown area and total yield of rice decreased by 27.02% and 37.16%, while those of wheat decreased by 32.09% and 23.81% in 1998–2003, respectively (Figure 2a). This decline was mainly due to the impact of the “grain reduction and economic expansion” policies and grain prices, which led to a drastic restructuring of the agricultural cropping structure and the active cultivation of cash crops by farmers, resulting in a decline in the area planted with grains [54,55].

4.2. Carbon Footprint, Greenhouse Gas Emissions Intensity and Agricultural Materials

The CF of rice and wheat increased by 56.93% and 230.85% from 1980 to 2022, respectively (Figure 3a), which was primarily attributable to the escalated utilization of agricultural materials, including synthetic fertilizers, pesticides, and irrigation. Zhang et al. (2022) showed that synthetic fertilizer and pesticide application per unit sown area increased by 54.02% and 41.90% in Jiangsu Province in 1998 compared with 1990, respectively [56]. Additionally, Wang et al. (2024) found that the CF of rice, wheat, and rice-wheat annual rotation systems in Huai’an City increased by 18.80%, 29.70%, and 21.60% compared to Suzhou City, respectively, which was attributed to the higher fertilizer application, greater electricity consumption for irrigation, and weaker agricultural infrastructure in Huai’an City [57]. Therefore, precise fertilization, promotion of advanced planting techniques, increased productivity of agricultural mechanization, and promotion of climate-smart agricultural technologies, such as precise weather forecasting and optimal allocation of planting areas, are key measures to reduce the CF of agriculture. Furthermore, Qian et al. (2023) demonstrated that water-saving irrigation in rice cultivation can reduce GHG emissions by 44% [58]. Similarly, Feng et al. (2021) reported that alternating wet and dry irrigation reduced CF by 42.2% compared to continuous flooding [59].
The GHGI of wheat increased by 88.74% from 1980 to 2022, while that of rice increased by 21.70% from 1990 to 2022 (Figure 3b). This trend is mainly due to the fluctuating upward changes in both CF and yield per unit area during this period. Specifically, the CF of wheat and rice increased by 230.85% and 58.48%, respectively, and the yield per unit area increased by 75.29% and 30.23%, respectively, and the rate of increase in CF was faster than that of the yield per unit area, resulting in a gradual increase in the GHGI. In addition, the GHGI decreased by 40.97% from 1980 to 1989 (Figure 3b), which is attributed to the fact that the yield per unit area increased by 68.71% during this period, while the CF remained unchanged, resulting in a decrease in GHGI.
CH4 emission from paddy fields is the main source of the CF of rice production, which is consistent with the findings of Ji et al. [9]. It can be seen that the focus of reducing the CF of rice production is to reduce CH4 emission, which can be achieved by popularizing the cultivation of water-saving dry rice [60]. Jin et al. (2024) showed that the CF of the dry direct seeding rotation system was reduced by 35.57% and 25.87% compared to the water direct seeding rotation system and transplanting rotation system, respectively [40]. Moreover, irrigation water is a main source of rice’s CF, and optimizing irrigation technology is an important way to improve water use efficiency. Zhang et al. (2022) showed that the adoption of alternating wet and dry irrigation technology could reduce CH4 emission by 49.36 × 10⁴ t [61]. Similarly, discontinuous flooding reduced CH4 emission by 32.9–88.7% compared to long-term flooding irrigation [62]. Medium-term roasting is also an important way to improve water use efficiency, as this technique increases the O2 content of paddy soil, promotes the oxidation of CH4, and inhibits the production of CH4 in the soil [63].

4.3. Energy Balance and Energy Input

The NE, EUE, EPD, and EPF of rice increased by 112.33%, 63.03%, 14.62%, and 105.19% from 1980 to 1989, respectively (Figure 5a–d), which can be explained in two ways. Firstly, the energy input of rice was 27,990–30,134 MJ ha1, and energy output was 69,837–117,819 MJ ha1 during this period, and the growth rate of energy output (5.98%) exceeded that of energy input (0.38%) (Figure S1), resulting in an increasing trend in four energy indicators. Secondly, increased agricultural mechanization and other field management measures reduce energy input and improve energy use efficiency [64]. The above energy indicators decreased by 9.40%, 45.77%, 39.12%, and 62.27% during the period 1990–2020, respectively (Figure 5a–d). This decline is mainly attributed to the fact that energy input increased at a higher rate (2.77%) than energy output (0.83%) (Figure S1), resulting in a decrease in energy indicators.
The EUE, EPD, and EPF of wheat exhibited a continuous declining trend from 1980 to 2022 (Figure 5a–d). This was attributed to the fluctuating increase in both energy input and energy output, and the growth rate of energy input (2.85%) exceeding that of energy output (1.35%) (Figure S1). It can be seen that reducing energy input is essential for improving energy use efficiency. The agricultural materials with more energy input are irrigation water and synthetic fertilizer in crop production. Therefore, reducing the amount of fertilizer application and irrigation water and enhancing their utilization efficiency are the keys to reducing the energy input of the rice-wheat rotation system.
N fertilizer, agricultural diesel, and compound fertilizer were the primary sources of energy input in the rice-wheat system, which is consistent with the findings of Liu et al. [65]. While synthetic fertilizers have contributed to increased food production, they have also caused soil pollution and related environmental issues [66]. Therefore, it is necessary to improve fertilizer utilization, which can be achieved by promoting the combination of organic and synthetic fertilizers, developing new types of fertilizers, and adopting efficient fertilization techniques such as water-fertilizer integration technology [67].
The widespread adoption of agricultural machinery has substantially increased diesel fuel consumption in agroecosystems. Improving the utilization of agricultural machinery is also an important way to enhance energy efficiency and reduce GHG emissions [68]. Furthermore, combining the new energy generation system with intelligent agricultural management systems such as precision sowing, intelligent scheduling, and remote control not only realizes efficient operations but also further reduces GHG emissions [69].

4.4. Future Prospects

Enhancing the utilization efficiency of synthetic fertilizers and agricultural diesel and reducing CH4 emission from paddy fields, irrigation, and N2O emission proved effective in lowering both the carbon footprint and the energy input of rice-wheat systems. Daba et al. (2025) revealed that combining green manure with N fertilizer was an important measure to mitigate GHG emissions while increasing yield [70]. Optimizing N fertilizer application was also an effective measure to reduce environmental costs [71]. In addition, the use of high-efficiency agricultural machinery and energy-saving fuels can significantly improve operational efficiency. For rice, water-saving irrigation is a key practice to reducing CH4 emission, and Li et al. (2024) demonstrated that the adoption of alternate wetting and drying irrigation practices reduced CH4 emissions by 43.23% [72]. On the other hand, it was also wise to promote water-saving and drought-resistant rice varieties, which were superior to conventional rice in terms of drought resistance and drought tolerance, and CH4 may be suppressed in water-limited environments, thereby greatly reducing CH4 [73].

5. Conclusions

This study analyzed the CF and EB of the rice-wheat rotation system in Jiangsu Province from 1980 to 2022. The result demonstrated that the CF of rice and wheat showed an upward trend, increasing by 56.93% and 230.85%, respectively. The NE of rice showed increasing and then fluctuating changes, and EUE, EPD, and EPF exhibited an initial phase of growth followed by a subsequent decline, while wheat showed a decreasing trend. Among agricultural materials, CH4 emission, N fertilizer, and agricultural diesel were the main factors affecting CF. Moreover, N fertilizer, agricultural diesel, and compound fertilizer were the main variables for energy input. Additionally, emission factors and energy coefficients may change over time, which is an important factor to consider when assessing carbon footprint and energy balance in long time series. This study helps to promote the development of agricultural production in the direction of green, low-carbon, and high-efficiency, and also provides a reference for the construction of a low-carbon sustainable agricultural production system.

Supplementary Materials

The following supporting information can be downloaded at: https://www.mdpi.com/article/10.3390/agronomy15081778/s1. Figure S1: Energy input and energy output of rice (b, d) and wheat (a, c) in Jiangsu Province in 1980–2022.

Author Contributions

Resources, Software, Visualization, Writing—original draft, D.W.; Resources, Software, Y.S.; Resources, Software, Y.Z.; Resources, Software, T.Z.; Conceptualization, Methodology, Writing—review and editing, Resources, Funding acquisition, L.Z. All authors have read and agreed to the published version of the manuscript.

Funding

This study was supported by the National Natural Science Foundation of China (32401338), the Natural Science Foundation of Jiangsu Province (BK20240920), the Natural Science Foundation of Yangzhou Municipality (YZ2024169), A project Funded by the Priority Academic Program Development of Jiangsu Higher Education Institutions (PAPD), the Lv Yang Jin Feng Talent Plan of Yangzhou City, China, and the Supercomputing Center of Lanzhou University.

Data Availability Statement

The original contributions presented in this study are included in the article/Supplementary Materials. Further inquiries can be directed to the corresponding author.

Conflicts of Interest

The authors declare that they have no known competing financial interests or personal relationships that could have appeared to influence the work reported in this paper.

References

  1. Zhang, H.C.; Dai, Q.G.; Guo, B.W.; Wu, W.G. Research on the Double Maturity of Rice and Wheat in China; Phoenix Sci. Press: Nanjing, China, 2024. [Google Scholar]
  2. Jiangsu Provincial People’s Government. Jiangsu Statistical Yearbook. Available online: https://tj.jiangsu.gov.cn/2021/index.htm (accessed on 29 May 2025).
  3. Yu, X.L.; Zhang, F.M.; Fang, Y.Q.; Lu, Y.Y.; Zhang, K.D.; Ni, T. Simulation and reduction of CH4 flux emission in a rice-wheat rotation system in the Huai River Basin, China. J. Agro-Environ.Sci. 2023, 42, 2346–2357. [Google Scholar] [CrossRef]
  4. Zhou, W.J.; Chen, L.B.; Cheng, W.X.; Li, Y.P.; Li, T.; Smith, P.; Cheng, K. Synergistic effects of climate change and nitrogen use on future nitric oxide emissions from China’s croplands. J. Environ. Manag. 2025, 377, 124643. [Google Scholar] [CrossRef] [PubMed]
  5. Ning, J.; Zhang, C.; Hu, M.J.; Sun, T.C. Accounting for greenhouse gas emissions in the agricultural system of China based on the Life Cycle Assessment method. Sustainability 2024, 16, 2594. [Google Scholar] [CrossRef]
  6. Matuštík, J.; Kočí, V. What is a footprint? A conceptual analysis of environmental footprint indicators. J. Clean. Prod. 2021, 285, 124833. [Google Scholar] [CrossRef]
  7. Tian, P.P.; Li, D.; Lu, H.W.; Feng, S.S.; Nie, Q.W. Trends, distribution, and impact factors of carbon footprints of main grains production in China. J. Clean. Prod. 2021, 278, 123347. [Google Scholar] [CrossRef]
  8. Yan, S.J.; Deng, A.X.; Shang, Z.Y.; Tang, Z.W.; Chen, C.Q.; Zhang, J.; Zhang, W.J. Characteristics of carbon emission and ap-proaches of carbon mitigation and sequestration for carbon neutrality in China’s crop production. Acta Agron. Sin. 2022, 48, 930–941. [Google Scholar] [CrossRef]
  9. Ji, G.J.; Ji, H.T.; Cheng, K.; Liu, M.Q.; Jiang, Y.; Hu, Z.K.; Zhang, Y.F.; Hu, N.J.; Tang, R.D.; Hu, F. Analysis on carbon footprint and nitrogen footprint of paddy field rotation pattern in Jiangsu Province. J. Nanjing Agric. Univ. 2023, 46, 510–521. [Google Scholar] [CrossRef]
  10. Wang, X.L.; Miao, S.J.; Qiao, Y.F. Evaluating the carbon footprint of the rice-wheat rotation system based on localized parameters in Jiangsu Province. Energy Environ. Sci. 2023, 32, 1682–1691. [Google Scholar] [CrossRef]
  11. Fei, R.L.; Lin, B.Q. Energy efficiency and production technology heterogeneity in China’s agricultural sector: A meta-frontier approach. Technol. Forecast. Soc. 2016, 109, 25–34. [Google Scholar] [CrossRef]
  12. Yan, J.; Kong, Z.Y.; Liu, Y.Z.; Li, N.; Yang, X.L.; Zhuang, M.H. A high-resolution energy use efficiency assessment of China’s staple food crop production and associated improvement potential. Renew. Sustain. Energy Rev. 2023, 188, 113789. [Google Scholar] [CrossRef]
  13. Yuan, S.; Peng, S.B. Trends in the economic return on energy use and energy use efficiency in China’s crop production. Renew. Sustain. Energy Rev. 2017, 70, 836–844. [Google Scholar] [CrossRef]
  14. Yuan, S.; Peng, S.B.; Wang, D.; Man, J.G. Evaluation of the energy budget and energy use efficiency in wheat production under various crop management practices in China. Energy 2018, 160, 184–191. [Google Scholar] [CrossRef]
  15. Jin, Z.Q.; Zhang, L.; Liu, H.Y.; Nie, L.X. Energy assessment of different rice-wheat rotation systems. Food Energy Secur. 2021, 10, e284. [Google Scholar] [CrossRef]
  16. Yang, J.; Wang, C.Q.; Bai, Y.C.; You, L.Y.; Yi, Y.L.; Huang, F.; Li, X.X. Life cycle energy consumption and greenhouse gas emissions of wheat-rice rotation system with straw returning. J. Agro-Environ. Sci. 2015, 34, 196–204. [Google Scholar] [CrossRef]
  17. Wu, H.J.; Yuan, Z.; Geng, Y.; Ren, J.; Jiang, S.; Sheng, H.; Gao, L. Temporal trends and spatial patterns of energy use efficiency and greenhouse gas emissions in crop production of Anhui Province, China. Energy 2017, 133, 955–968. [Google Scholar] [CrossRef]
  18. Choudhary, M.; Panday, S.C.; Meena, V.S.; Yadav, R.P.; Singh, S.; Parihar, M.; Mishra, P.K.; Bisht, J.K.; Pattanayak, A. Long-term tillage and irrigation management practices: Impact on carbon budgeting and energy dynamics under rice–wheat rotation of Indian mid-himalayan region. Conservation 2022, 2, 388–401. [Google Scholar] [CrossRef]
  19. Shi, X.Y.; Zhao, J.; Jia, H.; Zhao, J.C.; Lu, J.; Zhao, M.Y.; Chu, Q.Q. Seeking sustainable pathway of crop production by opti-mizing planting structures and management practices from the perspective of water footprint. Sci. Total Environ. 2022, 843, 157091. [Google Scholar] [CrossRef]
  20. Zhang, L.; Wei, H.H.; Zhang, M.L.; Yang, Y.; Huang, Y.L.; Chai, N.; Zhang, X.L.; Zhang, K.Q.; Li, F.M.; Guo, S.Q.; et al. Adopting plastic film mulching system in the food-energy-water-carbon nexus to the sustainable dryland agriculture. Agric. Water Manag. 2024, 306, 109183. [Google Scholar] [CrossRef]
  21. Cui, Z.; Yue, S.; Wang, G.; Meng, Q.; Wu, L.; Yang, Z.; Zhang, Q.; Li, S.; Zhang, F.; Chen, X. Closing the yield gap could reduce projected greenhouse gas emissions: A case study of maize production in China. Glob. Change Biol. 2013, 19, 2467–2477. [Google Scholar] [CrossRef]
  22. Zhang, W.F.; Dou, Z.X.; He, P.; Ju, X.T.; Powlson, D.; Chadwick, D.; Norse, D.; Lu, Y.L.; Zhang, Y.; Wu, Y.; et al. New technologies reduce greenhouse gas emissions from nitrogenous fertilizer in China. Proc. Natl. Acad. Sci. USA 2012, 110, 8375–8380. [Google Scholar] [CrossRef]
  23. Di, X.H.; Nie, Z.R.; Zuo, T.Y. Life cycle emission inventories for the fuels consumed by thermal power in China. China Environ. Sci. 2005, 25, 632–635. [Google Scholar] [CrossRef]
  24. IPCC. 2006 IPCC Guidelines for National Greenhouse Gas Inventories. National Greenhouse Gas Inventories Programme; IGES: Hayama, Japan, 2006. [Google Scholar]
  25. Yuan, B.R.; Nie, Z.R.; Di, X.H.; Zuo, T.Y. Life cycle inventories of fossil fuels in China(II): Final life cycle inventories. Mod. Chem. Ind. 2006, 26, 59–61. [Google Scholar] [CrossRef]
  26. National Bureau of Statistics of China. China Statistical Yearbook; China Statistics Press: Beijing, China, 2011.
  27. National Bureau of Statistics of China. China Energy Statistical Yearbook; China Statistics Press: Beijing, China, 2011.
  28. Brentrup, F.; Pallière, C. GHG Emission and Energy Efficiency in European Nitrogen Fertilizer Production and Use; International Fertiliser Society: York, UK, 2008. [Google Scholar]
  29. Xu, X.M.; Lan, Y. A comparative study on carbon footprints between plant- and animal-based foods in China. J. Clean. Prod. 2016, 112, 2581–2592. [Google Scholar] [CrossRef]
  30. Williams, A.G.; Audsley, E.; Sandars, D.L. Determining the Environmental Burdens and Resource Use in the Production of Agricultural and Horticultural Commodities. Available online: https://www.silsoe.cranfield.ac.uk (accessed on 29 May 2025).
  31. Wang, J.X.; Rothausen, S.G.S.A.; Conway, D.; Zhang, L.; Xiong, W.; Holman, I.P.; Li, Y. China’s water-energy nexus: Green-house-gas emissions from groundwater use for agriculture. Environ. Res. Lett. 2012, 7, 014035. [Google Scholar] [CrossRef]
  32. Chen, X.; Cui, Z.; Fan, M.; Peter, V.; Zhao, M.; Ma, W.Q.; Wang, Z.L.; Zhang, W.J.; Yan, X.Y.; Yang, J.C.; et al. Producing more grain with lower environmental costs. Nature 2014, 514, 486–489. [Google Scholar] [CrossRef]
  33. West, T.O.; Marland, G. A synthesis of carbon sequestration, carbon emissions, and net carbon flux in agriculture: Comparing tillage practices in the United States. Agric. Ecosyst. Environ. 2002, 91, 217–232. [Google Scholar] [CrossRef]
  34. Yuan, S.; Linquist, B.A.; Wilson, L.T.; Cassman, K.G.; Stuart, A.M.; Pede, V.; Miro, B.; Saito, K.; Agustiani, N.; Aristya, V.E.; et al. Sustainable Intensification for a Larger Global Rice Bowl. Nat. Commun. 2021, 12, 7163. [Google Scholar] [CrossRef]
  35. Guo, J.; Song, Z.; Zhu, Y.; Wei, W.; Li, S.; Yu, Y. The characteristics of yield-scaled methane emission from paddy field in recent 35-year in China: A meta-analysis. J. Clean. Prod. 2017, 161, 1044–1050. [Google Scholar] [CrossRef]
  36. IPCC. Climate Change 2021—The Physical Science Basis; Cambridge University Press: Cambridge, UK, 2021. [Google Scholar]
  37. He, S.N.; Chen, Y.; Xiang, W.; Chen, X.W.; Wang, X.L.; Chen, Y. Carbon and nitrogen footprints accounting of peanut and peanut oil production in China. J. Clean. Prod. 2021, 291, 125964. [Google Scholar] [CrossRef]
  38. Luo, X.Q.; Guo, Y.T.; Wang, R.; Wang, N.J.; Li, C.; Chu, X.S.; Feng, H.; Chen, H.X. Carbon footprint of a winter wheat-summer maize cropping system under straw and plastic film mulching in the Loess Plateau of China. Sci. Total Environ. 2021, 794, 148590. [Google Scholar] [CrossRef]
  39. Wang, J.Y.; Ciais, P.; Smith, P.; Yan, X.Y.; Kuzyakov, Y.; Liu, S.W.; Li, T.T.; Zou, J.W. The role of rice cultivation in changes in atmospheric methane concentration and the Global Methane Pledge. Glob. Change Biol. 2023, 29, 2776–2789. [Google Scholar] [CrossRef]
  40. Jin, Z.Q.; Harrison, M.T.; Liu, K.; Nie, L.X. Dry direct-seeded rice-wheat rotation system: Lower water and carbon footprint and higher carbon production efficiency and net ecosystem economic benefits. Field Crops Res. 2024, 309, 109323. [Google Scholar] [CrossRef]
  41. Yang, L.; Jin, W.; Chen, X.; Song, W.; Yang, Y.; Zhou, J.; Kong, L.; Huang, Z.; Liu, R.; Du, X. Effect of soybean inclusion in cropping systems on productivity, profitability, and carbon footprints: A case study from the Huang-Huai-Hai plain. Energy 2025, 316, 134422. [Google Scholar] [CrossRef]
  42. Chen, F. Agricultural Ecology; China Agricultural University Press: Beijing, China, 2011. [Google Scholar]
  43. Meena, R.S.; Pradhan, G.; Kumar, S.; Lal, R. Using industrial wastes for rice-wheat cropping and food-energy-carbon-water-economic nexus to the sustainable food system. Renew. Sustain. Energy Rev. 2023, 187, 113756. [Google Scholar] [CrossRef]
  44. Lal, B.; Panda, B.B.; Gautam, P.; Raja, R.; Singh, T.; Mohanty, S.; Shahid, M.; Tripathi, R.; Kumar, A. Input-output energy analysis of rainfed rice-based cropping systems in eastern India. Agron. J. 2015, 107, 1750–1756. [Google Scholar] [CrossRef]
  45. Shi, X.G.; Pei, X.X.; Dang, J.Y.; Zhang, D.Y. Research progress on high-yield, high-quality and high-efficiency ecological culti-vation of wheat by micro-spray (drip) irrigation and fertilizer integration. Crops 2022, 206, 1–10. [Google Scholar] [CrossRef]
  46. Zhang, H.C.; Zhu, C.C.; Huo, Z.Y.; Xu, K.; Jiang, X.H.; Chen, H.C.; Gao, S.Q.; Li, D.J.; Zhao, C.M.; Dai, Q.G.; et al. Advantages of yield formation and main physiological and ecological characteristics of rice planted in potting machines. TCSAE 2013, 29, 50–59. [Google Scholar] [CrossRef]
  47. Xing, Z.P. Effect of Mechanized Planting Methods on the Productivity of Rice and Annual Grain Production. Ph.D. Thesis, Yangzhou University, Yangzhou, China, 2017. [Google Scholar]
  48. Tang, J.P.; Chen, J.J.; Liu, S.G.; Xin, H.B.; Zhang, Y.; Yao, Y.; Zhang, M.W.; Lu, P.L. Study on yield and quality characteristics of conventional Japonica rice varieties in high sand soil areas along the Yangtze River in Jiangsu. China Seed Ind. 2024, 43, 126–134. [Google Scholar] [CrossRef]
  49. Ding, Y.F.; Xu, K.; Ding, C.Q.; Wang, L.J.; Chen, X.H.; Gu, K.J.; Wei, G.B.; Li, C.Y.; Wu, L.Q.; Zhou, Q.; et al. Creation and Application of Key Technologies for High-Yield, High-Efficiency and Green Cultivation of Rice-Wheat. Available online: https://kxyjy.njau.edu.cn/info/1143/10990.htm (accessed on 29 May 2025).
  50. Wang, R.Q.; Zhang, R.; Cheng, M.H.; He, Z.T.; Wang, J.H.; Fan, D.J.; Chen, S.Q. Breeding of a wheat variety Yangfumai 20 with high yield, high quality and early-maturing. China Seed Ind. 2024, 43, 135–137. [Google Scholar] [CrossRef]
  51. Xu, Y.; Li, S.X.; Tu, M.; Huang, Y.G.; Zhu, S.S. Effects of N, P, K fertilizer application on grain yield, quality, nutrient uptake and utilization of T Xiangyou 557. J. Anhui Agric. Sci. 2020, 48, 151–156. [Google Scholar] [CrossRef]
  52. Tao, W.K.; Li, J.Q.; Li, W.W.; Wen, C.X.; Gao, S.; Wang, Y.H.; Liu, D.; Xu, L.; Jiang, Y.; Liu, Z.H.; et al. Higher rice productivity and lower paddy nitrogen loss with optimized irrigation and fertilization practices in a rice-upland system. Agric. Ecosyst. Environ. 2024, 374, 109176. [Google Scholar] [CrossRef]
  53. Jiao, X.Q.; Nyamdavaa, M.; Zhang, F.S. The transformation of agriculture in China: Looking back and looking forward. J. Integr. Agric. 2018, 17, 755–764. [Google Scholar] [CrossRef]
  54. Xia, S.Y.; Zhao, Y.; Xu, X.; Qi, W.; Sun, Q.; Wang, L.W. Spatiotemporal pattern and driving factors of grain production in Jiangsu Province. Econ. Geogr. 2018, 38, 166–175. [Google Scholar] [CrossRef]
  55. Zhang, R.T.; Zhang, Y. An analysis of the evolution of the spatial and temporal pattern of crop planting structure in Jiangsu Province. China Rice 2023, 29, 48–52. [Google Scholar] [CrossRef]
  56. Zhang, C.H.; Han, L.; Xie, J.N.; Jin, H.; Liu, C.Y.; Fan, J.L. Study on the carbon footprint dynamics and composition of major agricultural crops in Jiangsu Province. J. Nanjng Univ. Inf. Sci. Technol. (Nat. Sci. Ed.) 2022, 14, 110–119. [Google Scholar] [CrossRef]
  57. Wang, X.L. Carbon Footprint Analysis of Agriculture in Jiangsu Province: An Example of Rice-Wheat Annual Rotation System. Master’s Thesis, Nanjing University of Information Science and Technology, Nanjing, China, 2024. [Google Scholar]
  58. Qian, H.Y.; Zhu, X.C.; Huang, S.; Linquist, B.; Kuzyakov, Y.; Wassmann, R.; Minamikawa, K.; Martinez-Eixarch, M.; Yan, X.Y.; Zhou, F.; et al. Greenhouse gas emissions and mitigation in rice agriculture. Nat. Rev. Earth Environ. 2023, 4, 716–732. [Google Scholar] [CrossRef]
  59. Feng, Z.Y.; Qin, T.; Du, X.Z.; Sheng, F.; Li, C.F. Effects of irrigation regime and rice variety on greenhouse gas emissions and grain yields from paddy fields in central China. Agric. Water Manag. 2021, 250, 106830. [Google Scholar] [CrossRef]
  60. Ministry of Ecology and Environment. Second Biennial Update Report on Climate Change of the People’s Republic of China. Available online: https://www.mee.gov.cn/ywgz/ydqhbh/wsqtkz/201907/P020190701765971866571.pdf (accessed on 29 May 2025).
  61. Zhang, Z.W.; Qin, X.B.; Fan, J.L.; Wei, X.H.; Wan, Y.F.; Wang, J.M.; Liao, Y.L.; Lu, Y.H. Applicability and abatement potential assessment of alternate wet and dry CH4 mitigation technology in major rice cropping regions in Hunan Province of China. Trans. Chin. Soc. Agric. Eng. 2022, 38, 232–239. [Google Scholar] [CrossRef]
  62. Jiang, Y.; Carrijo, D.; Huang, S.; Chen, J.; Balaine, N.; Zhang, W.; Groenigen, K.J.V.; Linquist, B. Water management to mitigate the global warming potential of rice systems: A global meta-analysis. Field Crops Res. 2019, 234, 47–54. [Google Scholar] [CrossRef]
  63. Haque, M.M.; Kim, G.W.; Kim, P.J.; Kim, S.Y. Comparison of net global warming potential between continuous flooding and midseason drainage in monsoon region paddy during rice cropping. Field Crops Res. 2016, 193, 133–142. [Google Scholar] [CrossRef]
  64. Shen, Y.P.; Peng, S.B. Input-output energy analysis of rice production in different crop management practices in central China. Energy 2017, 141, 1124–1132. [Google Scholar] [CrossRef]
  65. Liu, Y.X.; Langer, V.; Høgh-Jensen, H.; Egelyng, H. Life cycle assessment of fossil energy use and greenhouse gas emissions in Chinese pear production. J. Clean. Prod. 2010, 18, 1423–1430. [Google Scholar] [CrossRef]
  66. Yao, W.; Tong, Y.Q.; Liu, Q.; Zang, H.D.; Yang, Y.D.; Qi, Z.Q.; Zeng, Z.H. Characterization of temporal and spatial changes in global rice production and analysis of trade trends. J. South. Agric. 2022, 53, 1776–1784. [Google Scholar] [CrossRef]
  67. Ministry of Agriculture and Rural Affairs of the People’s Republic of China. Implementation Plan for Agricultural and Rural Emissions Reduction and Carbon Sequestration. Available online: https://www.moa.gov.cn/govpublic/KJJYS/202206/t20220630_6403715.htm (accessed on 29 May 2025).
  68. Zhang, Y.; Gu, J.Y.; Wang, C.; Wang, W.L.; Zhang, W.Y.; Gu, J.F.; Liu, L.J.; Yang, J.C.; Zhang, H. Carbon footprint of major grain crops in the middle and lower reaches of the Yangtze River during 2011–2022. J. Appl. Ecol. 2023, 34, 3364–3372. [Google Scholar] [CrossRef]
  69. Zhuang, M.H.; Wang, X.; Yang, Y.; Wu, Y.F.; Wang, L.G.; Lu, X. Agricultural machinery could contribute 20% of total carbon and air pollutant emissions by 2050 and compromise carbon neutrality targets in China. Nat. Food 2024, 6, 513–522. [Google Scholar] [CrossRef] [PubMed]
  70. Daba, N.A.; Huang, J.; Shen, Z.; Han, T.F.; Alam, M.A.; Li, J.W.; Tadesse, K.A.; Gilbert, N.; Kebede, E.; Legesse, T.G.; et al. Green manure substitution for chemical nitrogen reduces greenhouse gas emissions and enhances yield and nitrogen uptake in rice-rice cropping systems. Field Crops Res. 2025, 322, 109715. [Google Scholar] [CrossRef]
  71. Shen, S.J.; Feng, B.; Zhang, D.T.; Zou, J.; Yang, Y.H.; Rees, R.M.; Topp, C.F.E.; Hu, S.Y.; Qiao, B.W.; Huang, W.H.; et al. Optimizing N applications increases maize yield and reduces environmental costs in a 12-year wheat-maize system. Field Crops Res. 2025, 322, 109741. [Google Scholar] [CrossRef]
  72. Li, L.; Huang, Z.; Mu, Y.X.; Song, S.K.; Zhang, Y.C.; Tao, Y.; Nie, L.X. Alternate wetting and drying maintains rice yield and reduces global warming potential: A global meta-analysis. Field Crops Res. 2024, 318, 109603. [Google Scholar] [CrossRef]
  73. Zhang, G.B.; Yang, Y.T.; Zhu, X.L.; Shen, W.Y.; Zhu, Z.K.; Ge, T.D.; Xia, L.L.; Ma, J.; Lv, S.H.; Xu, H. Combining water-saving and drought-resistant rice with plastic film mulching mitigates CH4 emissions with higher net economic benefits. Resour. Conserv. Recycl. 2024, 202, 107372. [Google Scholar] [CrossRef]
Figure 1. The system boundary of carbon footprint and energy balance in a rice-wheat rotation system.
Agronomy 15 01778 g001
Figure 2. The (a) sown area, (b) yield per unit area, and (c) total yield of rice and wheat in Jiangsu Province in 1980–2022.
Agronomy 15 01778 g002
Figure 3. The (a) carbon footprint (CF) and (b) greenhouse gas emissions intensity (GHGI) of the rice-wheat rotation system in Jiangsu Province in 1980–2022.
Agronomy 15 01778 g003
Figure 4. The direct and indirect greenhouse gas emissions from the rice-wheat rotation system in Jiangsu Province.
Agronomy 15 01778 g004
Figure 5. The (a) net energy (NE), (b) energy use efficiency (EUE), (c) energy productivity (EPD), and (d) energy profitability (NPF) of rice-wheat rotation system in Jiangsu Province in 1980–2022.
Agronomy 15 01778 g005
Figure 6. The energy input of rice-wheat rotation system in Jiangsu Province from 1980 to 2022.
Agronomy 15 01778 g006
Disclaimer/Publisher’s Note: The statements, opinions and data contained in all publications are solely those of the individual author(s) and contributor(s) and not of MDPI and/or the editor(s). MDPI and/or the editor(s) disclaim responsibility for any injury to people or property resulting from any ideas, methods, instructions or products referred to in the content.

