Abstract
Pyrochar has been identified as a favorable soil conditioner that can effectively ameliorate soil acidification. Hydrochar is considered a more affordable carbon material than pyrochar, but its effect on the process of soil acidification has yet to be investigated. An indoor incubation and a soil column experiment were conducted to study the effect of rice straw hydrochar application on nitrification and NO3−-N leaching in acidic red soil. Compared to the control and pyrochar treatments, respectively, hydrochar addition mitigated the net nitrification rate by 3.75–48.75% and 57.92–78.19%, in the early stage of urea fertilization. This occurred mainly because a greater amount of dissolved organic carbon (DOC) was released from hydrochar than the other treatments, which stimulated microbial nitrogen immobilization. The abundances of ammonia-oxidizing archaea and ammonia-oxidizing bacteria were dramatically elevated by 25.62–153.19% and 12.38–22.39%, respectively, in the hydrochar treatments because of DOC-driven stimulation. The cumulative leaching loss of NO3−-N in soils amended with hydrochar was markedly reduced by 43.78–59.91% and 61.70–72.82% compared with that in the control and pyrochar treatments, respectively, because hydrochar promoted the soil water holding capacity by 2.70–9.04% and reduced the residual NO3−-N content. Hydrochar application can dramatically diminish total H+ production from soil nitrification and NO3−-N leaching. Thus, it could be considered an economical soil amendment for ameliorating soil acidification.
1. Introduction
Soil acidification is a common problem associated with soil degradation worldwide, and the extent of soil acidification not only affects the health of terrestrial ecosystems but also poses a direct threat to food security [1]. In China, due to indiscriminate and unsystematic fertilization and management practices, soil acidification has intensified on a large scale since the 1980s [2]. The drivers of soil acidification mainly include the soil nitrogen cycle, the depletion of base ions due to crop harvest, and acid deposition [3]. The soil nitrogen cycle dominates the acidification process, as it usually contributes most of the total proton production [4,5,6]. Therefore, nitrification and nitrate leaching, the main acidogenic processes in the soil nitrogen cycle, are the primary factors that need to be addressed to inhibit soil acidification.
To retard soil acidification, it is necessary to apply proper soil amendments. As a new type of soil amendment, biochar has been shown to mitigate soil acidification in recent years [7,8]. Currently, the mainstream pyrolysis method for biochar preparation is to carbonize biomass at high temperature (300–800 °C) under oxygen-limited conditions, and the solid product obtained from pyrolysis is also termed “pyrochar”. However, the price of biochar is expensive due to the high energy demand of the pyrolysis process, which strongly limits its widespread application. During hydrothermal carbonization (HTC), another biomass carbonization method, biomass is heated at relatively low temperatures (180–300 °C) and high pressures (2–6 MPa) in an aqueous phase [9], and the resulting product is referred to as “hydrochar”. Notably, pyrochar specifically refers to biochar produced via pyrolysis, whereas biochar is a broader term encompassing all carbon materials prepared through thermochemical conversion methods (including both pyrochar and hydrochar). HTC has an obvious cost advantage compared to pyrolysis because of its low energy consumption and higher solidification ratio [10]. Taking teff (Eragrostis tef) as an example [11], researchers have found that the production cost of pyrochar is significantly lower than that of pyrochar, and the difference in cost is predominantly due to the carbonization process. The main differences between hydrochar and pyrochar lie in their elemental composition, surface morphology and internal structure [10]. In addition, the structural and compositional characteristics of hydrochar may play an important role in alleviating soil acidification. For instance, some studies have indicated that there are abundant carbon spheres on hydrochar surface [12,13], and these carbon spheres have specific hydrophilic shell [14,15] and strong absorptivity owing to the abundant oxygen-containing functional groups [16], which can reduce nitrate leaching from soil [17]. Thus, it can be deduced from the above two points that hydrochar may also possess the potential to relieve soil acidification.
It is well established that the functional properties of carbonaceous materials are intrinsically governed by their physicochemical characteristics. The fundamentally distinct reaction mechanisms underlying hydrothermal carbonization (HTC) and pyrolysis give rise to markedly different structural and functional properties in hydrochars versus pyrochars, consequently leading to significant divergence in their agronomic performance and environmental applications. Researchers have demonstrated differences in the effects of the two chars on soil physicochemical properties [18,19], crop growth [20,21], soil microorganisms [22,23], greenhouse gas emissions [24,25], and biological nitrogen fixation [26]. In addition, Yu et al. [27] demonstrated that hydrochar and pyrochar have different effects and mechanisms for the mitigation of Al toxicity, which can be attributed to their unique characteristics. Yet, a knowledge gap persists regarding hydrochar-induced modifications to soil acidification pathways. Hence, hydrochar is an economical biomass material with demonstrable potential for soil acidification alleviation, and it is imperative to evaluate the effect of hydrochar on acidogenic processes in the soil nitrogen cycle and unravel the underlying mechanisms involved.
To systematically examine the effects of hydrochar application on soil nitrification and nitrate leaching and exploit the utilization channels for rice straw resources, an indoor soil incubation combined with a soil column leaching experiment was employed to (1) determine how hydrochar addition interferes with nitrification mediated by soil microbes; (2) verify whether hydrochar input notably reduces nitrate leaching risks; and (3) elucidate the possible mechanisms by which hydrochar impacts soil nitrification and nitrate leaching relative to pyrochar. These results offer critical insights for the application of biochar to mitigate soil acidification.
2. Materials and Methods
2.1. Soil Collection and Characterization
The surface layer (0–20 cm) of an acidic red soil derived from Quaternary Red Earth (classified as Ferralic Cambisols based on the Food and Agricultural Organization (FAO) or World Soil Classification) was used in this study. The soil sample was collected from Xuancheng (29°59′33″ N, 118°7′45″ E), Anhui Province, China. The sample area has been managed with a rape–maize rotation by a local farmer in the past decade. After being air-dried, the soil sample was ground and passed through a 2 mm sieve for the incubation experiments. The soil pH was determined in deionized water at a 2.5:1 (water/soil, w/w) ratio by a pH meter (FE28, Mettler Toledo, Zurich, Switzerland). The soil organic matter (SOM) content was measured with the dichromate method [28]. The background contents of soil NH4+-N and NO3−-N were extracted with 1 mol L−1 KCl solution and analyzed via a flow analyzer (AA3, Seal Analytical, London, UK). The above soil characteristics were as follows: pH 4.20, SOM 14.08 g kg−1, NH4+-N 28.65 mg kg−1, and NO3−-N 22.79 mg kg−1.
2.2. Char Preparation
The rice straw (39.21 C%, 5.06 H%, 40.68 O%, and 1.54 N%) utilized for hydrochar and pyrochar production was obtained directly post-harvest from a paddy field in Xuancheng. The straw was subsequently pulverized and passed through a 0.45 mm sieve after air-drying. The details of the hydrochar and pyrochar preparation have been mentioned in our previous report [27]. Both chars were ground, passed through a 0.45 mm sieve, and then stored in polyethylene terephthalate (PET) plastic bottles.
The pH of both chars was measured in deionized water at a 10:1 (water/char, w/w) ratio with a pH meter [29]. An elemental analyzer (Vario EL Cube, Elementar, Langenselbold, Germany) was used to determine the C%, H%, and N% of both chars. The ash content of both chars was tested by dry ashing in a muffle furnace at 850 °C ± 5 °C (PRC National Standard: GB/T 1429–2009). O% = 1-C-H%-N%-ash%. Char yield (%) = char product/raw material (w/w). The specific surface area (Brunauer–Emmett–Teller (BET)) was assayed by the N2 static adsorption capacity method at 77.3 K [18]. The average pore size was evaluated by the BJH method [30] based on N2 static adsorption. The Boehm titration method [31] was adopted to quantify oxygen-containing functional groups. The test method for char water absorption was described by Wu and Liu [32]. The average pore size and water absorption of both chars are listed in Table 1, and the rest of the above-mentioned characteristics can be observed in our previous study [27]. Moreover, batch adsorption experiments for NH4+-N and NO3−-N were conducted to distinguish the adsorption capacity and pattern of hydrochar and pyrochar. The surface morphology of both chars was photographed by a scanning electron microscope (Quattro S, Thermo Fisher, Waltham, MA, USA). The images of surface morphology and details of the batch adsorption experiments are provided in the Supplementary Materials.

Table 1.
The average pore size and water absorption of rice-straw pyrochar and hydrochar used in the experiment.
2.3. Experimental Design
Hydrochar and pyrochar were amended to soil at three application ratios (1%, 3%, and 5%), and the treatments were named HC-1%/3%/5% and PC-1%/3%/5%, respectively. Soils without char addition were also included as controls. Each treatment was performed in triplicate. Urea (46.7% N) was adopted as the nitrogen fertilizer. The two experiments below were conducted synchronously from July 2022 to September 2022.
2.3.1. Segmented Aerobic Incubation
Two-stage aerobic incubation was conducted to study the effect of the two char amendments on soil nitrification. For the first stage, 300 g of air-dried soil, adjusted to 70% field moisture capacity, was placed in a 500 mL open glass bottle, and then the chars were appended to the soils in accordance with the treatment doses. The bottles covered with breathable film were placed in a 25 °C incubator for 14 days, and water loss was replenished regularly by weighing. After this stage, 55 g of fresh soil was collected to analyze the soil pH, NH4+-N, NO3−-N, electrical conductivity (EC), microbial biomass carbon/nitrogen (MBC/MBN), dissolved organic carbon (DOC), ammonia-oxidizing archaea (AOA)-amoA, and ammonia-oxidizing bacteria (AOB)-amoA gene copies. For the second stage, urea at an input rate of 150 mg N kg−1 was added to all the treatments. The soils with N input were then incubated at 25 °C for 60 days, and samples were collected to determine pH, NH4+-N and NO3−-N contents at different time intervals (2, 4, 8, 12, 16, 20, 25, 30, 40, 50, and 60 days).
2.3.2. Soil Column Leaching
A polyvinyl chloride (PVC) column with an 8 cm internal diameter × 30 cm height was adopted to investigate the loss of NO3−-N from the soil by leaching. The bottom of the column was covered with monolayer nylon strainer, and filter paper and quartz sand were placed on the strainer to prevent possible loss of tiny soil particles during leaching. Thereafter, 900 g of air-dried soil with or without char addition was filled into the column, which was subsequently covered by filter paper and quartz sand to reduce disturbance from simulated precipitation on the soil surface. The columns were successively amended with 361 mL of deionized water and 50 mL of urea solution (equal to a 150 mg N k−1 application rate) by a peristaltic pump, and the total liquid volume (411 mL) was approximately the same as the saturated water-holding capacity of the control soil (45.71%). After 12 h of equilibration, 120 mL of deionized water was instilled to the soil at a rate of 1 mL min-1 by a peristaltic pump, and this time was recorded as the initial (0 day) leaching. The leachate was collected by a 500 mL plastic cup placed beneath the soil column. Soil column leaching was conducted every 5 days up to 60 days. After finished, the soil surface sample of the packed column was taken with a ring knife to measure the saturated water holding capacity. The total volume of simulated precipitation was 238.9 mm, approximately equal to the mean annual precipitation in Xuancheng over two months (238.3 mm).
2.4. Analytical Methods
Soil pH was measured by a pH meter (FE28, Mettler Toledo, Zurich, Switzerland) in deionized water at a 1:2.5 (soil/water, w/w) ratio. A flow analyzer (AA3, Seal Analytical, London, UK) was adopted to determine the NH4+-N and NO3−-N contents in the soil and leachate. DOC was extracted with deionized water, and the extract was filtered through a 0.22 μm filter membrane. Microbial biomass carbon and nitrogen were determined by the chloroform fumigation extraction method [33]. The DOC, MBC, and MBN contents were measured with a C/N analyzer (Multi N/C 3100, Analytik Jena, Jena, Germany). The method used for soil DNA extraction and quantitative real-time PCR of amoA genes was described by Shi et al. [34]. The main primers used for amoA-AOA or amoA-AOB were Arch-amoAF_Arch-amoAR and AmoA-1F_AmoA-2R, respectively. The copy numbers of amoA were calculated from the concentration of extracted plasmid DNA. The population sizes of AOA and AOB were represented by normalized amoA copies per gram of soil. Soil EC was determined by an EC meter (DDSJ-318, Leici, Shanghai, China) at a 1:5 (soil/water, w/w) ratio. Leachate volume was measured with a 100 mL graduated cylinder.
2.5. Evaluation of Net H+ Production
Equations (1) and (2) are the reaction formulas for urea hydrolysis and nitrification, respectively, and Equation (3) is the overall reaction of urea to generate NO3− as determined by merging Equations (1) and (2). Equation (3) demonstrates that the theoretical formation of 1 mol NO3−-N is concomitant with the production of 1 mol H+ following urea addition in upland soils, a finding corroborated by Huang et al. [35]. In addition, there was no proton input caused by acid deposition and depletion of base ions under the specific conditions in this study. Therefore, it can be estimated that the increment of NO3−-N content—ΔNO3−-N (mol kg−1) during one period t (d) is basically equal to the net H+ production—ΔH+ (mol kg−1). The net nitrification rate R, R (mg kg−1 d−1) = ΔNO3−-N (mol kg−1)/t (d), can represent the intensity of nitrification and H+ production in a specific period. In addition, the amount of H+ produced from NO3−-N leaching is the same as the cumulative leaching loss of NO3−-N, as NO3−-N leaching loss causes equivalent H+ accumulation.
CO(NH2)2 + 3H2O → 2NH4+ + 2OH− + CO2
NH4+ + 2O2 → NO3− + 2H+ + H2O
CO(NH2)2 + 3O2 + H2O → 6H+ + 2NO3− + CO2
2.6. Data Analysis
The differences among treatments were statistically analyzed with one-way ANOVA followed by the least significant difference (LSD) post hoc test (p < 0.05) in SPSS 25.0. The program package ‘plspm’ in RStudio 4.3.1 was utilized to construct a partial least squares path model (PLSPM). SigmaPlot 14.0 was used for graph generation.
3. Results
3.1. pH
Decreases in soil pH were strongly associated with nitrification, especially when a large amount of NH4+ accumulated in the soil. As illustrated in Figure 1, the pH in all the treatments soared after urea application within the initial 4 days and then started to decrease. This tendency was successively caused by urea hydrolysis (Equation (1)) and nitrification (Equation (2)). However, there were some distinctions in the trends among the treatments. Soil pH in the control and PC treatments began to decrease after 4 days and stabilized after 40 days in the PC treatment group, while it continued to decrease in the control group. HC addition delayed the initial time of soil acidification to 8–12 days. By the end of incubation, soil pH in PC-1%/3%/5% treatments was significantly higher than that in the control (p < 0.05) by 0.17, 0.36, and 0.39, respectively. The pH of HC-added soil increased with HC application rate elevation, with only HC-5% notably higher than control. This difference may have occurred due to the strong liming effect and high specific surface area of pyrochar, which neutralizes some protons and enhances the soil pH buffering capacity [36,37].
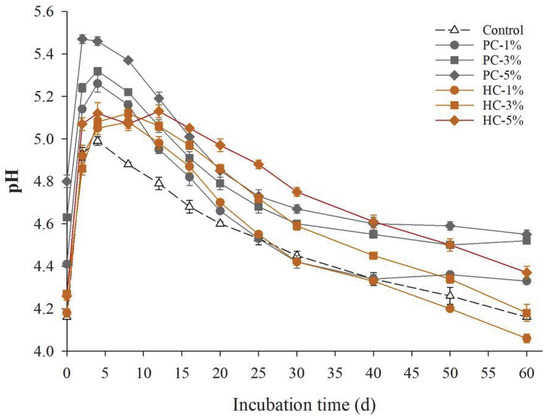
Figure 1.
Soil pH dynamics after urea application. Symbols and error bars represent the mean ± standard error (SE; n = 3). The coefficient of variation among replicates was less than 8% in some cases, therefore error bars are not visible at this scale. PC, pyrochar; HC, hydrochar.
3.2. Soil Nitrification
3.2.1. NH4+-N and NO3−-N
The variation trends in the NH4+-N (Figure 2A) and NO3−-N (Figure 2B) contents in the soil primarily indicated the nitrification intensity. The temporal pattern in the NH4+-N content during incubation was similar to that of soil pH; the NH4+-N content rapidly rose at the beginning, peaked (108.73–111.88 mg kg−1) after 4 days in all treatments, and then gradually declined. The NO3−-N content in the HC and control treatments increased continuously during incubation but stabilized after 40 days in PC treatments. Both chars diminished the NH4+-N content during the initial period (4–20 days) of soil acidification. For the net nitrification rate in different periods (Table 2), the rates in the HC-3%/5% treatments in the early stage (0–20 days) were 0.69 and 0.41 mg kg−1 days−1, respectively, which were significantly lower than those in the control and PC treatments (p < 0.05), indicating that HC addition suppressed nitrification at the initial stage after nitrogen input. However, during the middle and late periods (20–60 days), the net nitrification rates in the HC and control treatments were notably greater than that in the PC treatment (p < 0.05); this divergence could be attributed to a gradual suppression of nitrification in the PC treatment.
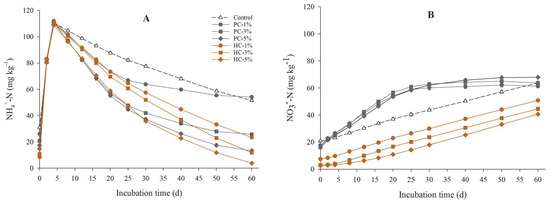
Figure 2.
Dynamics of NH4+-N (A) and NO3−-N (B) content in soils after urea application. Symbols and error bars represent the mean ± standard error (SE; n = 3). The coefficient of variation among replicates was less than 8% in some cases; therefore, error bars are not visible at this scale. PC, pyrochar; HC, hydrochar.
Table 2.
Soil net nitrification rate in different period and total increment of NO3−-N (ΔNO3−-N) after urea application.
As described in Section 2.5, the net proton production from nitrification is approximately equal to the variation in NO3−-N (Table 2). A comparison of the effects of hydrochar and pyrochar addition revealed that only HC-5% significantly reduced the net H+ production (p < 0.05), while pyrochar exhibited much higher ΔNO3—N in both 3% and 5% ratio than hydrochar and control, indicating that the application of higher amounts of hydrochar may inhibit the net H+ production caused by nitrification.
3.2.2. MBC, MBN, and DOC
Soil microbes boost the assimilation of NH4+-N when the available carbon source is relatively abundant [38], which inhibits nitrification. Soil MBC is commonly used to represent the total size of soil microbes. It is obvious that, compared with the control and PC additions, the HC application prominently enhanced the soil MBC (p < 0.05), while there were no significant differences between the control and PC treatments (Table 3). The MBC values in the soils with HC were 98.95 (1%), 127.11 (3%), and 207.38 mg kg−1 (5%) greater than those in the corresponding PC treatments. Similar differences were also observed in MBN and DOC content. For example, compared with the corresponding PC-3%/5% treatment, the HC-3%/5% treatment increased MBN by 10.43 and 15.81 mg kg−1 and promoted DOC content by 87.02 and 134.54 mg kg−1. These results explain the disparities in soil MBC and initial NH4+-N and NO3−-N contents among the treatments before urea application. DOC is a typical available carbon source that can be readily utilized by soil microbes; thus, increasing the DOC content strongly stimulates microbial biomass and promotes nitrogen immobilization. Although MBN may also originate from both soil and biochar sources, the total nitrogen content in these two pools is extremely low and predominantly exists in forms resistant to short-term degradation. Consequently, microbial immobilization of nitrogen from these sources is unlikely to cause significant differences in MBN across treatments.
Table 3.
The content of microbial biomass carbon (MBC), microbial biomass nitrogen (MBN), and dissolved organic carbon (DOC) on soils before urea addition.
3.2.3. AOA and AOB
- (1)
- amoA gene copies in AOA and AOB
Ammonia oxidation is a rate-limiting step in nitrification and is driven by AOA and AOB, which encode the subunit of ammonia monooxygenase [39]; thus, the abundance of AOA and AOB are strongly correlated with the soil nitrification rate. The amoA gene copy numbers of AOA and AOB are primary indicators of the abundance of these microorganisms. As Figure 3 illustrated, AOA had a hundred-fold greater competitive advantage than AOB in all the treatments, largely because AOA prefer acidic and nitrogen-deficient soil conditions [40]. HC application significantly enhanced the AOA population size by 25.62–153.19% than the control (p < 0.05), whereas PC showed no such effect. Relative to the control, the AOB population size was increased by 12.38–22.39% in the soils with HC or by 10.70% and 13.03% in PC-3% and PC-5%, respectively. It can be concluded from the above results that HC and PC application exert differential impacts on the population sizes of AOA and AOB.
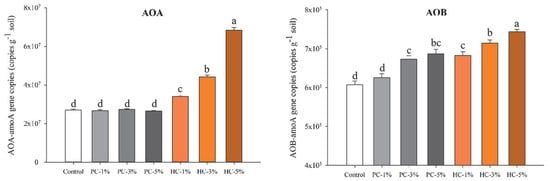
Figure 3.
Gene copies of AOA-amoA and AOB-amoA (Mean ± SE; n = 3) in soils before urea application. Significant differences among the treatments are marked as different lowercase letters on the pillars (p < 0.05). PC, pyrochar; HC, hydrochar.
- (2)
- Influence of soil properties on AOA and AOB abundance
The abundance and activity of AOA and AOB depend on soil environmental conditions, and the four primary factors comprise pH, DOC, EC, and NH4+-N content [41]. As listed in Table 4, the initial pH in the PC treatments was elevated by 0.25–0.64 units relative to the control, while it was also markedly higher than that in the HC treatments by 0.23–0.54 units at the same application ratio (p < 0.05), which was undoubtedly caused by the strong liming effect of pyrochar. All the char addition treatments significantly reduced the initial NH4+-N content (p < 0.05), and the higher the char application ratio was, the more pronounced the reduction. The decrease in the HC treatment (52.37–72.88%) was greater than that in the PC treatment (15.36–43.65%). PC addition prominently enhanced soil EC, while HC-3%/5% significantly mitigated it (p < 0.05).
Table 4.
Soil initial pH, NH4+-N content, and electrical conductivity (EC) value before urea application.
Based on the above results, a partial least squares path model (PLSPM) was employed to clarify how AOA/AOB abundance was affected by related soil properties (Figure 4). Biochar amendment altered soil pH, EC, and DOC content before urea addition. The increase in DOC content stimulated the expansion of soil microbial biomass, which promoted microbial immobilization of NH4+-N, resulting in the decrease in NH4+-N content. In addition, soil pH also had a certain negative effect on the NH4+-N content. The mitigation of NH4+-N substrate elevated the gross abundance of AOA and AOB, mainly because AOA was the dominant species under these experimental conditions. Furthermore, the increase in DOC content directly enhanced the total abundance of AOA/AOB, while pH and EC did not have synergistic effects on the DOC content. This suggests that the dominant effects of soil DOC and NH4+-N on AOA/AOB abundance outweighed the influence of pH and EC, consistent with a previous finding [42]. In addition, it was reported that EC may simultaneously have both positive and negative effects on the abundance of AOB in some cases [41]; therefore, EC did not have a significant effect overall.
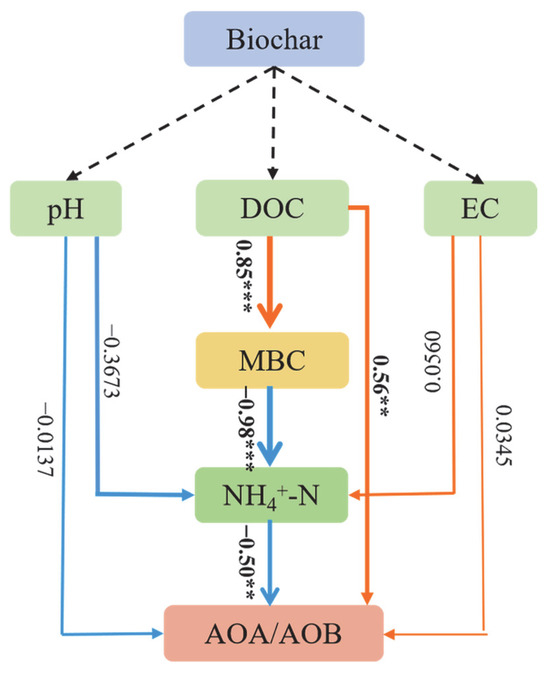
Figure 4.
Partial least square path model (PLSPM) for the influence of soil characteristics on AOA/AOB abundance. The goodness of fit (GOF) for PLSPM = 0.8534, *** p < 0.001, ** p < 0.01.
3.3. Cumulative Leaching Loss of NO3−-N
Nitrate leaching, a key process in the soil nitrogen cycle, contributes to soil acidification due to proton release associated with NO3−-N loss. The cumulative amount of leached NO3−-N was determined by the leachate volume and the NO3−-N content remaining in the soil. As shown in Table 5, HC-3% and HC-5% reduced cumulative leachate volumes by 19 and 34 mL compared to the control (p < 0.05), and by 16 and 29 mL compared to PC treatments, respectively. This discrepancy was supported by the observation that the greatest improvement in saturated water-holding capacity (SWC) occurred in the HC treatment (Table 5). Compared with the control, HC application notably decreased the cumulative leaching loss of NO3−-N by 9.25–12.67 mg. In contrast to HC, PC addition significantly increased NO3−-N leaching loss (p < 0.05), likely due to higher residual NO3−-N content in the soil.
Table 5.
The cumulative leaching loss of NO3−-N, leachate volume, and soil saturated water-holding capacity.
4. Discussion
This study showed that hydrochar addition reduced the net nitrification rate within 0–20 days after fertilization, with 5% hydrochar application significantly lowering net H+ production from nitrification. In addition, hydrochar application reduced the leachate volume by improving the soil saturated water-holding capacity, thereby mitigating the loss of NO3−-N and decreasing the risk of acidification. In contrast, pyrochar application increased the net nitrification rate shortly after fertilization, along with higher net H+ production and greater NO3−-N leaching loss. The disparities in the effects of hydrochar and pyrochar application are primarily attributed to the variations in the char characteristics. The differences in the mechanism of action of the two chars is discussed mainly from the perspective of char properties in the following section.
4.1. Effects and Distinctions of Hydrochar and Pyrochar Addition on Soil Nitrification
Nitrification represents a crucial process in the soil nitrogen cycle and serves as the primary acidogenic pathway. Our study demonstrated that hydrochar amendment significantly suppressed the net nitrification rate during early stages following nitrogen application, whereas pyrochar enhanced it. Previous research has documented similar stimulatory effects of pyrochar on ammonia oxidation rates 2–4 weeks after nitrogen addition [43], consistent with our findings. However, limited studies have specifically examined hydrochar’s effects on this process. These contrasting effects may stem from differential impacts on NH4+-N immobilization and ammonia-oxidizing microbial communities. The aliphatic nature of hydrochar’s carbon fractions, compared to pyrochar’s predominantly aromatic structures [44], results in faster decomposition and greater DOC release [45,46], ultimately promoting microbial biomass accumulation (Table 3). The observed nitrification suppression likely reflects microbial NH4+-N assimilation for growth [38], aligning with Bargmann et al.’s [47] report of substantial microbial N retention following char amendments, particularly with hydrochar. Their finding of equivalent MBN accumulation and mineral N depletion in hydrochar-treated soils provides strong support for this mechanism.
As depicted in Section 3.2.3, hydrochar and pyrochar affected the abundance of AOA and AOB by altering related soil properties. AOA and AOB exhibit obvious niche differentiation: AOA are more suitable for acidic and nitrogen-deficient environments, while AOB prefer neutral-alkaline and nitrogen-abundant environments [40,48]. The pH of hydrochar is weakly acidic, while that of pyrochar is alkaline (Table 1); therefore, hydrochar induced a significantly smaller pH elevation compared to pyrochar. Furthermore, hydrochar addition notably reduced the initial NH4+-N content by promoting microbial nitrogen immobilization, and the decrease was greater than that caused by pyrochar; critically, hydrochar amendment substantially increased DOC availability, directly enhancing AOA and AOB proliferation [49]. The above discussion indicates that hydrochar application enhanced the population size of AOA/AOB by providing an available carbon source, and the increment of AOA was significantly higher than that of AOB, as the soil environment altered by hydrochar addition was more suitable for AOA survival. Unlike hydrochar, pyrochar amendment did not significantly elevate soil DOC content; however, the higher pH conditions it created were more favorable for AOB proliferation, resulting in only a marginal increase in AOB abundance.
In the early stage after fertilization, the rapid elevation of soil pH and NH4+-N accumulation triggered by urea hydrolysis may impede or stimulate the activity of AOA or AOB, respectively. Guo et al. [41] confirmed that the nitrification potential of AOA and AOB is highly sensitive to soil pH, EC, and NH4+ content, and they also suggested that AOB are the primary contributors (84.73–89.10%) to nitrification potential in most nitrogen-fertilized soils. A meta-analysis [50] evaluated that the contribution of AOB to the nitrification rate in global acidic soils can reach 59.5%. These findings collectively demonstrate that NH4+-based fertilizers enhance nitrification potential in acidic soils. However, the elevation of nitrification potential arisen from nitrogen input might be neutralized by NH4+-N assimilation in soils amended with hydrochar. Therefore, during the early period after nitrogen input, the reduction in the net nitrification rate by hydrochar was mainly due to the lifted immobilization of NH4+-N substrate by soil microorganisms. In contrast, pyrochar had the opposite effect because of the obvious increase in soil pH due to its liming effect, as pH is the most important factor controlling AOB activity and nitrification potential.
4.2. Effects and Distinctions of Hydrochar and Pyrochar Addition on Nitrate Leaching
NO3−-N is transported downward with water movement in soil, and its leaching risk primarily depends on the NO3−-N concentration in soil and the capacity of the soil to retain water and NO3−-N. In the present study, hydrochar addition significantly mitigated the cumulative loss of NO3−-N by leaching, verifying the finding of Mau et al. [17], while pyrochar had the opposite effect. Many previous studies [51,52,53] have indicated that pyrochar can reduce NO3−-N leaching, but there have also been some contradictory results [54,55]. The variable effects of pyrochar application generally stem from multiple factors including soil properties [56], application rate [57], amendment method [58], and irrigation management [59]. Nevertheless, research focused on the effect of hydrochar is very limited. In addition to the differences in soil NO3−-N content among the treatments mentioned in Section 3.2.1, the variations in soil SWC and NO3−-N adsorption owing to the various properties between two chars are also important factors. The higher SWC in soils amended with hydrochar could be attributed to the strong water absorption capacity of hydrochar (Table 1), which is most likely derived from the plentiful carbon spheres on its surface (Figure S1). Previous studies by Gao et al. [14] and Jain et al. [60] have indicated that these carbon spheres possess hydrophobic cores and hydrophilic shells, which facilitates the adhesion of water to their surfaces. In addition, considering the diameter of a single water molecule (0.4 nm) and that 21 water molecules make up the smallest water droplet [61], the wider average pore size of hydrochar may increase the ease with which water droplet enter its pores (Table 1).
In terms of adsorption (Table S1), the NO3−-N adsorption capacity of hydrochar (3.50 mg g−1) was slightly higher than that of pyrochar (2.29 mg g−1); thus, hydrochar is expected to retain more NO3−-N during the leaching process. The fitting results of batch adsorption experiments showed that the adsorption of NO3−-N by both chars was more consistent with the Langmuir and pseudo-second-order equations (Table S1), indicating that the sorption mechanism was predominantly chemisorption in the form of surface monolayer, which was similar to findings in recent work [62]. The mechanisms of NO3−-N adsorption may include electrostatic interaction, ion exchange, surface complexation, and hydrogen bonding [63,64].
5. Conclusions
Although hydrochar application enhanced AOA and AOB abundances to varying degrees by providing abundant DOC and altering soil conditions, it also markedly enhanced soil microbial immobilization of NH4+-N, thereby inhibiting the net nitrification rate in the early stage after nitrogen fertilization. Hydrochar amendment can effectively mitigate the leaching potential of NO3−-N, which is primarily attributed to its excellent hydroscopicity, strong adsorption capacity, and suppressive effect on the net nitrification rate in the early stage after fertilization. In conclusion, hydrochar effectively mitigated net H+ production related to the soil nitrogen cycle and alleviated soil acidification. However, limited by indoor incubation conditions, the mitigation effects of rice–straw hydrochar application on soil nitrification and NO3−-N leaching need to be further verified under field conditions.
Supplementary Materials
The following supporting information can be downloaded at https://www.mdpi.com/article/10.3390/agronomy15081777/s1, Figure S1: Morphology of rice–straw hydrochar (A–D) and pyrochar (E,F) surface photographed by scanning electron microscope (SEM); Table S1: The model fitting degree (R2) and saturated adsorption capacity of hydrochar and pyrochar for NH4+-N and NO3−-N adsorption.
Author Contributions
Conceptualization, W.Y. and C.L.; methodology, W.Y. and C.L.; software, W.Y., Q.Z., S.H., and Y.J.; validation, W.Y. and Q.Z.; formal analysis, W.Y.; investigation, W.Y. and S.H.; resources, C.L.; data curation, W.Y. and Q.Z.; writing—original draft preparation, W.Y.; writing—review and editing, W.Y. and C.L.; visualization, Y.J.; supervision, C.L.; project administration, C.L.; funding acquisition, W.Y. and C.L. All authors have read and agreed to the published version of the manuscript.
Funding
This research was funded by the Agriculture Science & Technology Innovation Project of Shandong Academy of Agriculture Sciences (CXGC2025G08), National Key Research and Development Program of China (2023YFD1901505), and China Agriculture Research System (CARS-12).
Data Availability Statement
The data presented in this study are openly available in FigShare at https://doi.org/10.6084/m9.figshare.25357192, reference number 25357192.
Acknowledgments
We appreciate Shang Han and Naiyu Zhang for their help in soil sampling and the experiment.
Conflicts of Interest
The authors declare no conflicts of interest. The funders had no role in the design of the study; in the collection, analyses, or interpretation of data; in the writing of the manuscript; or in the decision to publish the results.
References
- Kopittke, P.M.; Menzies, N.W.; Wang, P.; McKenna, B.A.; Lombi, E. Soil and the intensification of agriculture for global food security. Environ. Int. 2019, 132, 105078. [Google Scholar] [CrossRef] [PubMed]
- Guo, J.H.; Liu, X.J.; Zhang, Y.; Shen, J.L.; Han, W.X.; Zhang, W.F.; Christie, P.; Goulding, K.W.T.; Vitousek, P.M.; Zhang, F.S. Significant Acidification in Major Chinese Croplands. Science 2010, 327, 1008–1010. [Google Scholar] [CrossRef] [PubMed]
- Goulding, K.W.T. Factors affecting soil pH and the use of different liming materials. In Proceedings of the International Fertiliser Society Conference, Cambridge, UK, 11 December 2015. [Google Scholar]
- Dong, Y.; Yang, J.L.; Zhao, X.R.; Yang, S.H.; Mulder, J.; Dörsch, P.; Peng, X.H.; Zhang, G.L. Soil acidification and loss of base cations in a subtropical agricultural watershed. Sci. Total Environ. 2022, 827, 154338. [Google Scholar] [CrossRef] [PubMed]
- Zeng, M.; de Vries, W.; Bonten, L. Model-based analysis of the long-term effects of fertilization management on cropland soil acidification. Environ. Sci. Technol. 2017, 51, 3843–3851. [Google Scholar] [CrossRef] [PubMed]
- Zhou, H.Y.; Xu, M.G.; Cai, Z.J.; Wen, S.L.; Wu, H.H. Quantitative analysis of driving-factors of soil acidification in Qiyang county, Hunan province. Sci. Agric. Sin. 2019, 52, 1400–1412. [Google Scholar] [CrossRef]
- Bolan, N.; Sarmah, A.K.; Bordoloi, S.; Bolan, S.; Padhye, L.P.; Van Zwieten, L.; Sooriyakumar, P.; Khan, B.A.; Ahmad, M.; Solaiman, Z.M.; et al. Soil acidification and the liming potential of biochar. Environ. Pollut. 2023, 317, 120632. [Google Scholar] [CrossRef] [PubMed]
- Shi, R.Y.; Li, J.Y.; Ni, N.; Xu, R.K. Understanding the biochar’s role in ameliorating soil acidity. J. Integr. Agric. 2019, 18, 1508–1517. [Google Scholar] [CrossRef]
- Parshetti, G.K.; Hoekman, S.K.; Balasubramanian, R. Chemical, structural and combustion characteristics of carbonaceous products obtained by hydrothermal carbonization of palm empty fruit bunches. Bioresour. Technol. 2013, 135, 683–689. [Google Scholar] [CrossRef] [PubMed]
- Kambo, H.S.; Dutta, A. A comparative review of biochar and hydrochar in terms of production, physico-chemical properties and applications. Renew. Sust. Energ. Rev. 2015, 45, 359–378. [Google Scholar] [CrossRef]
- Yihunu, E.W.; Minale, M.; Abebe, S.; Limin, M. Preparation, characterization and cost analysis of activated biochar and hydrochar derived from agricultural waste: A comparative study. SN Appl. Sci. 2019, 1, 873. [Google Scholar] [CrossRef]
- Lang, Q.; Zhang, B.; Liu, Z.; Jiao, W.; Xia, Y.; Chen, Z.; Li, D.; Ma, J.; Gai, C. Properties of hydrochars derived from swine manure by CaO assisted hydrothermal carbonization. J. Environ. Manag. 2019, 233, 440–446. [Google Scholar] [CrossRef] [PubMed]
- Li, F.; Zimmerman, A.R.; Zheng, Y.; Yang, Y.; Huang, J.; Zhang, Y.; Hu, X.; Yu, Z.; Huang, J.; Gao, B. P-enriched hydrochar for soil remediation: Synthesis, characterization, and lead stabilization. Sci. Total Environ. 2021, 783, 146983. [Google Scholar] [CrossRef] [PubMed]
- Gao, Y.; Wang, X.H.; Yang, H.P.; Chen, H.P. Characterization of products from hydrothermal treatments of cellulose. Energy 2012, 42, 457–465. [Google Scholar] [CrossRef]
- Sevilla, M.; Fuertes, A.B. Chemical and structural properties of carbonaceous products obtained by hydrothermal carbonization of saccharides. Chem. Eur. J. 2009, 15, 4195–4203. [Google Scholar] [CrossRef] [PubMed]
- Liu, Z.; Wang, Z.; Chen, H.; Cai, T.; Liu, Z. Hydrochar and pyrochar for sorption of pollutants in wastewater and exhaust gas: A critical review. Environ. Pollut. 2021, 268, 115910. [Google Scholar] [CrossRef] [PubMed]
- Mau, V.; Arye, G.; Gross, A. Poultry litter hydrochar as an amendment for sandy soils. J. Environ. Manag. 2020, 271, 110959. [Google Scholar] [CrossRef] [PubMed]
- Abel, S.; Peters, A.; Trinks, S.; Schonsky, H.; Facklam, M.; Wessolek, G. Impact of biochar and hydrochar addition on water retention and water repellency of sandy soil. Geoderma 2013, 202, 183–191. [Google Scholar] [CrossRef]
- Gronwald, M.; Don, A.; Tiemeyer, B.; Helfrich, M. Effects of fresh and aged chars from pyrolysis and hydrothermal carbonization on nutrient sorption in agricultural soils. Soil 2015, 1, 475–489. [Google Scholar] [CrossRef]
- Yin, S.; Zhang, X.; Suo, F.; You, X.; Yuan, Y.; Cheng, Y.; Zhang, C.; Li, Y. Effect of biochar and hydrochar from cow manure and reed straw on lettuce growth in an acidified soil. Chemosphere 2022, 288, 134191. [Google Scholar] [CrossRef] [PubMed]
- George, E.; Ventura, M.; Panzacchi, P.; Scandellari, F.; Tonon, G. Can hydrochar and pyrochar affect nitrogen uptake and biomass allocation in poplars? J. Plant Nutr. Soil. Sci. 2017, 180, 178–186. [Google Scholar] [CrossRef]
- Andert, J.; Mumme, J. Impact of pyrolysis and hydrothermal biochar on gas-emitting activity of soil microorganisms and bacterial and archaeal community composition. Appl. Soil Ecol. 2015, 96, 225–239. [Google Scholar] [CrossRef]
- Rex, D.; Schimmelpfennig, S.; Jansen-Willems, A.; Moser, G.; Kammann, C.; Müller, C. Microbial community shifts 2.6 years after top dressing of Miscanthus biochar, hydrochar and feedstock on a temperate grassland site. Plant Soil 2015, 397, 261–271. [Google Scholar] [CrossRef]
- Gronwald, M.; Helfrich, M.; Don, A.; Fuß, R.; Well, R.; Flessa, H. Application of hydrochar and pyrochar to manure is not effective for mitigation of ammonia emissions from cattle slurry and poultry manure. Biol. Fertil. Soils 2018, 54, 451–465. [Google Scholar] [CrossRef]
- Kammann, C.; Ratering, S.; Eckhard, C.; Müller, C. Biochar and hydrochar effects on greenhouse gas (carbon dioxide, nitrous oxide, and methane) fluxes from soils. J. Environ. Qual. 2012, 41, 1052–1066. [Google Scholar] [CrossRef] [PubMed]
- Scheifele, M.; Hobi, A.; Buegger, F.; Gattinger, A.; Schulin, R.; Boller, T.; Mäder, P. Impact of pyrochar and hydrochar on soybean (Glycine max L.) root nodulation and biological nitrogen fixation. J. Plant Nutr. Soil Sci. 2017, 180, 199–211. [Google Scholar] [CrossRef]
- Yu, W.; Ren, T.; Duan, Y.; Huai, S.; Zhang, Q.; Cai, Z.; Lu, C. Mechanism of Al toxicity alleviation in acidic red soil by rice-straw hydrochar application and comparison with pyrochar. Sci. Total Environ. 2023, 877, 162849. [Google Scholar] [CrossRef] [PubMed]
- Pansu, M.; Gautheyrou, J. Handbook of Soil Analysis: Mineralogical, Organic and Inorganic Methods; Springer: Heidelberg, Germany, 2006. [Google Scholar]
- Watson, C.; Schlösser, C.; Vögerl, J.; Wichern, F. Hydrochar, digestate, and process water impacts on a soil’s microbial community, processes, and metal bioavailability. Soil Sci. Soc. Am. J. 2021, 85, 717–731. [Google Scholar] [CrossRef]
- Barrett, E.P.; Joyner, L.G.; Halenda, P.P. The determination of pore volume and area distributions in porous substances. I. computations from nitrogen isotherms. J. Am. Chem. Soc. 1951, 73, 373–380. [Google Scholar] [CrossRef]
- Boehm, H.P. Some aspects of the surface chemistry of carbon blacks and other carbons. Carbon 1994, 32, 759–769. [Google Scholar] [CrossRef]
- Wu, L.; Liu, M. Preparation and properties of chitosan-coated NPK compound fertilizer with controlled-release and water-retention. Carbohydr. Polym. 2008, 72, 240–247. [Google Scholar] [CrossRef]
- Brookes, P.C.; Landman, A.; Pruden, G.; Jenkinson, D.S. Chloroform fumigation and the release of soil nitrogen: A rapid direct extraction method to measure microbial biomass nitrogen in soil. Soil Biol. Biochem. 1985, 17, 837–842. [Google Scholar] [CrossRef]
- Shi, R.Y.; Ni, N.; Nkoh, J.N.; Li, J.Y.; Xu, R.K.; Qian, W. Beneficial dual role of biochars in inhibiting soil acidification resulting from nitrification. Chemosphere 2019, 234, 43–51. [Google Scholar] [CrossRef] [PubMed]
- Huang, P.; Zhang, J.B.; Xin, X.L.; Zhu, A.N.; Zhang, C.Z.; Ma, D.H.; Zhu, Q.G.; Yang, S.; Wu, S.J. Proton accumulation accelerated by heavy chemical nitrogen fertilization and its long-term impact on acidifying rate in a typical arable soil in the Huang-Huai-Hai Plain. J. Integr. Agric. 2015, 14, 148–157. [Google Scholar] [CrossRef]
- Shi, R.Y.; Hong, Z.N.; Li, J.Y.; Jiang, J.; Baquy, M.A.; Xu, R.K.; Qian, W. Mechanisms for increasing the pH buffering capacity of an acidic ultisol by crop residue-derived biochars. J. Agric. Food Chem. 2017, 65, 8111–8119. [Google Scholar] [CrossRef] [PubMed]
- Xu, R.; Zhao, A.; Yuan, J.; Jiang, J. pH buffering capacity of acid soils from tropical and subtropical regions of China as influenced by incorporation of crop straw biochars. J. Soils Sediments 2012, 12, 494–502. [Google Scholar] [CrossRef]
- Pan, W.; Zhou, J.; Tang, S.; Wu, L.; Ma, Q.; Marsden, K.A.; Chadwick, D.R.; Jones, D.L. Utilisation and transformation of organic and inorganic nitrogen by soil microorganisms and its regulation by excessive carbon and nitrogen availability. Biol. Fertil. Soils 2023, 59, 379–389. [Google Scholar] [CrossRef]
- Hu, B.; Liu, S.; Wang, W.; Shen, L.; Lou, L.; Liu, W.; Tian, G.; Xu, X.; Zheng, P. pH-dominated niche segregation of ammonia-oxidising microorganisms in Chinese agricultural soils. FEMS Microbiol. Ecol. 2014, 90, 290–299. [Google Scholar] [CrossRef]
- Schleper, C. Ammonia oxidation: Different niches for bacteria and archaea? ISME J. 2010, 4, 1092–1094. [Google Scholar] [CrossRef] [PubMed]
- Guo, J.; Ling, N.; Chen, H.; Zhu, C.; Kong, Y.; Wang, M.; Shen, Q.; Guo, S. Distinct drivers of activity, abundance, diversity and composition of ammonia-oxidizers: Evidence from a long-term field experiment. Soil Biol. Biochem. 2017, 115, 403–414. [Google Scholar] [CrossRef]
- Bai, X.; Hu, X.; Liu, J.; Wei, D.; Zhu, P.; Cui, X.; Zhou, B.; Chen, X.; Liu, J.; Jin, J.; et al. Ammonia oxidizing bacteria dominate soil nitrification under different fertilization regimes in black soils of northeast China. Eur. J. Soil Biol. 2022, 111, 103410. [Google Scholar] [CrossRef]
- Song, Y.; Zhang, X.; Ma, B.; Chang, S.X.; Gong, J. Biochar addition affected the dynamics of ammonia oxidizers and nitrification in microcosms of a coastal alkaline soil. Biol Fertil Soils 2014, 50, 321–332. [Google Scholar] [CrossRef]
- Zhang, Z.; Zhu, Z.; Shen, B.; Liu, L. Insights into biochar and hydrochar production and applications: A review. Energy 2019, 171, 581–598. [Google Scholar] [CrossRef]
- Hu, B.; Wang, K.; Wu, L.; Yu, S.H.; Antonietti, M.; Titirici, M.M. Engineering carbon materials from the hydrothermal carbonization process of biomass. Adv. Mater. 2010, 22, 813–828. [Google Scholar] [CrossRef] [PubMed]
- Islam, M.A.; Limon, M.S.H.; Romić, M.; Islam, M.A. Hydrochar-based soil amendments for agriculture: A review of recent progress. Arab. J. Geosci. 2021, 14, 102. [Google Scholar] [CrossRef]
- Bargmann, I.; Martens, R.; Rillig, M.C.; Kruse, A.; Kücke, M. Hydrochar amendment promotes microbial immobilization of mineral nitrogen. J. Plant Nutr. Soil Sci. 2014, 177, 59–67. [Google Scholar] [CrossRef]
- He, J.Z.; Hu, H.W.; Zhang, L.M. Current insights into the autotrophic thaumarchaeal ammonia oxidation in acidic soils. Soil Biol. Biochem. 2012, 55, 146–154. [Google Scholar] [CrossRef]
- Liu, J.; Yu, Z.; Yao, Q.; Sui, Y.; Shi, Y.; Chu, H.; Tang, C.; Franks, A.E.; Jin, J.; Liu, X.; et al. Ammonia-oxidizing archaea show more distinct biogeographic distribution patterns than ammonia-oxidizing bacteria across the black soil zone of northeast China. Front. Microbiol. 2018, 9, 171. [Google Scholar] [CrossRef] [PubMed]
- Lin, Y.; Hu, H.W.; Ye, G.; Fan, J.; Ding, W.; He, Z.Y.; Zheng, Y.; He, J.Z. Ammonia-oxidizing bacteria play an important role in nitrification of acidic soils: A meta-analysis. Geoderma 2021, 404, 115395. [Google Scholar] [CrossRef]
- Aller, D.M.; Archontoulis, S.V.; Zhang, W.; Sawadgo, W.; Laird, D.A.; Moore, K. Long term biochar effects on corn yield, soil quality and profitability in the US Midwest. Field Crop. Res 2018, 227, 30–40. [Google Scholar] [CrossRef]
- Chen, P.; Liu, Y.; Mo, C.; Jiang, Z.; Yang, J.; Lin, J. Microbial mechanism of biochar addition on nitrogen leaching and retention in tea soils from different plantation ages. Sci. Total Environ. 2021, 757, 143817. [Google Scholar] [CrossRef] [PubMed]
- Kalu, S.; Oyekoya, G.N.; Ambus, P.; Tammeorg, P.; Simojoki, A.; Pihlatie, M.; Karhu, K. Effects of two wood-based biochars on the fate of added fertilizer nitrogen—a 15N tracing study. Biol. Fertil. Soils 2021, 57, 457–470. [Google Scholar] [CrossRef]
- Eykelbosh, A.J.; Johnson, M.S.; Couto, E.G. Biochar decreases dissolved organic carbon but not nitrate leaching in relation to vinasse application in a Brazilian sugarcane soil. J. Environ. Manag. 2015, 149, 9–16. [Google Scholar] [CrossRef] [PubMed]
- Oraegbunam, C.J.; Obalum, S.E.; Watanabe, T.; Madegwa, Y.M.; Uchida, Y. Differences in carbon and nitrogen retention and bacterial diversity in sandy soil in response to application methods of charred organic materials. Appl. Soil Ecol. 2022, 170, 104284. [Google Scholar] [CrossRef]
- Teutscherova, N.; Houška, J.; Navas, M.; Masaguer, A.; Benito, M.; Vazquez, E. Leaching of ammonium and nitrate from Acrisol and Calcisol amended with holm oak biochar: A column study. Geoderma 2018, 323, 136–145. [Google Scholar] [CrossRef]
- Libutti, A.; Cammerino, A.R.B.; Francavilla, M.; Monteleone, M. Soil Amendment with biochar affects water drainage and nutrient losses by leaching: Experimental evidence under field-grown conditions. Agronomy 2019, 9, 758. [Google Scholar] [CrossRef]
- Li, S.; Zhang, Y.; Yan, W.; Shangguan, Z. Effect of biochar application method on nitrogen leaching and hydraulic conductivity in a silty clay soil. Soil Tillage Res. 2018, 183, 100–108. [Google Scholar] [CrossRef]
- Farahani, S.S.; Asoodar, M.A.; Moghadam, B.K. Short-term impacts of biochar, tillage practices, and irrigation systems on nitrate and phosphorus concentrations in subsurface drainage water. Environ. Sci. Pollut. Res. 2019, 27, 761–771. [Google Scholar] [CrossRef] [PubMed]
- Jain, A.; Balasubramanian, R.; Srinivasan, M.P. Hydrothermal conversion of biomass waste to activated carbon with high porosity: A review. Chem. Eng. J. 2016, 283, 789–805. [Google Scholar] [CrossRef]
- Rognoni, A.; Conte, R.; Ceotto, M. How many water molecules are needed to solvate one? Chem. Sci. 2021, 12, 2060–2064. [Google Scholar] [CrossRef] [PubMed]
- Zhang, Z.; Huang, G.; Zhang, P.; Shen, J.; Wang, S.; Li, Y. Development of iron-based biochar for enhancing nitrate adsorption: Effects of specific surface area, electrostatic force, and functional groups. Sci. Total Environ. 2023, 856, 159037. [Google Scholar] [CrossRef] [PubMed]
- Liu, Y.; Zhang, X.; Wang, J. A critical review of various adsorbents for selective removal of nitrate from water: Structure, performance and mechanism. Chemosphere 2022, 291, 132728. [Google Scholar] [CrossRef] [PubMed]
- Zhang, M.; Song, G.; Gelardi, D.L.; Huang, L.; Khan, E.; Mašek, O.; Parikh, S.J.; Ok, Y.S. Evaluating biochar and its modifications for the removal of ammonium, nitrate, and phosphate in water. Water Res. 2020, 186, 116303. [Google Scholar] [CrossRef] [PubMed]
Disclaimer/Publisher’s Note: The statements, opinions and data contained in all publications are solely those of the individual author(s) and contributor(s) and not of MDPI and/or the editor(s). MDPI and/or the editor(s) disclaim responsibility for any injury to people or property resulting from any ideas, methods, instructions or products referred to in the content. |
© 2025 by the authors. Licensee MDPI, Basel, Switzerland. This article is an open access article distributed under the terms and conditions of the Creative Commons Attribution (CC BY) license (https://creativecommons.org/licenses/by/4.0/).