Abstract
Climate change presents urgent and complex challenges to agricultural sustainability and food security, particularly in regions reliant on resource-intensive staple crops. Smart agriculture—through the integration of crop modeling, satellite remote sensing, and artificial intelligence (AI)—offers data-driven strategies to enhance productivity, optimize input use, and mitigate greenhouse gas (GHG) emissions. This study introduces Farmdee-Mesook, a mobile-first smart agriculture platform designed specifically for Thai rice farmers. The platform leverages AquaCrop simulation, open-access satellite data, and localized agronomic models to deliver real-time, field-specific recommendations. Usability-focused design and no-cost access facilitate its widespread adoption, particularly among smallholders. Empirical results show that platform users achieved yield increases of up to 37%, reduced agrochemical costs by 59%, and improved water productivity by 44% under alternate wetting and drying (AWD) irrigation schemes. These outcomes underscore the platform’s role as a scalable, cost-effective solution for operationalizing climate-smart agriculture. Farmdee-Mesook demonstrates that digital technologies, when contextually tailored and institutionally supported, can serve as critical enablers of climate adaptation and sustainable agricultural transformation.
1. Introduction
Climate change significantly disrupts agricultural production by altering temperature regimes, precipitation patterns, and the frequency of extreme weather events. Rising temperatures can induce heat stress in crops, diminishing both yield and quality. For staple crops such as wheat, maize, and rice, studies suggest that each 1 °C increase in temperature may reduce yields by approximately 6–10% [1]. Moreover, shifts in precipitation result in either prolonged droughts or increased flooding, both of which are detrimental to crop productivity. Drought reduces water availability—crucial for plant growth and soil health—leading to lower yields and potential crop failure. Excess rainfall, on the other hand, promotes soil erosion, nutrient leaching, and waterlogging, all of which impair crop development [2]. Additionally, climate variability alters the distribution and intensity of pests and diseases, with warmer and more humid conditions favoring their proliferation [3].
Policy instruments such as Border Carbon Adjustments (BCAs) and carbon regulations are designed to curb GHG emissions and foster sustainable practices. These policies impose economic costs on high-emission goods, incentivizing the adoption of low-carbon methods. In agriculture, BCAs affect the competitiveness of imported high-emission products, thereby encouraging domestic producers to adopt emission-reducing practices [4].
Smart agriculture, powered by precision technologies such as GPS, IoT sensors, and data analytics, offers practical tools to align agricultural practices with these emerging sustainability standards. Precision farming enhances input efficiency by allowing the site-specific application of water, fertilizers, and pesticides—reducing waste and minimizing GHG emissions associated with overuse [5]. Additionally, smart agriculture enhances adaptive capacity by leveraging real-time weather forecasting and predictive analytics to inform planting and harvesting decisions. Innovations in irrigation systems, such as automated sprinklers and drip irrigation, also help conserve water and improve drought resilience [6].
Thailand, one of the world’s top rice exporters, plays a central role in the global rice supply chain. However, its rice cultivation sector is also a major source of GHG emissions. Methane (CH4) emissions from continuously flooded paddy fields constitute the largest share, followed by nitrous oxide (N2O) emissions arising from inefficient nitrogen fertilizer application. Together, these gases significantly contribute to the country’s agricultural emissions footprint. According to the Thailand Greenhouse Gas Management Organization (TGO), rice cultivation accounts for more than 50% of emissions from the agricultural sector [7]. These emissions not only exacerbate global warming but also risk economic penalties under emerging carbon regulation frameworks [4]. Consequently, transforming rice production to adopt low-emission practices is both an environmental and economic imperative.
Several mitigation strategies have been identified to reduce the GHG emissions associated with rice production in Thailand. One of the most effective is the adoption of alternate wetting and drying (AWD) irrigation, which reduces methane emissions by avoiding continuous flooding. Studies show that AWD can cut CH4 emissions by 30–70% while maintaining or even improving yield performance [8]. Another promising approach is site-specific nutrient management (SSNM), which optimizes fertilizer application based on soil conditions and crop demand, thereby lowering nitrous oxide emissions and improving the nitrogen use efficiency [9]. Additionally, integrated crop–livestock systems, the use of organic amendments like compost instead of synthetic fertilizers, and the development of low-emission rice cultivars through breeding or biotechnology offer scalable options for climate-smart rice farming [10]. When combined with digital decision-support tools, these practices can significantly enhance both environmental sustainability and farmer profitability.
In this context, we introduce Farmdee-Mesook Version 1.6 (meaning “Good Farm–Good Life”), a smart agriculture platform specifically designed for Thai rice farmers. The platform integrates diverse data sources and a crop simulation model to deliver services including crop health monitoring, yield prediction, irrigation and fertilizer scheduling, and pest management. It is freely available and designed for ease of use to maximize adoption.
This study aims to evaluate the following research questions:
- Can a mobile-based smart agriculture platform improve crop yield and reduce input costs for Thai rice farmers?
- To what extent can digital tools like Farmdee-Mesook support climate-smart practices such as AWD and nutrient optimization?
- What conditions are necessary for sustained user engagement and platform effectiveness?
The central hypothesis of this research is the following: “Farmdee-Mesook can help farmers to improve crop production and reduce farming costs if they deliberate on the platform’s guidelines.” This hypothesis forms the basis for evaluating the platform’s agronomic and behavioral impacts.
2. Materials and Methods
2.1. Background
The proposed platform is built upon two foundational technologies: a mobile-based application and a crop simulation model. With the ubiquity of mobile networks, farmers can now access digital agricultural services virtually anywhere via smartphones. In this system, the mobile application functions as the primary interface for data input and user interaction, while cloud-based services handle data processing, product generation, and advisory delivery.
Central to the platform is a crop simulation model, which allows for dynamic scenario analysis by simulating the interactions between climate, crop characteristics, and farming practices—collectively forming an input dataset. By adjusting these inputs, the model can estimate potential yields and provide recommendations tailored to each farm’s unique conditions. For example, it can evaluate how variations in water or fertilizer application affect crop productivity and greenhouse gas (GHG) emissions. This capability empowers farmers to optimize input use while balancing agronomic and environmental outcomes. Since input datasets vary geographically, the platform facilitates site-specific management through localized simulations, reducing reliance on technical expertise at the user end.
2.1.1. Mobile-Based Smart Agriculture Platforms
In recent years, mobile-based smart agriculture platforms have emerged as powerful tools for enhancing productivity, resource efficiency, and sustainability across farming systems. These platforms integrate diverse data streams—including weather observations, satellite imagery, IoT sensor data, and field records—to generate real-time insights and recommendations. Several prominent platforms share conceptual similarities with Farmdee-Mesook and are summarized below.
Climate FieldView (version 9.2.0.1345274), developed by The Climate Corporation, is one of the most widely adopted commercial platforms. It offers real-time field data integration through machinery sensors, weather feeds, and satellite imagery. Its core functionalities include variable-rate seeding and fertilization, crop health analysis, and yield visualization via both mobile and web applications. However, its pricing model relies on subscription-based services and it is designed primarily for mechanized, large-scale farming operations [11].
CropIn Grow (version 2.33.00) (also known as SmartFarm Plus) provides a globally deployed digital farm management solution. It supports more than 500 crop types and delivers a suite of services, including weather forecasting, pest alerts, traceability, and input scheduling. While it includes Thai language support and is accessible via mobile/web platforms, it is optimized for enterprise-level agribusiness and may involve significant licensing or customization costs [12].
CropX (version 7.17.0) employs in-field IoT sensors and telemetry to offer precision irrigation and fertilizer management. Through a mobile app interface, users receive real-time recommendations based on soil moisture profiles and weather data. Despite its effectiveness, the platform requires the purchase and installation of proprietary sensors, limiting its accessibility for smallholder farmers [13].
Prospera Insights leverages artificial intelligence and high-resolution imagery to detect early signs of irrigation stress, pest damage, and crop diseases. Designed for commercial greenhouses and specialty crop farms, it provides mobile alerts and input optimization recommendations. However, like other commercial solutions, its scope is not specific to rice or regional GHG mitigation objectives.
These platforms represent significant advancements in digital agriculture, yet they commonly target high-input, commercial-scale systems. Most rely on proprietary hardware, subscription models, and general-purpose analytics not tailored to specific local contexts. From a research perspective, recent developments include the HandySense B-Farm platform, developed by the National Electronics and Computer Technology Center (NECTEC), which utilizes IoT sensors and AI analytics to monitor soil moisture and guide irrigation decisions in real time [14]. Additionally, regional-scale platforms such as the FFTC-AP Smart Agriculture Platform integrate satellite imagery and GIS data for crop monitoring and extension support [15]. Globally, research-oriented platforms using remote sensing and crop modeling, such as those reviewed by Wang et al. [16], and frameworks proposed by IRRI for climate-smart rice [10], reflect the convergence of satellite data, decision-support tools, and sustainability goals. Table 1 and Table 2 compare the functionality of Farmdee-Mesook with global smart agriculture platforms, highlighting the breadth of features integrated into this study’s platform.

Table 1.
Comparison of core features between Farmdee-Mesook and selected commercial smart agriculture platforms.

Table 2.
Comparison of functionalities between Farmdee-Mesook and selected research-oriented smart agriculture platforms.
2.1.2. Crop Simulation Models
Crop simulation models are widely used to understand how environmental variables, management practices, and crop physiology interact to influence yield. Among them, AquaCrop (developed by the FAO) is particularly suited to water-limited environments and has gained popularity for irrigation planning, yield forecasting, and climate change adaptation studies [17]. Other major models include DSSAT (Decision Support System for Agrotechnology Transfer), APSIM (Agricultural Production Systems Simulator), and CERES (Crop Environment Resource Synthesis), which provide more comprehensive physiological or biophysical modeling but require high-resolution input data and expert calibration [18,19,20]. While DSSAT and APSIM offer broad crop support and detailed physiological modeling, their complexity and high data demands can hinder their practical deployment among smallholder farmers. CERES provides robust physiological modeling but also demands extensive data and calibration. In contrast, AquaCrop emphasizes water productivity and is particularly suited for herbaceous crops in developing-country contexts due to its moderate input requirements and user-oriented interface (Table 3).

Table 3.
Key characteristics of commonly used crop simulation models, including AquaCrop, DSSAT, APSIM, and CERES.
The adoption of AquaCrop in mobile- and web-based platforms has been increasing. Other innovations include IoT-linked decision-support platforms such as the AquaCrop-IoT system, which employs RGB camera imagery and open access weather data to optimize irrigation schedules in real time [21]. A large-scale regional AquaCrop implementation over Europe also demonstrated the model’s scalability by integrating MERRA-2 climate data and Sentinel-derived biomass estimates to simulate crop productivity across 1 km grids with high correlations with ground observations [22].
In 2023, a study demonstrated that AquaCrop calibration can be significantly improved using metaheuristic algorithms like the Water Cycle Algorithm (WCA), which assimilates Sentinel-2 canopy and biomass observations into the model. This approach enhances yield forecast accuracy and illustrates the synergy between satellite-derived biophysical data and AquaCrop’s conceptual simplicity [23].
Farmdee-Mesook builds on and extends these precedents. It uses AquaCrop simulations recalibrated by Sentinel-2 NDVI, but enhances its functionality by incorporating AI-assisted fertilizer guidance, automated AWD irrigation scheduling, and mobile accessibility for rural farmers. Unlike sensor-based platforms, Farmdee-Mesook requires no physical infrastructure and relies solely on government APIs, satellite data, and user feedback—making it uniquely scalable and cost-effective.
These developments demonstrate that AquaCrop-based mobile systems are not only technically viable but increasingly essential tools for climate-resilient, precision agriculture. Farmdee-Mesook represents a critical evolution in this trajectory—bridging scientific modeling, national policy needs, and on-farm decision-making through a single, user-friendly interface (Table 4).

Table 4.
Summary of recent studies incorporating the AquaCrop model, highlighting input data, methods, and performance outcomes.
2.2. The Proposed Platform
The design of the Farmdee-Mesook platform is guided by the principles of usability, accessibility, and agronomic accuracy. It is intended to serve Thai rice farmers—many of whom have limited digital literacy—by offering an intuitive interface and automated simulation-driven insights. This section outlines the functional components, system architecture, and data workflows that support the platform’s operations.
2.2.1. Platform Workflow and Functionality
From Figure 1, it can be seen that all users must first register with the platform via the mobile application. Registration ensures authentication and enables the creation of individual “projects,” which represent farm plots cultivated under uniform practices. For each project, users provide basic inputs such as geolocation, rice variety, and planting date. These inputs initialize simulations using the AquaCrop model.
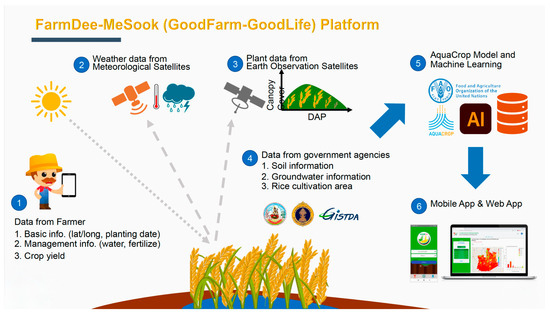
Figure 1.
System workflow of the Farmdee-Mesook platform, illustrating user registration, project creation, data input, AquaCrop simulation, and advisory delivery through mobile and web interfaces.
The platform uses satellite-derived data to supplement user inputs. Rainfall estimates are derived from Fengyun (FY-2) meteorological satellites, and temperature data from MODIS sensors aboard the Terra and Aqua satellites. Weather variables are compiled as 10-day averages, which serve as AquaCrop inputs. During the crop cycle, actual weather data progressively replace historical 5-year averages to simulate yield changes, allowing farmers to observe the influence of climate variability in near-real-time. Examples of the mobile app user interface are depicted in Figure 2 and Figure 3.
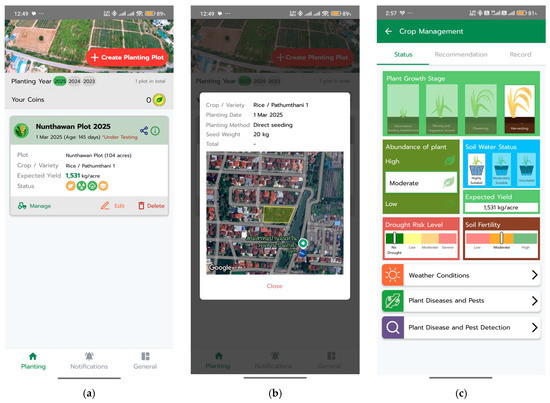
Figure 2.
Farmdee-Mesook mobile application interface (in Thai): (a) plot summary overview; (b) editing input data for a selected plot; and (c) crop monitoring dashboard showing yield forecasts, weather outlooks, and pest alerts based on field images.
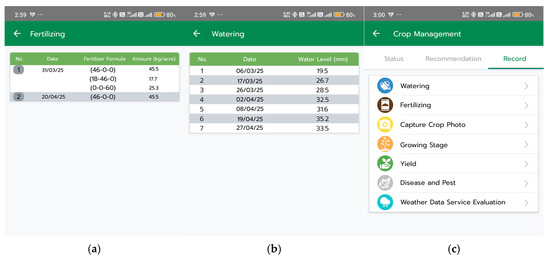
Figure 3.
Farmdee-Mesook mobile application interface (continued): (a) fertilizer recommendation tool; (b) irrigation scheduling assistant; and (c) feedback form for submitting field data used to improve simulation accuracy.
Crop condition is monitored using canopy cover data derived from Sentinel-2 imagery. This parameter correlates with crop health and yield potential and can be used to recalibrate AquaCrop simulations mid-season. In AquaCrop, crop water use is governed by the basal crop coefficient (Kcb), which represents the transpiration component of evapotranspiration and is functionally linked to the fraction of canopy cover (CC). Unlike the traditional FAO-56 crop coefficient (Kc), which includes both transpiration and soil evaporation, AquaCrop models these components separately to simulate actual crop evapotranspiration (ETc). Specifically, Kcb in AquaCrop is dynamically calculated based on crop development stages and environmental conditions and is directly proportional to CC and the reference evapotranspiration (ETo).
To enhance simulation accuracy, Sentinel-2-derived canopy cover estimates are compared with field observations during the mid-season stage (typically 6 to 8 weeks after planting). This calibration aligns the remote-sensing-derived CC with field-measured values, thereby improving the estimation of Kcb and crop transpiration (Tr = Kcb × ETo) through adjusting the fertility stress coefficient. The recalibrated CC-Kcb relationship serves as a scientifically grounded input for AquaCrop and enhances yield prediction reliability. Prior work has shown that recalibration at the mid-season stage significantly improves AquaCrop’s output fidelity [24].
Missing environmental data are retrieved from official government sources. Soil type data are provided by the Land Development Department (LDD), and groundwater levels by the Rice Department and the Department of Groundwater Resources (DGR). Pest and disease warnings are scraped from the Department of Agriculture based on crop type and location. These data are used to refine the simulation accuracy and deliver actionable insights to users.
Upon the daily update (1:00–8:00 a.m.), AquaCrop simulations are executed with all compiled inputs. The results are rendered to the web and mobile interfaces. The mobile app provides user-specific information at the plot level, while the web interface supports multi-scale visualization—ranging from individual fields to provincial summaries.
2.2.2. System Architecture
The Farmdee-Mesook platform is implemented as a modular cloud-based system hosted on virtual machines (VMs). Figure 4 shows its key components, including the following:
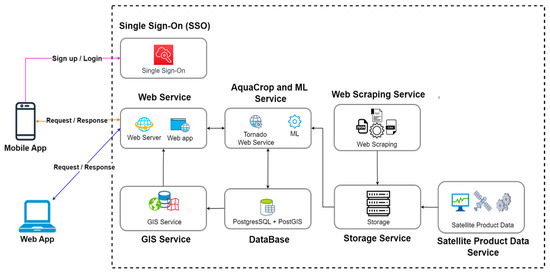
Figure 4.
System architecture of the Farmdee-Mesook platform, comprising integrated services such as user authentication, web and GIS services, AquaCrop execution, data scraping, and satellite data processing.
- Single Sign-On (SSO): Enables authenticated user access across mobile and web interfaces, and facilitates integration with third-party tools (e.g., smart machinery, drone services).
- Web Service: Built on IIS and the NET framework with C#, it supports GIS visualization (via WMS/WFS), RESTful APIs, and data interaction. A responsive UI is developed using Bootstrap 5.3.
- AquaCrop Service: Implemented in Python 3.11 using the Tornado web server 6.3.x, this module automates AquaCrop execution and stores simulation outputs. It is supported by the Pandas, NumPy, and GDAL libraries for preprocessing.
- Fertilizer Recommendation Module: A machine learning model based on a gradient-boosting algorithm was developed to predict N-P-K nutrient levels using three key features: the previous year’s annual rainfall, the soil type, and the elevation. The model was configured with the following parameters: validation_fraction = 0.3, n_estimators = 300, and max_depth = 30. It achieved classification accuracies of 0.82, 0.85, and 0.96 for nitrogen (N), phosphorus (P), and potassium (K), respectively. The training dataset comprised 25,986 samples of paddy fields collected by LDD between 2015 and 2021, and was randomly split into 70% for training and 30% for testing. The model outputs categorical predictions (low, medium, high) for each nutrient, which are then used to retrieve appropriate fertilizer formulations from the LDD’s Fertilizer Calculator API (https://osd101.ldd.go.th/osdlab/search_fertilizer.php, accessed on 11 July 2025).
- Web Scraping Module: Uses Requests, BeautifulSoup, and Pandas to extract environmental and agricultural data from government websites. Outputs are formatted as CSV, JSON, or PDF and archived for platform use.
- GIS Service: Powered by GeoServer with PostGIS and MySQL databases, it provides geospatial data products in raster and vector formats.
- Database and Storage: PostgreSQL/PostGIS is used for structured data. Satellite and scraped datasets are stored in a RAID-5 NAS system, accessible via SAMBA.
- Satellite Data Services: Daily automated ingestion of FY-2, MODIS (Terra/Aqua), and Sentinel-2 imagery enables the generation of rainfall, temperature, NDVI, and canopy cover products. These are processed and formatted for use within AquaCrop and platform visualizations.
2.2.3. Preconfiguring AquaCrop Input Datasets
To enable scalable simulations across the country, AquaCrop was preconfigured using historical data from the Office of Agricultural Economics (OAE). A dataset of 744,966 rice plots collected between 2017 and 2019 was used. After outlier filtering using a ±2 standard deviation (σ) rule, 713,598 samples remained, representing ten major rice varieties under both rainfed and irrigated systems.
AquaCrop input data are organized into four domains:
- Climate: Derived from satellite observations, including FY-2 rainfall and MODIS temperature products [25]. Evapotranspiration and CO2 concentrations are computed using standard climatic formulas.
- Crop: Sourced from OAE field records and the academic literature. This includes rice variety, seed weight, seedling pattern, planting/harvesting dates, base and optimal temperatures, harvest index, and rooting depth. Default basal crop coefficient (Kcb) values for rice were selected, which were 1.00, 1.15, and 0.70 for initial-, mid-, and end-season, respectively. Canopy cover curves used to estimate basal crop coefficients (Kcb) were calibrated using Sentinel-2 imagery and validated against field observations.
- Farm Management: Includes irrigation schedules based on regional agricultural guidelines. Soil fertility levels were assumed at 40%, 60%, and 80% for calibration scenarios.
- Soil: Soil texture and depth data were obtained from the Land Development Department (LDD), and groundwater table levels from the Department of Groundwater Resources (DGR).
2.2.4. Performance Evaluation and National Applicability
To validate the reliability and scalability of the platform across diverse agroecological zones, the performance of the AquaCrop simulations was evaluated using the calibrated dataset. Simulations were separated into two categories: rainfed (500,518 plots) and irrigated (213,080 plots), corresponding to Thailand’s 22.7% irrigated land coverage. For each category, yield simulations were compared to actual reported values using the Mean Absolute Percentage Error (MAPE). These dataset and simulation results were collectively structured and stored in the database, as shown in Figure 5 and Figure 6.

Figure 5.
Example of AquaCrop simulation results structured and stored in the platform’s central database for user-level decision support.
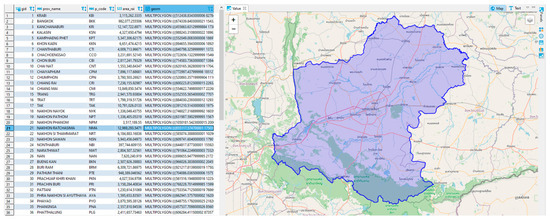
Figure 6.
Geospatial dataset visualization for Nakhon Ratchasima province, integrated into the Farmdee-Mesook platform’s GIS layer.
Results shown in Figure 7 and Figure 8 indicate that over 70% of simulated plots achieved an MAPE below 30%, with an average MAPE of 24.73% across all samples. Spatial analysis revealed consistent model performance across major rice-growing provinces. However, higher errors were noted in fields lacking weed management data, as weed coverage was assumed to be zero. This simplification likely resulted in an overestimation of yields in affected areas.
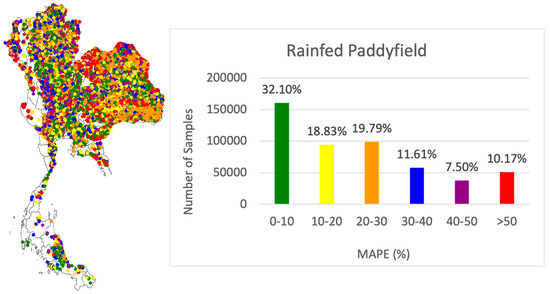
Figure 7.
Rainfed paddy field evaluation: (left) geographic distribution of sample plots; (right) distribution of Mean Absolute Percentage Error (MAPE) across simulations.
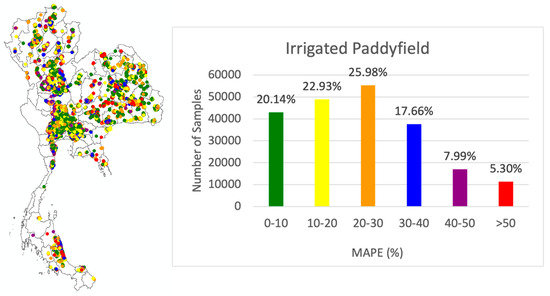
Figure 8.
Irrigated paddy field evaluation: (left) geographic distribution of sample plots; (right) distribution of Mean Absolute Percentage Error (MAPE) across simulations.
The mobile application addresses this limitation by enabling users to submit mid-season field data—such as weed density, fertilizer schedules, and canopy imagery—for real-time recalibration. This feedback loop strengthens the model’s predictive power and supports its countrywide deployment. The demonstrated accuracy and adaptability across various environmental conditions provide strong justification for Farmdee-Mesook’s national-scale applicability.
3. Results
3.1. Platform Deployment and Acceptance
The Farmdee-Mesook platform has been deployed nationwide across three annual training cohorts between 2021 and 2023 (designated as Year-1, Year-2, and Year-3). The primary objective was to introduce the platform to Thai rice farmers and assess its usability and perceived value in real-world farming contexts. Participants were recruited through local agricultural extension offices and vocational agricultural colleges, with a total of 1470 farmers trained (900 in Year-1, 218 in Year-2, and 252 in Year-3). Farmers were required to own smartphones with active internet connectivity.
Training sessions were conducted as one-day workshops and included live demonstrations, hands-on activities, and supplementary learning materials, such as instructional videos hosted on YouTube (https://www.youtube.com/@farmdee-Mesook1675 accessed on 11 July 2025). Post-training, participants were asked to evaluate the platform across five criteria: usability, responsiveness, functionality, applicability, and willingness to use. A 5-point Likert scale was used (1 = very dissatisfied, 5 = very satisfied).
The results summarized in Table 5 indicate that the platform achieved high acceptance across all criteria, with average scores ranging from 3.74 to 3.88. User feedback highlighted several areas for improvement, including support for an offline mode, the integration of text-to-speech functionality, expansion to industrial crops, and enhancements of the plot-drawing interface. These insights have informed the platform’s ongoing development roadmap.

Table 5.
Average user satisfaction scores for the Farmdee-Mesook platform across five evaluation criteria, based on post-training surveys from Year-1 to Year-3 users.
Use Case Scenarios: After training, farmers typically use the app to receive timely updates and make informed decisions at different crop stages. For example, early in the season, they use forecast data and AquaCrop-derived yield predictions to adjust planting dates and irrigation plans. During mid-season, satellite-derived canopy cover and pest alerts guide decisions on fertilizer and pesticide application. In drought-prone areas, farmers compare simulated yield outcomes to decide whether to request supplemental irrigation or delay transplanting. In the late season, the app offers harvest timing and productivity projections, supporting yield estimation for financial planning. These real-time, field-specific advisories reduce uncertainty and optimize resource use.
3.2. Platform Effectiveness: Yield and Cost Benefits
Following training, platform effectiveness was evaluated based on two key performance indicators: (1) average yield improvement, and (2) reduction in agrochemical expenses. The evaluation focused on users trained in Year-2 and Year-3, who had at least one complete crop cycle using the app.
3.2.1. Yield Improvement
Average yield data from platform users were compared with non-users using records from the Office of Agricultural Economics (OAE). Comparisons were made across three stratification levels: province, district, and rice variety. Yield improvements for Year-2 and Year-3 users are presented in Table 6 and Table 7, respectively.

Table 6.
Yield comparison between Farmdee-Mesook platform users and Office of Agricultural Economics (OAE) data for Year-2 users.

Table 7.
Yield comparison between Farmdee-Mesook platform users and Office of Agricultural Economics (OAE) data for Year-3 users.
User engagement frequency also correlated positively with yield improvements. Figure 9 summarizes yield improvements for Year-2 and Year-3 users grouped by their app engagement frequency.

Figure 9.
Relationship between user engagement frequency and yield improvement: (a) Year-2 user; (b) Year-3 user.
3.2.2. Cost Reduction
Agrochemical cost data (fertilizers, pesticides, fungicides) were collected from Year-3 users before and after platform usage. Users were grouped by their frequency of monthly app engagement. Table 8 shows that 50–70% of users in each group reduced their input costs by 42–59%. Users who did not realize savings typically reported one of two scenarios: (1) reluctance to adjust traditional practices despite app recommendations, or (2) an increase in fertilizer prices post-COVID-19, offsetting any quantity reductions.

Table 8.
Agrochemical cost savings reported by Year-3 users, categorized by monthly engagement frequency.
Note on Engagement Metrics: In this study, user engagement was quantified based on the number of feedback entries submitted by users, including field photographs (e.g., crop canopy development, pest or disease symptoms) and records of farming practices such as fertilization or irrigation events. However, it is important to note that some users may have actively utilized the platform for decision support without consistently submitting feedback. As a result, they were classified as low-engagement users under the current metric. This limitation may partially explain the observed variability in yield responses across different engagement groups. Future iterations of the platform will incorporate refined engagement metrics that better reflect both usage frequency and the quality of user interaction.
3.3. Collaboration with the Royal Irrigation Department for Water Conservancy
The experiments in Section 3.1 and Section 3.2 involved users without constraints on water availability, as irrigation is provided free-of-charge in designated service areas. However, the Royal Irrigation Department (RID) prioritizes efficient water use for long-term sustainability. To evaluate Farmdee-Mesook’s potential under water-conserving conditions, a pilot project was implemented in partnership with RID at Moonbon Dam (14°51′ N, 101°56′ E) in Nakhon Ratchasima, covering an irrigated area of 7200 hectares.
This pilot employed a non-randomized, observational study design comparing alternate wetting and drying (AWD) to conventional flooded irrigation. The AWD group consisted of 14 farmers who voluntarily adopted the RID-Mesook (RID-MS) variant of the app. Their outcomes were compared to nearby farmers practicing continuous flooding. The control fields were soil-type-matched and located adjacent to AWD plots within the same irrigation command area. All fields received similar rainfall inputs, but only the AWD group used the decision-support platform.
We acknowledge that this design introduces the following potential biases:
- Selection bias, as adopters of AWD may be more proactive or innovative;
- Performance bias, due to the absence of blinding;
- Unmeasured confounders, such as farmer experience or variation in on-farm practices.
Thus, the results are framed as preliminary but promising. Future randomized controlled trials and paired-plot studies are recommended to validate the findings and assess scalability.
During the pilot (2 May to 12 September 2023 using the Pathumthani-1 variety), AWD farmers submitted field data, including soil moisture, canopy imagery, and agronomic practices, which were used to refine AquaCrop simulations. The fields were loamy sand with pH 7.0–7.5 and moderate organic matter (~2%). As shown in Table 9, AWD improved the yield by 14%, reduced water use by 21%, and increased water productivity by 44% compared to flooded controls. These benefits were achieved without additional cost to the farmers, demonstrating the platform’s potential to support national water conservation goals.

Table 9.
Comparison of water usage and productivity between alternate wetting and drying (AWD) and conventional flooded irrigation practices during the RID-Mesook pilot.
RID has since committed to scaling the program to 1600 hectares and integrating predicted irrigation demand into its SCADA-controlled dam management systems.
3.4. Evaluating GHG Emission Reductions Under AWD Irrigation
To quantify the greenhouse gas (GHG) mitigation impact of AWD irrigation, we applied the Thailand Voluntary Emission Reduction (TVER) standard for rice cultivation, as issued by the Thailand Greenhouse Gas Management Organization (TGO). Under the TVER-METH-Agri-01 methodology, methane (CH4) emissions from continuously flooded rice fields are considered the baseline scenario.
Using a default emission factor of 1.30 kg CH4/ha/day and a crop cycle of 133 days, the total baseline emissions are:
Baseline CH4 = 1.30 × 133 = 172.9 kg CH4/ha/day/crop
AWD irrigation reduces CH4 emissions through increased soil aeration. Applying a conservative AWD correction factor (CFAWD) of 0.60 yields project emissions of:
AWD CH4 = 172.9 × 0.60 = 103.7 kg CH4/ha/crop
The reduction in CH4 emissions is:
172.9 − 103.7 = 69.2 CH4/ha/crop
Using a global warming potential (GWP) of 25 for CH4:
GHG Reduction = 69.2 × 25 = 1730 kg CO2-eq/ha/crop
Thus, AWD implementation supported by Farmdee-Mesook results in a GHG reduction of approximately 1.73 tCO2-eq per hectare per crop cycle. This outcome is consistent with TVER-registered practices and may be eligible for carbon credit verification under TGO guidelines [26].
4. Discussion
The Farmdee-Mesook platform was developed to operationalize climate-smart agriculture through a user-centric and scientifically grounded digital system. The platform aims to support Thai rice farmers by improving productivity, reducing greenhouse gas (GHG) emissions, and promoting data-driven decision-making. Results from both open and controlled experiments support the effectiveness of this approach, but several factors merit further consideration.
In open trials, farmers who received training demonstrated high acceptance of the platform, with satisfaction scores exceeding 3.7 out of 5 across all metrics. Constructive feedback provided by users guided the iterative improvement of the mobile app and dashboard. Feature requests such as offline functionality, support for industrial crops, and user-friendly interfaces for plot drawing highlight the importance of local adaptation and continuous development.
Yield and cost benefits observed among Year-2 and Year-3 users further validate the platform’s potential impact. Users who engaged with the platform at least six times per crop season reported average yield gains exceeding 28% compared to non-users. Additionally, 50–70% of users reported agrochemical cost reductions of between 42% and 59%. These results indicate that regular engagement with the platform can lead to measurable agronomic and economic improvements. However, the effectiveness depends on user compliance; benefits were not realized among those unwilling to change existing practices.
The collaboration with the Royal Irrigation Department (RID) further demonstrated Farmdee-Mesook’s value in structured irrigation management. The RID-Mesook (RID-MS) variant enabled quantifiable improvements in water use efficiency under alternate wetting and drying (AWD) practices. Compared to conventional flooding, AWD produced a 14% higher yield, consumed 21% less water, and achieved 44% greater water productivity. These outcomes offer a compelling case for integrating the platform into public water resource management programs.
Importantly, the integration of AWD irrigation also yielded substantial GHG mitigation benefits. Using the TVER-METH-Agri-01 methodology, AWD implementation in the RID-MS pilot area was estimated to reduce methane emissions by approximately 69.2 kg CH4 per hectare per crop cycle. When converted using a global warming potential (GWP) of 25, this resulted in an estimated reduction of 1.73 tCO2-eq per hectare per season. These reductions meet the eligibility criteria for Thailand’s voluntary carbon credit market and position Farmdee-Mesook as a potential MRV (monitoring, reporting, and verification) tool for GHG-related projects.
Despite these successes, challenges remain in scaling and sustaining platform adoption. The post-Year-3 decline in active users—nearly 80%—suggests that long-term engagement requires more than technical capability. Farmers may perceive the burden of interaction as outweighing the benefits, especially when outcomes are uncertain or delayed. Additionally, traditional safety nets such as government subsidies may reduce incentives to adopt new practices.
To ensure sustainable adoption and maximize benefits, strategic policy interventions are needed. For example, linking platform usage to eligibility for agricultural subsidies could increase motivation while improving traceability and data availability. The platform may be integrated into RID’s SCADA-controlled dam operations to prioritize water access for AWD-compliant users. Financial institutions could also incentivize platform adoption by offering favorable loan conditions to digitally verified users. Moreover, the Thailand Greenhouse Gas Management Organization (TGO) could play a role in certifying the platform for GHG accounting, facilitating farmers’ access to carbon markets.
Beyond its direct impact on individual farmers, Farmdee-Mesook has the potential to generate high-resolution agricultural big data. These data can support food traceability, early warning systems for crop failure, and policy planning. Future developments may include AI-assisted advisories, integration with IoT-based sensing networks, and expansion to additional crop types.
Overall, the platform represents a scalable, cost-effective solution for enhancing the resilience and sustainability of Thai agriculture. Continued innovation, combined with institutional support, will be critical to realizing its full potential.
5. Conclusions
Smart agriculture presents a transformative opportunity to address the interconnected challenges of climate change, food security, and environmental sustainability. By integrating crop simulation, satellite remote sensing, and data analytics, platforms like Farmdee-Mesook offer actionable, site-specific guidance to farmers in real time. This study demonstrates that Farmdee-Mesook is a viable and scalable solution for enabling Thai rice farmers to improve yield, reduce agrochemical costs, conserve water, and lower greenhouse gas (GHG) emissions—particularly through the adoption of alternate wetting and drying (AWD) practices.
The platform achieved significant agronomic and environmental outcomes: an up to 37% yield improvement, a 59% reduction in agrochemical inputs, a 44% increase in water productivity, and approximately 1.73 tCO2-eq/ha/crop cycle of methane mitigation under AWD. These benefits were achieved without requiring costly sensors or subscriptions, underscoring the accessibility and cost-effectiveness of the system.
However, several challenges must be addressed for its long-term success:
- User fatigue and dropout—particularly in the absence of ongoing incentives or institutional support—can reduce sustained engagement.
- Data input errors—such as incorrect planting dates or field locations—can degrade the accuracy of model outputs and advisories.
- Dependence on third-party APIs, especially for weather and environmental data, introduces risks of service disruption beyond the platform’s control.
These challenges highlight the need for resilient system architecture, user-centered design, and supportive policy frameworks.
To realize its full potential, Farmdee-Mesook should be integrated into institutional mechanisms—such as subsidy eligibility, financial incentives, and national carbon accounting schemes—to create long-term value for farmers and the environment alike.
In summary, Farmdee-Mesook exemplifies how digital innovation, when localized and user-centered, can empower smallholder farmers while advancing national goals for sustainable agriculture and climate action.
Author Contributions
Conceptualization, M.R. and W.V.; methodology, W.V.; software, M.R.; validation, M.R. and W.V.; formal analysis, W.V.; investigation, W.V.; resources, M.R.; data curation, W.V.; writing—original draft preparation, M.R.; writing—review and editing, W.V.; visualization, M.R.; supervision, M.R.; project administration, W.V.; funding acquisition, W.V. All authors have read and agreed to the published version of the manuscript.
Funding
This research was funded by BROADCASTING AND TELECOMMUNICATIONS RESEARCH AND DEVELOPMENT FUND FOR PUBLIC INTEREST, grant number D63-0-(2)-001.
Data Availability Statement
The dataset was obtained from several government agencies and is not available without permission. Restrictions apply to the availability of individual crop yield due to privacy under PDPA.
Acknowledgments
The authors acknowledge the Chulabhorn Satellite Receiving Station (CSRS) staff for their effort in filing the data collection and in platform development. This work would not be successful without their support. The authors have reviewed and edited the output and take full responsibility for the content of this publication.
Conflicts of Interest
The authors declare no conflicts of interest. The funders had no role in the design of the study; in the collection, analyses, or interpretation of data; in the writing of the manuscript; or in the decision to publish the results.
Abbreviations
The following abbreviations are used in this manuscript:
| AWD | Alternate Wetting and Drying |
| BCA | Border Carbon Adjustment |
| GHG | Greenhouse Gas |
| GPS | Global Positioning System |
| IoT | Internet of Things |
| LDD | Land Development Department |
| NECTEC | National Electronics and Computer Technology Center |
| OAE | Office of Agricultural Economics |
| RID | Royal Irrigation Department |
| RID-MS | RID-Mesook |
| SCADA | Supervisory Control and Data Acquisition |
| TGO | Thailand Greenhouse Gas Management Organization |
| TVER | Thailand Voluntary Emission Reduction |
References
- Lobell, D.B.; Schlenker, W.; Costa-Roberts, J. Climate trends and global crop production since 1980. Science 2011, 333, 616–620. [Google Scholar] [CrossRef] [PubMed]
- Rosegrant, M.W.; Magalhaes, E.; Valmonte-Santos, R.A.; Mason-D’Croz, D. Returns to investment in reducing postharvest food losses and increasing agricultural productivity growth. Agric. Econ. 2017, 48, 35–47. [Google Scholar] [CrossRef]
- Bebber, D.P.; Ramotowski, M.A.T.; Gurr, S.J. Crop pests and pathogens move polewards in a warming world. Nat. Clim. Change 2013, 3, 985–988. [Google Scholar] [CrossRef]
- Cosbey, A.; Droege, S.; Fischer, C.; Munning, C. Developing guidance for implementing border carbon adjustments: Lessons, cautions, and research needs from the literature. Rev. Environ. Econ. Policy 2019, 13, 3–22. [Google Scholar] [CrossRef]
- Gebbers, R.; Adamchuk, V. Precision agriculture and food security. Science 2010, 327, 828–831. [Google Scholar] [CrossRef] [PubMed]
- Wolfert, S.; Ge, L.; Verdouw, C.; Bogaardt, M.J. Big data in smart farming: A review. Agric. Syst. 2017, 153, 69–80. [Google Scholar] [CrossRef]
- United Nations Framework Convention on Climate Change (UNFCCC), Thailand. Biennial Update Report (BUR). BUR 4. Available online: https://unfccc.int/documents/624750 (accessed on 11 July 2025).
- Richards, M.; Sander, B.O. Alternate Wetting and Drying in Irrigated Rice: Implementation Guidance for Policymakers and Investors; CGIAR Research Program on Climate Change, Agriculture and Food Security (CCAFS): Copenhagen, Denmark, 2014. [Google Scholar]
- Pampolino, M.F.; Dobermann, A.; Johnston, A.; Witt, C. Regional-specific nutrient management for maize: Nutrient Expert®—A decision support tool for smallholder farmers. Agric. Syst. 2012, 107, 13–22. [Google Scholar] [CrossRef]
- IRRI. Climate-Smart Rice. International Rice Research Institute. Available online: https://www.irri.org/climate-smart-rice (accessed on 11 July 2025).
- Climate FieldView. Available online: https://climate.com (accessed on 11 July 2025).
- CropIn Grow. Available online: https://www.cropin.com (accessed on 11 July 2025).
- CropX. Available online: https://www.cropx.com (accessed on 11 July 2025).
- HandySense B-Farm. National Electronics and Computer Technology Center (NECTEC), Thailand. Available online: https://www.nectec.or.th (accessed on 11 July 2025).
- Food and Fertilizer Technology Center for the Asian and Pacific Region (FFTC). FFTC-AP Platform. Available online: https://ap.fftc.org.tw (accessed on 11 July 2025).
- Wang, J.; Wang, Y.; Li, G.; Qi, Z. Integration of Remote Sensing and Machine Learning for Precision Agriculture: A Comprehensive Perspective on Applications. Agronomy 2024, 14, 1975. [Google Scholar] [CrossRef]
- Steduto, P.; Raes, D.; Hsiao, T.C.; Fereres, E. AquaCrop—The FAO crop model to simulate yield response to water: I. Concepts and underlying principles. Agron. J. 2009, 101, 426–437. [Google Scholar] [CrossRef]
- Jones, J.W.; Hoogenboom, G.; Porter, C.H.; Boote, K.J.; Batchelor, W.D.; Hunt, L.A.; Wilkens, P.W.; Singh, U.; Gijsman, A.J.; Ritchie, J.T. The DSSAT cropping system model. Eur. J. Agron. 2003, 18, 235–265. [Google Scholar] [CrossRef]
- Keating, B.A.; Carberry, P.S.; Hammer, G.L.; Probert, M.E.; Robertson, M.J.; Holzworth, D.; Huth, N.I.; Hargreaves, J.N.G.; Meinke, H.; Hochman, Z. An overview of APSIM, a model designed for farming systems simulation. Eur. J. Agron. 2003, 18, 267–288. [Google Scholar] [CrossRef]
- Ritchie, J.T.; Otter, S. Description and performance of CERES-Wheat: A user-oriented wheat yield model. In ARS Wheat Yield Project; ARS-38; National Technical Information Service: Springfield, MO, USA, 1985; pp. 159–175. [Google Scholar]
- Puig, F.; Garcia-Vila, M.; Soriano, M.; Rodríguez-Díaz, J. AquaCrop-IoT: A smart irrigation platform integrating real-time images and weather forecasting. Comput. Electron. Agric. 2025, 235, 110372. [Google Scholar] [CrossRef]
- Malek, Ž.; Karssenberg, D.; Verburg, P.H. High-Resolution Distributed AquaCrop Modeling across Europe Using Remote Sensing and Climate Reanalysis. Geosci. Model Dev. 2021, 14, 7309–7330. [Google Scholar] [CrossRef]
- Akbari, E.; Boloorani, A.D.; Verrelst, J.; Pignatti, S. Assimilating Satellite-Based Biophysical Variables Data into AquaCrop Model for Silage Maize Yield Estimation Using Water Cycle Algorithm. Remote Sens. 2023, 16, 4665. [Google Scholar] [CrossRef]
- Veerakachen, W.; Raksapatcharawong, M. RiceSAP: An efficient satellite-based AquaCrop platform for rice crop monitoring and yield prediction on a farm-to-regional scale. Agronomy 2020, 10, 858. [Google Scholar] [CrossRef]
- Veerakachen, W.; Raksapatcharawong, M. Rainfall estimation for real-time flood monitoring using geostationary meteorological satellite data. Adv. Space Res. 2015, 56, 1139–1145. [Google Scholar] [CrossRef]
- Thailand Greenhouse Gas Management Organization (TGO). TVER-METH-Agri-01: Methodology for Methane Emission Reduction from Intermittent Irrigation in Rice Cultivation; TGO: Bangkok, Thailand, 2020; Available online: https://www.tgo.or.th (accessed on 11 July 2025).
Disclaimer/Publisher’s Note: The statements, opinions and data contained in all publications are solely those of the individual author(s) and contributor(s) and not of MDPI and/or the editor(s). MDPI and/or the editor(s) disclaim responsibility for any injury to people or property resulting from any ideas, methods, instructions or products referred to in the content. |
© 2025 by the authors. Licensee MDPI, Basel, Switzerland. This article is an open access article distributed under the terms and conditions of the Creative Commons Attribution (CC BY) license (https://creativecommons.org/licenses/by/4.0/).