Article

Evaluation of Soil Quality and Balancing of Nitrogen Application Effects in Summer Direct-Seeded Cotton Fields Based on Minimum Dataset

1
Jiangxi Provincial Key Laboratory of Plantation and High Valued Utilization of Specialty Fruit Tree and Tea, Jiangxi Economic Crops Research Institute, Nanchang 330000, China
2
State Key Laboratory of Cotton Bio-Breeding and Integrated Utilization, Institute of Cotton Research, Chinese Academy of Agricultural Sciences, Anyang 455000, China
*
Authors to whom correspondence should be addressed.
Agronomy 2025, 15(8), 1763; https://doi.org/10.3390/agronomy15081763
Submission received: 25 June 2025 / Revised: 21 July 2025 / Accepted: 22 July 2025 / Published: 23 July 2025
(This article belongs to the Special Issue Innovations in Green and Efficient Cotton Cultivation)

Abstract

There is a lack of systematic research on the comprehensive regulatory effects of urea and organic fertilizer application on soil quality and cotton yield in summer direct-seeded cotton fields in the Yangtze River Basin. Additionally, there is a redundancy of indicators in the cotton field soil quality evaluation system and a lack of reports on constructing a minimum dataset to evaluate the soil quality status of cotton fields. We aim to accurately and efficiently evaluate soil quality in cotton fields and screen nitrogen application measures that synergistically improve soil quality, cotton yield, and nitrogen fertilizer utilization efficiency. Taking the summer live broadcast cotton field in Jiangxi Province as the research object, four treatments, including CK without nitrogen application, CF with conventional nitrogen application, N1 with nitrogen reduction, and N2 with nitrogen reduction and organic fertilizer application, were set up for three consecutive years from 2022 to 2024. A total of 15 physical, chemical, and biological indicators of the 0–20 cm plow layer soil were measured in each treatment. A minimum dataset model was constructed to evaluate and verify the soil quality status of different nitrogen application treatments and to explore the physiological mechanisms of nitrogen application on yield performance and stability from the perspectives of cotton source–sink relationship, nitrogen use efficiency, and soil quality. The minimum dataset for soil quality evaluation in cotton fields consisted of five indicators: soil bulk density, moisture content, total nitrogen, organic carbon, and carbon-to-nitrogen ratio, with a simplification rate of 66.67% for the evaluation indicators. The soil quality index calculated based on the minimum dataset (MDS) was significantly positively correlated with the soil quality index of the total dataset (TDS) (R2 = 0.904, p < 0.05). The model validation parameters RMSE was 0.0733, nRMSE was 13.8561%, and the d value was 0.9529, all indicating that the model simulation effect had reached a good level or above. The order of soil quality index based on MDS and TDS for CK, CF, N1, and N2 treatments was CK < N1 < CF < N2. The soil quality index of N2 treatment under MDS significantly increased by 16.70% and 26.16% compared to CF and N1 treatments, respectively. Compared with CF treatment, N2 treatment significantly increased nitrogen fertilizer partial productivity by 27.97%, 31.06%, and 21.77%, respectively, over a three-year period while maintaining the same biomass, yield level, yield stability, and yield sustainability. Meanwhile, N1 treatment had the risk of significantly reducing both boll density and seed cotton yield. Compared with N1 treatment, N2 treatment could significantly increase the biomass of reproductive organs during the flower and boll stage by 23.62~24.75% and the boll opening stage by 12.39~15.44%, respectively, laying a material foundation for the improvement in yield and yield stability. Under CF treatment, the cotton field soil showed a high degree of soil physical property barriers, while the N2 treatment reduced soil barriers in indicators such as bulk density, soil organic carbon content, and soil carbon-to-nitrogen ratio by 0.04, 0.04, 0.08, and 0.02, respectively, compared to CF treatment. In summary, the minimum dataset (MDS) retained only 33.3% of the original indicators while maintaining high accuracy, demonstrating the model’s efficiency. After reducing nitrogen by 20%, applying 10% total nitrogen organic fertilizer could substantially improve cotton biomass, cotton yield performance, yield stability, and nitrogen partial productivity while maintaining soil quality levels. This study also assessed yield stability and sustainability, not just productivity alone. The comprehensive nitrogen fertilizer management (reducing N + organic fertilizer) under the experimental conditions has high practical applicability in the intensive agricultural system in southern China.

1. Introduction

Cotton, an important economic crop in China, and its continuous high and stable yield, as well as the stability or improvement in overall soil fertility and quality in cotton fields, are closely related to the fertilization measures in field cultivation [1]. Currently, there are problems of excessive use of chemical nitrogen fertilizer and insufficient input of organic fertilizer in major cotton-growing areas in China [2]. This will inevitably lead to the deterioration of the soil environment, causing consequences such as soil acidification, imbalance of nutrient structure, and decline in comprehensive fertility [3]. Soil acidification will further decouple bacteria and eukaryotes in the soil, weaken the synergy of multiple microbial functions, and thus disrupt the stability of the ecosystem, resulting in unsatisfactory crop yield and stability and intensified water pollution, which will affect economic and ecological benefits [4]. The adoption of reasonable nitrogen application measures has become a key factor in improving crop production efficiency and enhancing soil comprehensive fertility [5,6]. The application of organic fertilizers can improve the structure of soil microbial communities and promote the absorption of soil nutrients by crop roots [7]. The combination of organic fertilizer and chemical fertilizer can also effectively reduce the risk of soil and water pollution [8]. Therefore, exploring comprehensive nitrogen application measures of reducing nitrogen fertilizer and combining organic fertilizer without affecting crop high-yield performance can make a certain contribution to exploring soil quality improvement methods.
Summer direct-seeded cotton, as an efficient and intensive planting mode, has been rapidly promoted in the middle and lower reaches of the Yangtze River in China [9]. Research on nitrogen application measures in summer direct-seeded cotton fields has shown that unreasonable nitrogen fertilizer application has caused negative effects such as soil physical structure barriers, nutrient imbalances, and damage to biological functions [10,11]. First, under conventional nitrogen application measures (excessive fertilization and blindly increasing industrial fertilizers), cotton exhibits a characteristic of collective nitrogen absorption lower than the nitrogen supply level of the cotton field, which leads to excessive accumulation of soil nitrate nitrogen, soil acidification, nutrient imbalance, and other phenomena [12]. Second, the growth period of summer direct-seeded cotton is relatively short, and the nutrient demand is more concentrated. The climate conditions of high temperature and heavy rainfall in the Yangtze River Basin have intensified the phenomenon of soil nutrient leaching, and its nitrogen use efficiency has been consistently lower than that of the cotton-growing areas in Xinjiang and foreign countries [13]. The stability of the cotton planting soil environment is also constrained by many negative factors [14]. Scientific evaluation of soil and cotton field quality can help agricultural producers understand the impact of different fertilization measures on soil environment and cotton growth, providing assistance for optimizing agricultural management strategies and improving crop yield stability [15].
In recent years, the soil quality index has been widely used to evaluate soil health and overall quality status. Through quantitative analysis and evaluation of soil nutrient supply capacity, it is an important comprehensive indicator that can provide a basis and reference for fields such as agricultural yield increase and environmental protection [16,17]. The method of obtaining a soil quality index often involves establishing a minimum dataset (MDS) for comprehensive analysis [18]. In recent years, studies on soil quality in forests in southern China, farmland in northwest India, and the Jogakul Lake Basin in Iran have all pointed out that soil quality evaluation indicators are redundant, and the evaluation process is complex and time-consuming. However, there is a clear positive correlation between soil quality indices based on the minimum dataset and those based on the total dataset (TDS), and they have significant advantages in improving work efficiency, reducing evaluation costs, and enhancing operational feasibility [19,20,21]. The construction of a minimum dataset for evaluating soil quality has achieved good expected results in soil quality evaluation studies for different fertilization measures [22]. However, some studies suggest that the minimum dataset constructed for different regions and crops has significant differences in the soil quality evaluation process. Therefore, when evaluating the overall soil quality under different fertilization measures, it is necessary to select a suitable minimum dataset from the entire dataset composed of the main physical, chemical, and biological indicators of soil related to fertilization measures [23,24]. At present, most of the reports on soil quality after fertilization in cotton fields are related to the response of soil physical and chemical properties and nutrient changes to nitrogen application [25,26], and there is a lack of reports on simplifying the evaluation system of cotton field soil quality and using the minimum dataset to evaluate the soil quality status of cotton fields. The construction of the minimum dataset for summer direct-seeded cotton field soil in the Yangtze River Basin is still in a blank stage.
The soil quality evaluation system based on a minimum dataset can quantify the overall soil quality by combining dimensionality reduction analysis and principal component analysis to screen core indicators, providing a scientific and efficient approach for rapid evaluation of soil health and diagnosis of soil barrier factors. The soil quality index (SQI) can not only serve as a research tool but also as a key indicator for evaluating the effectiveness of local sustainable land management policies [27]. Although organic substitution has been widely used in recent years to optimize nitrogen supply, and research has shown that reducing 20% of nitrogen and adding 10% of organic nitrogen can effectively improve cotton yield performance [28,29], in the summer direct-seeded cotton model, soil-available nitrogen content, organic carbon, carbon-to-nitrogen ratio, and other indicators are particularly sensitive to the application of nitrogen fertilizers (industrial urea and organic fertilizers) [30]. The comprehensive regulatory effects of nitrogen reduction and organic substitution on soil quality and cotton yield in summer direct-seeded cotton fields lack systematic research, and traditional research on organic fertilizer application mostly focuses on the yield-increasing effect of nitrogen fertilizers, ignoring the long-term effects on soil physical properties, nutrient characteristics, organic matter reflecting microbial activity, organic carbon, and other indicators [31]. In response to the above issues, we conducted a field experiment of different nitrogen application measures for three consecutive years, with three main objectives: (1) to construct the minimum dataset for soil quality evaluation in summer live broadcast cotton fields and verify its effectiveness; (2) reveal the mechanism by which nitrogen application measures affect cotton yield and yield stability performance from the perspectives of source–sink relationships, soil quality, and nitrogen use efficiency; and (3) based on the quantified cotton yield and yield stability, nitrogen fertilizer utilization efficiency, and soil quality, balance the effects of different nitrogen application measures. This study emphasized the importance of balancing soil quality, productivity, and nitrogen use efficiency. The research results could first provide a reference for simplifying redundant soil quality evaluation systems and second provide a theoretical basis for precise regulation of nitrogen fertilizer and improvement in soil productivity in summer cotton fields.

2. Materials and Methods

2.1. Site Description

This experiment was a three-year continuous field fixed-point experiment from 2022 to 2024, located at the Chaisang District Base of the Provincial Economic Crop Research Institute in Jiujiang City, Jiangxi Province (115°55′ E, 30°36′ N). The average altitude of the area is 20 m, the average annual precipitation is 1450 mm, and the average annual temperature is 16.0 °C. The soil type of the experimental site is red soil, with a texture of loamy clay. The nutrient content and pH value of the 0–20 cm soil in the cotton field before sowing in 2022 are shown in Table 1.

2.2. Test Crops

The tested variety was Ganzamian 0906, provided by the Jiangxi Provincial Institute of Economic Crops.

2.3. Experimental Design

Adopting a single-factor random block design, a total of 4 treatments, including CK, CF, N1, and N2, were set up, with each treatment repeated 3 times, for a total of 12 blocks. Among them, CK was treated without nitrogen application, with a pure nitrogen dosage of 0, serving as the control group for this experiment. CF was a conventional nitrogen application treatment in the local area, with a pure nitrogen dosage of 345 kg ha−1. N1 was a 20% nitrogen reduction treatment, with a pure nitrogen dosage of 276 kg ha−1. N2 was a combination of nitrogen reduction and organic fertilizer application treatment, with a pure nitrogen application rate of 276 kg ha−1, of which the urea application rate was equivalent to 248.4 kg ha−1 of pure nitrogen, and the organic fertilizer application rate was equivalent to 27.6 kg ha−1 of pure nitrogen. To minimize lateral water movement and avoid the mutual influence of nutrients and fertilizers in the soil between different treatments, 12 open-air cement ponds (8 m in length, 4 m in width, and 1 m in depth) arranged continuously from east to west without water and fertilizer infiltration were constructed and uniformly filled with soil of the same volume and fertility (obtained from surrounding cotton fields that have been continuously planted for many years). One cement pond served as a small spot. Each spot was 8 m long and 4 m wide and covered an area of 32 square meters. Direct-seeded cotton would be conducted on 7 May 2022, 10 May 2023, and 8 May 2024. Four rows would be planted in each spot with a row spacing of 1.0 m and a plant spacing of 0.38 m. The planting density and actual harvest density would be controlled at 30,000 plants per hectare. The application rates of phosphorus and potassium fertilizers for each treatment were consistent, at 144 and 315 kg ha−1, respectively. The nitrogen fertilizer applied included two types, namely, urea (pure nitrogen content 46.4%) and organic fertilizer (rapeseed straw cake fertilizer, pure nitrogen content 5.25%). Phosphate fertilizer was superphosphate (active ingredient P2O5, content 12%). Potassium fertilizer was potassium chloride (active ingredient K2O, content 60%). Fertilizers were produced and provided by Hubei Xinghengye Technology Co., Ltd. (Wuhan, China). Each treatment applied nitrogen and potassium fertilizers as basal fertilizer during the bud stage and topdressing during the initial flowering stage, with a basal topdressing ratio of 4:6. Among them, the N2 treatment applied all organic fertilizers in the basal nitrogen fertilizer step. Phosphorus fertilizer should be applied in one go during the bud stage. The fertilization method was to spread the fertilizer on the soil surface five centimeters away from the cotton root system and then cover it with soil and bury it after the fertilizer was applied into the ditch. Other management measures were the same as local routine field operations. The specific fertilization amounts for each treatment are shown in Table 2.

2.4. Measurement Indicators and Methods

2.4.1. Biomass

Three cotton samples were collected from each spot during the flower and boll stage (25 August 2022, 20 August 2023, and 20 August 2024) and the boll opening stage (15 October 2022, 10 October 2023, and 10 October 2024), with continuous arrangement, uniform growth, and no disease. The dry matter mass was determined by dividing the nutrient organs and reproductive organs into different parts, and the population nutrient organ biomass and reproductive organ biomass were calculated based on the actual population density.

2.4.2. Yield and Yield Composition Factors

On 10 October 2022, 10 October 2023, and 20 October 2024, the actual yield of seed cotton was collected in each treated spot. Ten intact and disease-free cotton plants arranged consecutively at each spot were collected as samples and brought back to the laboratory. After being dried in an 80 °C oven, the quantity and weight of boll per plant were measured, and the boll density was calculated based on the quantity of cotton per plant [32]. The sample seed cotton was rolled into lint by a cotton gin and weighed. The percentage of dry weight lint cotton based on the sample seed cotton and lint cotton was calculated [33].
Lint percentage (%) = (Lint yield/Seed cotton yield) × 100%.
Boll density (m2) = number of bolls per plant × actual harvest density/10000

2.4.3. Soil Indicators

After the cotton was fully harvested on 10 November 2022, 10 November 2023, and 15 November 2024, a five-point sampling method was used to obtain CK, CF, N1, and N2 samples from the 0–20 cm soil layer in each spot using a 1 m soil drill, and they were air-dried indoors. This study used the following 15 soil indicators (mainly conventional nutrient indicators and indicators related to nitrogen and organic matter) as key factors to construct a complete soil dataset: soil bulk density (SBD), porosity (represented by TP1), moisture content (SMC), pH value (pH), total nitrogen (TN), total phosphorus (represented by TP2), total potassium (TK), available phosphorus (AP), available potassium (AK), ammonium nitrogen (NH4-N), nitrate nitrogen (NO3-N), alkali hydrolyzed nitrogen (AN), organic matter (OM), organic carbon (SOC), and calculated the soil carbon-to-nitrogen ratio (C/N). The specific measurement methods for each indicator were as follows: bulk density and porosity were determined by the ring knife method, moisture content was determined by the aluminum box drying and weighing method, organic matter and organic carbon were determined by the potassium dichromate volumetric method, total nitrogen was determined by the Kjeldahl nitrogen method, total phosphorus, and available phosphorus were determined by the molybdenum antimony colorimetric method (0.50 mol L−1 sodium bicarbonate solution extraction), total potassium and available potassium were determined by the flame photometry method, ammonium nitrogen was determined by the indophenol blue colorimetric method, nitrate nitrogen was determined by the potassium chloride solution extraction spectrophotometric method, and pH value was measured by a pH meter (water to soil ratio of 2.5:1). Soil carbon-to-nitrogen ratio C/N = organic carbon content/total nitrogen content [34,35].

2.5. Calculations

2.5.1. Yield Stability Index and Sustainability Index

Based on the actual seed cotton production from 2022 to 2024, the cotton yield stability index and yield sustainability index were calculated using the following formula:
S I = S D Y
SYI = ( Y S D ) Y m a x
where SI was the yield stability index, SYI was the yield sustainability index, SD was the standard deviation of yield between different replicates of each treatment, Y was the average yield of each treatment, and Ymax was the maximum yield of each treatment. The higher the SI value, the worse the yield stability, while the higher the SYI value, the stronger the yield sustainability [36,37].

2.5.2. Minimum Soil Dataset

Under the conditions of this experiment, PCA analysis was first used to analyze the indicator features of the total soil dataset. Second, principal components with feature values ≥ 1 were extracted, and finally, indicators with absolute load values ≥ 0.5 were grouped onto the same principal component. After grouping, the Norm values of each indicator were calculated, the indicators within the range of 90% to 100% of the maximum Norm value of this group were selected, and the correlation coefficients between each indicator were calculated. According to previous research results [38], the critical value of the correlation coefficient for each indicator in this study was set to 0.5. If the absolute value of the correlation coefficient for two indicators was less than 0.5, they will both enter the minimum dataset. In contrast, the indicator with the highest Norm value was entered into the smallest dataset. After the KMO test, Bartlett sphericity test, and Pearson correlation analysis, the indicators that met the conditions were finally selected to construct the minimum dataset for soil quality evaluation.

2.5.3. Soil Quality Evaluation Function

The soil quality index was obtained by weighting and summing the membership values and weight values of various soil evaluation indicators. The calculation formula was as follows:
S Q I = i = 1 n K i × C i
where SQI is the soil quality index, Ki is the membership degree of the i-th evaluation indicator, Ci is the weight of the i-th evaluation indicator, and n is the number of evaluation indicators [39].
To obtain the membership values of each indicator, the data was first standardized, and the membership values were calculated based on the membership function models of each indicator. The bulk density was calculated using an inverse S-shaped function, pH, and the soil moisture content adopted a parabolic function, while other indicators adopted an S-shaped function [40]. The maximum and minimum values of the evaluation indicators were taken as the turning points of the S-type and inverse S-type membership functions, and the turning point of the parabolic function indicator was determined by the previous research literature [41].
To obtain the weight values of each indicator, principal component analysis was performed on the indicators that made up MDS and TDS, respectively. The weight of each indicator was determined by calculating the proportion of the common factor variance of each indicator in the overall variance [42].

2.5.4. Data Analysis

Linear simulation was conducted on soil quality indices obtained based on MDS and TDS, and validation parameters were calculated according to the simulation equation parameters, including RMSE [43], nRMSE [44], synergy index d [45], and determination coefficient R2 [46]. The relevant calculation formulas were as follows:
(1)
Root mean square error (RMSE) and standardized root mean square error (nRMSE)
R M S E = i = 1 n P i O i 2 n 0.5
n R M S E = i = 1 n P i O i 2 n 0.5 × 100 O ¯
where RMSE was the root mean square error, nRMSE was the standardized root mean square error, and Pi was the soil quality index under TDS for each treatment year; Oi was the soil quality index under MDS for each treatment year, O ¯ was the average soil quality index under MDS, and n was the number of samples. The smaller the RMSE value, the higher the consistency between the soil quality index of MDS and TDS; NRMSE < 10% indicates excellent simulation performance; 10% < nRMSE < 20% indicates good performance; 20% < nRMSE < 30% indicates average performance; and NRMSE > 30% indicates poor performance.
(2)
Collaboration index d and determination coefficient R2
d = 1 i = 1 n P i O i 2 i = 1 n P i O ¯ + O i O ¯ 2
R 2 = i = 1 n P i P ¯ × O i O ¯ 2 i = 1 n P i P ¯ 2 × i = 1 n O i O ¯ 2
where d is the synergy index and R2 is the coefficient of determination; the closer the value of d is to 1, the better the effect, and the closer the value of R2 is to 1, the higher the credibility.

2.5.5. Nitrogen Use Efficiency

Based on the three-year average cotton biomass, seed cotton yield, lint percentage, nitrogen uptake, and other parameters, the nitrogen fertilizer utilization efficiency was calculated as follows:
Nitrogen agronomic efficiency NUEa = (YnY0)/Fn
Nitrogen partial factor productivity NPFP = Yn/Fn
where Yn was the yield of seed cotton in the nitrogen application zone, Y0 was the seed cotton yield of unfertilized plots, and Fn was the nitrogen application rate [47].

2.5.6. Soil Barrier Degree

An obstacle diagnosis model was established, the obstacle degrees for each treatment were calculated, and a heat map was drawn. The calculation formula was as follows:
M i j = P i j   W j j = 1 m P i j   W j
Pij = 1 − Sij
M j = M i j n
where Mij was the obstacle level of the jth indicator in each processing cell; Pij was the difference between each indicator and its maximum value, which was the absolute value of the difference between the standardized value of the indicator after the membership function and the number 1; Wj was the contribution of each indicator to the entire dataset, i.e., the weight of each indicator; Sij was the membership function value of the j-th indicator for each processing i-th cell [48].

2.6. Statistics and Analysis

Excel 2010 was used for data statistics and linear equation simulation. Origin 2021 was used for data analysis and image drawing of the soil barrier thermal map, correlation thermal map, and box plot. Python 3.7 was used for random forest analysis and feature importance map drawing. SPSS 19.0 was used for variance and principal component analysis, and the LSD method was used for significant difference analysis (p < 0.05).

3. Results

3.1. Establishment of Minimum Soil Dataset

First, the KMO test and Bartlett sphericity test were performed on the constructed TDS, and the results showed that the KMO value was 0.668, with p < 0.001 in the Bartlett sphericity test, indicating that the entire dataset meets the conditions of principal component analysis. Second, principal component analysis was conducted on TDS, and the analysis results showed that there were 4 principal components with eigenvalues greater than 1. The initial eigenvalues of principal components 1, 2, 3, and 4 are 5.95, 1.98, 1.78, and 1.05, respectively, and their percentages of variance are 39.63%, 13.22%, 11.88%, and 7.02%, respectively. The cumulative contribution rate is 71.754%, indicating that the four selected principal components meet the basic requirements of information extraction and the constructed dataset has good representativeness. Finally, based on the correlation between various indicators and Norm values, the minimum dataset MDS was constructed. From the analysis of Table 3 and Figure 1, it could be concluded that the Norm value of SOC was the highest in principal component PC1. Among the indicators with Norm values above 90%, there was OM, and there were no indicators with a correlation coefficient absolute value less than 0.5. Therefore, SOC was separately included in MDS. The Norm value of SBD was the highest in PC2, with TP being the indicator with a Norm value above 90%. There were no indicators with a correlation coefficient absolute value less than 0.5, so SBD was separately included in MDS. The Norm value of SMC was the highest in PC3, and there were no indicators above 90% of its Norm value range, so SMC entered MDS separately. The Norm value of C/N was the highest in PC4, and TN was the indicator with a Norm value above 90%. The absolute correlation coefficient with TN was less than 0.5, so both C/N and TN entered MDS. Finally, 5 indicators, including SBD, SMC, TN, SOC, and C/N, were selected to construct the minimum soil dataset and participate in the calculation of the soil quality evaluation function.

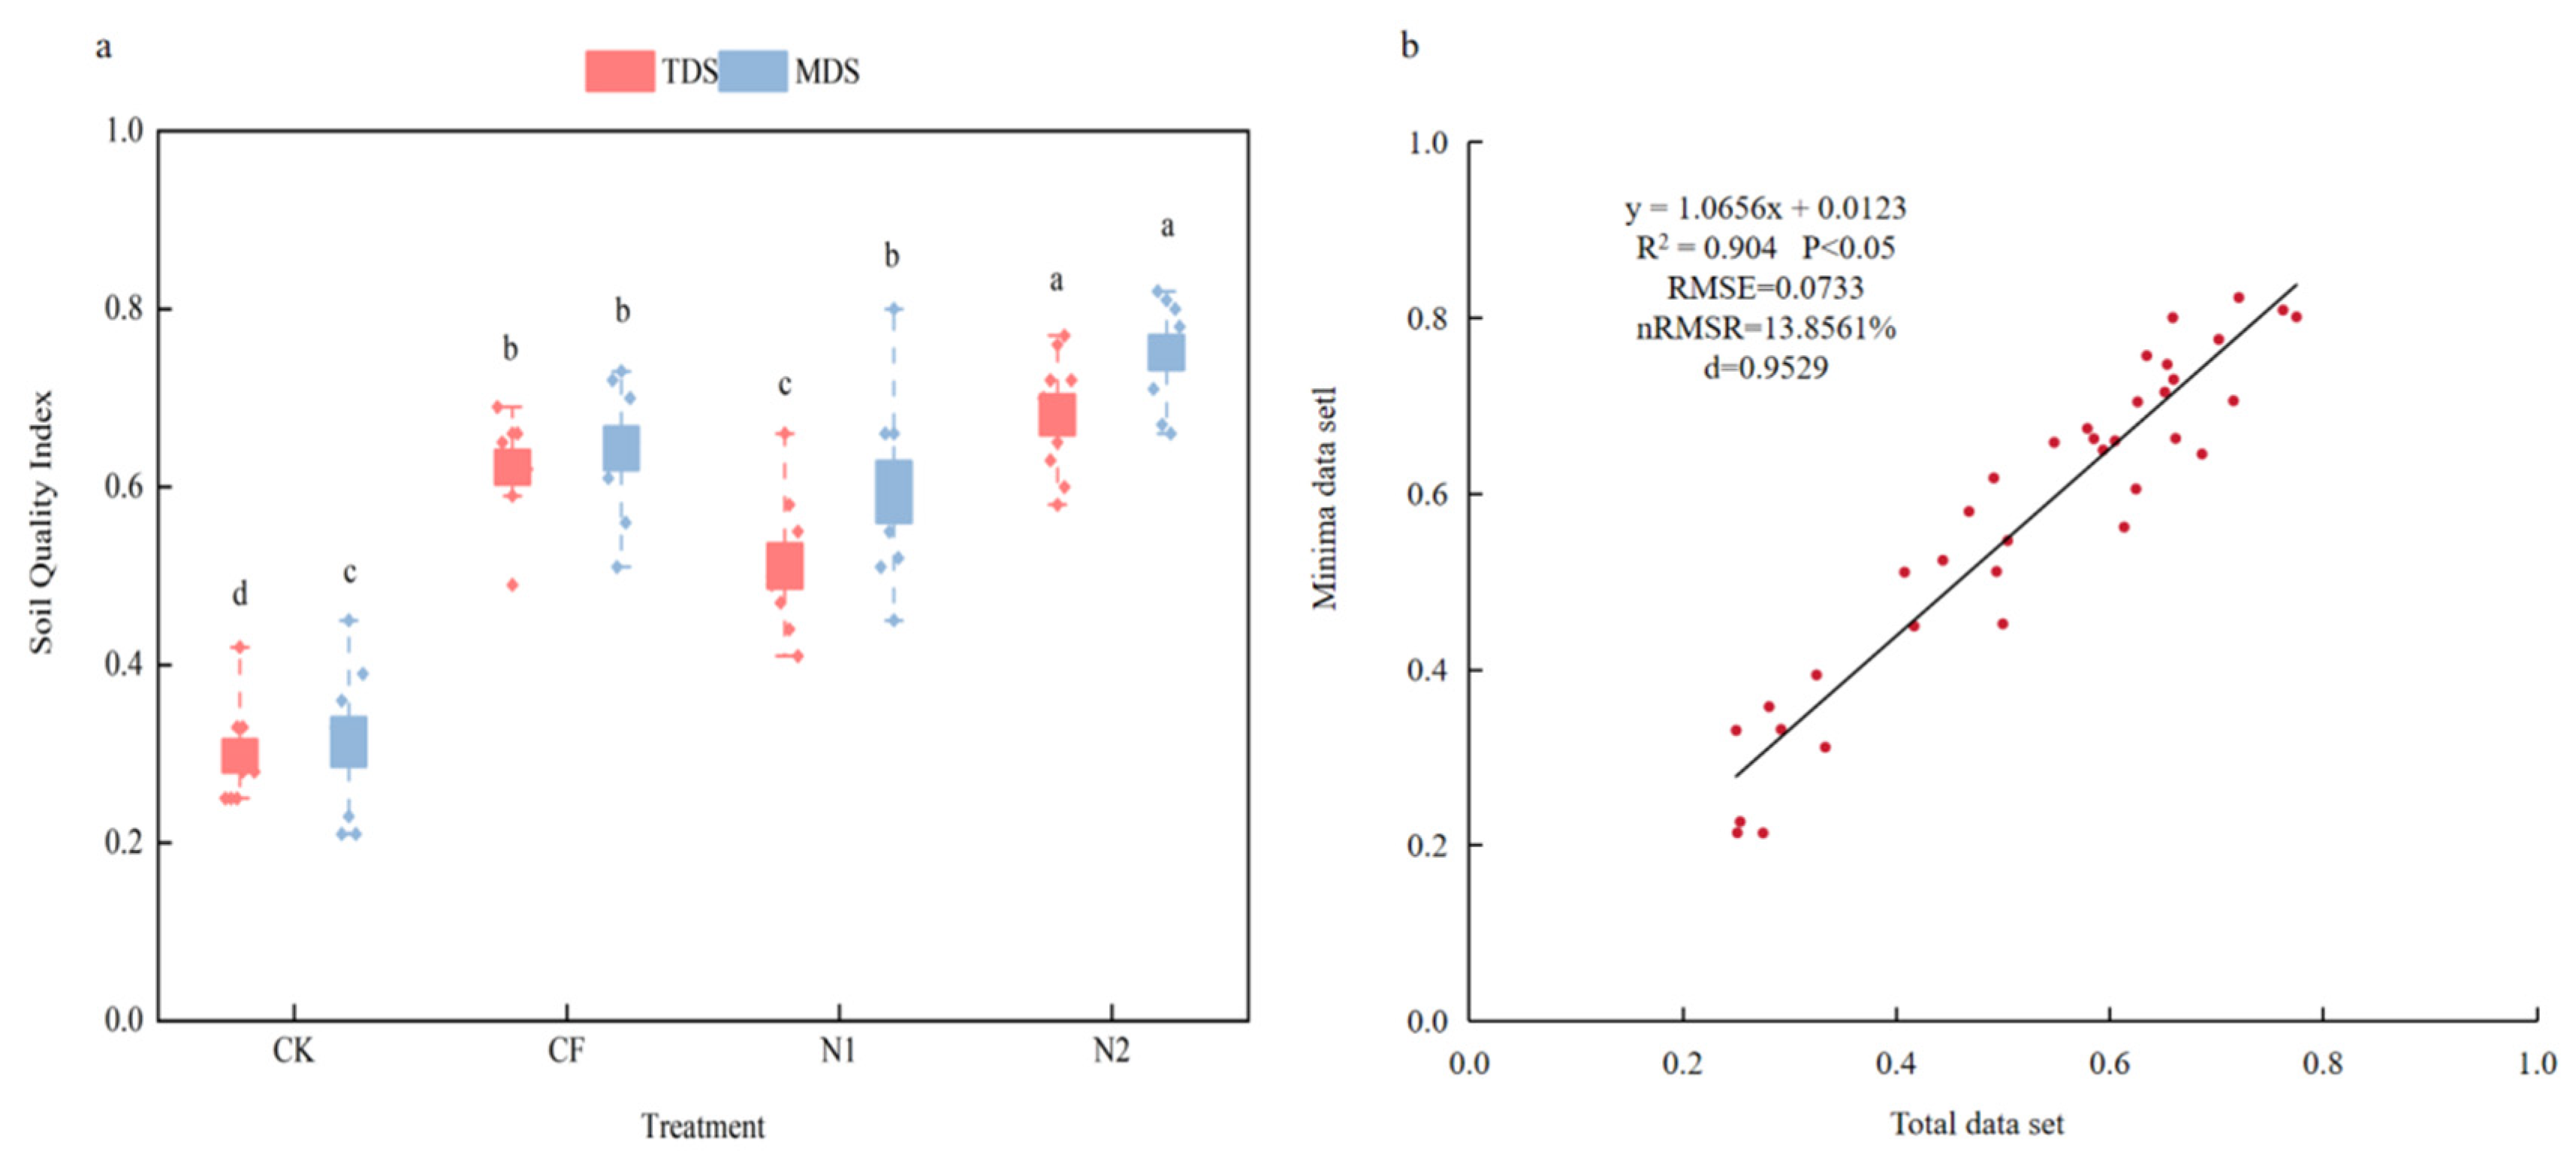
3.2. Soil Quality Evaluation and Effectiveness Verification Based on Minimum Dataset

The results in Table 4 indicated that there was no significant difference in the weights of various indicators in TDS, ranging from 0.05 to 0.09. However, there was a significant difference in the weights of various indicators in the constructed MDS, with SOC having a higher weight of 0.28 and SBD having a lower weight of 0.13. This indicated that under the conditions of this experiment, SOC played an important role in simplifying the soil quality evaluation process, and SOC content could greatly affect the overall soil quality. The results in Figure 2a indicated that compared with the CK treatment, the soil quality index based on TDS in CF, N1, and N2 treatments significantly increased by 109.51%, 72.02%, and 129.58%, respectively. The soil quality index based on MDS significantly increased by 104.42%, 89.09%, and 138.55%, respectively. The soil quality index of N2 treatment increased significantly by 9.58% and 33.46% compared to CF and N1 treatments under TDS, and by 16.70% and 26.16% compared to CF and N1 treatments under MDS. Compared with CF, N1 treatment significantly reduced the soil quality index by 17.90% under TDS. This result indicated that reducing nitrogen by 20% was accompanied by a risk of soil quality decline. Reducing nitrogen by 20% and applying organic fertilizer could effectively improve soil quality. To verify the accuracy of the MDS index system evaluation, a correlation equation based on TDS and MDS calculation of soil quality index was constructed. The results in Figure 2b indicated a significant positive correlation between the two soil quality indices (R2 = 0.904, p < 0.05), indicating that the constructed MDS could effectively replace TDS for soil quality analysis. The RMSE of the correlation equation was 0.0733, the nRMSE was 13.8561%, and the d value was 0.9529, indicating that the evaluation results of MDS and TDS were close and the relative deviation was small, indicating high evaluation accuracy and precision. Specifically, the order of TDS and MDS soil quality index values was N2 > CF > N1 > CK, indicating that the application of organic fertilizer had a better improvement and enhancement effect on the overall soil quality of cotton fields compared to the application of chemical fertilizer nitrogen alone. The screening and filtering rate of the constructed MDS indicators was 66.67%, indicating that the establishment and application of MDS could eliminate some indicator information in the evaluation process on a scientific basis, achieving the effect of simplifying the soil quality evaluation system.

3.3. The Effect of Different Nitrogen Application Measures on Soil Nutrient Content

Table 5 showed that compared with CF and N1 treatments, N2 treatment significantly increased OM, SOC content, and C/N by 10.81%, 13.08%, 12.34%, 13.16%, 17.98%, and 17.40%, respectively. TN and NH4-N content did not show a significant decrease, indicating that the application of organic fertilizer after nitrogen reduction was beneficial for soil organic matter and organic carbon accumulation while improving nutrient retention capacity (C/N ratio increases), which had a promoting effect on the improvement in soil carbon management level. Compared with N1 treatment, CF treatment significantly increased soil NO3-N, NH4-N, AN, and AP content by 17.53%, 20.77%, 10.42%, and 33.47%, respectively, but significantly decreased pH value by 3.27% and did not significantly improve soil structure (SBD and TP changes were not significant), nor did SOC show significant changes. SBD, TP, and SOC are important indicators of MDS, indicating that excessive application of industrial urea could significantly improve soil-available nutrients but failed to effectively improve soil quality and instead exacerbated acidification risk. The content of NO3-N and NH4-N was highest under CF treatment, which might reflect the rapid release of nitrogen in fertilizers in the short term. However, the fertilization effect of organic fertilizers was more in line with the nutrient absorption characteristics of cotton. Overall, N2 treatment had the best comprehensive performance in improving soil nutrients.

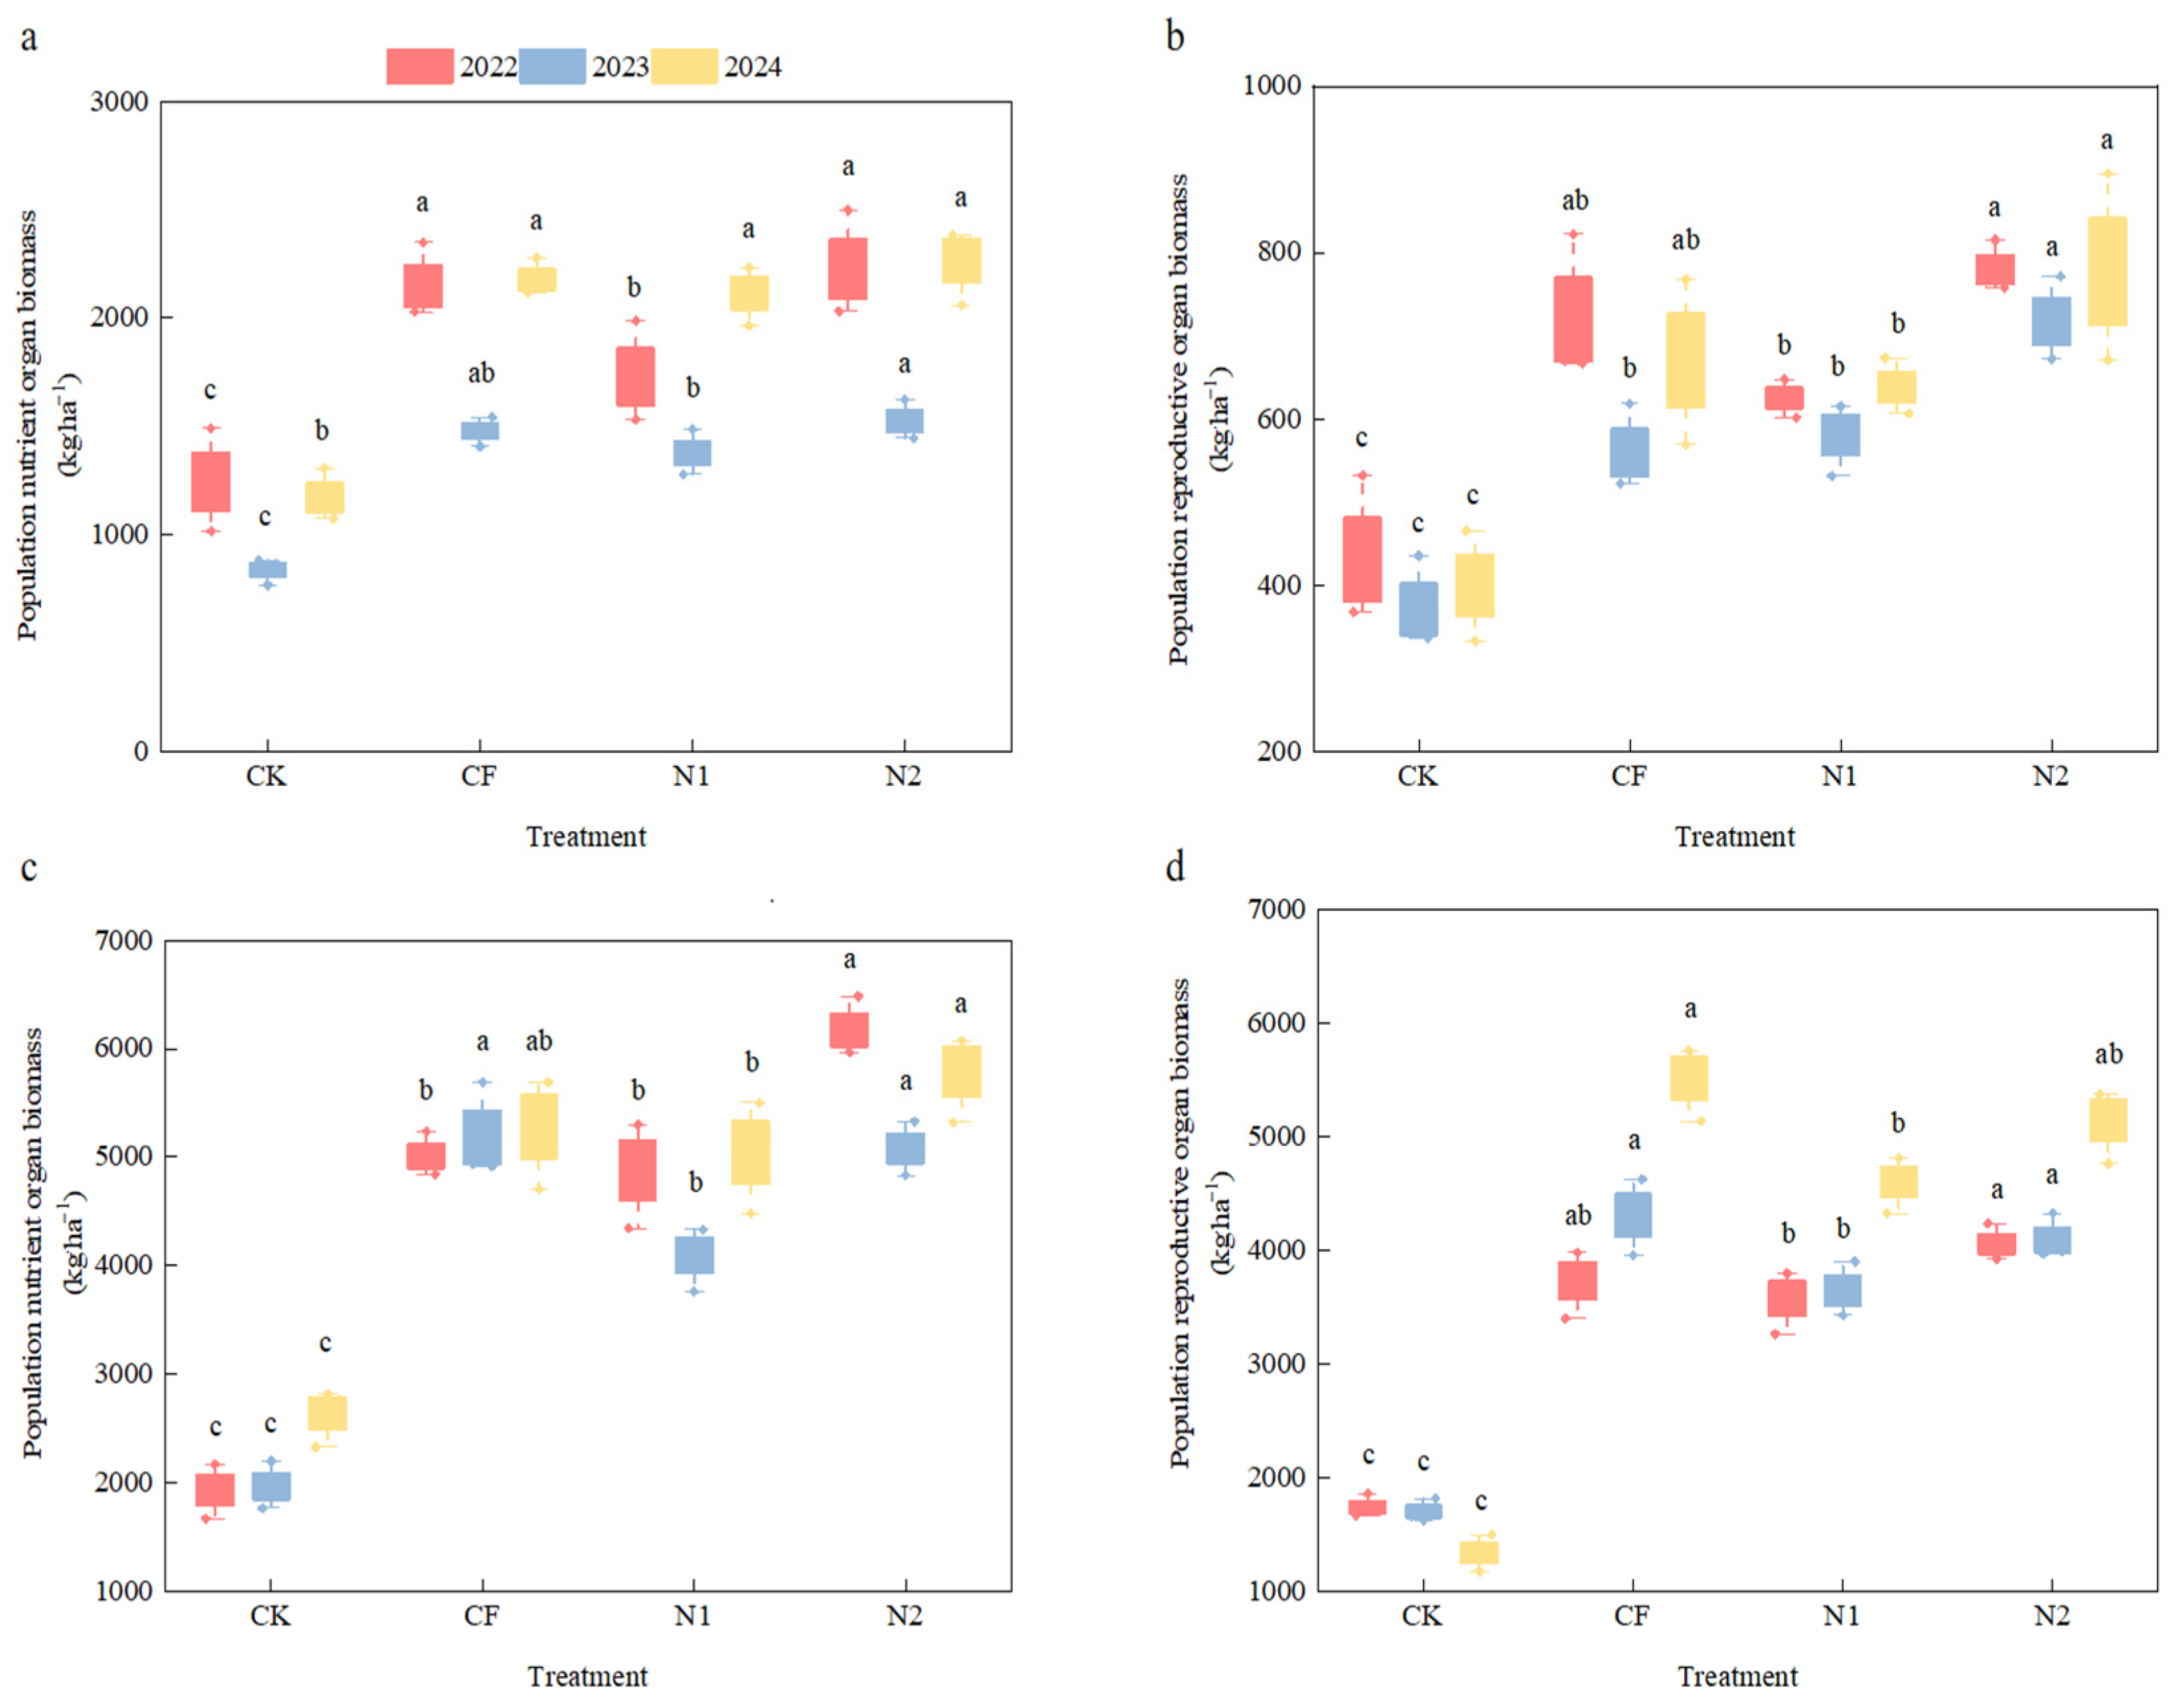
3.4. Effects of Different Nitrogen Application Measures on the Source–Sink Relationship During the Cotton Boll Opening Stage

The results in Figure 3 indicated that compared with CK, nitrogen application could significantly increase the population biomass of cotton during the flower and boll stages and the boll opening stages, laying a good material foundation for yield increase. Compared with CF treatment, there was no significant decrease in the biomass of nutritional and reproductive organs in the N2 treatment population, while N1 treatment significantly reduced the biomass of nutritional and reproductive organs during the boll opening stage in 2023 by 20.92% and 15.44%, respectively, which had an adverse effect on dry matter accumulation. Compared with N1 treatment, N2 treatment significantly increased the biomass of nutrient organs and reproductive organs by 28.66% and 24.75%, respectively, during the flower and boll stage and 20.92% and 15.44%, respectively, during the boll opening stage in 2022. In 2023, the flower and boll stages would significantly increase by 10.61% and 23.62%, respectively, and the boll opening stage would significantly increase by 24.01% and 12.39%, respectively. This result indicated that compared with conventional nitrogen application, reducing nitrogen by 20% hindered the accumulation of cotton biomass. However, the application of organic fertilizer after nitrogen reduction not only ensured the formation of dry matter in reproductive organs but also had a more coordinated source–sink relationship than simple nitrogen reduction, laying a good material foundation for the development process of cotton from boll setting to maturity.

3.5. Effects of Different Nitrogen Application Measures on Cotton Yield and Yield Stability

Table 6 showed that compared with CK treatment, CF, N1, and N2 treatments significantly increased seed cotton yield in 2022, 2023, and 2024 (p < 0.05), with an increase range of 73.01% to 186.20%. Compared with CF treatment, N2 treatment did not significantly reduce seed cotton yield, single boll weight, boll density, and lint percentage over three years (p < 0.05). However, in 2023, N1 treatment significantly reduced seed cotton yield and boll density by 9.46% and 16.10%, respectively, compared to CF treatment, and seed cotton yield by 13.65% compared to N2 treatment. This result indicated that under long-term nitrogen reduction conditions, compared with conventional nitrogen application, reducing nitrogen by 20% had a significant risk of reducing boll density, which led to a significant decrease in seed cotton yield. However, under the condition of reducing nitrogen by 20%, the application of 10% total nitrogen organic fertilizer could achieve stable production on the basis of reducing nitrogen fertilizer application. The results in Figure 4 showed that there was no significant difference in yield stability index and sustainability index between CK treatment and CF and N1 treatment, but SI and SYI increased significantly by 150.00% and decreased significantly by 7.37%, respectively, compared to N2 treatment. The yield stability index and yield sustainability index of the N2 treatment did not show significant differences compared with the CF and N1 treatments, indicating that compared with no nitrogen application, the application of organic fertilizer under nitrogen reduction of 20% significantly improved yield and yield stability while maintaining the high yield and stable production level of cotton before nitrogen reduction, contributing to weight loss and efficiency improvement in cotton field production.

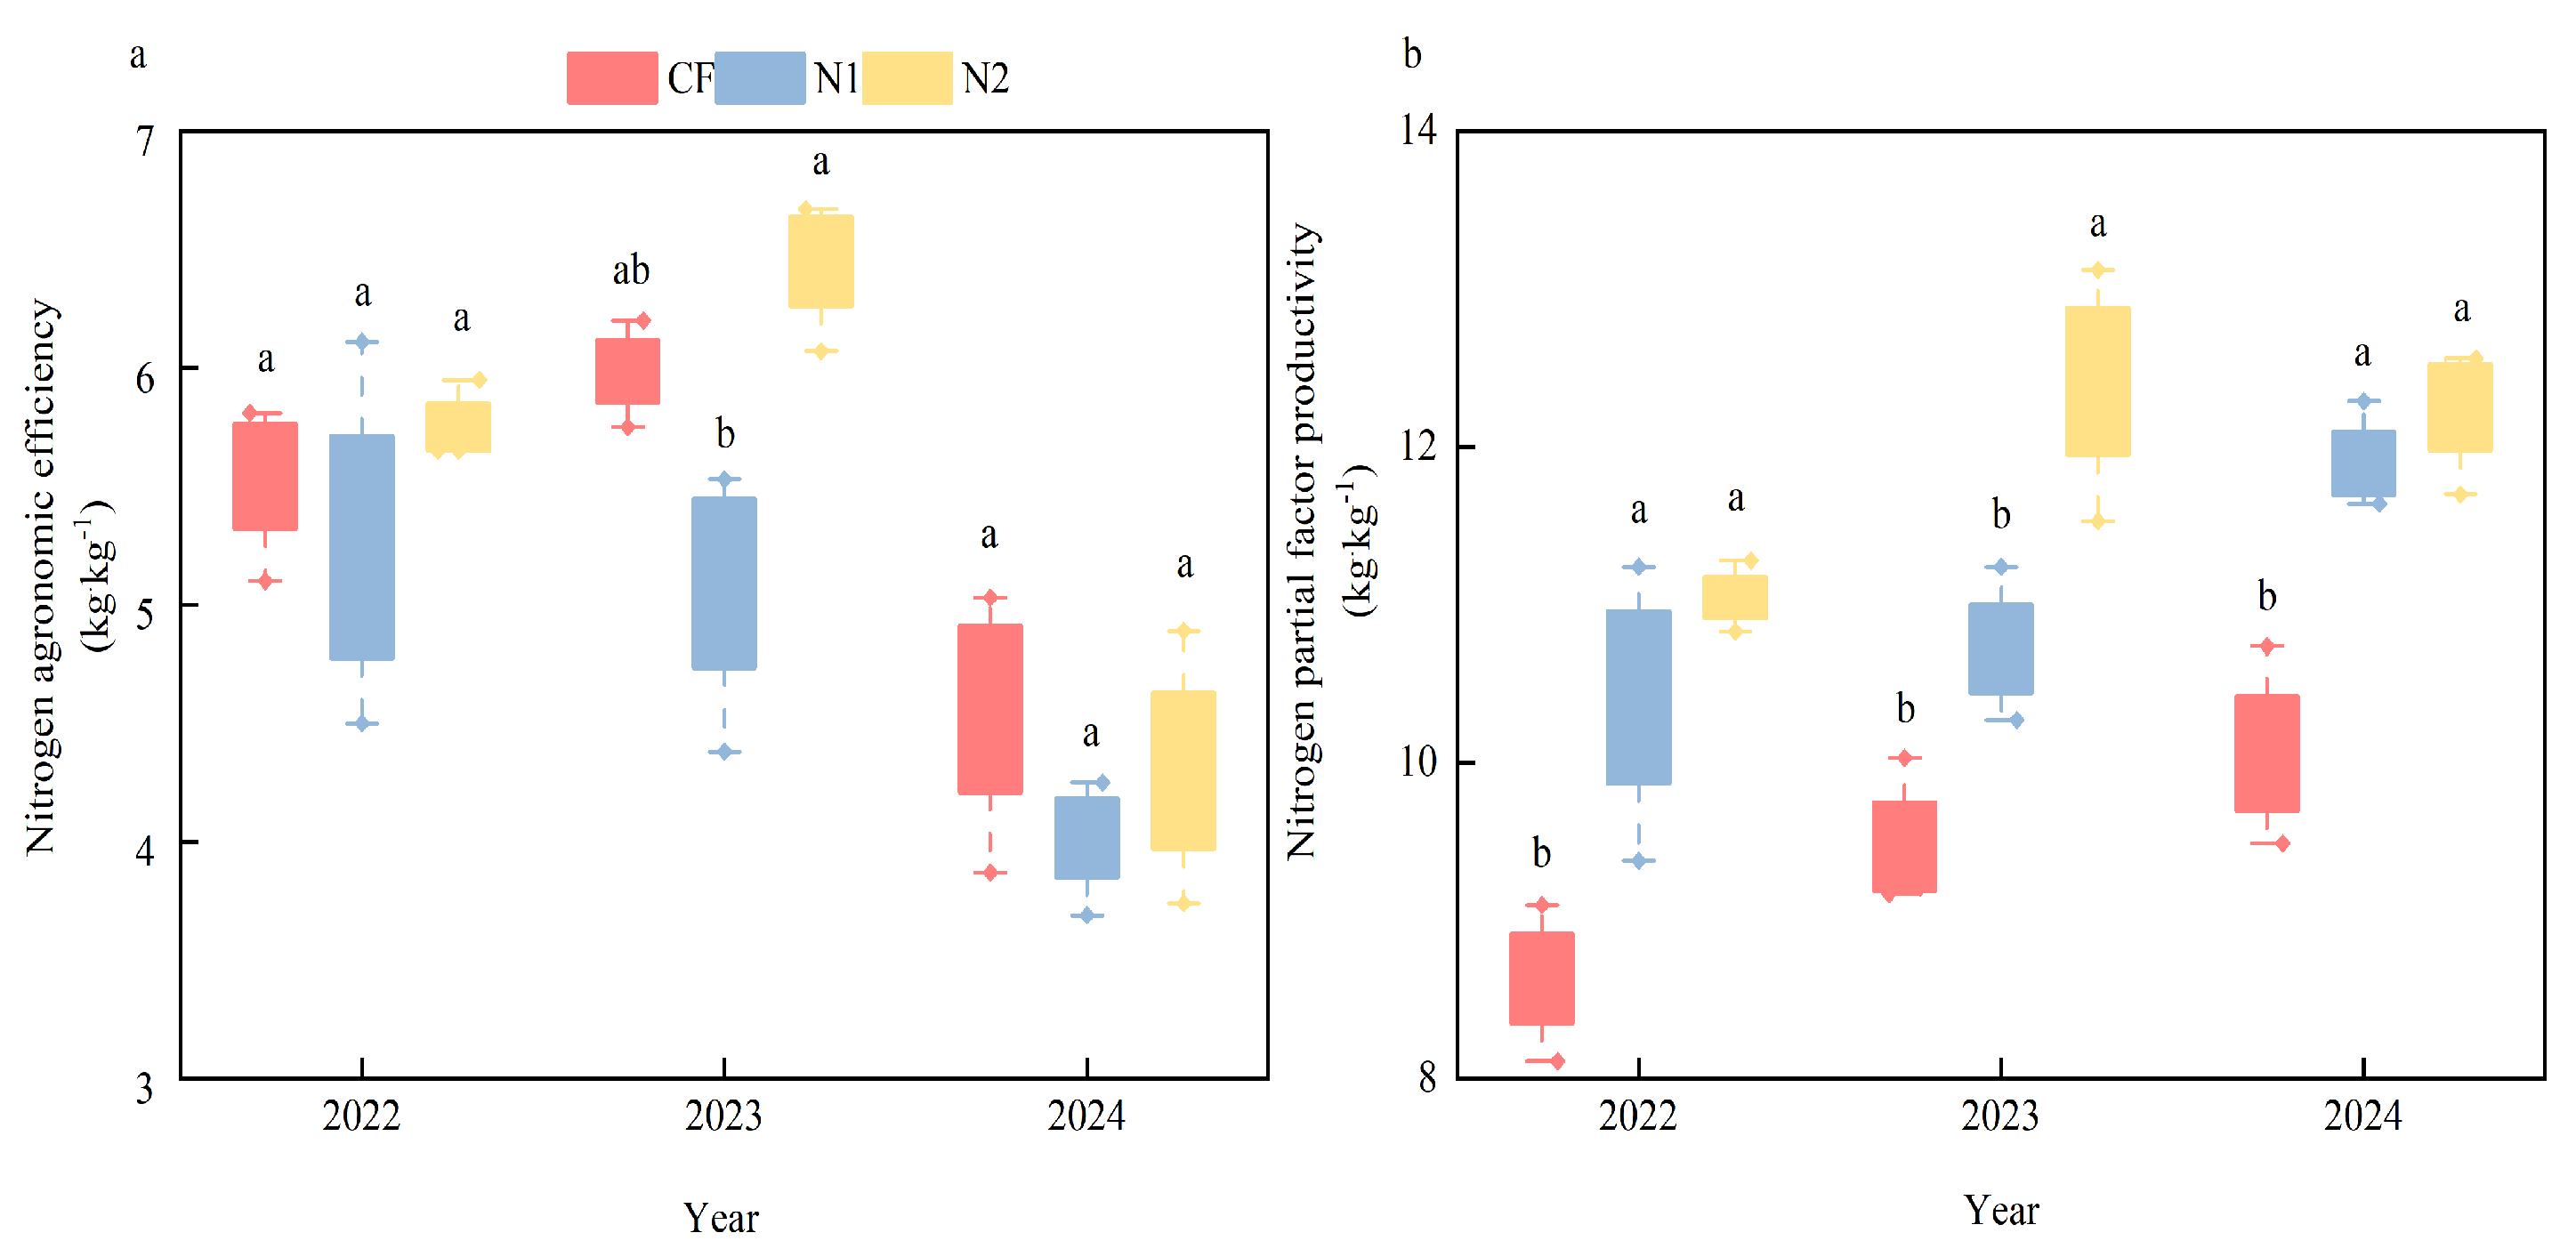
3.6. The Effect of Different Nitrogen Application Measures on Nitrogen Fertilizer Utilization Efficiency

The results in Figure 5 indicated that there was no significant difference in NUEa and NPFP between CF and N2 treatments over three years (p < 0.05), and there was no significant difference in NUEa between CF and N1 treatments (p < 0.05). However, N2 treatment showed a significant increase of 26.72% and 15.76% in NUEa and NPFP compared to N1 treatment in 2023 and a significant increase of 28.04%, 31.05%, and 21.77% in NPFP compared to CF treatment over three years. This result indicated that compared with conventional nitrogen application, reducing nitrogen by 20% did not reduce NUEa, but when combined with organic fertilizer after reducing nitrogen by 20%, it could significantly and stably increase NPFP. By reducing nitrogen by 20%, the application of organic fertilizer could also have a certain improvement effect while maintaining stable levels of NUEa and NPFP.

3.7. Correlation Analysis of Soil Quality Index, Seed Cotton Yield, and Nitrogen Fertilizer Utilization Efficiency

Figure 6 presented the mathematical relationships between soil quality index based on TDS and MDS and seed cotton yield, nitrogen fertilizer agronomic utilization efficiency (NUEa), and nitrogen partial factor productivity (NPFP), respectively. The aim was to verify the evaluation effect and applicability of the soil quality index based on TDS or MDS on cotton yield performance. The results showed that the R2 values of the linear fitting equations between TDS- and MDS-based SQI and seed cotton yield were 0.5831 and 0.6324, respectively, indicating a significant positive correlation between SQI and seed cotton yield. Seed cotton yield was largely influenced by SQI. The linear fitting equations R2 of SQI and NUEa based on TDS and MDS were 0.2643 and 0.4152, respectively, and the linear fitting equations R2 of NPFP were 0.0017 and 0.0386, respectively. This indicated that the positive correlation between SQI and NUEa and NPFP was relatively weak, and there were significant differences in the degree of influence of SQI on seed cotton yield and nitrogen fertilizer utilization efficiency. This suggested that the relationship between cotton field soil quality and cotton population was influenced by many factors. However, this study analyzed the fitting curves of three years of data and found that using SQI values to judge yield performance could demonstrate good practical results. The R2 values of the yield of seed cotton and the quadratic fitting equations based on TDS and MDS SQI were 0.712 and 0.6036, respectively, and the quadratic coefficients were −10,663 and −3930.7, respectively. This first indicated that both MDS- and TDS-based SQI could provide effective references for cotton yield performance. Second, it indicated that with the increase in SQI, the yield would show a trend of first increasing and then decreasing. This might be due to the negative effects of excessive supply of nitrogen, phosphorus, and potassium nutrients during cotton development, such as late ripening due to excessive nitrogen, phosphorus, and potassium supply; excessive soil organic matter; and high carbon-to-nitrogen ratio, which inhibit root development or plant nutrient absorption, thus hindering yield performance. On the basis of simplifying the evaluation process, this result also provided a new perspective and basis for measures such as reducing nitrogen and increasing efficiency in cotton fields and targeted improvement in soil quality.

3.8. Importance of Random Forest Model in Predicting Soil Quality Indicators and Analysis of Soil Barrier Degree

Random forest regression analysis was conducted on various soil indicators in this experiment with yield as the target variable. The number of trees in the random forest was set to 100, and the optimal parameters obtained through grid search optimization were max_depth (the maximum depth of the tree), which was set to None, which did not limit the maximum depth of the tree, and Min_Samples_split (the minimum number of samples required to split internal nodes), which was set to 2. The results in Figure 7a showed that the random forest fitting effect was good (R2 was 0.8923), and the model explained 89.23% of the yield variation in the test set data, with significant differences in the importance values of different indicators. The importance of SOC, OM, and TN was relatively high, with values of 0.320, 0.282, and 0.217, respectively, indicating that SOC, OM, and TN played a critical role in model prediction and were key soil indicators affecting crop yield. The importance values of soil physical characteristic indicators such as SBD, TP1, and pH were relatively low, and their impact on model prediction was relatively small. The MDS constructed under the conditions of this experiment contained a total of 5 indicators, including SBD, SMC, TN, SOC, and C/N. Random forest analysis indicated that physical property indicators in soil indicators (such as SBD and SMC) did not have a significant impact on cotton yield, which also confirmed the previous point that although there was a positive correlation between cotton yield formation and soil quality, it was also affected by other interfering factors. These results indicated that new methods could be designed for screening soil MDS based on increasing yield in order to more effectively evaluate the effectiveness of nitrogen application measures and soil quality levels. This was also the research content that needed to be further carried out in this study. Using the diagnostic model of limiting factors, calculate the obstacle index of each indicator in TDS and evaluate the obstacle factors that affect soil quality improvement under different nitrogen application measures. The results in Figure 7b indicated that SBD, TP1, and C/N were the main control factors restricting soil quality improvement under CF treatment, with obstacle values of 0.12, 0.12, and 0.11, respectively. Compared with CF and N1 treatments, N2 treatment increased the barriers to indicators such as NH4-N, NO3-N, AN, and pH but effectively reduced the barriers to SBD, TP1, SOC, and C/N, with SOC barriers as low as 0.02, indicating that the improvement in soil-available nutrients after nitrogen reduction was limited. However, the application of organic fertilizer not only improved the rationality of soil physical structure but also effectively increased the organic matter, organic carbon content, and carbon-to-nitrogen ratio. By affecting the key components of the minimum dataset (SBD, SOC, and C/N), it had a positive effect on improving soil quality in cotton fields. The main obstacle factors faced by conventional nitrogen application were primarily soil physical properties, followed by nutrient constraints.

4. Discussion

4.1. Construction and Validation of the Minimum Dataset for Cotton Fields Under Different Nitrogen Application Measures

Research on the characteristics of soil quality changes in the plow layer after fertilization has shown that using the minimum dataset MDS could replace the full soil dataset TDS to evaluate the quality of plow layer soil under different fertilization treatments, and the probability of selecting bulk density and soil-available nutrient indicators into MDS was higher [49,50]. In this study, soil bulk density, nitrate nitrogen, and available potassium content were selected to enter the minimum dataset MDS, which was similar to the research results of Adeyolanu et al. [51], who constructed the minimum dataset of dryland crop soil after fertilization. The reason might be that the application of organic fertilizer had a significant optimization effect on the soil structure of dryland crops, which effectively affected the retention and loss of available nutrients, thereby having a significant impact on the soil surface environment [52]. Although studies by A. et al. [53] and Samira et al. [54] have shown a strong correlation between soil bulk density, available nutrient content, and soil quality, the indicators included in the minimum soil dataset after fertilization vary in different regions and under different crop conditions. The results of this study were consistent with the minimum soil dataset constructed by Govaerts et al. [55] and Chen et al. [56], with only bulk density being the same indicator. This indicated that different soil types and crop types could lead to different compositions of the minimum dataset, but bulk density might play an important indicative role in the overall soil quality of each study area. This study used principal component analysis and correlation analysis, combined with the assignment of membership functions and weights, to calculate the comprehensive score of soil quality based on TDS and MDS. Linear regression analysis showed a significant positive correlation between the two scores, indicating that through standardized data processing, SQI based on MDS better reflected the main information contained in TDS. Quantifying and modeling soil quality did not lose the main data but instead improved the efficiency of evaluation work, which was consistent with the research results of Chandel et al. [57]. This study first reduced redundant data in the total dataset. There were 15 initial indicators, and after constructing MDS, 5 indicators were finally selected with a simplification rate of 66.67%. On the basis of good accuracy, the efficiency of soil quality evaluation was effectively improved, which was similar to the indicator simplification rate in Namr et al.’s study on the smallest dataset of soil in irrigated areas of Morocco [58]. Second, it could reduce the actual sampling and measurement costs, which was consistent with the research results [59]. Third, constructing various indicators of MDS could provide effective reference for screening soil barrier factors that hinder the improvement in soil quality, crop yield, quality, and other aspects, which was of great significance for the formulation of cultivation measures and ecological protection [60,61]. To enhance the applicability of soil quality evaluation in other cotton-growing areas, this project believed that the focus of future study could be on using the n + x model to select and optimize evaluation indicators, where n was a fundamental indicator that must be measured and x was a characteristic indicator. Selective and targeted measurements should be carried out based on the set research environment conditions, and then the classified indicators should be quantified and uniformly included in the soil quality evaluation system for analysis and demonstration. This will have the effect of expanding the application field of soil quality evaluation methods. In practical conditions, due to limitations such as uncontrolled climate change and soil conditions with different soil fertility, it is recommended to conduct experiments and effectiveness verification at multiple locations for the construction of the minimum dataset in order to enhance the comprehensiveness of the soil quality evaluation system. The soil quality evaluation methodology in this experiment could be adapted to other intensive cropping systems in Southeast Asia and subtropical regions.

4.2. The Impact of Different Nitrogen Application Measures on Soil Quality

This study investigated the effects of nitrogen application measures, such as single application of chemical fertilizers and combined application of organic fertilizers, on key indicators of soil quality in summer cotton fields. The results showed that the selection of nitrogen application measures had a significant impact on soil physicochemical and biological properties. The soil quality index based on MDS and TDS was ranked from high to low as follows: reducing nitrogen by 20% and applying organic fertilizer > conventional nitrogen application > simple nitrogen reduction by 20%. After reducing nitrogen by 20%, applying organic fertilizer could improve soil quality. The reason might be that the application of organic fertilizer promoted soil organic matter accumulation, slowed down the nitrogen release rate, reduced nitrate nitrogen leaching loss, and improved nutrient availability and balance. However, organic fertilizers had low density, large volume, and high porosity. When applied to the soil, they could reduce the limitations of physical indicators such as soil bulk density and total porosity in cotton fields, thereby improving the physical structure and overall quality of the soil. This was consistent with the conclusions of Shi et al. [62] and Rout et al. [63]. SOC was a core indicator of soil quality, and the application of organic fertilizer had the most significant effect on increasing SOC content. It could also provide different types of exogenous nitrogen and carbon pools, which was consistent with the research by POLYCHRONAKI et al. [64]. The increase in organic carbon content and the increase in nitrogen and carbon source types could enhance the abundance and quantity of soil microorganisms [65], as well as the metabolic activity of soil microorganisms, which had a positive promoting effect on improving soil quality. This was consistent with the research by Pan et al. [66] on grain crop soil and Yuan et al. [67] on orchard soil. Compared with conventional nitrogen application, reducing nitrogen by 20% and applying organic fertilizer did not significantly reduce the content of total nitrogen, ammonium nitrogen, and nitrate nitrogen in the soil. At the same time, it significantly increased the soil carbon-to-nitrogen ratio. By using the slow-release effect of organic nitrogen sources, it optimized the soil carbon-to-nitrogen balance during cotton development, maintained the stability of the soil environment, and stimulated the potential for nitrogen reduction and soil quality improvement in cotton fields, which meets the requirements of the fertilizer reduction and efficiency improvement policy [68].

4.3. Balancing Nitrogen Application Measures Based on the Synergistic Improvement in Soil Quality, Yield, and Nitrogen Fertilizer Utilization Efficiency

Under the conditions of this study, different nitrogen application measures showed a trade-off and synergy relationship among soil quality, yield, and nitrogen fertilizer utilization efficiency. Conventional high nitrogen fertilizer input improved yield performance but reduced soil quality levels and nitrogen fertilizer utilization efficiency. After reducing nitrogen by 20% and applying organic fertilizer, the soil quality index was the highest, and cotton yield remained at the same level as conventional nitrogen application. The nitrogen partial productivity was significantly increased by 21.77% to 31.05%. This indicated that after reducing nitrogen by 20%, the application of organic fertilizer improved multiple soil quality indicators, which could balance the improvement in soil quality, nitrogen fertilizer utilization efficiency, and yield stability. This was consistent with the research by Koocheki et al. [69] and Wang et al. [70]. The reason for the synergistic improvement in yield and soil quality might be that the application of organic fertilizers reduced the leaching of available nutrients, increased soil organic matter and organic carbon content, and improved soil physical structure, and high-quality soil could enhance crop population growth performance, laying the foundation for sustained high and stable crop yields [71,72]. The reason for the improvement in yield stability might be that the application of organic fertilizer could enhance the diversity of soil microbial communities, increase the number of beneficial microorganisms in the soil, promote nutrient absorption by roots, and enhance plant dry matter synthesis and accumulation ability, thereby improving cotton stress resistance and yield stability performance [73]. Reducing nitrogen by 20% without applying organic fertilizer could reduce fertilization costs, but it would also decrease biomass and boll density, resulting in a risk of yield reduction [74]. Enhancing soil organic carbon and improving soil physical structure to promote microbial activity were key factors in nitrogen fertilizer synergy, while reducing nitrogen loss effectively improved the nitrogen fertilizer utilization efficiency in cotton fields [75,76]. The results of the random forest analysis in this study indicated that SOC, OM, and TN were key indicators affecting crop yield. In subsequent model optimization, in order to achieve the goal of improving yield performance and soil health, high-importance features such as SOC, OM, and TN could be focused on. For low-importance features, new methods could be flexibly designed for further screening so as to evaluate soil quality and nitrogen application effects more targeted, achieving the goals of high and stable crop yield, efficient utilization of nitrogen fertilizer, and synergistic improvement in soil quality, which was consistent with the research by Sun et al. [77]. This study has certain limitations, such as a short three-year cycle and a single cotton variety. In the future, multisite, multi-variety, and long-term experiments will be conducted to improve the universality of the minimum dataset evaluation method.

5. Conclusions

The minimum dataset for summer direct-seeded cotton fields consisted of five indicators: soil bulk density, moisture content, total nitrogen, organic carbon, and carbon-to-nitrogen ratio. The simplification rate of evaluation indicators was 66.67%, which could reduce sampling and analysis costs by two-thirds. The soil quality index based on MDS could replace the total dataset for effective evaluation of soil quality in summer direct-seeded cotton fields and was suitable for rapid diagnosis of soil quality. The combination of reducing 20% mineral nitrogen and 10% organic nitrogen addition was a strategic solution to maintain yield while reducing input. Its soil quality index reached 0.75, significantly increasing by 16.70% and 26.16%, respectively, compared to conventional nitrogen application and reducing nitrogen by 20%. On the basis of maintaining the same level of biomass and yield of cotton population as conventional nitrogen application, it significantly increased nitrogen partial fertilizer productivity by 21.77% to 31.05% and reduced the obstacles of factors such as soil bulk density, porosity, organic carbon, carbon-to-nitrogen ratio, etc. It had made certain contributions to achieving efficient utilization of nitrogen fertilizer, coordinated improvement in soil quality, and a simplified soil quality evaluation system under high and stable yield of summer direct-seeded cotton fields in the Yangtze River Basin. It was suitable for other intensive planting systems in Southeast Asia and subtropical regions.

Author Contributions

Conceptualization, Y.Q. and L.Z.; writing—original draft, Y.Q.; data curation, Y.Q., C.Z., and J.C.; formal analysis, Y.Q., W.F., C.Z., and Y.W.; methodology, Y.Q., W.F., and J.C.; investigation, W.F., C.Z., J.C., and Y.W.; software, L.Z. and Y.W.; funding acquisition, L.Z.; writing—review and editing, T.N.; supervision, T.N.; project administration, T.N. All authors have read and agreed to the published version of the manuscript.

Funding

This study was financially supported by the Key R&D Program of Jiangxi Province (20192BBFL60005); the Jiangxi Agriculture Research System; the Jiangxi Provincial Key Laboratory of Plantation and High Valued Utilization of Specialty Fruit Tree and Tea Open Project; and the Jiangxi Provincial Department of Agriculture and Rural Affairs Agriculture, Animal Husbandry and Fisheries Project.

Data Availability Statement

The data presented in this study are contained within the article.

Conflicts of Interest

The authors declare no conflicts of interest.

References

  1. Sangeeta, B.; Yin, X.; Virginia, S.; Jaehoon, L.; Sindhu, J. Soil aggregate-associated organic carbon and nitrogen response to long-term no-till crop rotation, cover crop, and manure application. Soil Sci. Soc. Am. J. 2021, 85, 2169–2184. [Google Scholar]
  2. Pable, D.; Chatterji, S.; Venugopalan, M.V. Soil quality assessment of two cotton growing agroecological subregions of Vidarbha, Maharashtra. Indian J. Soil Conserv. 2016, 44, 343–349. [Google Scholar]
  3. Zhou, J.; Pan, W.; Tang, S.; Ma, Q.; Mi, W.; Wu, L.; Liu, X. Optimizing nitrogen fertilization rate to achieve high yield and high soil quality in paddy ecosystems with straw incorporation. J. Environ. Manag. 2025, 375, 124158. [Google Scholar] [CrossRef] [PubMed]
  4. Liu, P.; Lin, Y.; Liu, X.; Deng, M.; Zhang, P.; Ren, X.; Chen, X. Manure substitution with appropriate N rate enhanced the soil quality, crop productivity and net ecosystem economic benefit: A sustainable rainfed wheat practice. Field Crops Res. 2023, 304, 109164. [Google Scholar] [CrossRef]
  5. Chen, M.; Yang, H.; Yang, Q.; Li, Y.; Wang, H.; Wang, J.; Fan, Q.; Yang, N.; Wang, K.; Zhang, J.; et al. Different Impacts of Long-Term Tillage and Manure on Yield and N Use Efficiency, Soil Fertility, and Fungal Community in Rainfed Wheat in Loess Plateau. Plants 2024, 13, 3477. [Google Scholar] [CrossRef] [PubMed]
  6. Nafi, E.; Webber, H.; Danso, I.; Naab, J.B.; Frei, M.; Gaiser, T. Interactive effects of conservation tillage, residue management, and nitrogen fertilizer application on soil properties under maize-cotton rotation system on highly weathered soils of West Africa. Soil Tillage Res. 2020, 196, 104473. [Google Scholar] [CrossRef]
  7. Ibrahim, M.; Rashed, R.A. Effect of Syrian Indigenous Arbuscular Mycorrhizal Fungi in Combination with Manure on the Growth of Cotton (Gossypium hirsutum L.). Commun. Soil Sci. Plant Anal. 2017, 48, 2093–2101. [Google Scholar] [CrossRef]
  8. Burton, D.L.; Wilts, H.D.M.; MacLeod, J.A. Dissolved nitrous oxide emissions associated with agricultural drainage water as influenced by manure application. Front. Environ. Sci. 2024, 12, 1479754. [Google Scholar] [CrossRef]
  9. Hafeez, A.; Ali, S.; Ma, X.; Tung, S.A.; Shah, A.N.; Ahmad, S.; Chattha, M.S.; Souliyanonh, B.; Zhang, Z.; Yang, G. Photosynthetic characteristics of boll subtending leaves are substantially influenced by applied K to N ratio under the new planting model for cotton in the Yangtze River Valley. Field Crops Res. 2019, 237, 43–52. [Google Scholar] [CrossRef]
  10. Xie, Z.; Wang, X.; Xie, X.; Yang, D.; Zhou, Z.; Wang, Q.; Liu, A.; Tu, X. Complex Microbial Fertilizer Promotes the Growth of Summer-Sown Short-Season-Cultivated Cotton and Increases Cotton Yield in the Yangtze River Basin by Changing the Soil Microbial Community Structure. Agronomy 2025, 15, 404. [Google Scholar] [CrossRef]
  11. Zhang, Z.; Qiu, S.; Thistlethwaite, R.; Yao, X.; Tan, D.; Wang, D.; Yang, G. Optimizing nitrogen application methods and frequency to increase cotton yield in summer direct sown condition. Ind. Crops Prod. 2024, 213, 118468. [Google Scholar] [CrossRef]
  12. Shah, A.N.; Javed, T.; Singhal, R.K.; Shabbir, R.; Wang, D.; Hussain, S.; Anuragi, H.; Jinger, D.; Pandey, H.; Abdelsalam, N.R.; et al. Nitrogen use efficiency in cotton: Challenges and opportunities against environmental constraints. Front. Plant Sci. 2022, 13, 970339. [Google Scholar] [CrossRef] [PubMed]
  13. Li, L.; Xia, S.; Zhang, R.; Zhang, R.; Chen, P.; Jiang, Y.; Liu, Y.; Li, Z. Effect of interaction of nitrogen and potassium fertilizer on cotton yield and nitrogen use efficiency and assessment of suitable fertilization level in the Yangtze River Basin. Soil Fertil. Sci. China 2022, 01, 44–46. (In Chinese) [Google Scholar]
  14. Pittaway, P.A.; Antille, D.L.; Melland, A.R.; Marchuk, S. Availability of Nitrogen in Soil for Irrigated Cotton Following Application of Urea and 3,4-Dimethylpyrazole Phosphate-Coated Urea in Concentrated Bands. Plants 2023, 12, 1170. [Google Scholar] [CrossRef] [PubMed]
  15. Rajeshkumar, N.K.; Balakrishnan, P.; Naveena, K.; Kumar, K.S.B. Identification of Minimum Data Set for Soil Quality Assessment in Upper Krishna Project Area. Int. J. Agric. Sci. 2016, 8, 3184–3188. [Google Scholar]
  16. Lal, B.; Sharma, A.; Gupta, A.K.; Singh, S.S.; Chaturvedi, S.K.; Jhariya, M.K. Soil fertility evaluation through farmer knowledge and scientific approaches of Bundelkhand region, Central India. Environ. Dev. Sustain. 2024, prepublish. [Google Scholar] [CrossRef]
  17. Emami, N.S.; Chavoshi, E.; Ayoubi, S.; Honarjoo, N.; Zeraatpisheh, M. Comprehensive assessment of soil quality in various land uses: A comparative analysis of soil quality index models. Environ. Earth Sci. 2024, 83, 498. [Google Scholar] [CrossRef]
  18. Ma, L.; Wang, Z.; Jiang, J.; Miao, Y.; Zhao, T.; Guo, L.; Liu, D. Assessment of soil fertility in Artemisia argyi planting areas in Qichun county based on minimum data set. China J. Chin. Mater. Medica 2022, 47, 3738–3748. (In Chinese) [Google Scholar]
  19. Cao, Y.; Zhang, W.; Pan, B.; Dai, L.; Tian, A. Selection of the minimum data set and quantitative soil quality indices for different azalea forest communities in southwestern China. Plant Soil 2024, 511, 463–481. [Google Scholar] [CrossRef]
  20. Duraisamy, V.; Gopal, T.; Sonalika, S.; Benukantha, D.; Abhishek, J.; Prasad, S.R.; Ravindra, N.; Pramod, T.; Karunakaran, K.; Padikkal, C. A minimum data set of soil morphological properties for quantifying soil quality in coastal agroecosystems. CATENA 2020, 198, 105042. [Google Scholar]
  21. Mohaghegh, P.; Naderi, M.; Mohammadi, J. Determination of Minimum Data Set for Assessment of Soil Quality:A Case Study in Choghakhur Lake Basin. J. Water Soil 2017, 30, 1232–1243. [Google Scholar]
  22. Ram, S.S.; Kumar, K.D.; Pradip, D.; Singha, M.B. Identification of Minimum Data Set Under Balanced Fertilization for Sustainable Rice Production and Maintaining Soil Quality in Alluvial Soils of Eastern India. Commun. Soil Sci. Plant Anal. 2017, 48, 2170–2192. [Google Scholar] [CrossRef]
  23. Davtian, N.; Ménot, G.; Bard, E.; Poulenard, J.; Podwojewski, P. Consideration of soil types for the calibration of molecular proxies for soil pH and temperature using global soil datasets and Vietnamese soil profiles. Org. Geochem. 2016, 101, 140–153. [Google Scholar] [CrossRef]
  24. Volchko, Y.; Norrman, J.; Rosèn, L.; Norberg, T. A minimum data set for evaluating the ecological soil functions in remediation projects. J. Soils Sediments 2014, 14, 1850–1860. [Google Scholar] [CrossRef]
  25. Luo, Z.; Hu, Q.; Tang, W.; Wang, X.; Lu, H.; Zhang, Z.; Liu, T.; Kong, X. Effects of N fertilizer rate and planting density on short-season cotton yield, N agronomic efficiency and soil N using 15N tracing technique. Eur. J. Agron. 2022, 138, 126546. [Google Scholar] [CrossRef]
  26. Mng’omba, S.A.; Akinnifesi, F.K.; Kerr, A.; Salipira, K.; Muchugi, A. Growth and yield responses of cotton (Gossypium hirsutum) to inorganic and organic fertilizers in southern Malawi. Agrofor. Syst. 2017, 91, 249–258. [Google Scholar] [CrossRef]
  27. Wang, F.; Li, Q.; Lin, C.; He, C.; Zhong, S.; Li, Y.; Xin, J. Establishing a minimum data set of soil quality assessment for cold-waterlogged paddy field in Fujian Province, China. J. Appl. Ecol. 2015, 26, 1461–1468. [Google Scholar]
  28. Wang, N.; Nan, H.; Feng, K. Effects of reduced chemical fertilizer with organic fertilizer application on soil microbial biomass, enzyme activity and cotton yield. Chin. J. Appl. Ecol. 2020, 31, 173–181. (In Chinese) [Google Scholar]
  29. Zhang, L.; Qin, Y.; Cheng, H.; Li, Y.; Luo, H. Research on Characteristics of Nitrogen and Phosphorus Loss from Surface Runoff of Cotton Field in Northern Jiangxi Province of Poyang Lake Region. J. Agric. Sci. Technol. 2022, 24, 166–175. (In Chinese) [Google Scholar]
  30. Sahabi, H.; Moradi, R.; Ray, R.L.; Saeidnejad, A.H. Mitigating greenhouse gas emissions in a cotton production system using various management practices. J. Environ. Chem. Eng. 2025, 13, 115901. [Google Scholar] [CrossRef]
  31. Chen, C.; Lv, Q.; Tang, Q. Impact of bio-organic fertilizer and reduced chemical fertilizer application on physical and hydraulic properties of cucumber continuous cropping soil. Biomass Convers. Biorefinery 2022, 14, 921–930. [Google Scholar] [CrossRef]
  32. Usman, K.; Khan, N.; Khan, M.U.; Yazdan Saleem, F.; Rashid, A. Impact of tillage and nitrogen on cotton yield and quality in a wheat-cotton system, Pakistan. Arch. Agron. Soil Sci. 2014, 60, 519–530. [Google Scholar] [CrossRef]
  33. Rochester, I.J.; Constable, G.A. Nitrogen-fertiliser application effects on cotton lint percentage, seed size, and seed oil and protein concentrations. Crop Pasture Sci. 2020, 71, 831–836. [Google Scholar] [CrossRef]
  34. Gupta, R.; Joshi, R.K.; Mishra, A.; Kumar, S.; Hansda, P.; Garkoti, S.C. Treeline ecotone drives the soil physical, bio-chemical and stoichiometry properties in alpine ecosystems of the western Himalaya, India. Catena 2024, 239, 107950. [Google Scholar] [CrossRef]
  35. Iseas, M.S.; Sainato, C.M.; Romay, C. Supplemental irrigation in the humid Pampean region: Effects on soil salinity, physical properties, nutrients and organic carbon. Soil Tillage Res. 2025, 248, 106421. [Google Scholar] [CrossRef]
  36. Benes, E.; Fodor, M.; Kovács, S.; Gere, A. Application of Detrended Fluctuation Analysis and Yield Stability Index to Evaluate Near Infrared Spectra of Green and Roasted Coffee Samples. Processes 2020, 8, 913. [Google Scholar] [CrossRef]
  37. Awio, T.; Senthilkumar, K.; Ibrahim, A.; Corbeels, M.; Saito, K. Yield stability of four staple crops of sub-Saharan Africa: Analysis of long-term trials. Nutr. Cycl. Agroecosystems 2025, 130, 329–346. [Google Scholar] [CrossRef]
  38. Huang, F.; Tu, J.; Zhang, F.; Ran, J.; Wang, Y.; Liu, W.; Chen, W.; Wang, X.; Wang, Q. Soil health assessment of urban forests in Nanchang, China: Establishing a minimum data set model. Soil Biol. Biochem. 2025, 206, 109795. [Google Scholar] [CrossRef]
  39. Mandal, U.K.; Warrington, D.N.; Bhardwaj, A.K.; Bar-Tal, A.; Kautsky, L.; Minz, D.; Levy, G.J. Evaluating impact of irrigation water quality on a calcareous clay soil using principal component analysis. Geoderma 2007, 144, 189–197. [Google Scholar] [CrossRef]
  40. Pereira, D.S.W.; Naves, S.M.L.; Cesar, A.J.; Francisco, A.G.S.; Moreira, C.B.; Ângelo, C.M.; Nilton, C. Soil quality assessment using erosion-sensitive indices and fuzzy membership under different cropping systems on a Ferralsol in Brazil. Geoderma Reg. 2021, 25, e00385. [Google Scholar] [CrossRef]
  41. Abbaspour-Gilandeh, M.; Abbaspour-Gilandeh, Y. Modelling soil compaction of agricultural soils using fuzzy logic approach and adaptive neuro-fuzzy inference system (ANFIS) approaches. Model. Earth Syst. Environ. 2019, 5, 13–20. [Google Scholar] [CrossRef]
  42. Akkacha, A.; Douaoui, A.; Younes, K.; Sawda, C.E.; Alsyouri, H.; Zahab, S.E.; Grasset, L. Investigating the Impact of Salinity on Soil Organic Matter Dynamics Using Molecular Biomarkers and Principal Component Analysis. Sustainability 2025, 17, 2940. [Google Scholar] [CrossRef]
  43. Kebonye, N.M. Exploring the novel support points-based split method on a soil dataset. Measurement 2021, 186, 110131. [Google Scholar] [CrossRef]
  44. Min, H.; Noh, B. SolarNexus: A deep learning framework for adaptive photovoltaic power generation forecasting and scalable management. Appl. Energy 2025, 391, 125848. [Google Scholar] [CrossRef]
  45. Sanap, S.; Patil, M.A.; Wandre, S.S.; Dalavi, P.N. Estimation of Crop Evapotranspiration of Wheat Using Remote Sensing & GIS Based Crop Coefficient. Asian J. Adv. Agric. Res. 2025, 25, 49–61. [Google Scholar] [CrossRef]
  46. Askari, I.B.; Ahsaee, H.G.; Shahsavar, A.; Keshtegar, B. Machine learning-based multi-objective optimization of a carbon dioxide direct-expansion geothermal heat pump comprising an internal heat exchanger and expander. Appl. Therm. Eng. 2025, 274, 126699. [Google Scholar] [CrossRef]
  47. Qin, Y.; Feng, W.; Chen, J.; Zheng, C.; Zhang, L.; Nie, T. Critical Nitrogen Dilution Curve for Diagnosing Nitrogen Status of Cotton and Its Implications for Nitrogen Management in Cotton–Rape Rotation System. Agronomy 2025, 15, 1325. [Google Scholar] [CrossRef]
  48. Liu, W.; Li, L.; He, X.; Lv, G. Evaluation of Soil Quality and Analysis of Barriers of Protection Forests along Tarim Desert Highway Based on a Minimum Data Set. Land 2024, 13, 498. [Google Scholar] [CrossRef]
  49. Yemefack, M.; Jetten, V.G.; Rossiter, D.G. Developing a minimum data set for characterizing soil dynamics in shifting cultivation systems. Soil Tillage Res. 2005, 86, 84–98. [Google Scholar] [CrossRef]
  50. Raiesi, F. A minimum data set and soil quality index to quantify the effect of land use conversion on soil quality and degradation in native rangelands of upland arid and semiarid regions. Ecol. Indic. 2017, 75, 307–320. [Google Scholar] [CrossRef]
  51. Adeyolanu, O.D. Application of the Concept of Minimum Data Sets to Soil Quality Assessment for Crop Production in Southwestern Nigeria. Int. J. Plant Soil Sci. 2017, 14, 1–10. [Google Scholar] [CrossRef]
  52. Hatano, R.; Mukumbuta, I.; Shimizu, M. Soil Health Intensification through Strengthening Soil Structure Improves Soil Carbon Sequestration. Agriculture 2024, 14, 1290. [Google Scholar] [CrossRef]
  53. Slaton, N.A.; Lyons, S.E.; Osmond, D.L.; Brouder, S.M.; Culman, S.W.; Drescher, G.; Gatiboni, L.C.; Hoben, J.; Kleinman, P.J.; McGrath, J.M.; et al. Minimum dataset and metadata guidelines for soil-test correlation and calibration research. Soil Sci. Soc. Am. J. 2021, 86, 19–33. [Google Scholar] [CrossRef]
  54. Samira, H.; Nafiseh, Y.; Bagher, F.M.; Atefeh, S. Soil quality assessment of paddy fields (in Northern Iran) with different productivities: Establishing the critical limits of minimum data set indicators. Environ. Sci. Pollut. Res. Int. 2022, 30, 10286–10296. [Google Scholar]
  55. Govaerts, B.; Sayre, K.D.; Deckers, J. A minimum data set for soil quality assessment of wheat and maize cropping in the highlands of Mexico. Soil Tillage Res. 2005, 87, 163–174. [Google Scholar] [CrossRef]
  56. Chen, S.; Jin, Z.; Zhang, J.; Yang, S. Soil quality assessment in different dammed-valley farmlands in the hilly-gully mountain areas of the northern Loess Plateau, China. J. Arid. Land 2021, 13, 777–789. [Google Scholar] [CrossRef]
  57. Chandel, S.; Hadda, M.S.; Mahal, A.K. Soil Quality Assessment Through Minimum Data Set Under Different Land Uses of Submontane Punjab. Commun. Soil Sci. Plant Anal. 2018, 49, 658–674. [Google Scholar] [CrossRef]
  58. Namr, K.I.; Lahbib, S.B.; Rerhou, B.; Masmoudi, Y.A.; Hajjaj, H.; Said, B.A. Comparative scoring indicators methods of different soil types to modelling soil quality through constructing Minimum Data Set in the Doukkala irrigated perimeter—Western region of Morocco. Environ. Earth Sci. 2025, 84, 132. [Google Scholar] [CrossRef]
  59. Maji, P.; Mistri, B. Comparative assessment of soil quality dynamics using SQI modelling approach: A study in rice bowl of West Bengal, India. Environ. Monit. Assess. 2024, 196, 567. [Google Scholar] [CrossRef] [PubMed]
  60. Chavarin-Pineda, Y. Soil quality in volcanic soils in a forest biosphere reserve in Mexico. Soil Water Res. 2021, 16, 217–227. [Google Scholar] [CrossRef]
  61. Ravali, E.; Konde, N.M.; Bhoyar, S.M.; Kanase, N.; Singh, A.; Thite, M.D.; Shrirao, T. Effect of Different Tillage and Organic Inputs on Soil Properties and Yield of Cotton on Vertisols. Asian J. Soil Sci. Plant Nutr. 2024, 10, 164–175. [Google Scholar] [CrossRef]
  62. Shi, D.; Ye, Z.; Li, H.; Lyu, S.; Wang, L.; Zhou, C. Effects of combined application of biochar and nitrogen fertilizer on soil quality of summer maize-winter wheat system. J. Appl. Ecol. 2023, 34, 442–450. (In Chinese) [Google Scholar]
  63. Rout, K.K.; Sahoo, S.; Mukhi, S.K.; Mohanty, G.P. Assessment of Quality of Different Organic Manures used by the Farmers of Khurda District in Orissa and their Effect on Microbial Activity of an Acid Soil. J. Indian Soc. Soil Sci. 2012, 60, 30–37. [Google Scholar]
  64. Polychronaki, E.; Douma, C.; Giourga, C.; Loumou, A. Assessing Nitrogen Fertilization Strategies in Winter Wheat and Cotton Crops in Northern Greece. Pedosphere 2012, 22, 689–697. [Google Scholar] [CrossRef]
  65. Zhang, Z.; Wang, J.; Huang, W.; Chen, J.; Wu, F.; Jia, Y.; Han, Y.; Wang, G.; Feng, L.; Li, X. Cover crops and N fertilization affect soil ammonia volatilization and N2O emission by regulating the soil labile carbon and nitrogen fractions. Agric. Ecosyst. Environ. 2022, 340, 108188. [Google Scholar] [CrossRef]
  66. Pan, J.; Zhang, L.; He, X.; Chen, X.; Cui, Z. Long-term optimization of crop yield while concurrently improving soil quality. Land Degrad. Dev. 2019, 30, 897–909. [Google Scholar] [CrossRef]
  67. Yuan, X.; Zhang, J.; Chang, F.; Wang, X.; Zhang, X.; Luan, H.; Qi, G.; Guo, S. Effects of nitrogen reduction combined with bio-organic fertilizer on soil bacterial community diversity of red raspberry orchard. PLoS ONE 2023, 18, e0283718. [Google Scholar] [CrossRef] [PubMed]
  68. Khuspure, J.A.; Kaware, D.; Bhoyar, S.M. Impact of Different Organic Manures Application on Soil Microbial Population and Soil Fertility under Cotton Cultivation. Trends Biosci. 2016, 8, 1519–1524. [Google Scholar]
  69. Koocheki, A.; Mahallati, M.N.; Moradi, R.; Alizadeh, Y. Evaluation of Yield and Nitrogen Use Efficiency of Maize and Cotton Intercropping under Different Nitrogen Levels. Iran. J. Field Crops Res. 2015, 13, 1–13. [Google Scholar]
  70. Wang, J.; Han, G.; Duan, Y.; Han, R.; Shen, X.; Wang, C.; Zhao, L.; Nie, M.; Du, H.; Yuan, X.; et al. Effects of Different Organic Fertilizer Substitutions for Chemical Nitrogen Fertilizer on Soil Fertility and Nitrogen Use Efficiency of Foxtail Millet. Agronomy 2024, 14, 866. [Google Scholar] [CrossRef]
  71. Zhao, N.; Ma, J.; Wu, L.; Li, X.; Xu, H.; Zhang, J.; Wang, X.; Wang, Y.; Bai, L.; Wang, Z. Effect of Organic Manure on Crop Yield, Soil Properties, and Economic Benefit in Wheat-Maize-Sunflower Rotation System, Hetao Irrigation District. Plants 2024, 13, 2250. [Google Scholar] [CrossRef] [PubMed]
  72. Saikia, P.; Bhattacharya, S.S.; Baruah, K.K. Organic substitution in fertilizer schedule: Impacts on soil health, photosynthetic efficiency, yield and assimilation in wheat grown in alluvial soil. Agric. Ecosyst. Environ. 2015, 203, 102–109. [Google Scholar] [CrossRef]
  73. Iqbal, A.; Liang, H.; McBride, S.G.; Yuan, P.; Ali, I.; Zaman, M.; Zeeshan, M.; Khan, R.; Akhtar, K.; Wei, S.; et al. Manure applications combined with chemical fertilizer improves soil functionality, microbial biomass and rice production in a paddy field. Agron. J. 2022, 114, 1431–1446. [Google Scholar] [CrossRef]
  74. Giannoulis, K.D.; Bartzialis, D.; Skoufogianni, E.; Danalatos, N.G. Innovative Nitrogen Fertilizers Effect on Cotton Cultivation. Commun. Soil Sci. Plant Anal. 2020, 51, 869–882. [Google Scholar] [CrossRef]
  75. Dar, E.A.; Omara, P.; Iboyi, J.E.; Mulvaney, M.J.; Carter, E.; Wood, C.W.; Sharma, L.; Singh, H. Optimizing nitrogen rates for rainfed cotton on sandy loam soils of Florida. Agron. J. 2025, 117, e70046. [Google Scholar] [CrossRef]
  76. Wang, N.; Zhan, J.; Feng, K.; Qi, J.; Nan, H. Higher yield sustainability and soil quality by reducing chemical fertilizer with organic fertilizer application under a single-cotton cropping system. Front. Plant Sci. 2024, 15, 1494667. [Google Scholar] [CrossRef] [PubMed]
  77. Sun, R.; Hou, C.; Cui, H. Inversion Models for Orchard Soil Nutrient Content Using Near- Infrared Spectroscopy. Innov. Appl. AI 2025, 2, 132–144. [Google Scholar] [CrossRef]
Figure 1. The correlation between soil evaluation indicators. The number indicates the correlation coefficient between the indicators; * indicates that the correlation between the indicators has reached a significant level (p < 0.05).
Agronomy 15 01763 g001
Figure 2. Soil quality index and its correlation based on MDS and TDS under different nitrogen application measures. Different lowercase letters indicate a significant difference at p < 0.05. (a) represents the soil quality index based on TDS and MDS for each process (data from 2022 to 2024), and (b) represents the simulation results and effect parameters of the correlation equation based on TDS and MDS for the soil quality index, where RMSE is the root mean square error, nRMSE is the standardized root mean square error, d is the collaborative index, and R2 is the coefficient of determination. The red dots in Figure (b) represent the soil quality index of each spot, with the horizontal axis representing the soil quality index calculated under the TDS method and the vertical axis representing the soil quality index calculated under the MDS method.
Agronomy 15 01763 g002
Figure 3. Cotton population biomass under different nitrogen application measures. (a,b) represent the biomass of nutrient organs and reproductive organs during the flower and boll stage for different treatments; (c,d) represent the biomass of nutrient organs and reproductive organs during the boll opening stage for different treatments. Different lowercase letters in the same year indicate significant differences among treatments (p < 0.05).
Agronomy 15 01763 g003
Figure 4. Stability and sustainability of cotton yield under different nitrogen application measures (three-year average from 2022 to 2024). (a,b), respectively, represent the stability and sustainability index of cotton yield under different treatments. Different lowercase letters in the same year indicate significant differences among treatments (p < 0.05).
Agronomy 15 01763 g004
Figure 5. Nitrogen agronomic efficiency and nitrogen partial factor productivity under different nitrogen reduction measures. (a,b), respectively, represent the nitrogen agronomic efficiency and nitrogen partial factor productivity of different treatments. Different lowercase letters in the same treatment for different years indicate significant differences between treatments (p < 0.05).
Agronomy 15 01763 g005
Figure 6. Regression analysis between soil quality index, seed cotton yield, and nitrogen fertilizer use efficiency. (ac), respectively, represent the relationship between soil quality index (based on TDS and MDS) and seed cotton yield, nitrogen agronomic efficiency, and nitrogen partial factor productivity. (d) represents the quadratic equation of seed cotton yield changing with soil quality index based on TDS and MDS.
Agronomy 15 01763 g006
Figure 7. The importance of soil characteristic factors (predicted by the random forest method) and the soil barrier index. (a) is the importance of feature factors predicted by the random forest model, and (b) is the thermal map of soil obstruction degree.
Agronomy 15 01763 g007
Table 1. Soil total and available nutrient content, organic matter content, and pH value for 0–20 cm in 2022.
OM/(g·kg−1)TN/(g·kg−1)TP/(g·kg−1)TK/(g·kg−1)AP/(mg·kg−1)AK/(mg·kg−1)NH4-N/(mg·kg−1)NO3-N/(mg·kg−1)pH
7.15 0.66 0.82 19.05 15.09 211.242.897.04 7.74
Note: OM, TN, TP, TK, AP, AK, NH4-N, NO3-N, and pH, respectively, represent the content of soil organic matter, total nitrogen, total phosphorus, total potassium, available phosphorus, available potassium, ammonium nitrogen, nitrate nitrogen, and pH value.
Table 2. Fertilization situation of each treatment.
TreatmentApplication Rate of Nitrogen /(kg·ha−1)Application Rate of Phosphate /(kg·ha−1)Application Rate of Potassium /(kg·ha−1)
CK0144315
CF345144315
N1276144315
N2276144315
Note: The nitrogen fertilizer application rate for N2 treatment is a urea application rate equivalent to pure nitrogen 248.4 kg·ha−1 and an organic fertilizer application rate equivalent to pure nitrogen 27.6 kg·ha−1.
Table 3. Principal component load matrix and norm value.
Soil IndicatorsPrincipal Component Load ValueNorm Value
PC1PC2PC3PC4
SBD−0.46 0.79 −0.22 0.19 1.63
TP10.46 −0.79 0.22 −0.19 1.63
SMC−0.15 0.28 0.76 −0.09 1.15
pH0.09 −0.09 0.68 0.39 1.03
TN0.68 0.35 −0.01 −0.50 1.80
TP20.49 0.50 −0.21 −0.05 1.41
TK0.62 0.10 0.33 −0.22 1.60
NO3-N0.64 −0.16 −0.49 0.18 1.72
NH4-N0.50 −0.28 −0.38 0.26 1.40
AN0.68 −0.07 −0.10 −0.34 1.71
AP0.75 0.09 0.02 0.04 1.84
AK0.61 0.25 0.29 0.22 1.59
OM0.92 0.17 0.04 0.01 2.25
SOC0.94 0.19 0.05 0.05 2.31
C/N0.79 −0.03 0.06 0.50 1.99
Note: PC1, PC2, PC3, and PC4 represent principal components 1, 2, 3, and 4, respectively. SBD is bulk density, TP1 is porosity, SMC is moisture content, pH is pH value, TN is total nitrogen content, TP2 is total phosphorus content, TK is total potassium content, NO3-N is nitrate nitrogen content, NH4-N is ammonium nitrogen content, AN is alkaline hydrolyzed nitrogen content, AP is available phosphorus content, AK is available potassium content, OM is organic matter content, SOC is organic carbon content, and C/N is carbon-to-nitrogen ratio. The same is represented below.
Table 4. Common factor variance, weight, and membership function type of soil quality evaluation indicators.
Data Set ClassificationSoil IndexCommon Factor VarianceWeightMembership Function Classification
TDSSBD0.9310.09 Anti S-type
TP10.9310.09 S-type
SMC0.6880.06 Parabolic
pH0.6350.06 Parabolic
TN0.8340.08 S-type
TP20.5390.05 S-type
TK0.5530.05 S-type
NO3-N0.7080.07 S-type
NH4-N0.5390.05 S-type
AN0.5960.06 S-type
AP0.5790.05 S-type
AK0.5640.05 S-type
OM0.8690.08 S-type
SOC0.9250.09 S-type
C/N0.8710.08 S-type
MDSSBD0.4340.13 Anti S-type
SMC0.6750.20 Parabolic
TN0.6680.19 S-type
SOC0.9820.28 S-type
C/N0.6880.20 S-type
Table 5. Effects of different nitrogen application measures on soil physicochemical and biological properties.
Soil IndexTreatment
CKCFN1N2
SBD1.40 ± 0.02 a1.38 ± 0.01 ab1.37 ± 0.02 ab1.33 ± 0.03 b
TP147.30 ± 0.83 b48.01 ± 0.56 ab48.13 ± 0.89 ab49.85 ± 1.14 a
SMC14.45 ± 1.32 a12.70 ± 1.18 b13.69 ± 1.35 ab13.67 ± 1.07 ab
pH7.78 ± 0.07 ab7.68 ± 0.09 b7.94 ± 0.05 a7.93 ± 0.07 a
TN0.73 ± 0.02 b0.94 ± 0.04 a0.93 ± 0.03 a0.94 ± 0.02 a
TP20.81 ± 0.02 b0.98 ± 0.05 a0.91 ± 0.04 ab1.05 ± 0.07 a
TK19.55 ± 0.51 c21.41 ± 0.45 b22.04 ± 0.29 ab22.51 ± 0.47 a
NO3-N4.31 ± 0.26 c6.77 ± 0.30 a5.76 ± 0.39 b6.10 ± 0.36 ab
NH4-N4.50 ± 0.16 c5.93 ± 0.35 a4.91 ± 0.20 bc5.29 ± 0.30 ab
AN91.00 ± 1.90 c111.89 ± 1.86 a101.33 ± 2.87 b104.33 ± 2.79 b
AP11.30 ± 0.40 b16.43 ± 0.60 a12.31 ± 0.61 b16.96 ± 0.33 a
AK316.89 ± 11.31 b343.22 ± 9.09 b331.22 ± 7.94 b391.33 ± 11.29 a
OM6.78 ± 0.26 c9.62 ± 0.18 b9.42 ± 0.19 b10.66 ± 0.23 a
SOC5.15 ± 0.12 c8.18 ± 0.20 b7.84 ± 0.23 b9.25 ± 0.07 a
C/N7.04 ± 0.10 c8.83 ± 0.34 b8.45 ± 0.36 b9.92 ± 0.21 a
Note: Data show the means ± standard error. Different lowercase letters in the same row of data indicate a significant difference between treatments at p < 0.05.
Table 6. Seed cotton yield and yield composition factors under different nitrogen application measures.
YearTreatmentSeed Cotton Yield/(kg·ha−1)Single Boll Weight/gBoll Density/(Bolls·m−2)Lint Percent/%
2022CK1065.50 ± 51.72 b3.98 ± 0.10 b38.30 ± 3.15 b41.45 ± 0.22 b
CF2978.76 ± 98.85 a4.57 ± 0.08 a79.40 ± 3.27 a42.72 ± 0.25 a
N12874.50 ± 150.76 a4.63 ± 0.13 a71.80 ± 2.26 a42.62 ± 0.35 a
N23049.50 ± 36.28 a4.69 ± 0.10 a75.80 ± 3.74 a43.15 ± 0.08 a
2023CK1201.00 ± 67.33 c4.05 ± 0.04 b46.30 ± 2.40 c41.37 ± 0.39 b
CF3267.00 ± 96.94 a5.23 ± 0.03 a93.80 ± 4.26 a42.41 ± 0.66 a
N12958.00 ± 78.21 b5.30 ± 0.22 a78.70 ± 2.82 b42.27 ± 0.27 a
N23425.50 ± 129.32 a5.34 ± 0.08 a92.10 ± 4.38 ab42.56 ± 0.43 a
2024CK1898.00 ± 59.52 b4.43 ± 0.08 b44.73 ± 3.88 b44.82 ± 0.75 a
CF3470.64 ± 126.34 a5.37 ± 0.31 a60.55 ± 3.85 a44.10 ± 0.02 a
N13283.76 ± 54.94 a5.06 ± 0.15 ab56.07 ± 2.27 a44.45 ± 1.01 a
N23381.06 ± 75.70 a5.43 ± 0.35 a56.55 ± 3.40 a44.54 ± 0.49 a
Note: Data show means ± standard error. Different lowercase letters in the same column of data indicate a significant difference between treatments at p < 0.05.
Disclaimer/Publisher’s Note: The statements, opinions and data contained in all publications are solely those of the individual author(s) and contributor(s) and not of MDPI and/or the editor(s). MDPI and/or the editor(s) disclaim responsibility for any injury to people or property resulting from any ideas, methods, instructions or products referred to in the content.

