Article

Multi-Dimensional Analysis of Quality-Related Traits Affecting the Taste of Main Cultivated Japonica Rice Varieties in Northern China

1
College of Information and Electrical Engineering, Shenyang Agricultural University, Shenyang 110866, China
2
National Digital Agriculture Regional Innovation Sub-Center (Northeast), Shenyang 110866, China
3
Rice Research Institute of Liaoning Province, Liaoning Academy of Agricultural Sciences, Shenyang 110101, China
*
Authors to whom correspondence should be addressed.
These authors contributed equally to this work.
Agronomy 2025, 15(8), 1757; https://doi.org/10.3390/agronomy15081757
Submission received: 13 June 2025 / Revised: 8 July 2025 / Accepted: 20 July 2025 / Published: 22 July 2025
(This article belongs to the Section Plant-Crop Biology and Biochemistry)

Abstract

The quality of rice, one of the most important food crops in the world, is directly related to people’s dietary experience and nutritional health. With the improvement in living standards, consumer requirements for the taste quality of rice are becoming increasingly strict. Japonica rice occupies an important position in rice production due to its rich genetic diversity and excellent agronomic characteristics. In this study, LJ433, JY653, LJ218, LJ177, LY66, and LX21, which are mainly popularized in northern China and have different taste values, were selected as the experimental subjects, and YJ219, which won the gold award in the third China high-quality rice variety taste quality evaluation, was taken as the control (CK). Low-field nuclear magnetic resonance and spectral analysis were adopted as the main detection techniques. The effects of free water (peak area increased by 13.24–86.68% when p < 0.05), bound water, appearance characteristics (such as chalkiness, which decreased by 18.48–86.48%), and chemical composition (amylose content decreased by 3.76–26.47%) on the taste value of rice were systematically analyzed, and a multi-dimensional “appearance–palatability–nutrition” evaluation system was constructed. The experimental results indicated that increasing the free water content, reducing the chalkiness and chemical component content could significantly improve the taste value of rice (p < 0.05). The results of this research provide a theoretical basis for breeding new high-yield and high-quality rice varieties and have guiding significance for the practice of rice planting and processing.

1. Introduction

Rice is a major global food crop, and so its cultivation directly impacts food security and consumer experience. While China is the world’s largest producer and consumer of japonica rice, rice breeding practices in the country have long focused on yield, resulting in lagging quality improvement; in particular, the proportion of high-quality rice with superior grain appearance, optimal cooking properties, and compliance with grade standards is less than 45%, significantly lower than that in developed countries [1,2]. The core problem lies in the lack of a systematic analysis of the mechanism of taste formation for breeders. The north is the main production area of japonica rice in China. The seven varieties selected in this study, including LJ433 and JY653, are widely representative and are the main japonica rice varieties cultivated in the northern China, with over 40% of the total cultivated area in key provinces such as Liaoning, Heilongjiang, and Jilin, covering high-, medium-, and low-palatability value types. The research findings specifically address the research questions regarding how the appearance characteristics, moisture status, and chemical composition of japonica rice varieties cultivated in northern China affect their taste quality, providing essential information on optimizing free water content, reducing chalkiness, and regulating amylose and protein levels to guide regional rice production practices effectively. Chalkiness, amylose, and protein content are key factors restricting quality, and it is difficult to achieve breakthroughs with the traditional single-trait improvement strategy [3]. This research constructed a multi-dimensional “appearance–taste–nutrition” evaluation system, providing a theoretical basis for cultivating new high-yield, high-quality rice varieties.
The appearance characteristics of rice, such as grain shape, color, and chalkiness, are primary factors through which consumers directly perceive the quality of rice, thus having a significant impact on the market acceptance of rice [4]. Meanwhile, the chemical components in rice—including water, protein, and amylose—form the material basis for the quality of rice and directly determine its taste and nutritional value [5]. Taste quality, as a comprehensive manifestation of the quality of rice, is not only influenced by the individual appearance and chemical composition factors characterizing rice but is also the result of their interactions [6].
Therefore, research on the effects of the appearance characteristics and chemical composition of japonica rice on its quality is of great significance [7]. In this paper, we studied the main japonica rice varieties cultivated in the north of China. Low-field nuclear magnetic resonance and spectral analysis were used for detecting moisture status and chemical components, respectively. This was combined with the determination of appearance quality. The effects of appearance, moisture status, and chemical components on the flavor value were analyzed, aiming to construct a multi-dimensional evaluation system of “appearance–edible taste–nutrition” and provide theoretical support for the breeding of high-quality japonica rice varieties.

2. Materials and Methods

2.1. Experimental Materials and Equipment

The experiment was conducted in the laboratory of the National Agricultural Regional Innovation Sub-Center (Northeast, China) from November of 2024 to April of 2025. The rice used in the experiment was sourced from experimental base of the Rice Research Institute of Liaoning Province (123°19’ E, 41°38’ N; altitude: 49 m). The experimental field was a multi-year continuous cropping paddy field with yellow clay loam soil, medium fertility, strong water retention, well water irrigation, and convenient drainage and irrigation. Amounts of 900 kg of ammonium sulfate, 150 kg of diammonium phosphate, and 120 kg of potassium sulfate were applied to each hectare of the experimental field. The ratio of nitrogen application was 4:4:2; that is, base fertilizer accounted for 40% of the total nitrogen application, green tillering fertilizer accounted for 40% (green fertilizer accounted for 15% and tillering fertilizer accounted for 25%), and panicle fertilizer accounted for 20%. The tested materials included the LJ433, JY653, LJ218, YJ219 (CK), LJ177, LY66, and LX21 varieties. The total area of plot size for each variety was 100 m2, and each variety had three replicates. The experiment materials were the main varieties of japonica rice in northern China, with a wide range of taste values (scores of 70.33–89.00), which reflected diverse quality traits, including variations in the appearance, texture, and chemical composition of different quality types of japonica rice. The northern region was chosen as the research area because it is the core production area of high-quality japonica rice in China. All varieties of rice were harvested and threshed in October of 2024. After removing impurities and damaged grains, they were naturally air-dried to a moisture content of 14%. Then, they were sealed in plastic bags and stored in a refrigerator at 4 °C to minimize the impacts of environmental factors on the quality of rice and ensure the stability of rice quality during the experiment. This study is based on the single-year experimental data of 2024 and does not involve the impact of climate fluctuations between years on quality. Subsequently, multi-year and multi-point experiments need to be conducted to verify the universality of the conclusion.
The main equipment used included an experimental husking machine (FC2K, Yamamoto Seisakusho, Shingo, Japan); a rice polishing machine (Yamamoto VP-32, Yamamoto Seisakusho, Japan); a rice taste counter (STA-1B, Satake Seisakusho, Higashi-Hiroshima, Japan); a nuclear magnetic resonance instrument (NMI20-015V-I, Shanghai Newmai Electronic Technology Co., Ltd., Shanghai, China); a dual-light source scanner (ScanMaker i800 plus, Shanghai Zhongjing Technology Co., Ltd., Shanghai, China); a rice appearance quality inspection and analysis system (SC-E, Hangzhou Wanshen Inspection Technology Co., Ltd., Hangzhou, China); a benchtop high-speed refrigerated centrifuge (Allegra 21R, BECKMAN Corporation, Brea, CA, USA); a microplate reader (Infinite 200 Pro M Nano, TECAN, Männedorf, Switzerland); a ultraviolet–visible spectrophotometer (UV-8000, Shanghai Yuanxi Instrument Co., Ltd., Shanghai, China); and a one ten-thousandth balance (ML204, Mettler Toledo, Greifensee, Switzerland).

2.2. Experimental Methods

2.2.1. Determination of Taste Value

Each variety of rice was harvested separately by plot, and all the rice harvested from each plot was mixed to ensure the representativeness of the sample. A 500 g sample of polished rice from each variety was weighed and rinsed until the water was clear. Distilled water was measured at a 1:1.25 ratio of rice to water. The rinsing and soaking of the rice lasted for a total of 30 min. The rice was placed in an electric rice cooker to steam for 30 min and then braised for 10 min. The lid was opened and the rice was stirred. The steamer cloth was covered and, after the rice cooled down, 8.0 g of rice was weighed and placed in a special metal ring. Both sides were pressed for 10 s to make rice cakes. Finally, the prepared rice cakes were inserted into the measurement chamber of the rice taste counter. Each test for each cooked sample was repeated three times, and the taste value of the rice was determined using a rice taste counter [8,9].

2.2.2. Determination of Appearance Characteristics

A total of 200 intact and healthy polished rice grains were randomly selected for each of the 7 varieties of rice as a group of test samples, and 5 groups were repeatedly analyzed [10]. The grain length, grain width, chalkiness degree, and chalkiness grain rate of the rice were determined using a dual-light source scanner (ScanMaker i800 plus, Shanghai Zhongjing Technology Co., Ltd., China) combined with a rice appearance quality inspection and analysis system (SC-E, Hangzhou Wanshen Inspection Technology Co., Ltd., China).

2.2.3. Determination of Different Forms of Water

A total of 50 intact and healthy polished rice grains were randomly selected for each of the 7 varieties of rice as a group of test samples, and 5 groups were repeatedly analyzed. Before the test, a standard oil sample was first placed in the test tube and positioned at the center of the magnet box. The center frequency and the pulse widths of 90° and 180° were calibrated using the FID (free induction decay) sequence. Then, the oil sample was taken out. The polished rice of the variety to be tested was grouped and put into the test tube, which was placed at the center of the permanent magnet box. The nuclear magnetic resonance signal intensity of the rice was tested using the CPMG (Carr–Purcell–Meiboom–Gill) sequence. The testing of each polished variety of rice was repeated 5 times. The average value of the collected nuclear magnetic resonance signals was imported into the inversion software to obtain the T2 inversion spectrum. The specific test parameters were as follows: cumulative number of samples, NS = 16; hard pulse 90° pulse width, P1 = 17.52 μs; repeated sampling waiting time, TW = 2000 ms; number of echoes, NECH = 6000; start time: 0.01 ms; iteration number: 10,000; cut-off time: 10,000 ms.

2.2.4. Determination of Chemical Composition

The polished rice was ground into powder and passed through a 100-mesh sieve, and the soluble protein and protein contents were determined using the Coomassie brilliant blue G-250 method [11]. The amylose content was determined using the iodine colorimetric method [12].

2.2.5. Data Statistics and Analysis

Data were processed and analyzed using SPSS 25.0. After conducting a one-way analysis of variance (ANOVA) to assess whether significant differences existed among the means of multiple groups, the least significant difference (LSD) test was employed for post hoc multiple comparisons at a 95% confidence level (α = 0.05) [13,14].

3. Results

3.1. Taste Values of Different Rice Varieties

Taste value is a key indicator for comprehensively evaluating the texture, taste, and other food qualities of rice, directly reflecting the deliciousness of rice after cooking. Through the taste value experiment, the taste values of seven rice varieties, LJ433, JY653, LJ218, CK, LJ177, LY66, and LX21, were determined to be 89.00, 85.33, 84.33, 82.67, 80.67, 77.67, and 70.33, respectively. There were significant differences in the taste values between the six experimental subjects of LJ433, JY653, LJ218, LJ177, LY66, LX21, and CK (p < 0.05). For the convenience of subsequent analysis, the three types of rice with taste values higher than CK—namely, LJ433, JY653, and LJ218—are denoted as group A, while the three types of rice with taste values lower than CK—namely, LJ177, LY66, and LX21—are called group B. The taste values of LJ433, JY653, and LJ218 in group A were 7.66%, 3.22% and 2.01% higher than that of CK, respectively, while those of LJ177, LY66, and LX21 in group B were 2.42%, 6.05%, and 14.93% lower than that of CK, respectively.

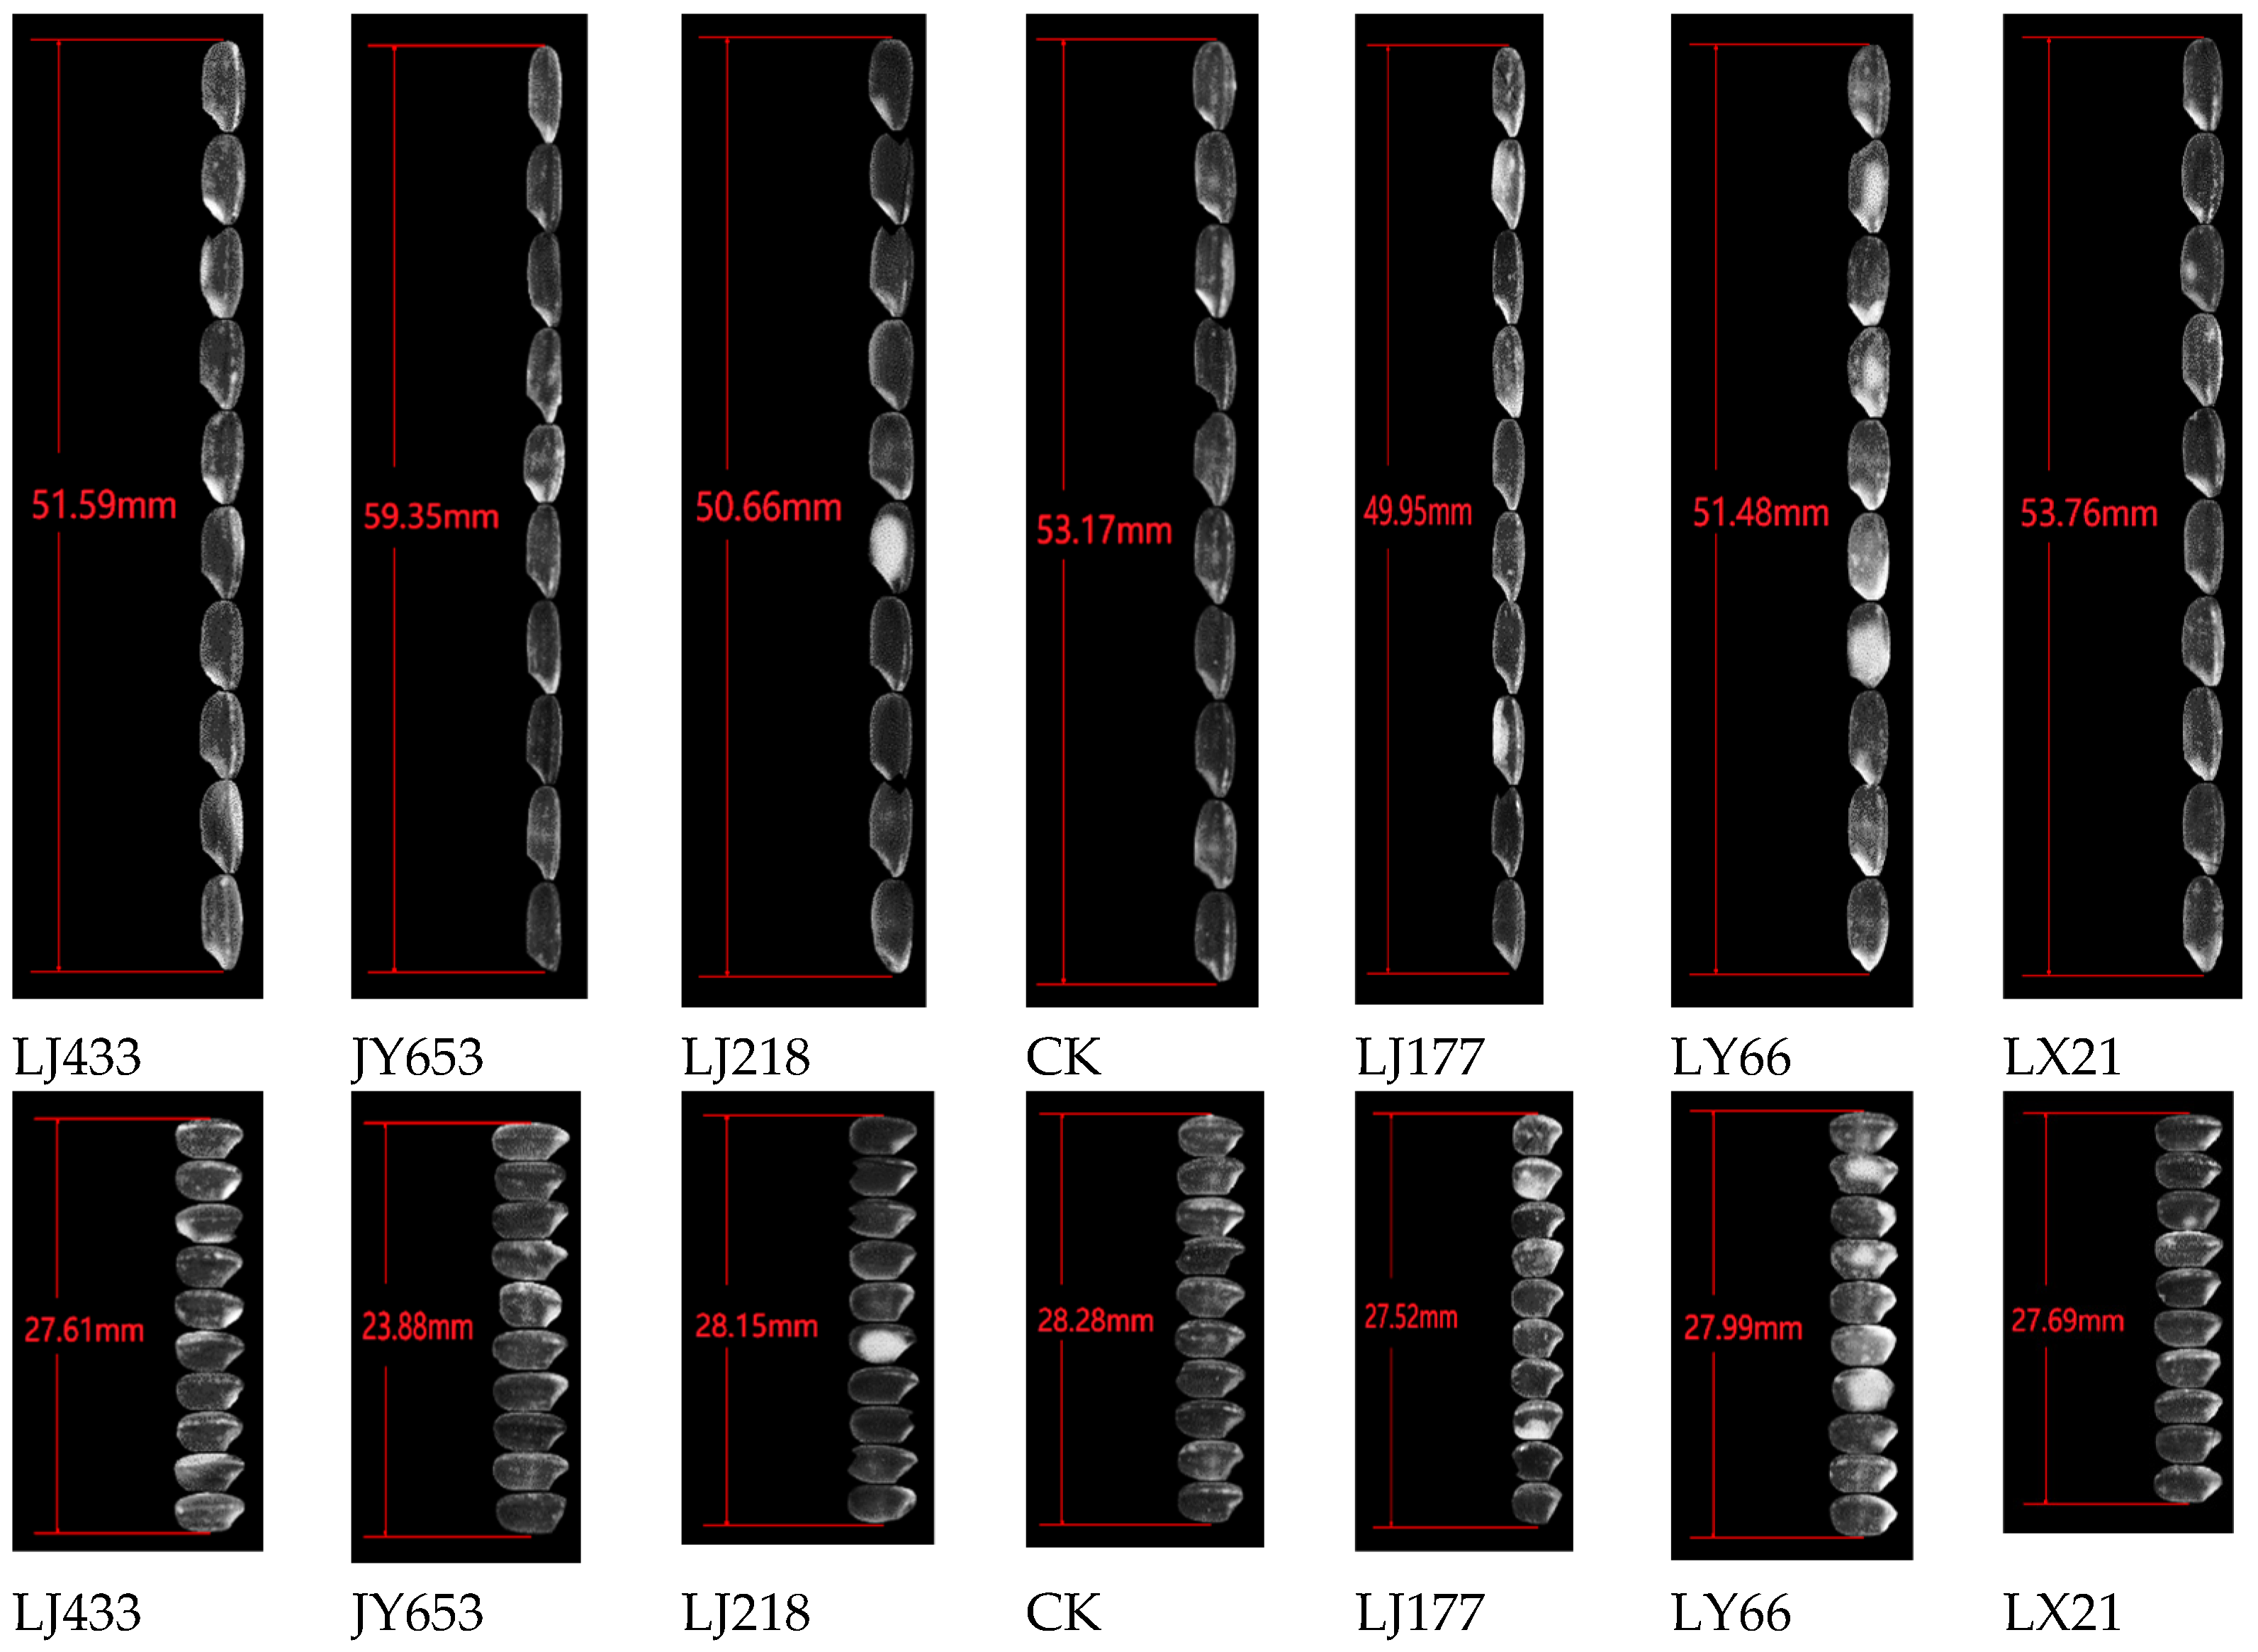
3.2. Appearance Characteristics of Different Varieties of Rice

Characteristics such as the length, width, grain shape, and chalkiness of the different varieties of rice are visually displayed in Figure 1. The data in Table 1 clearly show certain significant differences in the six appearance indicators of mean area, mean perimeter, mean length, mean width, mean diameter, and mean roundness between LJ433, JY653, and LJ218 in group A; LJ177, LY66, and LX21 in group B; and CK.
The data in Table 2 clearly show certain significant differences in the seven appearance indicators of the grain shape (LS/T 6116), mean area, mean perimeter, mean length, mean width, mean roundness, and head rice rate of head rice between LJ433, JY653, and LJ218 in group A; LJ177, LY66, and LX21 in group B; and CK.
The data in Table 3 clearly show significant differences (p < 0.05) in the four appearance indicators of the percentage of chalky grains, percentage of chalky grains (area ratio), percentage of chalky grains (LS/T 3247), and chalkiness degree between LJ433, JY653, and LJ218 in group A, LJ177, LY66, and LX21 in group B, and CK, while there was no significant difference in transparency between all varieties. Notably, the four appearance indicators of the percentage of chalky grains, percentage of chalky grains (area ratio), percentage of chalky grains (LS/T 3247), and chalkiness degree were significantly negatively correlated with the taste value. The percentage of chalky grains for LJ433, JY653, and LJ218 in group A were 82.24%, 34.82%, and 47.65% lower than that for CK, respectively, while those for LJ177, LY66, and LX21 in group B were 9.94%, 29.19%, and 18.31% higher than that of CK, respectively. The percentage of chalky grains (area ratio) for LJ433, JY653, and LJ218 in group A were 80.83%, 32.35%, and 48.31% lower than that of CK, respectively, while those for LJ177, LY66, and LX21 in group B were 19.17%, 43.28%, and 18.91% higher than that of CK, respectively. The percentage of chalky grains (LS/T 3247) for LJ433, JY653, and LJ218 in group A were 100.00%, 10.71%, and 62.50% lower than that for CK, respectively, while those for LJ177, LY66, and LX21 in group B were 32.59%, 5.36%, and 99.55% higher than that for CK, respectively. The chalkiness degree values for LJ433, JY653, and LJ218 in group A were 186.48%, 18.03%, and 58.59% lower than that of CK, respectively, while those for LJ177, LY66, and LX21 in group B were 24.79%, 33.52%, and 42.54% higher than that for CK, respectively.

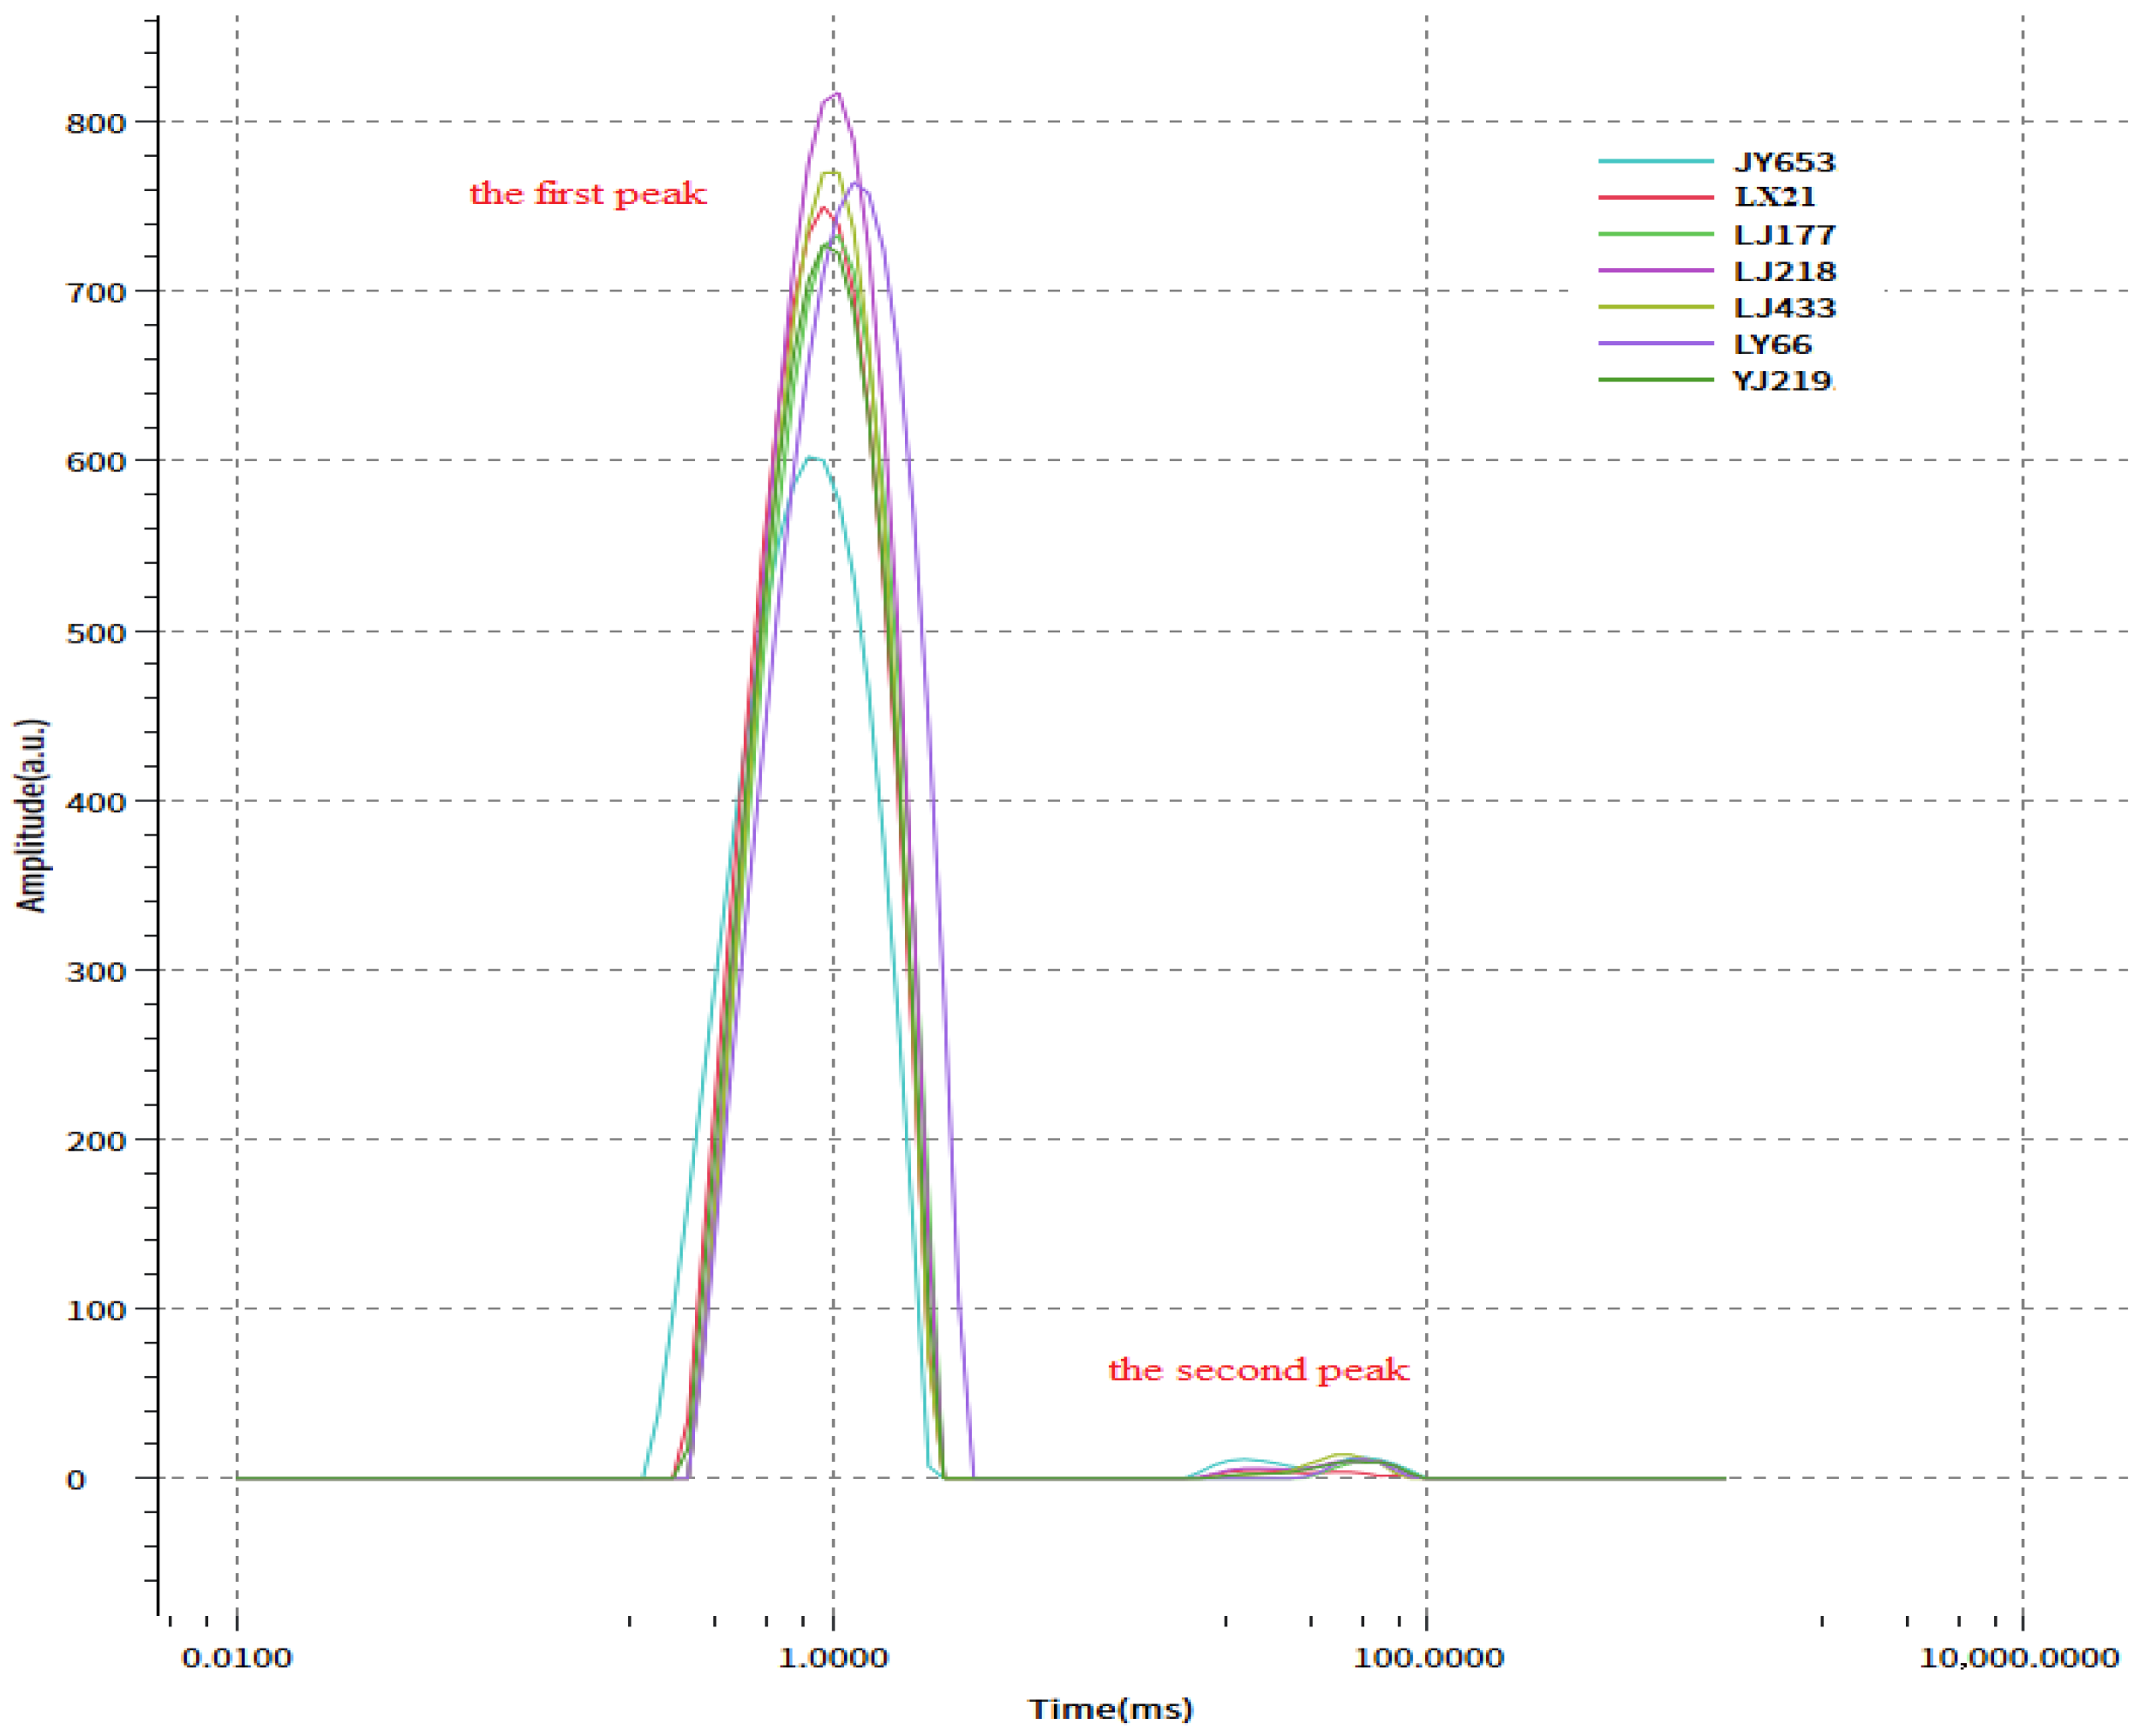
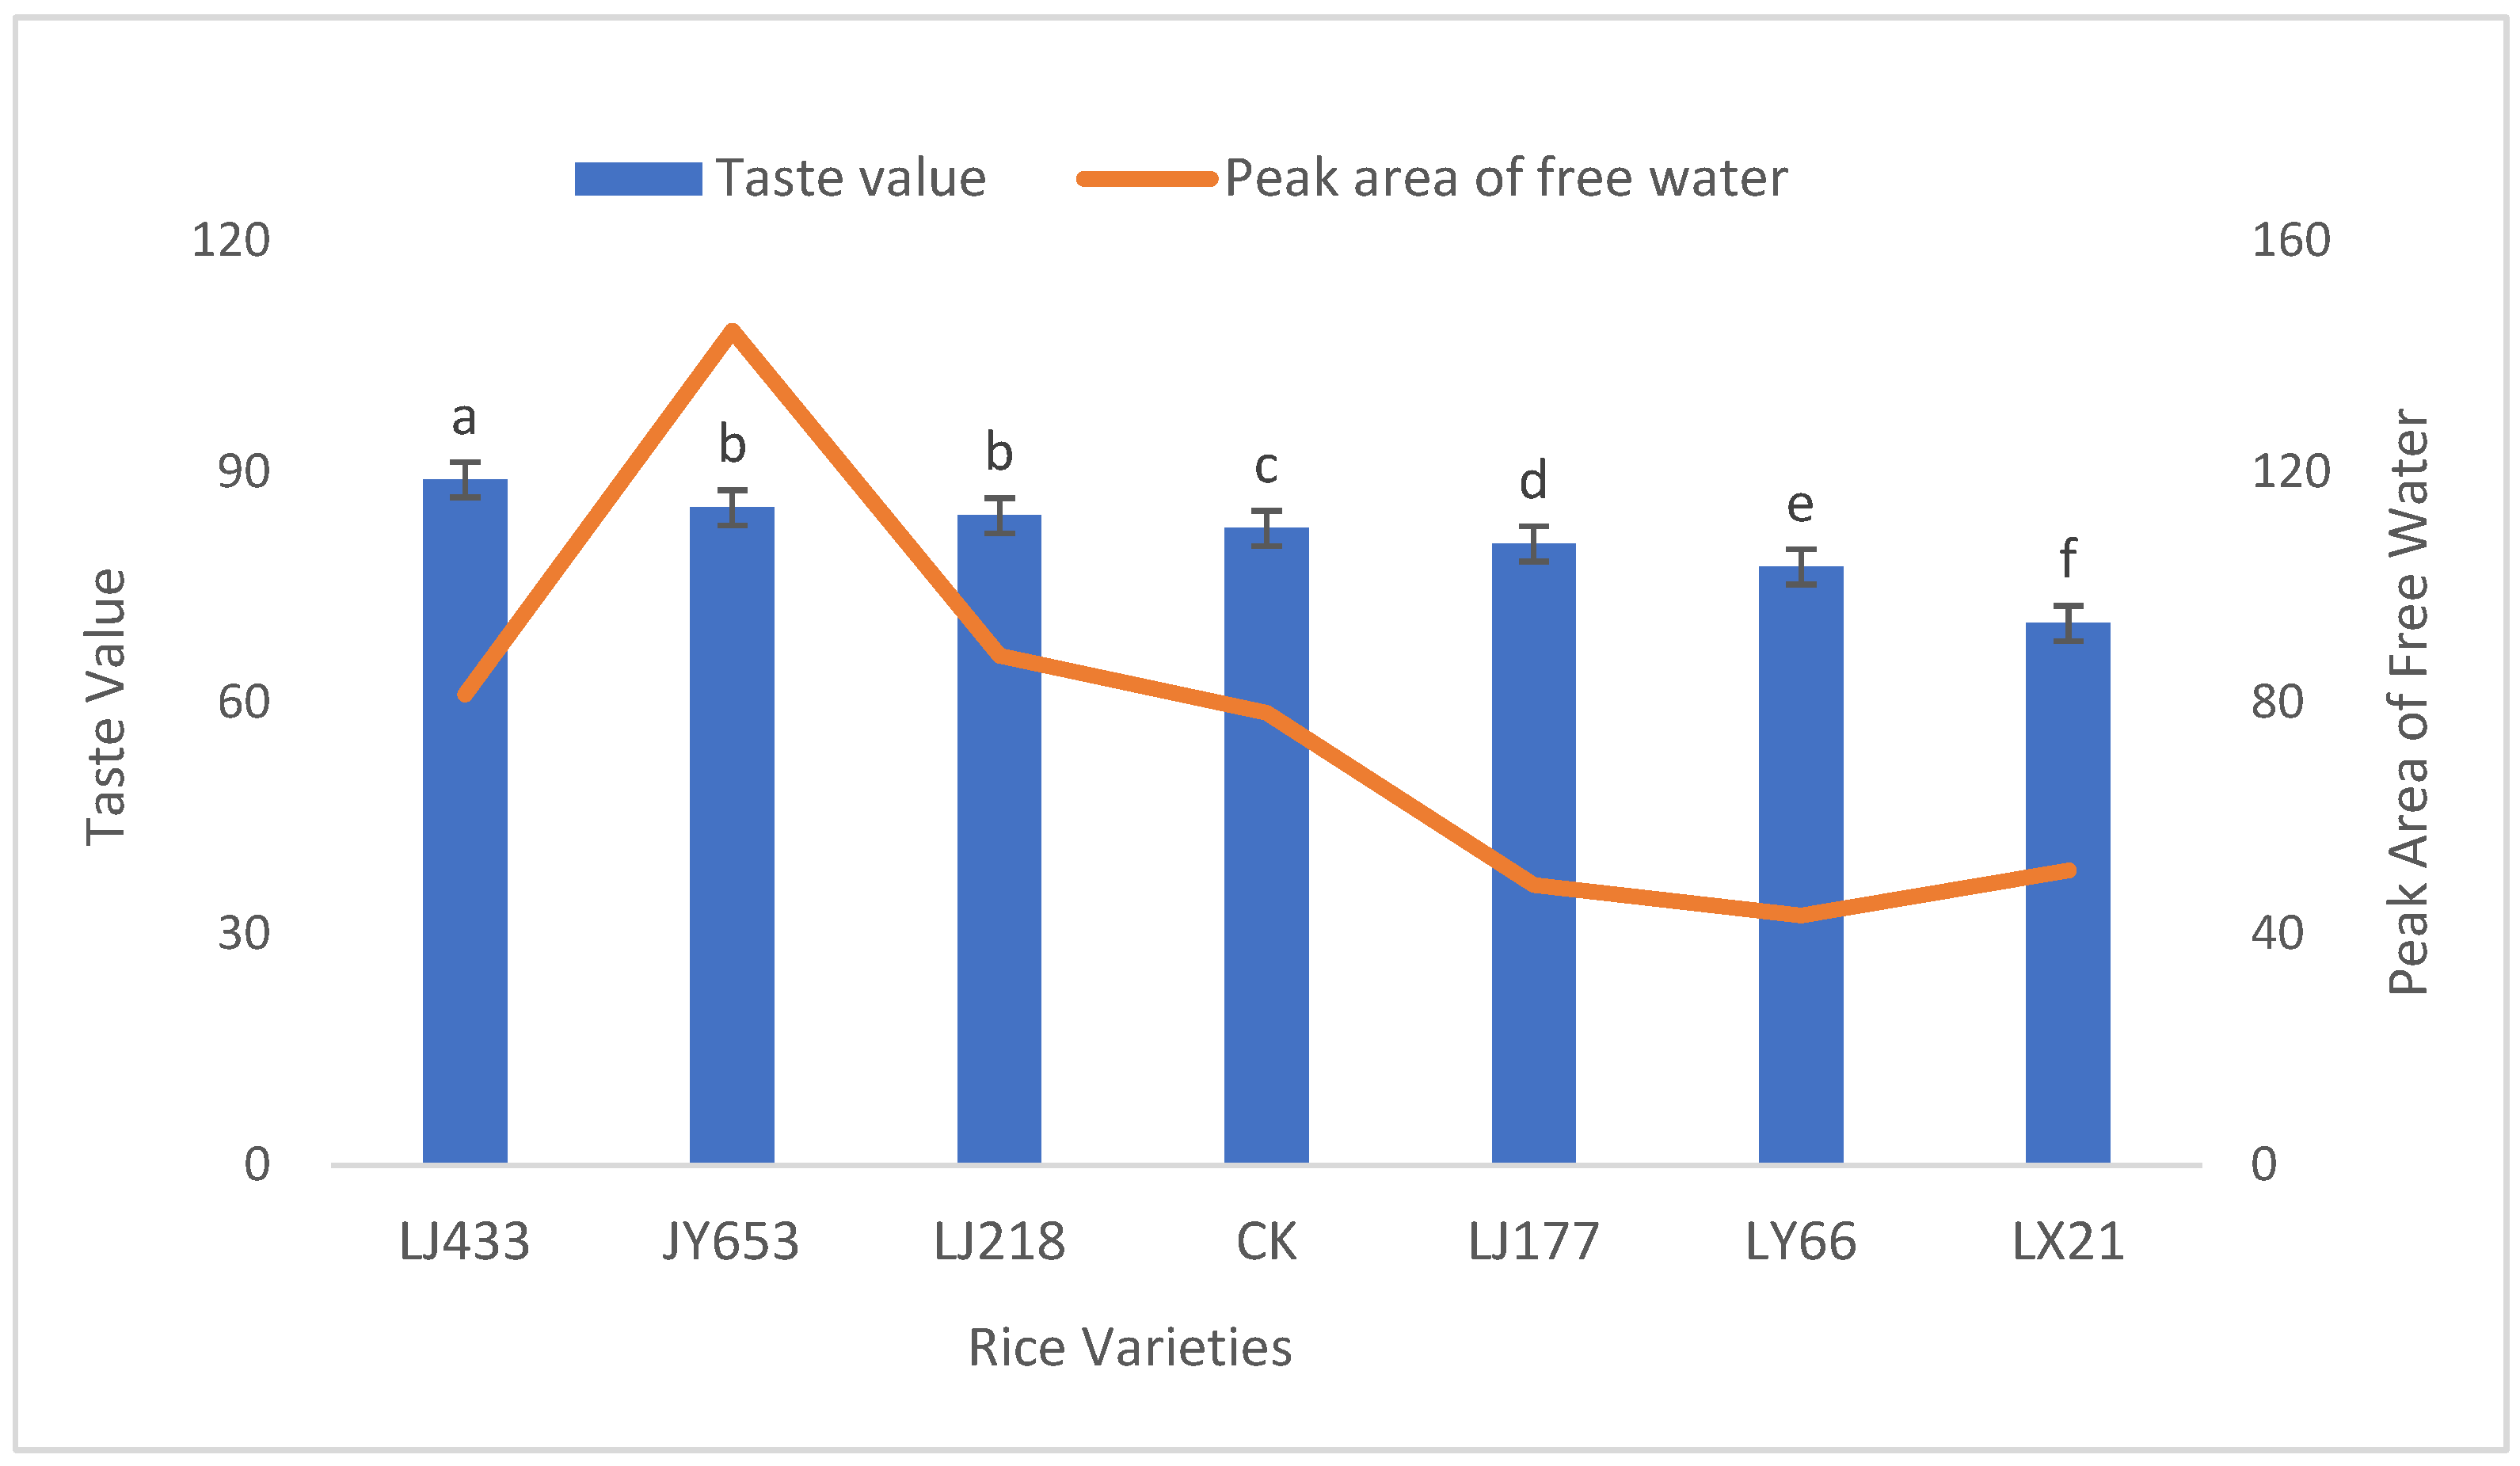
3.3. Contents of Free and Bound Water in Different Rice Varieties

According to the principle of nuclear magnetic resonance, the transverse relaxation time is closely related to the chemical environment in which protons are located and directly reflects the degree of tightness of the combination between water molecules and other substances: the longer the lateral relaxation time is, the looser the water molecules in the sample combine with other substances and the higher the degree of freedom of protons is. Therefore, the phase state and composition of water in the tested sample can be determined based on the starting position of the wave peak in the inversion spectrum. Furthermore, the total peak area corresponding to each peak in the transverse relaxation inversion spectrum obtained through nuclear magnetic resonance is directly proportional to the number of hydrogen protons in the sample. Different relaxation times represent different phases of water. According to the different phases, the relaxation time is divided into short relaxation time (T21) and long relaxation time (T22). The water represented by T21 is called bound water, while that represented by T22 is called free water. The variation in relaxation time can reflect the distribution characteristics of bound and free water in the rice seeds. Therefore, the first large peak represents the amplitude of the bound water signal, the second small peak represents the amplitude of the free water signal, and the corresponding peak areas represent the respective contents of bound and free water, with their sum representing the total water content. As can be seen from Figure 2, the nuclear magnetic resonance inversion spectra of the seven rice varieties all present two peaks, indicating that there were two states of moisture (the first peak represents bound water, and the second peak represents free water) in the different rice varieties.
The data in Table 4 clearly show certain significant differences (p < 0.05) in the peak area of free water between LJ433, JY653, and LJ218 in group A, LJ177, LY66, and LX21 in group B, and CK, while there were no significant differences in the mass (50 grains), peak area of total water, and peak area of bound water. The peak area of free water was significantly positively correlated with the taste value (Figure 3). The peak areas of free water for LJ433, JY653, and LJ218 in group A were 13.24%, 86.68%, and 26.30% higher than that for CK, respectively, while the peak areas of free water for LJ177, LY66, and LX21 in group B were 37.41%, 38.67%, and 31.94% lower than that for CK, respectively.
This study found that the content of free water was significantly positively correlated with the taste value, which is consistent with Ling et al.’s (2025) [15] conclusion in their research on nitrogen fertilizer regulation that “free water promotes starch gelatinization”, further verifying the key role of free water in the formation of palatability. Compared with the ultrasonic treatment study by Lian et al. (2025) [16], this study directly revealed the genetic basis of free water through the differences among varieties, providing a new indicator for variety breeding.

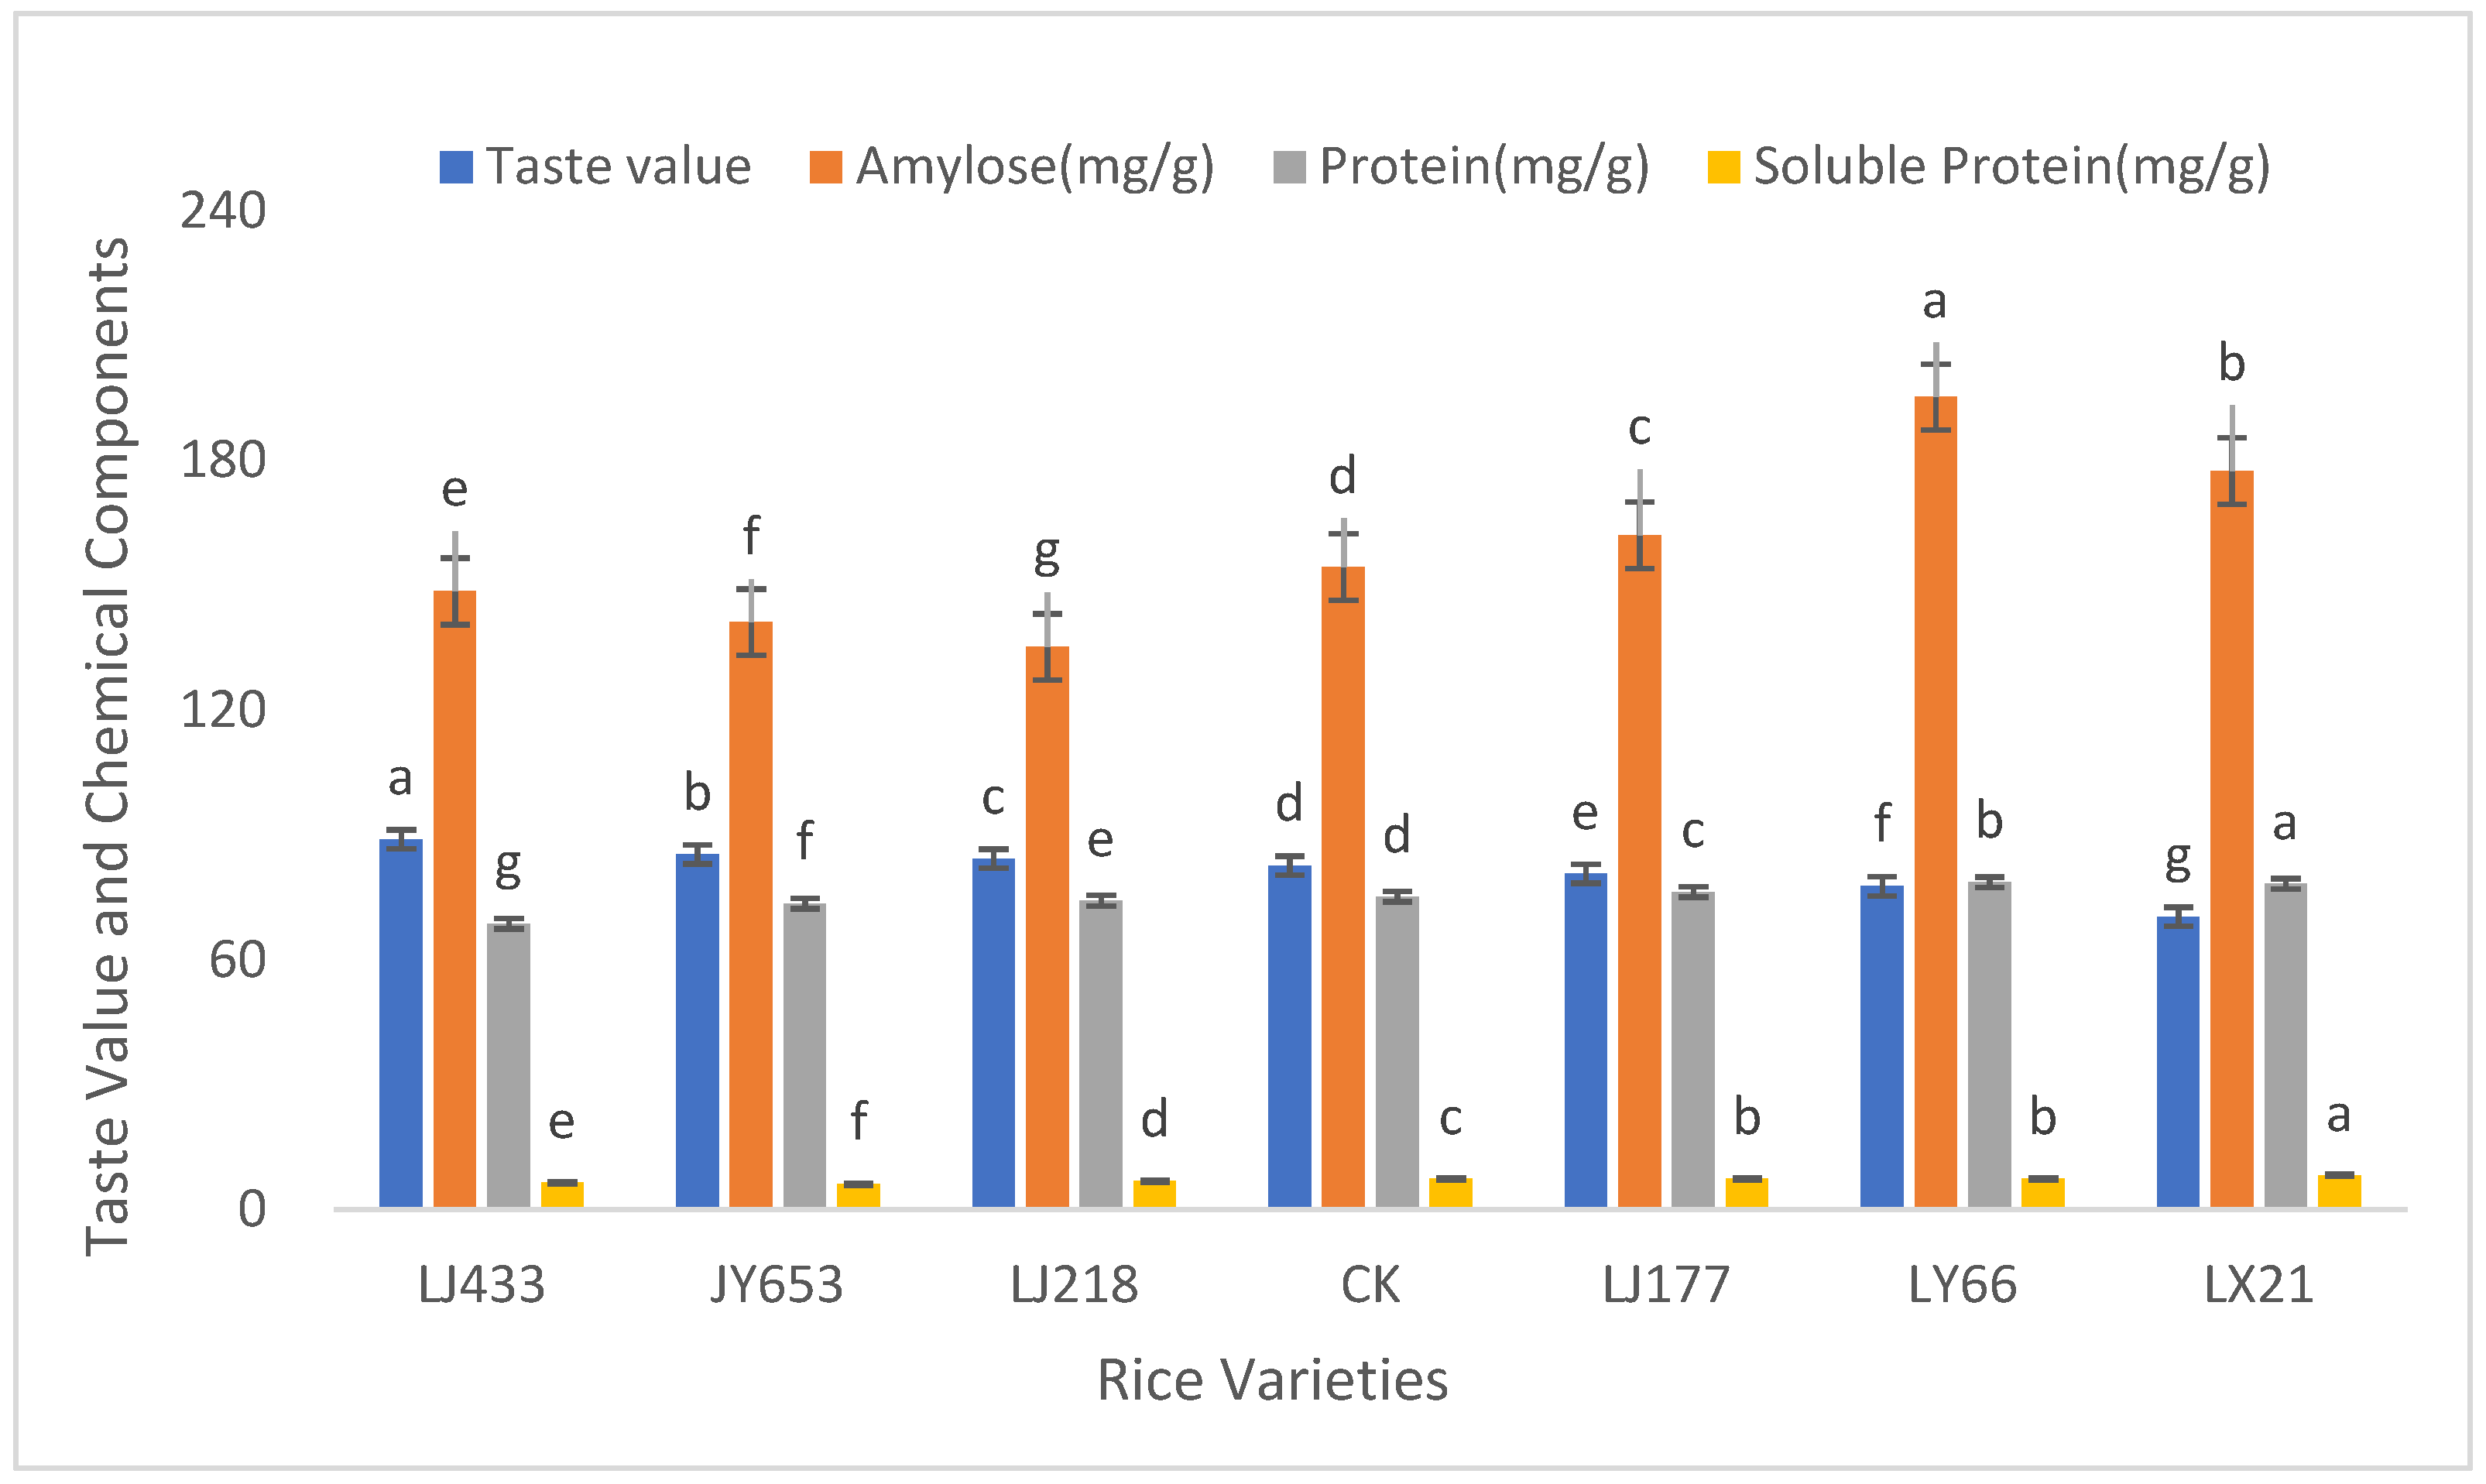
3.4. Intrinsic Chemical Components of Different Rice Varieties

The data in Table 5 clearly show significant differences (p < 0.05) in the contents of amylose, protein, and soluble protein between LJ433, JY653, and LJ218 in group A; LJ177, LY66, and LX21 in group B; and CK. The contents of amylose, protein, and soluble protein were significantly negatively correlated with the taste value (Figure 4). The contents of amylose in LJ433, JY653, and LJ218 in group A were 3.76%, 8.54%, and 12.39% lower than that in CK, respectively, while the contents of amylose in LJ177, LY66, and LX21 in group B were 4.97%, 26.47%, and 14.92% higher than that in CK, respectively. The protein contents in LJ433, JY653, and LJ218 in group A were 8.61%, 2.21%, and 1.28% lower than that in CK, respectively, while the protein contents in LJ177, LY66, and LX21 in group B were 1.53%, 4.58%, and 4.14% higher than that in CK, respectively. The soluble protein contents in LJ433, JY653, and LJ218 in group A were 13.14%, 16.53%, and 7.99% lower than that in CK, respectively, while the soluble protein contents in LJ177, LY66, and LX21 in group B were 0.95%, 1.08%, and 11.79% higher than that in CK, respectively.
The result of a negative correlation between amylose content and taste value is consistent with the conclusion of the review of Bao et al. (2023) [17]. However, this study found that there are no similar reports on the negative correlation between soluble protein and taste value, indicating that soluble protein may indirectly affect palatability by influencing the release of flavor substances. Further verification through metabolomics is needed.

3.5. Correlation Between Quality-Related Traits and Taste Values

There were significant positive correlations between the peak area of free water and taste values (p < 0.05). There were significant negative correlations between the percentage of chalky grains, percentage of chalky grains (area ratio), percentage of chalky grains (LS/T 3247), chalkiness degree, amylose, protein, soluble protein, and taste values (p < 0.05) (Table 6).

4. Discussion

4.1. Effects of Different Appearance Characteristics on Taste Quality

Appearance characteristics, which affect first direct impressions in consumers, affect the perception of eating quality to a certain extent [18]. An in-depth exploration of the correlations between different appearance characteristics and the taste quality of rice is conducive to understanding the formation mechanism of rice quality from multiple dimensions, providing a scientific basis for optimizing rice breeding, cultivation, and processing practices [19].
Chalkiness is one of the most important defects in the appearance quality of rice, which also has a significant negative impact on the taste quality of rice [20]. The experimental data clearly revealed significant differences between the different rice varieties and CK in characteristic indicators of chalkiness—including the percentage of chalky grains, percentage of chalky grains (area ratio), percentage of chalky grains (LS/T 3247), and chalkiness degree—and these indicators were significantly negatively correlated with the taste value. Chalkiness denotes the white and opaque part of rice, which forms due to the loose and porous arrangement of starch particles in the endosperm. The presence of chalkiness can affect the appearance, luster, and transparency of rice, reducing its commercial value [21]. More importantly, the structural characteristics of the chalky area affect the water absorption and starch gelatinization properties of rice during the cooking process [22]. The starch particles in the chalky area are loosely arranged, making it easy for water to penetrate [23]. However, during the cooking process, excessive water absorption and over-expansion may occur, causing the rice grains to break and affecting the overall taste of the rice [24]. Meanwhile, the degree of starch gelatinization in the chalky area may not be consistent with that in the normal area, resulting in an uneven texture in the rice. Some grains may be too hard or too soft, thereby reducing the taste quality. The values of chalkiness-related indicators for LJ433, JY653, and LJ218 in group A were significantly lower than those for CK, while their taste values were higher than that of CK. This indicates that a lower degree of chalkiness helps to improve the taste quality of rice. On the contrary, the values of chalkiness-related indicators for LJ177, LY66, and LX21 in group B were higher than those for CK, while their palatability values were lower than that of CK, further verifying the negative impact of chalkiness on taste quality. In actual production, reducing chalkiness in rice is an important goal for improving its taste quality. This study verified the rule that “low-chalkiness varieties have higher palatability values” through the phenotypic data of seven main cultivated varieties; combined with the study of putative genetic loci affecting chalkiness by Chen et al. [25], the research results will provide a theoretical basis for the cultivation and screening of rice with low chalkiness.
Grain shape is another important characteristic affecting the appearance of rice; while our study did not find a direct significant correlation between grain shapes and taste values, the physical properties associated with different grain shapes may indirectly influence the eating quality of rice. Breeders should consider grain shape as part of a broader strategy to develop rice varieties that meet diverse market demands and consumer preferences. In long-grain rice, which usually has a slender appearance, the arrangement and expansion pattern of its starch particles during the cooking process may differ from those of medium- and short-grain rice. In particular, as the starch chains of long-grain rice are relatively long, they may form a relatively loose structure when they absorb water and expand, which gives the rice grains a certain degree of elasticity and toughness when chewed; this unique taste characteristic may attract some consumers, who think that its quality is better [26]. For instance, Thai fragrant rice—as a typical long-grain rice variety—is renowned worldwide for its unique aroma and slightly elastic texture and is deeply loved by consumers. Although the formation of its taste quality is the result of the combined effect of multiple factors, the unique physical structure endowed by the grain shape undoubtedly adds characteristics to its eating performance. Medium- and short-grain rice varieties are relatively plumper and rounder. During the cooking process, medium- and short-grain rice may be more likely to form a uniform and soft texture. For people who prefer a soft and glutinous texture, the taste quality of medium- and short-grain rice may better meet their needs [27]. For instance, Japanese Koshihikari rice—as a representative of medium- and short-grain rice—is renowned for its soft, glutinous, and sweet texture and performs exceptionally well in terms of the stickiness and fineness of the rice. Its shape characteristics enable the rice grains to fully absorb water during cooking and the starch to gelatinize uniformly, resulting in a fine texture. This is one of the important reasons for its excellent taste quality.
While our study did not find a direct significant correlation between basic appearance indicators and taste values, these indicators may still have subtle and indirect effects on the taste values of rice. Future research should aim to elucidate the complex interactions between various quality-related traits to provide more definitive guidance for rice breeding efforts. Indicators such as area, perimeter, length, width, diameter, and mean roundness mainly describe the shape and size characteristics of rice grains, and changes in these indicators may affect the water absorption and swelling of rice during the cooking process [28]. For instance, rice grains with more regular shapes and higher roundness may absorb water more evenly during cooking, forming grains of uniform size and thereby enhancing the overall taste of the rice. Irregularly shaped grains may absorb water unevenly during cooking, resulting in some grains being either too hard or too soft and affecting the taste quality. However, these influences are relatively subtle and may be masked by other, more significant indicators in the actual taste evaluation. Therefore, no obvious correlation was observed between basic appearance indicators (e.g., average area, perimeter) and taste value in the data.
While our study did not find a direct correlation between the head rice rate and taste value, this trait remains an important consideration for breeders. By incorporating the head rice rate into multi-trait selection programs and focusing on processing resilience, breeders can develop rice varieties that offer both high quality and marketability. A high head rice rate means that the rice has a lower breakage rate during processing and can maintain a relatively complete grain structure [29]. Intact grains can better preserve their internal components and structure during cooking, which is conducive to the uniform gelatinization of starch and the release of nutrients and, thus, may have a positive impact on the taste quality [30]. For instance, during the processing of rice, if the head rice rate is relatively high, it indicates that the rice has good hardness and toughness and is less likely to break during storage and transportation, thus better maintaining its original quality. When consumers purchase rice with a higher head rice rate, the cooked rice may have a more stable texture and flavor, providing a better dining experience.
While our study did not find a direct correlation between transparency and taste value, transparency remains an important characteristic that can provide insights into the internal structure of rice grains. By incorporating transparency into multi-trait selection programs and focusing on enhancing internal structure, breeders can develop rice varieties that offer both high quality and marketability. Future research should continue to explore the relationships between various appearance and internal quality traits to provide more definitive guidance for breeding efforts. Rice with higher transparency has starch particles in its endosperm that are arranged more closely and evenly, allowing light to pass through better and giving the rice a crystal-clear appearance. This compact structure may facilitate the uniform gelatinization of starch during cooking, resulting in a fine, soft, and glutinous rice texture [31]. On the contrary, rice with lower transparency may have problems such as a loose starch particle arrangement and higher chalkiness, affecting the taste quality of the rice [32]. However, the influence of transparency on the taste quality is relatively indirect and complex. In the actual evaluation of taste, it may be masked by other more significant factors [33]. Therefore, no obvious correlation was observed in the data.

4.2. Effects of Water Content in Different States on Taste Quality

The moisture in different states of rice—namely, free water and bound water—has a non-negligible influence on its taste quality. Free water exists in rice in a free state and can flow freely, participating in biochemical reactions and material transport within the rice. Meanwhile, bound water is closely combined with macromolecular substances in rice, such as starches and proteins, and is an important component for maintaining the structure and function of rice cells [34,35]. Through nuclear magnetic resonance technology, the existence of free water and bound water in rice can be clearly distinguished and their contents can be quantitatively analyzed [36,37].
It can be seen, from the experimental data, that there were significant differences in the taste values of different rice varieties and, at the same time, the contents of free and bound water also differed. The free water content of rice in group A was generally higher than that in CK, while those in group B generally had lower free water content than CK. This phenomenon indicates that there may be a positive correlation between the free water content and the taste value of rice. Further analysis of the data revealed that the free water content in group A rice was significantly increased, when compared to that in CK. For instance, the free water content of the LJ433 variety was 13.24% higher than that in CK, while that of the JY653 variety was 86.68% higher. These rice varieties with high free water content also performed well in terms of taste value, being 7.66% and 3.22% higher than that for CK, respectively. On the contrary, the reduction in free water content in group B rice was also significant. For example, the free water contents of the LJ177 and LY66 varieties were 37.41% and 38.67% lower than that in CK, respectively, and their palatability values were 2.42% and 6.05% lower than that of CK accordingly.
The effect of free water content on the taste quality of rice may be reflected in multiple aspects. Firstly, as free water serves as the medium for biochemical reactions within rice, its content may affect the degree of gelatinization of rice and the expansion of starch particles during the cooking process. An appropriate amount of free water helps starch particles to fully absorb water and expand, forming a uniform and fine structure and thereby enhancing the taste and flavor of rice. Secondly, free water may also be involved in processes relating to the dissolution and release of flavor substances from rice, affecting the aroma and flavor of rice. Rice with a high free water content may be more likely to release pleasant flavor substances during cooking, enhancing the taste quality. In contrast, the relationship between bound water content and the taste value of rice is relatively complex [38,39,40]. It can be seen from the experimental data that, although the bound water content of different rice varieties also varied, there was no obvious correlation between these and the taste value. This might be because bound water mainly binds closely with macromolecular substances in rice, thus playing an important role in determining the physical properties and structural stability of rice, while its direct impact on taste quality is relatively small. However, the roles of bound water in maintaining the structure and function of rice cells cannot be ignored; as a result, it may indirectly affect the taste quality by influencing the texture and taste of rice [41,42].
In addition to the contents of free and bound water, the total water content in rice is also an important factor affecting the taste quality. Although the total water content did not vary significantly between the different rice varieties in this experiment, the change in total water content might still have a certain impact on the taste quality of rice [43,44]. For instance, an excessively high total water content may cause rice to become overly soft and mushy during cooking, losing its inherent elasticity and texture. However, if the total water content is too low, it may cause the rice to be too hard and difficult to chew and digest [45,46].
In this study, the free water peak area of the high-taste-value varieties (LJ433, JY653, LJ218) ranged from 80.65 to 132.95, which was 13.24% to 86.68% higher than that of CK (71.22). Considering the significant positive correlation between the taste value and free water, it is recommended that varieties with a free water peak area of greater than or equal to 80 are given priority in breeding. Subsequently, the specific threshold can be further quantified through multi-year and multi-point trials.

4.3. Effects of Different Chemical Components on Taste Quality

The chemical components in rice, such as amylose, protein, and soluble protein, play a crucial role in the formation of the taste quality [47]. An in-depth exploration of the relationships between these chemical components and the taste quality of rice is conducive to a better understanding of the underlying mechanisms of rice quality, providing a scientific basis for the production and improvement in rice [48,49].
Amylose is an important component of rice starch, and its content has a significant impact on the taste quality of rice [50]. From the experimental data, it can be seen that there was a significant negative correlation between the amylose content and the taste value of different rice varieties: the higher the amylose content was, the lower the taste value of rice was and the less ideal the texture and taste were. Rice with a higher content of amylose is characterized by relatively slower water absorption and expansion of starch particles during cooking, as well as a higher gelatinization temperature. When cooked, rice has a relatively hard texture, lacks softness and stickiness, and has a dry taste [51,52]. For example, the amylose content of the LY66 variety was the highest, reaching 195.21 mg/g, while its taste value was relatively low (only 77.67). A high content of amylose makes rice feel rough and not fine enough when chewed, which is inconducive to a pleasant eating experience. On the contrary, rice with a lower amylose content has starch particles that absorb water and expand more quickly, as well as a lower gelatinization temperature. The cooked rice is soft in texture, with good stickiness and a soft, glutinous, and sweet taste [53,54]. The amylose contents of LJ433, JY653, and LJ218 in group A were all lower than that in CK, and their taste values were also higher than that of CK. Among them, the amylose content in LJ433 was 3.76% lower than that in CK, and its taste value was 7.66% higher than that of CK. Its rice was found to have a soft and glutinous texture and moderate stickiness, making it more favorable for consumers. This is because the low content of amylose allows for the more thorough gelatinization of starch, forming a uniform and fine structure of rice and improving the taste quality. However, it is not necessarily the case that a lower content of amylose is better: if the amylose content is too low, the rice may be overly soft and mushy, lacking elasticity and affecting the taste [55]. Therefore, in the process of rice breeding and cultivation, it is necessary to control the amylose content within an appropriate range to achieve the best eating quality [56].
Protein is an important nutrient in rice. However, the effect of protein content on the taste quality of rice is rather complex and generally shows a significant negative correlation with taste value [57]. In rice with a relatively high protein content, proteins may interact with starch during the cooking process, affecting the gelatinization and expansion of starch. A high protein content can lead to an increase in the hardness of rice and a deterioration in its taste [58]. For example, the protein content of LX21 was the highest, reaching 78.29 mg/g, while its taste value was the lowest (only 70.33). A high protein content makes the rice feel dry and hard when chewed, lacking the desired soft and glutinous texture, and may also mask the original aroma of the rice, affecting its taste [59]. However, a low protein content is also not conducive to improved taste quality in rice. Protein is an important carrier of the flavor substances that constitute rice. Therefore, an appropriate amount of protein can provide rich flavors for rice. If the protein content is too low, the rice may appear insipid and lack a sense of layering [60]. The protein contents of rice in group A were relatively low, while the taste values were high. This might be because the protein contents were within a relatively appropriate range, which neither caused excessive interference to the gelatinization of starch nor caused a loss of flavor in the rice. In addition, the composition and structure of proteins also have an impact on the taste quality of rice. The changes in different types of proteins during the cooking process vary, and their impacts on the texture and taste of rice also differ [61]. Therefore, when studying the influence of protein content on the eating quality of rice, factors such as the composition and structure of protein also need to be considered.
Soluble protein is the part of protein that can dissolve in water, which is closely related to the taste quality of rice and is also significantly negatively correlated with its eating value. Rice with a relatively high content of soluble protein may have the soluble protein dissolve in the rice soup during cooking, resulting in a loss of flavor substances from the rice. Furthermore, an increase in soluble protein may change the texture of the rice, making its taste rougher [62]. For example, the soluble protein content in LX21 was the highest, reaching 8.25 mg/g, but its taste value was also the lowest. A high content of soluble protein causes rice soup to be rather cloudy after being cooked, resulting in a significant loss of flavor substances and affecting both the taste and texture. On the contrary, a lower content of soluble protein allows flavor substances in rice to be better retained, causing the rice have a more intense aroma and a better texture. The soluble protein contents in the rice varieties in group A were lower than that in CK, while their taste values were higher than that of CK. This might be due to their low soluble protein contents reducing the loss of flavor substances, enabling the rice to better retain its original aroma and texture characteristics during the cooking process. However, it is not the case that the lower the soluble protein is, the better. An appropriate amount of soluble protein can provide rice with a certain umami and sweetness, enhancing the flavor of the rice. If the soluble protein content is too low, the rice may lack rich flavor layers and taste monotonous.
Previous studies have focused on the influence of amylose and protein on palatability, while this study found that soluble protein was significantly negatively correlated with palatability values. Soluble proteins may cause the loss of flavor substances by dissolving in rice soup, which provides a new idea for optimizing processing techniques (such as shortening the rinsing time) to reduce the loss of soluble proteins.
This study did not analyze the impact of volatile substances (such as 2-acetylpyrroline) on taste value. In the future, the contribution of flavor substances can be analyzed in combination with metabolomics technology. In addition, this study did not take into account the impact of the post-harvest processing and storage conditions of rice on quality traits and taste value, which might be a concern for future research. Furthermore, the study is only based on single-year data. The impact of environmental factors (such as temperature and precipitation) on quality needs to be further verified through multi-year and multi-point tests.

5. Conclusions

This study systematically analyzed the effects of the appearance characteristics and internal chemical components of japonica rice varieties cultivated in northern China on their taste quality. The experimental results revealed that chalkiness characteristics—including the percentage of chalky grains, percentage of chalky grains (area ratio), percentage of chalky grains (LS/T 3247), and chalkiness degree—are significantly negatively correlated with the taste value, indicating that reducing the chalkiness degree can significantly improve the taste quality of rice. Although there were no direct and significant correlations between grain shape factors and taste value, the physical properties of rice may indirectly affect the cooking process and, thus, the palatability experience. Other appearance features—such as transparency and average area—although not significantly correlated with taste value, may have subtle impacts on taste quality under specific conditions.
The free water content was found to be significantly positively correlated with the taste value, indicating that an appropriate amount of free water (peak area greater than or equal to 80) helps starch granules to fully absorb water and expand, forming a uniform and fine rice structure. However, the bound water content showed no significant correlation with the taste value and mainly plays a role in maintaining the structure and function of rice cells. Among the chemical components, the contents of amylose, protein, and soluble protein were significantly negatively correlated with the taste value; in particular, high contents of these components will negatively affect the taste and flavor of rice. In conclusion, by breeding varieties with low chalkiness (chalkiness degree less than 1.5%) and appropriate amylose (135–150 mg/g) and protein (68–75 mg/g) contents and regulating the free water peak area greater than or equal to 80, the quality of the taste can be effectively improved. (Note: The values are based on the data of the high-taste-value varieties LJ433 and JY653 in this study.)
Future research will be carried out with the following aspects: conducting multi-year and multi-point experiments to verify the stability of the conclusions of this study; breeding high-quality japonica rice varieties with low chalkiness and appropriate amylose and protein contents and combining molecular mark-assisted selection (such as chalky-related QTL); and exploring the regulation techniques of free water content (such as water management during the grouting period) to enhance the taste quality. It should be noted that this study is based on single-year data; the influence of environmental factors needs to be further verified and the scope of the experiment will be expanded in the future to enhance the universality of the conclusion.

Author Contributions

Conceptualization, H.Y. and L.Z.; methodology, H.Y. and L.Z.; software, X.G. and S.H.; validation, X.G. and S.H.; formal analysis, L.W. and Z.M.; investigation, H.Y., L.Z., and L.W.; resources, L.Z., L.W., and Z.M.; data curation, H.Y.; writing—original draft preparation, H.Y. and L.Z.; writing—review and editing, L.Z. and L.W.; visualization, H.Y.; supervision, L.W.; project administration, H.Y. and L.Z.; funding acquisition, H.Y., Z.M., and L.W. All authors have read and agreed to the published version of the manuscript.

Funding

This research was funded by General Project of Basic Scientific Research Project of the Educational Department of Liaoning Province (JYTMS20231305); the “Xing Liao Talent Program” project of Liaoning Province (XLYC2403004); and the Doctoral Research Start-up Project of the President’s Fund of Liaoning Academy of Agricultural Sciences (2023BS0804).

Data Availability Statement

The original contributions presented in this study are included in the article. Further inquiries can be directed to the corresponding authors.

Conflicts of Interest

The authors declare that this research was conducted in the absence of any commercial or financial relationship that could be construed as potential conflicts of interest.

References

  1. Matsue, Y.; Moriwaki, C.; Abe, S.; Ito, S. Palatability characteristics of recent local-brand-rice cultivars. Plant Prod. Sci. 2024, 27, 38–45. [Google Scholar] [CrossRef]
  2. Amfo, B.; Abankwah, V.; Tanko, M. Consumer satisfaction with local rice attributes and willingness to pay for improvement by internal migrants and natives in urban Ghana. J. Agribus. Dev. Emerg. Econ. 2024, 14, 587–606. [Google Scholar] [CrossRef]
  3. Wang, L.; Zhang, L.; He, N.; Wang, C.; Zhang, Y.; Ma, Z.; Zheng, W.; Ma, D.; Wang, H.; Tang, Z. Effects of Planting Methods and Varieties on Rice Quality in Northern China. Foods 2025, 14, 1093. [Google Scholar] [CrossRef] [PubMed]
  4. Luo, Y.; Chen, Y.; Xue, P.; Wang, B.; Kang, Y.; Zhang, Y.; Chen, D.; Hong, Y.; Wu, W.; Liu, Q.; et al. Modulation of rice grain shape and appearance by the GS10-encoded long coiled-coil protein. Crop J. 2025, 13, 158–169. [Google Scholar] [CrossRef]
  5. He, C.; Deng, F.; Yuan, Y.; Huang, X.; He, Y.; Li, Q.; Li, B.; Wang, L.; Cheng, H.; Wang, T.; et al. Appearance, components, pasting, and thermal characteristics of chalky grains of rice varieties with varying protein content. Food Chem. 2024, 440, 138256. [Google Scholar] [CrossRef] [PubMed]
  6. Zheng, C.; Niu, S.; Yan, Y.; Zhou, G.; Peng, Y.; He, Y.; Zhou, J.; Li, Y.; Xie, X. Moderate Salinity Stress Affects Rice Quality by Influencing Expression of Amylose- and Protein-Content-Associated Genes. Int. J. Mol. Sci. 2024, 25, 4042. [Google Scholar] [CrossRef] [PubMed]
  7. Zhao, J.; Shao, J.; Zeng, Z.; Li, Z.; Sun, S.; Peng, L.; Huang, Z.; Wang, Z.; He, Y. Knocking out isopropyl malate synthase simultaneously improves grain appearance and nutritional quality in rice. Plant J. 2024, 120, 159–173. [Google Scholar] [CrossRef] [PubMed]
  8. Kashiwagi, T. Effects of rice grain protein QTL, TGP12, on grain composition, yield components, and eating quality with different nitrogen applications. Field Crops Res. 2021, 263, 108051. [Google Scholar] [CrossRef]
  9. Long, X.; Guan, C.; Wang, L.; Jia, L.; Xiangjin, F.; Lin, Q.; Huang, Z.; Liu, C. Rice Storage Proteins:Focus on Composition, Distribution, Genetic Improvement and Effects on Rice Quality. Rice Sci. 2023, 30, 207–221. [Google Scholar]
  10. Tu, B.; Zhang, T.; Liu, P.; Yang, W.; Zheng, L.; Dai, Y.; Wang, H.; Lin, S.; Zhang, Z.; Zheng, X.; et al. The LCG1-OsBP5/OsEBP89-Wx module regulates the grain chalkiness and taste quality in rice. Plant Biotechnol. J. 2024, 23, 36–50. [Google Scholar] [CrossRef] [PubMed]
  11. Wang, X. Principles and Techniques of Plant Physiology and Biochemistry Experiments; Higher Education Press: Beijing, China, 2006. [Google Scholar]
  12. Wang, S. Experimental Tutorial of Plant Physiology; Science Press: Beijing, China, 2017. [Google Scholar]
  13. Nahid, F.; Atefeh, S.; Adel, B.; Amin, A. Combinatorial Approaches to Image Processing and MGIDI for the Efficient Selection of Superior Rice Grain Quality Lines. Agriculture 2025, 15, 615. [Google Scholar] [CrossRef]
  14. Kiyosumi, H.; Matthew, S.; Kenta, M.; Keitaro, S.; Ken, I.; Noriyuki, K.; Koka, S.; Kosuke, O.; Yuji, K.; Kazuhiko, S.; et al. QTN detection and candidate gene identification for improved eating and cooking quality in rice using GWAS and PLS regression analysis. Theor. Appl. Genet. 2025, 138, 58. [Google Scholar] [CrossRef] [PubMed]
  15. Ling, L.; Wang, E.; Wang, K.; Cao, C.; Shi, S.; Jiang, Y. Nitrogen fertilization alters rice taste quality through layer-specific changes in protein and starch composition. J. Cereal Sci. 2025, 123, 104157. [Google Scholar] [CrossRef]
  16. Lian, K.; Guan, L.; Zhang, M.; Ye, G.; Li, S. Effect of Ultrasonic Treatment on Taste and Flavor Quality of Japonica Rice. Foods 2025, 14, 1627. [Google Scholar] [CrossRef] [PubMed]
  17. Bao, J.; Deng, B.; Zhang, L. Molecular and genetic bases of rice cooking and eating quality: An updated review. Cereal Chem. 2023, 100, 1220–1233. [Google Scholar] [CrossRef]
  18. Sarna, S.G.; Ahmad, E.; Kadaru, S.; Aminul Islam, A.K.M. Grain Appearance Quality of Parental and Segregating Populations of Aus Rice (Oryza sativa L.). Int. J. Plant Soil Sci. 2024, 36, 919–931. [Google Scholar] [CrossRef]
  19. Cui, Z.; Wang, X.; Dai, Y.; Li, Y.; Ban, Y.; Tian, W.; Zhang, X.; Feng, X.; Zhang, X.; Jia, L.; et al. Transcription factor OsNF-YC1 regulates grain size by coordinating the transcriptional activation of OsMADS1 in Oryza sativa L. Plant J. 2024, 119, 1465–1480. [Google Scholar] [CrossRef] [PubMed]
  20. McClung, A.; Chen, M.; Jodari, F.; Famoso, A.; Addison, C.; Linscombe, S.; Ottis, B.; Moldenhauer, K.; Walker, T.; Wilson, L.; et al. Use of objective imaging systems to assess subjective grain appearance traits important to the US rice industry. Cereal Chem. 2020, 97, 349–361. [Google Scholar] [CrossRef]
  21. Niaz, B.C.; Anil, K.N.C.; Harkamal, W.; Rajib, S. Transcriptome enhanced rice grain metabolic model identifies histidine level as a marker for grain chalkiness. Sci. Rep. 2025, 15, 16432. [Google Scholar] [CrossRef] [PubMed]
  22. Sailo, H.; Khiangte, L.; Ralte, L.; Singh, Y.T. Grain quality and physicochemical evaluation coupled with untargeted metabolic identification provide new insight into the upland pigmented rice of Manipur, India. LWT 2025, 216, 117236. [Google Scholar]
  23. Khaled, M.H.A.; Ahmed, M.S.; Germine, M.A.S.; Medhat, A.E.E.D.; Abdelsalam, M.M.; Diaa, A.E.M.; Aly, A.A.E.B.; Sobhi, F.L.; Ahmed, M.A. Comprehensive quality profiling and multivariate analysis of rice (Oryza sativa L.) cultivars: Integrating physical, cooking, nutritional, and micronutrient characteristics for enhanced varietal selection. BMC Plant Biol. 2025, 25, 492. [Google Scholar] [CrossRef] [PubMed]
  24. Kuna, S.; Deepak, G.; Abhinav, S.; Sagi, I.; Dharavath, N. Exploring Genetic Variability and Diversity in Advanced Breeding Lines of Rice for Yield-Attributing and Grain Quality Traits. J. Adv. Biol. Biotechnol. 2025, 28, 42–56. [Google Scholar] [CrossRef]
  25. Chen, L.; Li, X.; Zheng, M.; Hu, R.; Dong, J.; Zhou, L.; Liu, W.; Liu, D.; Yang, W. Genes controlling grain chalkiness in rice. Crop J. 2024, 12, 979–991. [Google Scholar] [CrossRef]
  26. Febina, M.; Deepa, J.; Maya, R. Physicochemical properties, eating and cooking quality and genetic variability: A comparative analysis in selected rice varieties of South India. Food Prod. Process. Nutr. 2023, 5, 49. [Google Scholar] [CrossRef]
  27. Mane, I.; Bassama, J.; Diedhiou, P.M.; Mestres, C. Ways to improve the quality of local rice in Africa: Comparison between physicochemical and sensory properties of rice consumed in Senegal. Nutr. Food Sci. 2024, 54, 1383–1395. [Google Scholar] [CrossRef]
  28. Rajesh, C.; Tuhin, S.R.; Jun, I.S. Influence of γ-Aminobutyric Acid (GABA) Application on Aromatic Rice Under Shading and Drought Stress Conditions: Effects on Crop Yield, Grain Quality, and 2-Acetyl-1-Pyrroline Biosynthesis. J. Plant Growth Regul. 2024, 44, 1043–1051. [Google Scholar]
  29. Ye, J.; Hu, Z.; Chen, Y.; Fu, D.; Zhang, J. Identification of broken rice rate based on grading and morphological classification. LWT 2025, 215, 117175. [Google Scholar] [CrossRef]
  30. Swasti, M.; Narpinder, S. Physicochemical, functional, pasting, and amino acid compositions of milled rice, and extrusion behavior of milled rice from basmati and nonbasmati varieties. Cereal Chem. 2024, 101, 1055–1070. [Google Scholar] [CrossRef]
  31. Chen, L.; Chen, W.; Li, J.; Wei, Y.; Qing, D.; Huang, J.; Yang, X.; Tang, M.; Zhang, Z.; Yu, J.; et al. Identifying Heat Adaptability QTLs and Candidate Genes for Grain Appearance Quality at the Flowering Stage in Rice. Rice 2025, 18, 13. [Google Scholar] [CrossRef] [PubMed]
  32. Gao, J.; Gao, L.; Chen, W.; Huang, J.; Qing, D.; Pan, Y.; Ma, C.; Wu, H.; Zhou, W.; Li, J.; et al. Genetic Effects of Grain Quality Enhancement in Indica Hybrid Rice: Insights for Molecular Design Breeding. Rice 2024, 17, 39. [Google Scholar] [CrossRef] [PubMed]
  33. Hitomi, W.; Takahiro, T.; Yasushi, I.; Motoki, N.; Mototaka, S.; Naoya, S.; Kosuke, A.; David, M.; Toshihiro, H. Effectiveness of heat tolerance rice cultivars in preserving grain appearance quality under high temperatures in Japan–A meta-analysis. Field Crops Res. 2024, 310, 109303. [Google Scholar]
  34. Muhammad, I.; Nadeem, A.; Usman, Z.; Nauman, A.; Mumtaz, A.; Shakeel, A.A.; Muhammad, F. Influence of water management techniques on milling recovery, grain quality and mercury uptake in different rice production systems. Agric. Water Manag. 2021, 243, 106500. [Google Scholar] [CrossRef]
  35. Li, Y.; Hu, L.; Zhang, Y.; Wang, P.; Han, Y.; Li, D. Effect of magnetic field treatment on the texture of cooked rice subjected to freeze-thaw cycles: Changes in water phase transition, starch retro gradation, and rice grain structure. Int. J. Biol. Macromol. 2025, 311, 143670. [Google Scholar] [CrossRef] [PubMed]
  36. El-Mesery, H.S.; Omran, A.A.; Adelusi, O.A.; Kaveh, M.; Okechukwu, V.O.; Hu, Z.; Salem, A.; Badawy, S.A. Evaluating and predicting the impact of storage conditions and packaging materials on the physical properties of paddy rice using machine learning approaches and artificial neural networks. J. Stored Prod. Res. 2025, 112, 102659. [Google Scholar] [CrossRef]
  37. Zhao, Y.; Li, L.; Li, Y.; Zhao, Y. Effect of Low Temperature and Nitrogen Modified Atmosphere Treatments on the Storage of High Moisture Indica Rice: Quality, Microstructure, and Metabolome Characteristics. Foods 2025, 14, 1262. [Google Scholar] [CrossRef] [PubMed]
  38. Talla, A.; Swain, D.K.; Srivastava, R.K.; Tewari, V.K.; Sanju, P. Integrating Climatic Factors and Agronomic Management for Optimal Hybrid Rice Yield and Quality. Commun. Soil Sci. Plant Anal. 2025, 56, 1044–1059. [Google Scholar] [CrossRef]
  39. Cecil, T.; Martha, H.; Kunda, K.; Benisiu, T. Consumption Preference and Willingness to Pay for Locally Produced Rice in Namibia: Implications for Upscaling Production. J. Agribus. Rural. Dev. 2025, 75, 1–16. [Google Scholar] [CrossRef]
  40. Kotte, H.S.T.D.; Yasutaka, N.; Via, A.C.M.; Hiroshi, E.; Yoshiaki, I.; Mana, K.N. Rice Yield and Grain Quality under Fluctuating Soil Moisture Stress. Agronomy 2024, 14, 1926. [Google Scholar] [CrossRef]
  41. Koustava, K.P.; Satpal, S.B.; Rojita, M.; Parmeshwar, K.S.; Amrita, K.P.; Roshan, S. Nutritional analysis of rice landraces from southern Odisha, India. Food Sci. Nutr. 2023, 12, 227–238. [Google Scholar] [CrossRef] [PubMed]
  42. Violina, B.; Suneetha, Y.; Srinivas, T.; Bhargavi, B.; Divya, K.; Neeraja, N.C.; Jyothi, B.; Raman, M.S.; Aravind, K.J. Mapping Genomic Regions for Grain Protein Content and Quality Traits in Milled Rice (Oryza sativa L.). Plants 2025, 14, 905. [Google Scholar] [CrossRef] [PubMed]
  43. Díaz, E.O.; Iino, H.; Koyama, K.; Kawamura, S.; Koseki, S.; Lyu, S. Non-destructive quality classification of rice taste properties based on near-infrared spectroscopy and machine learning algorithms. Food Chem. 2023, 429, 136907. [Google Scholar] [CrossRef] [PubMed]
  44. Ma, Z.; Gao, M.; Cheng, H.; Song, W.; Lu, L.; Lu, W. Differences in rice component distribution across layers and their relationship with taste. J. Sci. Food Agric. 2024, 104, 1824–1832. [Google Scholar] [CrossRef] [PubMed]
  45. Tadamasa, U.; Yojiro, T.; Shunsuke, A.; Matthew, S.; Kiyosumi, H.; Junichi, T. Gene Pyramiding Strategies for Sink Size and Source Capacity for High-Yield Japonica Rice Breeding. Rice 2025, 18, 6. [Google Scholar] [CrossRef] [PubMed]
  46. Supriya, S.; Rakesh, S.; Avantika, M.; Vikas, K.S.; Uma, M.S.; Arvind, K.; Gyanendra, P.S. Multi-model genome-wide association studies for appearance quality in rice. Front. Plant Sci. 2024, 14, 1304388. [Google Scholar]
  47. Chen, G.; Li, C.; Hu, M.; He, X.; Yang, H.; Zhang, Q.; Wu, C.; Duan, Q.; Peng, L.; Zhang, Y.; et al. Evaluating rice lipid content, yield, and quality in response to nitrogen application rate and planting density. Front. Plant Sci. 2024, 15, 1469264. [Google Scholar] [CrossRef] [PubMed]
  48. Nakano, H.; Tanaka, R.; Guan, S.; Okami, M.; Wada, H.; Hakata, M.; Ohdan, H. Identification of growth-related indicators affecting the appearance and protein content of rice grains. Agron. J. 2022, 114, 565–581. [Google Scholar] [CrossRef]
  49. Veni, B.K.; Raja, D.S.; Tushara, M.; Suneetha, Y.; Mrudhula, K.A. Nutritional and cooking quality superiority of black rice genotype BPT 2841 with enhanced lysine content. Sci. Rep. 2025, 15, 16629. [Google Scholar] [CrossRef] [PubMed]
  50. Wang, J.; Zhang, X.; Xiao, Y.; Chen, H.; Wang, X.; Hu, Y. Effect of nitrogen fertilizer on the quality traits of Indica rice with different amylose contents. J. Sci. Food Agric. 2024, 104, 8492–8499. [Google Scholar] [CrossRef] [PubMed]
  51. Ansah, B.O.; Chen, G.; Xiong, F.; Wu, Y. Endosperm starch in rice: What influences its structure, properties, and biosynthesis. Acta Physiol. Plant. 2023, 45, 121. [Google Scholar] [CrossRef]
  52. Prinya, W.; Visaka, A.; Phunsiri, S.; Sutthiwal, S.; Matchima, N.; Saroat, R.; Kalidas, S. Nutritional quality, volatile organic compounds and element compositions of indigenous upland rice. J. Food Compos. Anal. 2025, 142, 107517. [Google Scholar] [CrossRef]
  53. Dan, Y.; Huang, F.; Xu, J.; He, Y.; Peng, R.; Li, C.; Song, J.; Hao, Y.; Tian, Z. A Novel Allelic Variant of OsAGPL2 Influences Rice Eating and Cooking Quality. Cells 2025, 14, 634. [Google Scholar] [CrossRef] [PubMed]
  54. Dong, W.; Zhang, Y.; Danso, F.; Zhang, J.; Tang, A.; Liu, Y.; Liu, K.; Meng, Y.; Wang, L.; Yang, Z.; et al. Nitrogen Fertilizer Reduction at Different Rice Growth Stages and Increased Density Improve Rice Yield and Quality in Northeast China. Agriculture 2025, 15, 892. [Google Scholar] [CrossRef]
  55. Kamini, G.P.; Madhusudan, G.L. Detection of amylose content in rice samples with spectral augmentation and advanced machine learning. J. Food Compos. Anal. 2025, 142, 107455. [Google Scholar] [CrossRef]
  56. Fan, P.; Zhu, Y.; Xu, J.; Hu, Q.; Zhang, H.; Wei, H.; Liu, G. Relationships between the appearance quality and starch structure of soft rice under different nitrogen levels. Food Energy Secur. 2024, 13, e574. [Google Scholar] [CrossRef]
  57. Zhang, L.; Ma, Z.; He, N.; Tang, Z.; Wang, C.; Zheng, W.; Wang, H.; Sui, G.; Gao, H.; Wang, L. Lodging Resistance of Japonica Hybrid Rice Plants Studied in Relation to Mechanical and Physicochemical Characteristics. Agronomy 2025, 15, 699. [Google Scholar] [CrossRef]
  58. Sajjad, A.; Xin, O.; Songpo, D.; Zaid, K.; Hong, S. Co-application of zinc and oligosaccharides enhances zinc bioavailability, yield and nutritional quality of rice. Plant Physiol. Biochem. 2025, 224, 109964. [Google Scholar] [CrossRef] [PubMed]
  59. Yu, X.; Zhang, Y.; Zhu, Z.; Zhao, L.; Chen, T.; Zhao, Q.; Zhou, L.; Yao, S.; Zhao, C.; Wang, C. Correlation Analyses of Amylose Contents and Srarch RVA Profiles of New Rice Varieties (Lines) Carrying Wx-mq Gene. Acta Agric. Bor. Sin. 2013, 28, 53–58. [Google Scholar]
  60. Yao, D.; Qu, C.; Li, Y.; Shen, H.; Li, G.; Meng, F.; Huang, X.; Bai, B. Analysis on Taste Quality and Physicochemical Properties of Black Rice with Similar Apparent Amylose Content. Starch-Stärke 2025, 77, e70004. [Google Scholar] [CrossRef]
  61. Chang, Q.; Zheng, B.D.; Zhang, Y.; Zeng, H.L. A comprehensive review of the factors influencing the formation of retrograded starch. Int. J. Biol. Macromol. 2021, 186, 163–173. [Google Scholar] [CrossRef] [PubMed]
  62. Zheng, L.; San, Y.; Xing, Y.; Joe, M.R. Rice proteins: A review of their extraction, modification techniques and applications. Int. J. Biol. Macromol. 2024, 268, 131705. [Google Scholar] [CrossRef] [PubMed]
Figure 1. Appearance characteristics of different rice varieties.
Agronomy 15 01757 g001
Figure 2. Transverse relaxation inversion spectra obtained via nuclear magnetic resonance.
Agronomy 15 01757 g002
Figure 3. Comparison of the taste value and free water content. Note: The deviation bars represent standard errors of the means. Means with different small alphabetical letters indicate significant differences among the taste values of different rice varieties (according to the least significant difference test and at the 95% level of confidence).
Agronomy 15 01757 g003
Figure 4. Comparison of taste value and chemical components. Note: The deviation bars represent standard errors of the means. Means with different small alphabetical letters indicate significant differences among the taste values and chemical component contents in different rice varieties (according to the least significant difference test and at the 95% level of confidence).
Agronomy 15 01757 g004
Table 1. Appearance characteristics of different varieties of rice (including broken rice).
VarietyMean Area/mm2Mean Perimeter/mmMean Length/mmMean Width/mmMean Diameter/mmMean Roundness
LJ43310.38 ± 0.32c12.77 ± 0.18 d4.84 ± 0.11 c2.62 ± 0.07 a3.63 ± 0.12 b0.56 ± 0.03 b
JY65310.34 ± 0.41 c13.52 ± 0.25 a5.45 ± 0.14 a2.25 ± 0.09 c3.62 ± 0.15 b0.43 ± 0.04 c
LJ2189.95 ± 0.28 d12.44 ± 0.15 f4.69 ± 0.09 d2.65 ± 0.06 a3.55 ± 0.10 c0.59 ± 0.02 a
CK10.42 ± 0.35 b12.89 ± 0.20 c4.93 ± 0.12 b2.63 ± 0.08 a3.64 ± 0.13 b0.56 ± 0.03 b
LJ1779.72 ± 0.25 e12.33 ± 0.17 g4.67 ± 0.10 d2.58 ± 0.05 b3.51 ± 0.11 c0.57 ± 0.03 b
LY6610.39 ± 0.30 c12.69 ± 0.19 e4.80 ± 0.11 c2.62 ± 0.07 a3.63 ± 0.12 b0.57 ± 0.02 b
LX2110.69 ± 0.38 a12.99 ± 0.22 b4.92 ± 0.13 b2.65 ± 0.08 a3.68 ± 0.14 a0.56 ± 0.03 b
Note: within columns, means followed by different small alphabetical letters indicate significant differences among the varieties (according to the least significant difference test and at the 95% level of confidence).
Table 2. Appearance characteristics of head rice of different varieties.
VarietyGrain Shape (LS/T 6116)Mean Area/mm2Mean Perimeter/mmMean Length/mmMean Width/mmMean RoundnessHead Rice Rate/%
LJ433medium–short10.59 ± 0.35 b12.93 ± 0.25 d4.92 ± 0.08 c2.62 ± 0.05 a0.55 ± 0.03 a96.04 ± 1.20 b
JY653medium–long10.49 ± 0.40 c13.66 ± 0.30 a5.54 ± 0.10 a2.24 ± 0.07 c0.42 ± 0.02 b96.09 ± 1.53 b
LJ218medium–short10.22 ± 0.30 d12.66 ± 0.20 e4.81 ± 0.07 d2.65 ± 0.06 a0.56 ± 0.02 a93.63 ± 1.81 d
CKmedium–short10.63 ± 0.38 b13.05 ± 0.28 c5.03 ± 0.09 b2.63 ± 0.04 a0.54 ± 0.03 a95.79 ± 1.36 c
LJ177medium–short9.90 ± 0.25 e12.48 ± 0.18 f4.75 ± 0.06 e2.58 ± 0.05 b0.56 ± 0.02 a95.54 ± 1.42 c
LY66medium–short10.66 ± 0.32 b12.90 ± 0.28 d4.91 ± 0.07 c2.61 ± 0.04 a0.55 ± 0.03 a94.71 ± 1.61 d
LX21medium–short10.91 ± 0.42 a13.16 ± 0.26 b5.01 ± 0.08 b2.66 ± 0.05 a0.55 ± 0.03 a96.53 ± 1.18 a
Note: within columns, means followed by different small alphabetical letters indicate significant differences among the varieties (according to the least significant difference test and at the 95% level of confidence).
Table 3. Chalkiness characteristics of different rice varieties.
VarietyTransparencyPercentage of Chalky Grains/%Percentage of Chalky Grains (Area Ratio)/%Percentage of Chalky Grains (LS/T 3247)/%Chalkiness Degree/%
LJ43322.27 ± 0.51 g2.21 ± 0.45 f0.00 ± 0.00 g0.48 ± 0.11 g
JY65328.33 ± 1.20 e7.80 ± 1.10 d2.00 ± 0.50 e2.91 ± 0.62 e
LJ21826.69 ± 1.05 f5.96 ± 0.92 e0.84 ± 0.33 f1.47 ± 0.35 f
CK212.78 ± 1.80 d11.53 ± 1.63 c2.24 ± 0.61 d3.55 ± 0.75 d
LJ177214.05 ± 2.02 c13.74 ± 1.93 b2.97 ± 0.70 b4.43 ± 0.90 c
LY66216.51 ± 2.31 a16.52 ± 2.20 a2.36 ± 0.65 c4.74 ± 1.01 b
LX21215.12 ± 2.15 b13.71 ± 1.85 b4.47 ± 1.15 a5.06 ± 1.10 a
Note: within columns, means followed by different small alphabetical letters indicate significant differences among the varieties (according to the least significant difference test and at the 95% level of confidence).
Table 4. Amplitudes of nuclear magnetic resonance signals of different rice varieties.
VarietyTaste Value/ScoreMass (50 Grains)/gPeak Area of Total Water/APeak Area of Bound Water/A21Peak Area of Free Water/A22
LJ43389.00 ± 1.50 a0.99 ± 0.02 b8006.87 ± 210.56 c7926.23 ± 195.51 c80.65 ± 10.33 c
JY65385.33 ± 1.20 b0.92 ± 0.01 d6861.31 ± 183.45 g6728.36 ± 175.42 g132.95 ± 15.28 a
LJ21884.33 ± 1.30 b1.02 ± 0.03 a8423.68 ± 220.15 b8333.82 ± 210.38 b89.95 ± 12.55 b
CK82.67 ± 1.40 c0.91 ± 0.01 d7941.12 ± 190.42 d7869.9 ± 185.27 d71.22 ± 9.39 d
LJ17780.67 ± 1.10 d0.92 ± 0.01 d7527.16 ± 171.23 f7482.6 ± 165.39 f44.58 ± 8.43 f
LY6677.67 ± 1.00 e1.01 ± 0.02 a8679.81 ± 195.36 a8636.13 ± 241.41 a43.68 ± 7.28 f
LX2170.33 ± 1.20 f0.95 ± 0.01 c7815.55 ± 185.82 e7767.08 ± 183.76 e48.47 ± 8.37 e
Note: within columns, means followed by different small alphabetical letters indicate significant differences among the varieties (according to the least significant difference test and at the 95% level of confidence).
Table 5. Chemical composition of different rice varieties.
VarietyTaste Value/ScoreAmylose (mg/g)Protein (mg/g)Soluble Protein (mg/g)
LJ43389.00 ± 1.50 a148.55 ± 5.23 e68.71 ± 2.81 g6.41 ± 0.45 e
JY65385.33 ± 1.20 b141.17 ± 4.81 f73.52 ± 3.02 f6.16 ± 0.42 f
LJ21884.33 ± 1.30 b135.23 ± 4.32 g74.22 ± 3.15 e6.79 ± 0.53 d
CK82.67 ± 1.40 c154.35 ± 5.56 d75.18 ± 3.23 d7.38 ± 0.55 c
LJ17780.67 ± 1.10 d162.02 ± 6.52 c76.33 ± 3.35 c7.45 ± 0.62 b
LY6677.67 ± 1.00 e195.21 ± 7.05 a78.62 ± 3.52 b7.46 ± 0.65 b
LX2170.33 ± 1.20 f177.38 ± 6.82 b78.29 ± 3.64 a8.25 ± 0.71 a
Note: within columns, means followed by different small alphabetical letters indicate significant differences among the varieties (according to the least significant difference test and at the 95% level of confidence).
Table 6. Correlation between quality-related traits and taste values.
Quality-Related TraitsCorrelation CoefficientQuality-Related TraitsCorrelation Coefficient
Appearance characteristics (including broken rice)Mean area0.29Chalkiness characteristicsTransparency0.51
Mean perimeter0.36Percentage of chalky grains−0.88 *
Mean length0.42Percentage of chalky grains (area ratio)−0.86 *
Mean width0.35Percentage of chalky grains (LS/T 3247)−0.83 *
Mean diameter0.46Chalkiness degree−0.85 *
Mean roundness0.52Amplitudes of nuclear magnetic resonance signalsMass (50 grains)0.59
Appearance characteristics of head riceMean area0.31Peak area of total water0.52
Mean perimeter0.42Peak area of bound water0.46
Mean length0.49Peak area of free water0.85 *
Mean width0.43Chemical compositionAmylose−0.82 *
Mean roundness0.52Protein−0.81 *
Head rice rate0.55Soluble Protein−0.83 *
Note: * indicates significant correlation at p < 0.05 level.
Disclaimer/Publisher’s Note: The statements, opinions and data contained in all publications are solely those of the individual author(s) and contributor(s) and not of MDPI and/or the editor(s). MDPI and/or the editor(s) disclaim responsibility for any injury to people or property resulting from any ideas, methods, instructions or products referred to in the content.

