Article

Legume–Non-Legume Cover Crop Mixtures Enhance Soil Nutrient Availability and Physical Properties: A Meta-Analysis Across Chinese Agroecosystems

1
State Key Laboratory of North China Crop Improvement and Regulation/Key Laboratory of North China Water-Saving Agriculture, Ministry of Agriculture and Rural Affairs/Key Laboratory of Crop Growth Regulation of Hebei Province, College of Agronomy, Hebei Agricultural University, Baoding 071001, China
2
College of Plant Protection, Hebei Agricultural University, Baoding 071001, China
*
Author to whom correspondence should be addressed.
These authors contributed equally to this work and share first authorship.
Agronomy 2025, 15(8), 1756; https://doi.org/10.3390/agronomy15081756
Submission received: 19 June 2025 / Revised: 11 July 2025 / Accepted: 20 July 2025 / Published: 22 July 2025
(This article belongs to the Section Innovative Cropping Systems)

Abstract

Cover cropping has emerged as a pivotal sustainable agronomic practice aimed at enhancing soil health and sustaining crop productivity. To quantify its effects across diverse agroecosystems, we conducted a meta-analysis of 1877 paired observations from 114 studies (1980–2025) comparing cover cropping with bare fallow during fallow periods in major cereal systems across China. Cover cropping significantly reduced soil bulk density by 6.1% and increased key soil nutrients including total nitrogen (+13.1%), total phosphorus (+15.6%), hydrolysable nitrogen (+9.3%), available phosphorus (+11.1%), available potassium (+12.4%), soil organic matter (+11.7%), and microbial biomass carbon (+41.1%). Leguminous cover crops outperformed non-legumes in enhancing nitrogen availability, reflecting biological nitrogen fixation. Mixed-species cover crop mixtures showed superior benefits over monocultures, likely due to complementary effects on nutrient cycling and soil structure. Soil texture and initial soil organic carbon significantly moderated these outcomes. Furthermore, although overall soil pH remained stable, cover cropping exhibited a clear buffering effect, tending to regulate soil pH toward neutrality. Meta-regression analyses revealed a diminishing positive effect on total nitrogen (TN), available potassium (AK), and microbial biomass carbon (MBC) with an extended duration of cover cropping, suggesting potential saturation effects. These results underscore the context-dependent efficacy of cover cropping as a strategy for soil quality enhancement. Optimizing cover crop implementation should integrate the consideration of inherent soil characteristics, baseline fertility, and species composition to maximize agroecosystem resilience and sustainability.

1. Introduction

The growing global demand for food, coupled with accelerating arable land degradation, presents a formidable challenge to achieving sustainable agricultural production [1]. In China, this challenge is further exacerbated by decades of intensive cropping, monoculture practices, and the excessive use of chemical fertilizers and pesticides. These unsustainable inputs have led to declining soil fertility, the degradation of soil structure, the loss of microbial diversity, and reduced ecosystem resilience, ultimately threatening long-term crop productivity [2,3]. Although bare fallow has traditionally been adopted to allow land to recover, this practice often results in the underutilization of critical natural resources—such as sunlight, rainfall, and nutrients—and may intensify problems such as topsoil erosion, the depletion of organic matter, and even desertification, particularly in ecologically fragile zones [4].
Cover cropping—the practice of cultivating non-cash or service crops during fallow periods—has emerged as a promising strategy for improving soil health and promoting sustainable intensification [5,6,7,8]. A growing body of research indicates that cover crops can enhance soil physical properties (e.g., reducing soil bulk density), enrich nutrient pools (e.g., increasing nitrogen and phosphorus availability), build soil organic carbon, and stimulate microbial biomass and activity [9,10,11,12]. In addition, cover crops contribute to erosion control, weed suppression, and improved nutrient-use efficiency, thereby reducing reliance on synthetic inputs [13]. These benefits align well with ecological intensification goals, especially under the dual pressures of climate change and resource constraints.
Meta-analyses such as He et al. (2025) in global agroecosystems and McDaniel et al. (2014) in temperate systems have demonstrated the significant benefits of cover crop mixtures in enhancing soil structure and nitrogen retention [14,15]. However, these studies have also emphasized substantial context dependency driven by factors such as climate, soil properties, and management practices, highlighting the critical need for region-specific evaluations. In China, empirical findings on cover cropping remain inconclusive due to considerable variability in cover crop species (e.g., leguminous versus non-leguminous), climatic and edaphic conditions, management regimes, and baseline soil characteristics. While some studies have reported substantial improvements in soil structure and fertility associated with cover cropping, others have observed neutral or even adverse effects [16,17]. This pronounced heterogeneity underscores the necessity of a comprehensive, quantitative synthesis of existing data to better elucidate the context-dependent impacts of cover cropping.
Although the benefits of cover cropping for soil improvement are widely acknowledged, the current evidence remains fragmented due to site-specific studies, limited experimental durations, and inconsistent methodologies. These issues hinder the development of broadly applicable soil management strategies in China [10,18,19]. Moreover, the moderating roles of the cover crop type, soil texture, and baseline soil fertility on soil physicochemical responses have not been systematically quantified at the national scale. To address these gaps, our analysis synthesizes a diverse dataset, allowing for a more comprehensive and statistically robust assessment of how key agronomic and edaphic factors shape soil responses to cover cropping. The novelty of this study lay in its national-scale synthesis of context-dependent effects, offering mechanistic insights into how cover crop species composition, soil texture, and initial fertility interact to influence soil health outcomes. We tested three hypotheses: (1) cover cropping significantly improves soil physical and chemical properties compared to bare fallow; (2) the magnitude of these effects depends on species composition, soil texture, and initial SOC levels; (3) legume–non-legume mixtures outperform monocultures due to functional complementarity in nutrient use and residue quality.

2. Materials and Methods

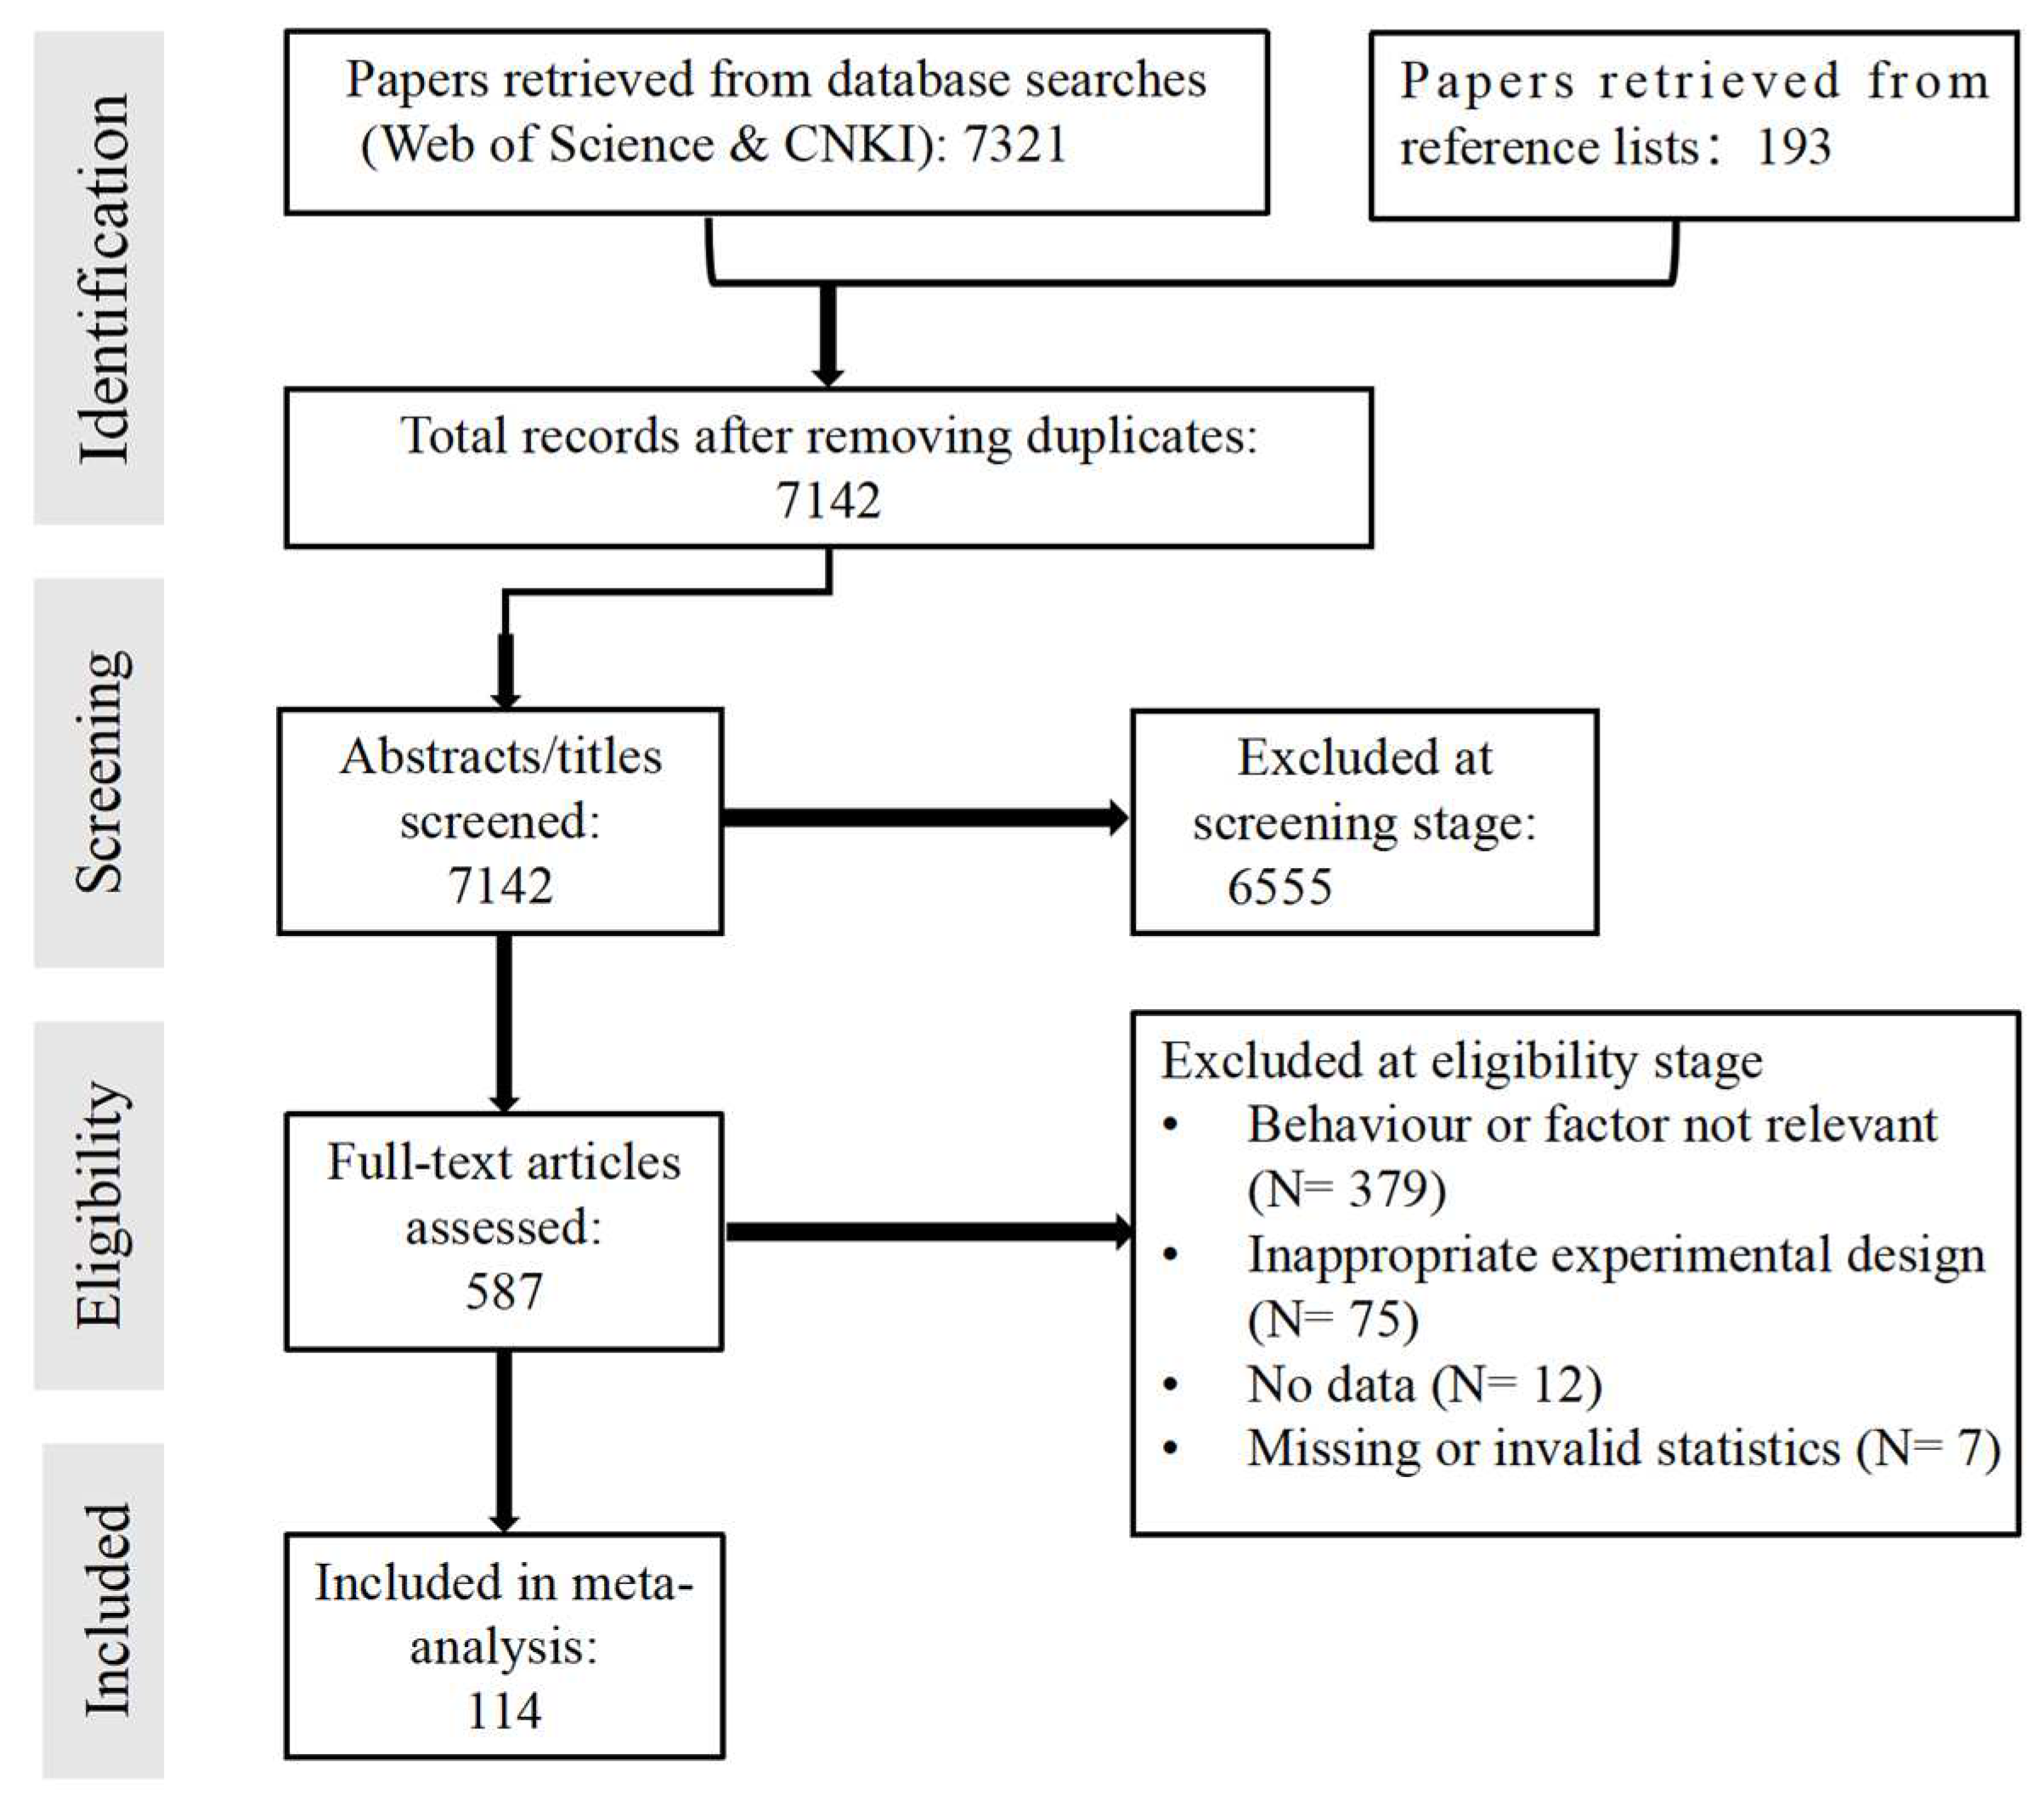
2.1. Literature Search and Data Compilation

A systematic literature search was conducted to identify peer-reviewed publications evaluating the effects of cover cropping on soil physicochemical properties. Literature retrieval was conducted from 1980 to April 2025 using the Web of Science, China National Knowledge Infrastructure (CNKI), VIP Database, and Wanfang Data, employing combinations of the following keywords: “cover crop”, “green manure”, “catch crop”, and “China”. The search encompassed title, abstract, and keywords fields using Boolean syntax (e.g., TI = (“cover crop”) OR AB = (“green manure”)). Studies were included based on the following criteria: (1) field experiments involving major grain crops such as wheat, rice, or maize; (2) inclusion of a bare fallow treatment as control, with at least one treatment involving a cover crop, green manure, or idle-season crop; (3) provision of at least one soil physicochemical parameter, including soil bulk density (SBD), pH, soil organic matter (SOM), total nitrogen (TN), hydrolyzable nitrogen (AN), total phosphorus (TP), available phosphorus (AP), available potassium (AK), and microbial biomass carbon (MBC); and (4) report of treatment replication.
Studies were excluded if they (1) involved pot or laboratory experiments, (2) did not report a proper control treatment, or (3) confounded the effect of cover crops with other management interventions (e.g., fertilizer, irrigation) without isolating the effect of cover cropping.
After screening, a total of 114 eligible peer-reviewed publications were selected. From these studies, a dataset of 1877 observations was compiled. Extracted variables included SBD, pH, SOM, TN, AN, TP, AP, AK, and MBC, as well as metadata such as cover crop species, duration of cover crop application, initial soil organic carbon (SOC), initial pH, and rates of nitrogen, phosphorus, and potassium fertilizer application. Data presented only in graphical form were digitized using WebPlotDigitizer software (version 3.4). Outliers were removed from the dataset prior to analysis. The study inclusion process is illustrated using a PRISMA diagram (Figure 1) and the geographic distribution of included study sites (96 locations) is shown in Figure 2.

2.2. Dataset Characteristics

The most frequently studied cover crops included Chinese milk vetch (Astragalus sinicus L.), soybean (Glycine max L.), rapeseed (Brassica napus L.), Chinese violet cress (Orychophragmus violaceus (L.) O.E. Schulz), annual ryegrass (Lolium multiflorum Lam.), alfalfa (Medicago sativa L.), faba bean (Vicia faba L.), and hairy vetch (Vicia villosa Roth), as well as mixed-species combinations such as Chinese milk vetch with annual ryegrass and Chinese milk vetch with rapeseed. Based on botanical classification and species richness, the cover crop treatments were categorized into three groups: legume cover crops, non-legume cover crops, and mixed-species cover crops. Cover crops were typically sown following the harvest of the preceding crop and returned to the soil one to two weeks before sowing the next season’s crop. The cover crop growth period varied according to the length of the fallow interval, most commonly ranging from one to three months. In the majority of cases, cover crops were terminated at the flowering stage and returned to the soil through incorporation or mulching rather than being removed from the field.
Soil characteristics were stratified by texture (coarse: sand, sandy loam; medium: loam, silt loam; fine: sandy clay, sandy clay loam, clay loam, silty clay, silty clay loam, clay) [20], initial SOC (<10, 10–15, >15 g kg−1), and initial pH (<6, 6–8, >8). Classification thresholds were based on breakpoint values reported by Zheng et al. [21]. Soil measurements were collected after cover crop incorporation and prior to the sowing of the subsequent crop, predominantly from the plow layer.

2.3. Meta-Analysis Procedure

To quantitatively assess the impacts of cover cropping on soil physicochemical properties, we employed a natural logarithmic response ratio (lnR), which is widely adopted in ecological and agricultural meta-analyses, as the effect size metric:
l n R = ln X t / X c
Here, Xt and Xc denote the means of the treatment (cover crop) and control (bare fallow) groups, respectively.
The variance (v) of lnR for each observation was calculated as follows:
v = SD t 2 / n t X t 2   +   S D c 2 / n c X c 2
Here, SDt, SDc, nt, and nc represent the standard deviations and replicate numbers of the treatment and control groups, respectively.
The weighted effect sizes (lnR++) were determined by the following equation:
l n R + + = ( l n R i   W i ) /   ( W i )
Here, lnRi is the effect size of the i-th comparison and Wi is the corresponding weight, defined as follows:
W i = 1 / ( v i + τ 2
Here, vi denotes the sampling variance of lnRi, and τ2 is the between-study variance, estimated using the restricted maximum likelihood (REML) method in the rma.mv function of the R package “metafor” (version 4.5.1), implemented in R version 4.5.1.
The standard error of the weighted mean and its 95% confidence interval (CI) were calculated as follows:
S l n R + + = 1 / W i
95% CI = lnR++ ± 1.96 SlnR++
For studies that did not report standard deviations (SDs), the impute_SD function in the ‘metagear’ package (R version 4.5.1) was employed to impute missing values [22]. To account for the non-independence of effect sizes arising from shared control groups, a variance–covariance matrix was constructed following the method of Lajeunesse [23].
A random-effects model was employed; this modeled variance at the study level, treatment level, and sampling error level. Parameter estimation was conducted using restricted maximum likelihood (REML). The ‘rma’ function in the ‘metafor’ package (R version 4.5.1) was used to estimate the weighted effect sizes (lnR++) and their 95% confidence intervals (CIs). An effect was deemed statistically significant if the CI did not overlap with zero. Between-group differences were considered significant if the respective CIs did not overlap [24]. Heterogeneity among studies was assessed using the Q statistic (Qt), with significance indicating variation in effect sizes potentially attributable to moderator variables [25]. Subgroup analyses were conducted for categorical moderators with at least ten observations or at least five observations from two or more independent studies [26]. We conducted meta-regressions using the “rma()” function with the restricted maximum-likelihood estimator REML in the “metafor” package (R version 4.5.1) to investigate how duration of cover crop application, and rates of nitrogen, phosphorus, and potassium fertilizer application, related to effect size [27].
To enhance interpretability, effect sizes were transformed into percentage changes using the following equation:
P e r c e n t   c h a n g e = e x p l n R 1   100 %

2.4. Model Diagnostics

The normality of effect size distributions was assessed using quantile–quantile (Q–Q) plots. As shown in Figure S2, the plotted points aligned closely with the 1:1 line, indicating an approximately normal distribution of lnR values and supporting the suitability of parametric meta-analysis models.
Publication bias was evaluated using Rosenthal’s fail-safe number. For each soil indicator, the calculated fail-safe number exceeded the threshold of 5k + 10, where k was the number of effect sizes (Table S1), suggesting that a substantial number of unpublished null-result studies would be required to overturn the significance of our findings. These results confirmed that the meta-analysis outcomes were robust and not substantially affected by potential publication bias.

3. Results

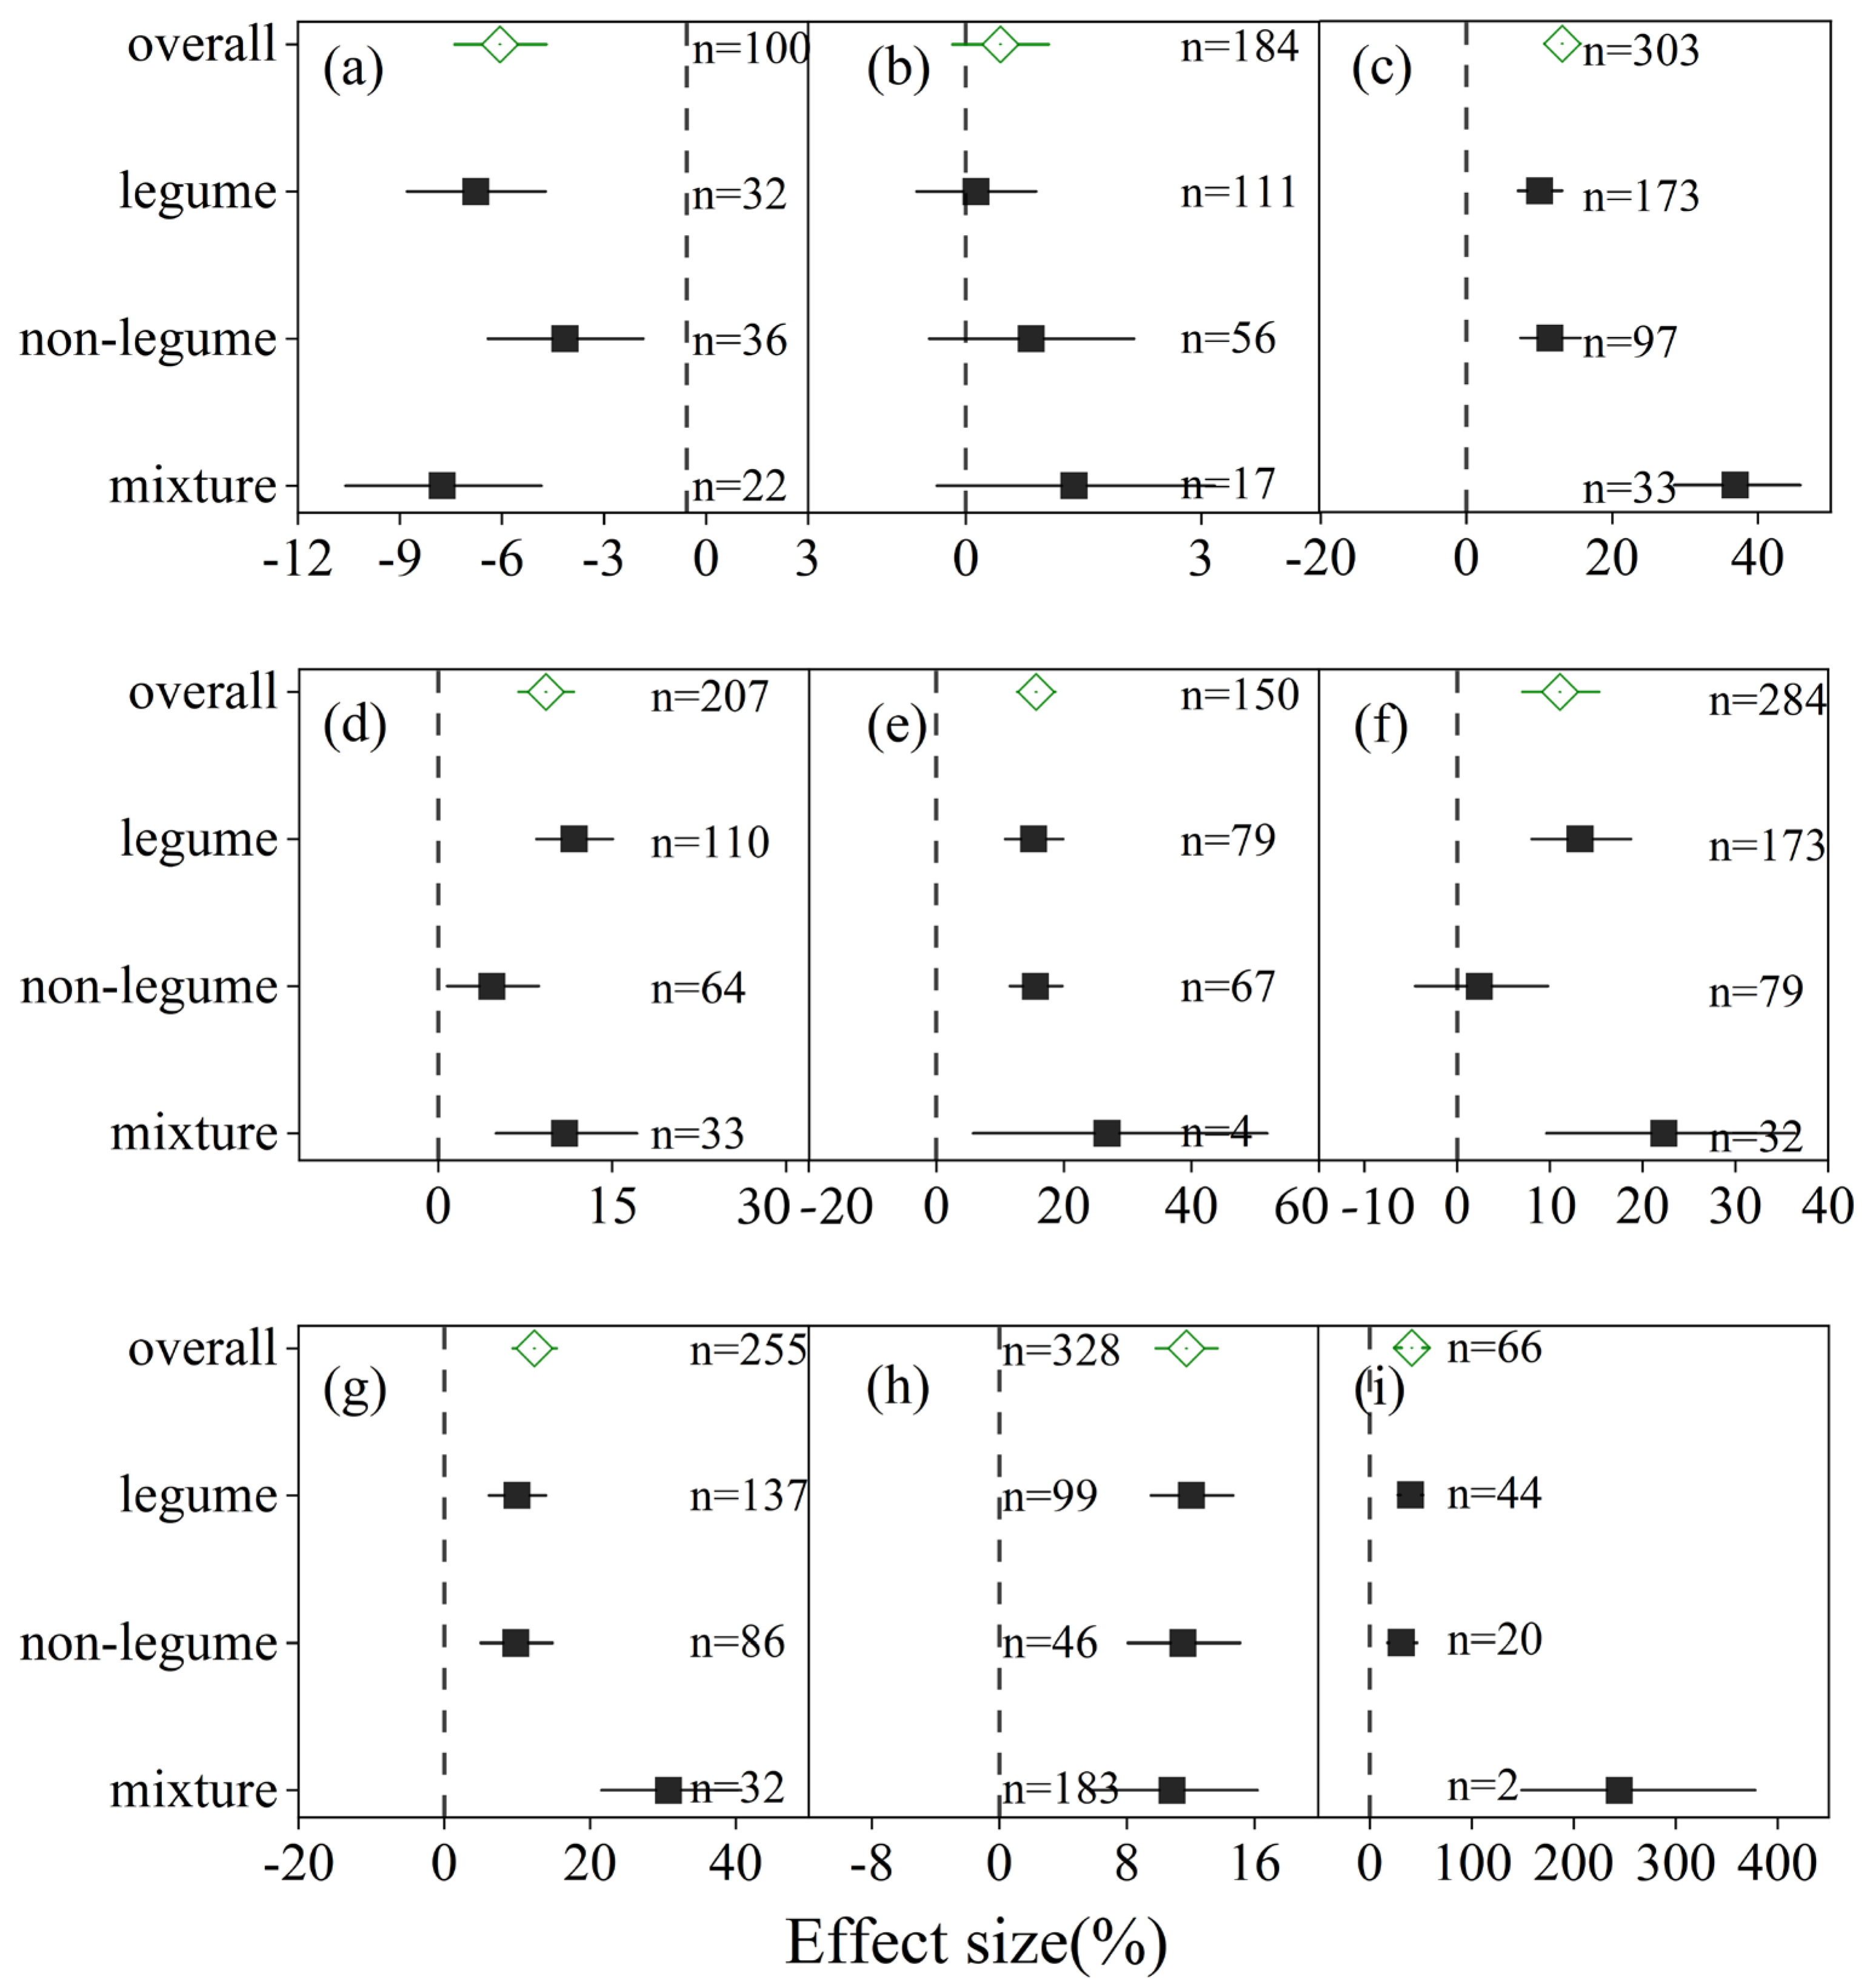
3.1. Effects of Cover Crop Species

The meta-analysis revealed that, relative to fallow treatment, the adoption of cover crops led to a general decrease in soil bulk density (SBD) and a significant enhancement in soil nutrient availability while exerting no statistically significant influence on soil pH (Figure 3). However, the magnitude of these effects varied considerably among different cover crop types. Specifically, all three cover crop groups—legumes, non-legumes, and mixed species—significantly reduced SBD by 4.2–7.8%. Among them, the mixed-species treatment produced the most pronounced reduction, with additional decreases of 14.6% and 63.1% in SBD relative to sole leguminous and non-leguminous species, respectively.
Regarding soil fertility, all cover crop types showed significantly increased total nitrogen (TN), total phosphorus (TP), available potassium (AK), soil organic matter (SOM), and microbial biomass carbon (MBC) (Figure 3). Notably, mixed-species cover crops showed the most substantial improvements in TN (36.9%), AP (22.3%), and AK (30.8%), highlighting their superior capacity for nutrient enrichment. Furthermore, both leguminous and mixed-species treatments showed significantly increased AP (13.3–22.3%), whereas non-leguminous covers had no statistically significant effect on this parameter.

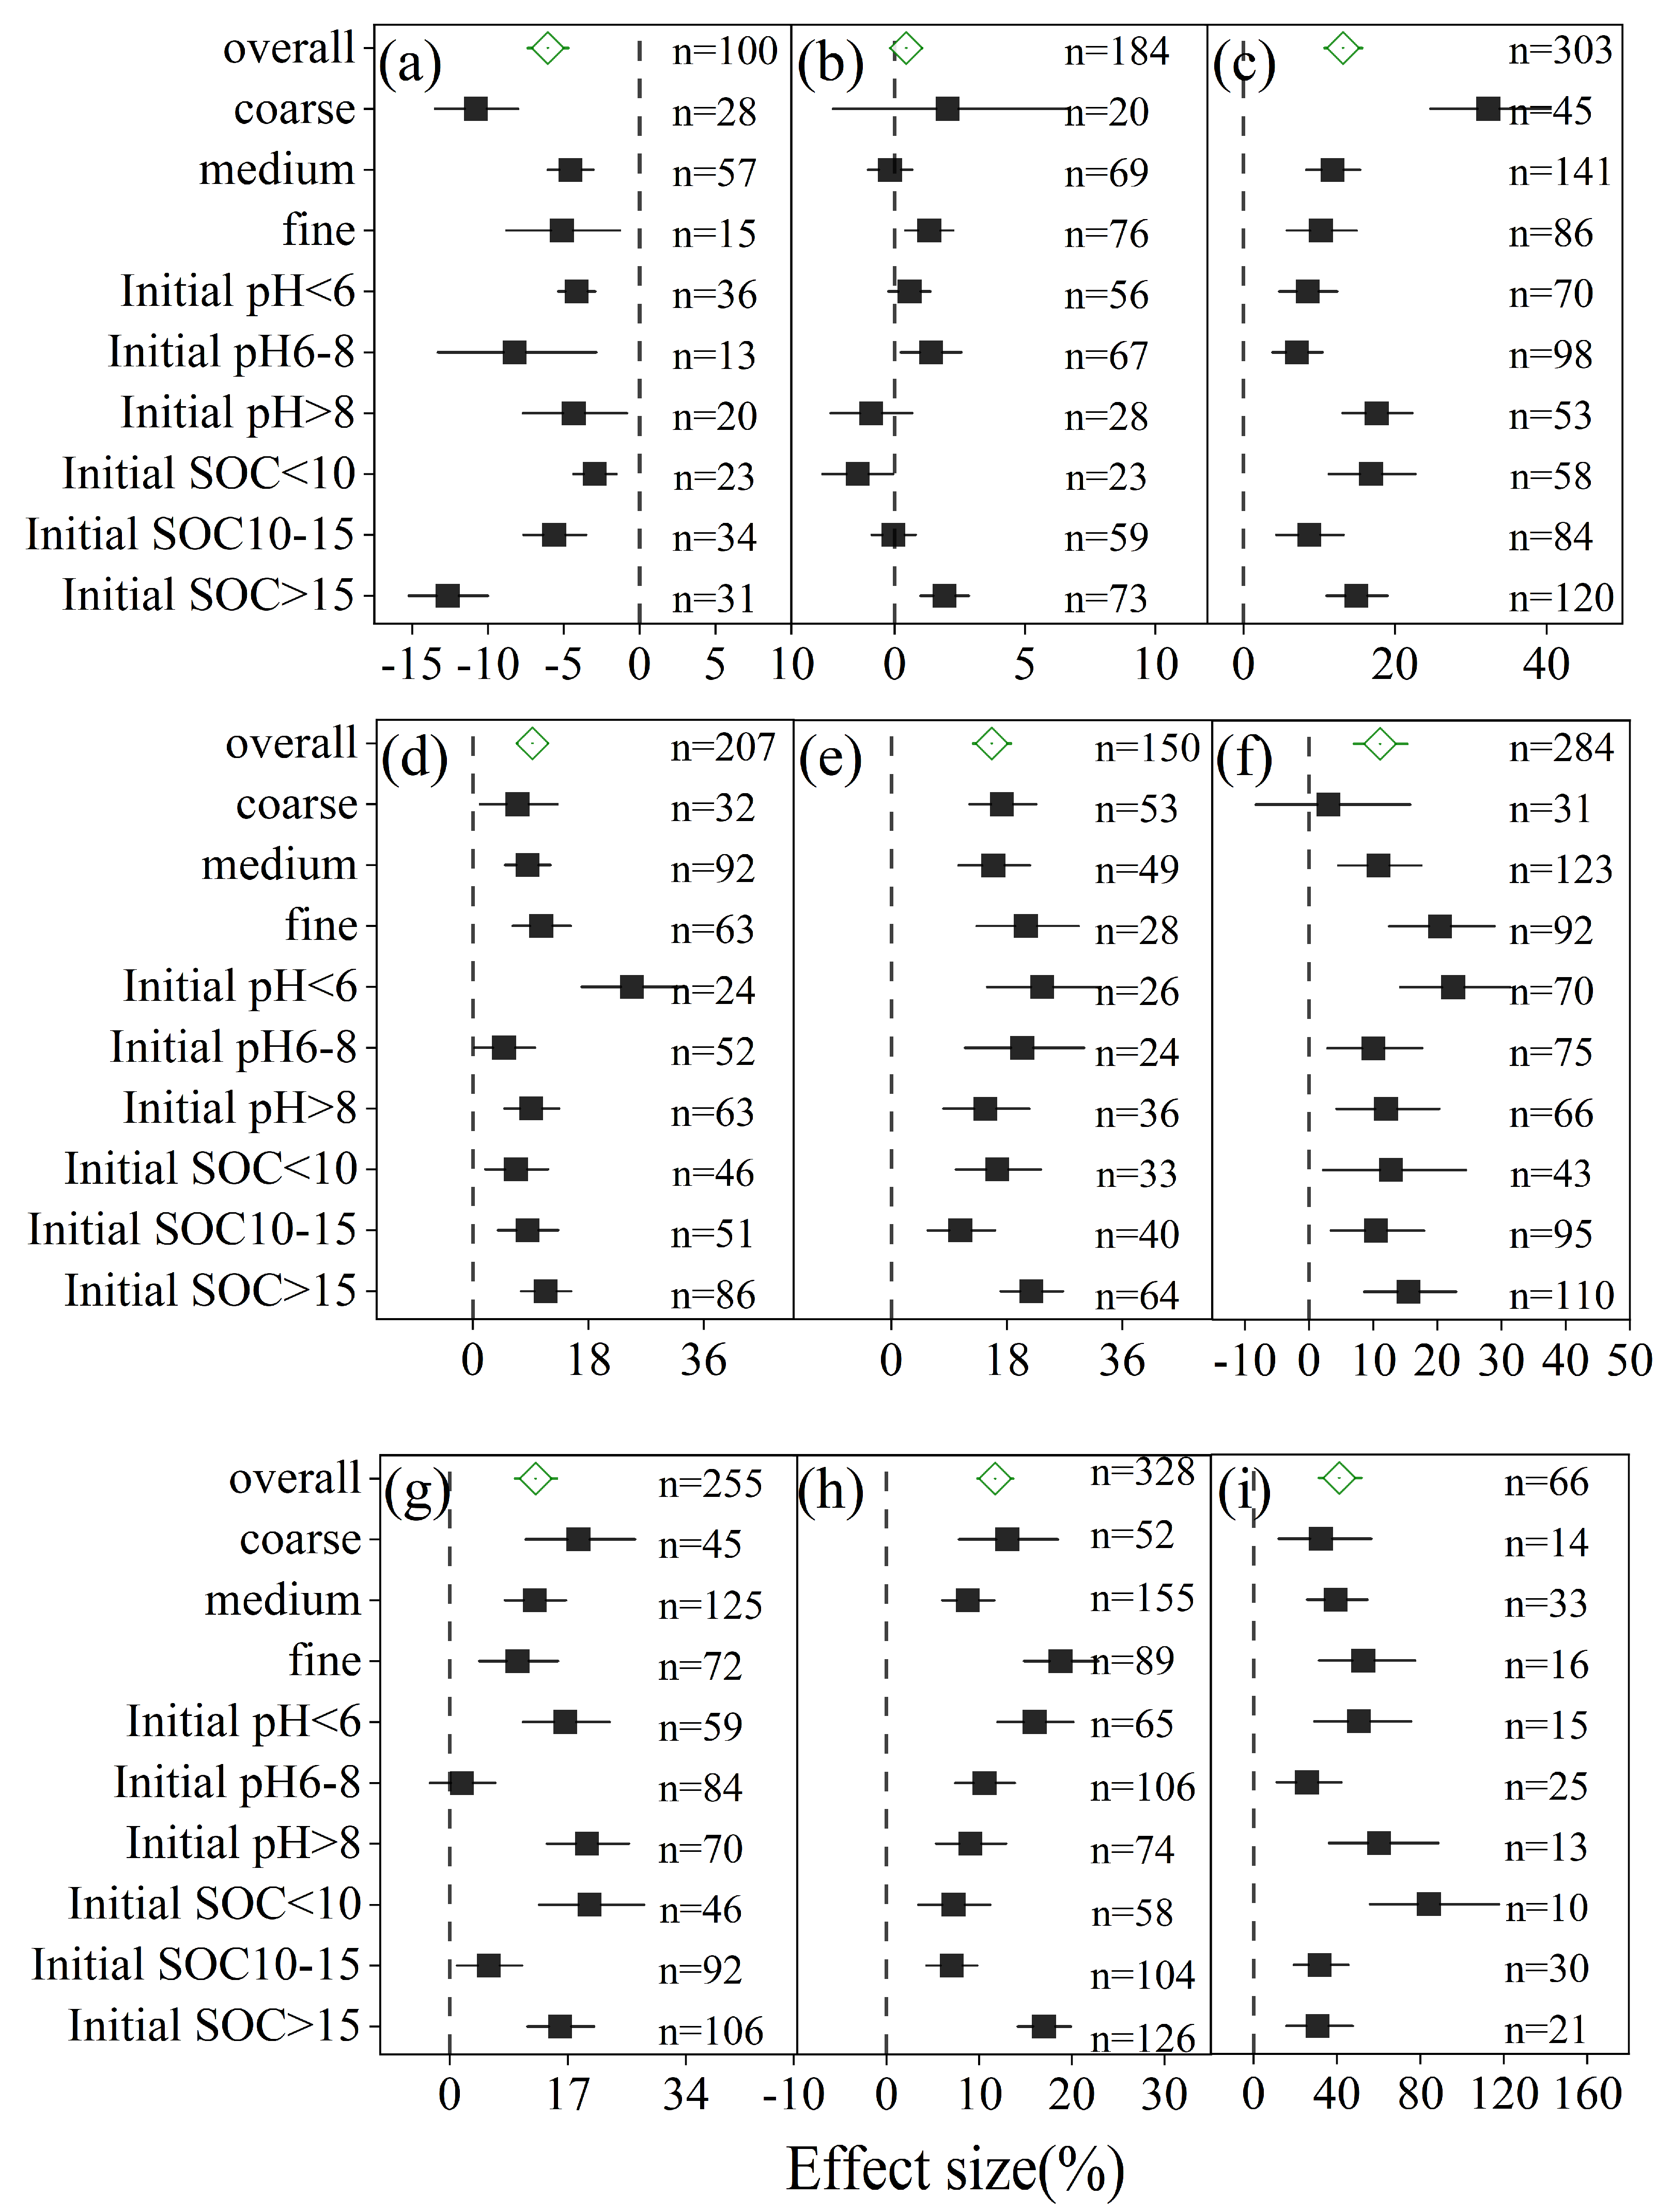
3.2. Effects of Initial Soil Properties

Across all soil texture classes (fine-, medium-, and coarse-textured soils), cover cropping significantly reduced SBD compared to fallow treatments, with effect sizes ranging from 4.6% to 10.8% (Figure 4). Although nutrient-enrichment effects were observed across all texture types, fine-textured soils exhibited the most substantial responses. Significant increases were observed in TN (10.3–32.3%), TP (15.9–21.0%), AN (7.0–10.6%), AK (9.8–18.5%), SOM (8.8–18.8%), and MBC (32.4–52.7%) across all texture classes. Particularly, fine-textured soils showed superior responses in pH (+1.3%), AN (+10.6%), TP (+21.0%), AP (+20.4%), SOM (+18.8%), and MBC (+52.7%). The application of cover crops also enhanced AP significantly in medium-textured soils by 10.8%, respectively, while coarse-textured soils showed no significant response.
With regard to initial soil pH, cover crops displayed a buffering effect on soil acidity and alkalinity. In soils with initial pH < 6, cover crops led to a slight increase in pH, while in soils with pH > 8, a slight decrease in pH was observed. Nevertheless, across all pH classes, cover crops showed significantly reduced SBD by (4.2–8.2%) and increased TN (7.1–17.6%), AN (4.9–24.8%), TP (14.6–23.5%), AP (10.0–22.5%), SOM (9.1–16.0%), and MBC (25.7–60.3%). Additionally, in soils with pH < 6 and >8, AK increased by 16.6% and 19.7%, respectively, whereas soils with neutral pH (6–8) exhibited no significant changes in AK (Figure 3).
Similarly, across all categories of initial soil organic carbon (SOC) levels, cover cropping consistently reduced soil bulk density (SBD) and significantly enhanced nutrient availability—relative to fallow controls (Figure 3). In particular, soils with SOC > 15 g/kg experienced more pronounced improvements in BD (12.7%), AN (11.3%), TP (21.8%), AP (15.5%), and SOM (17.0%).

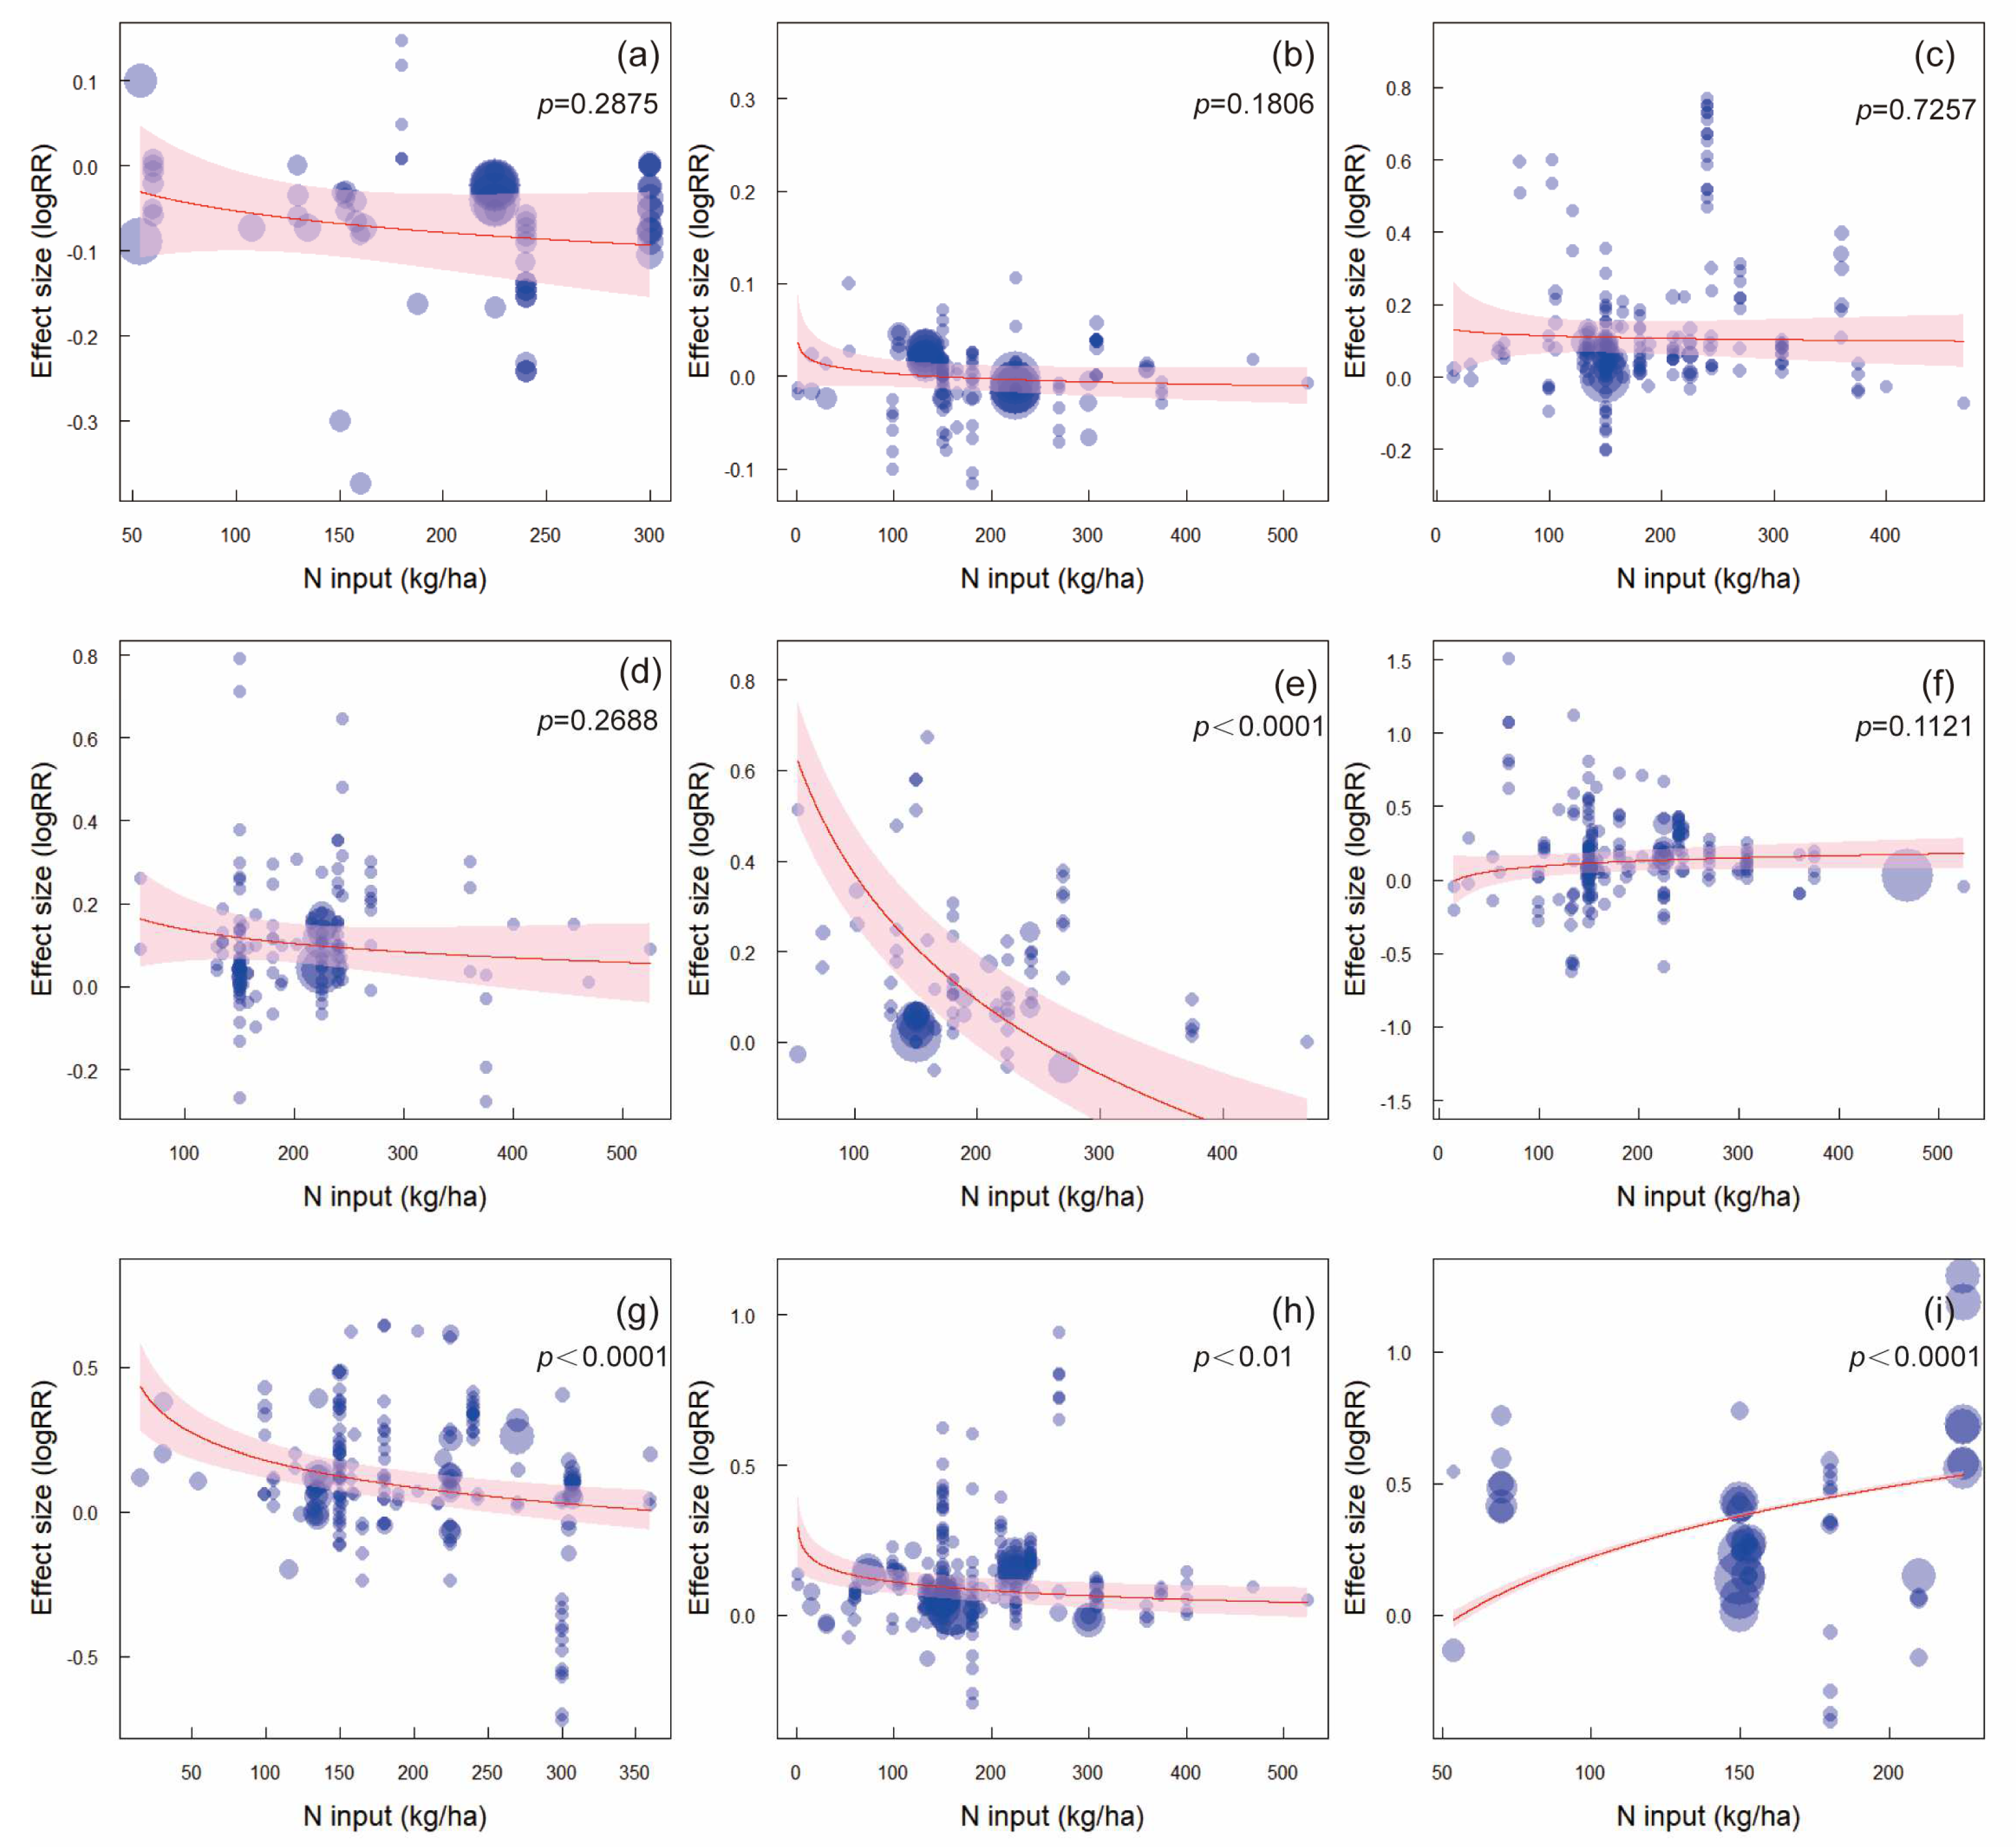
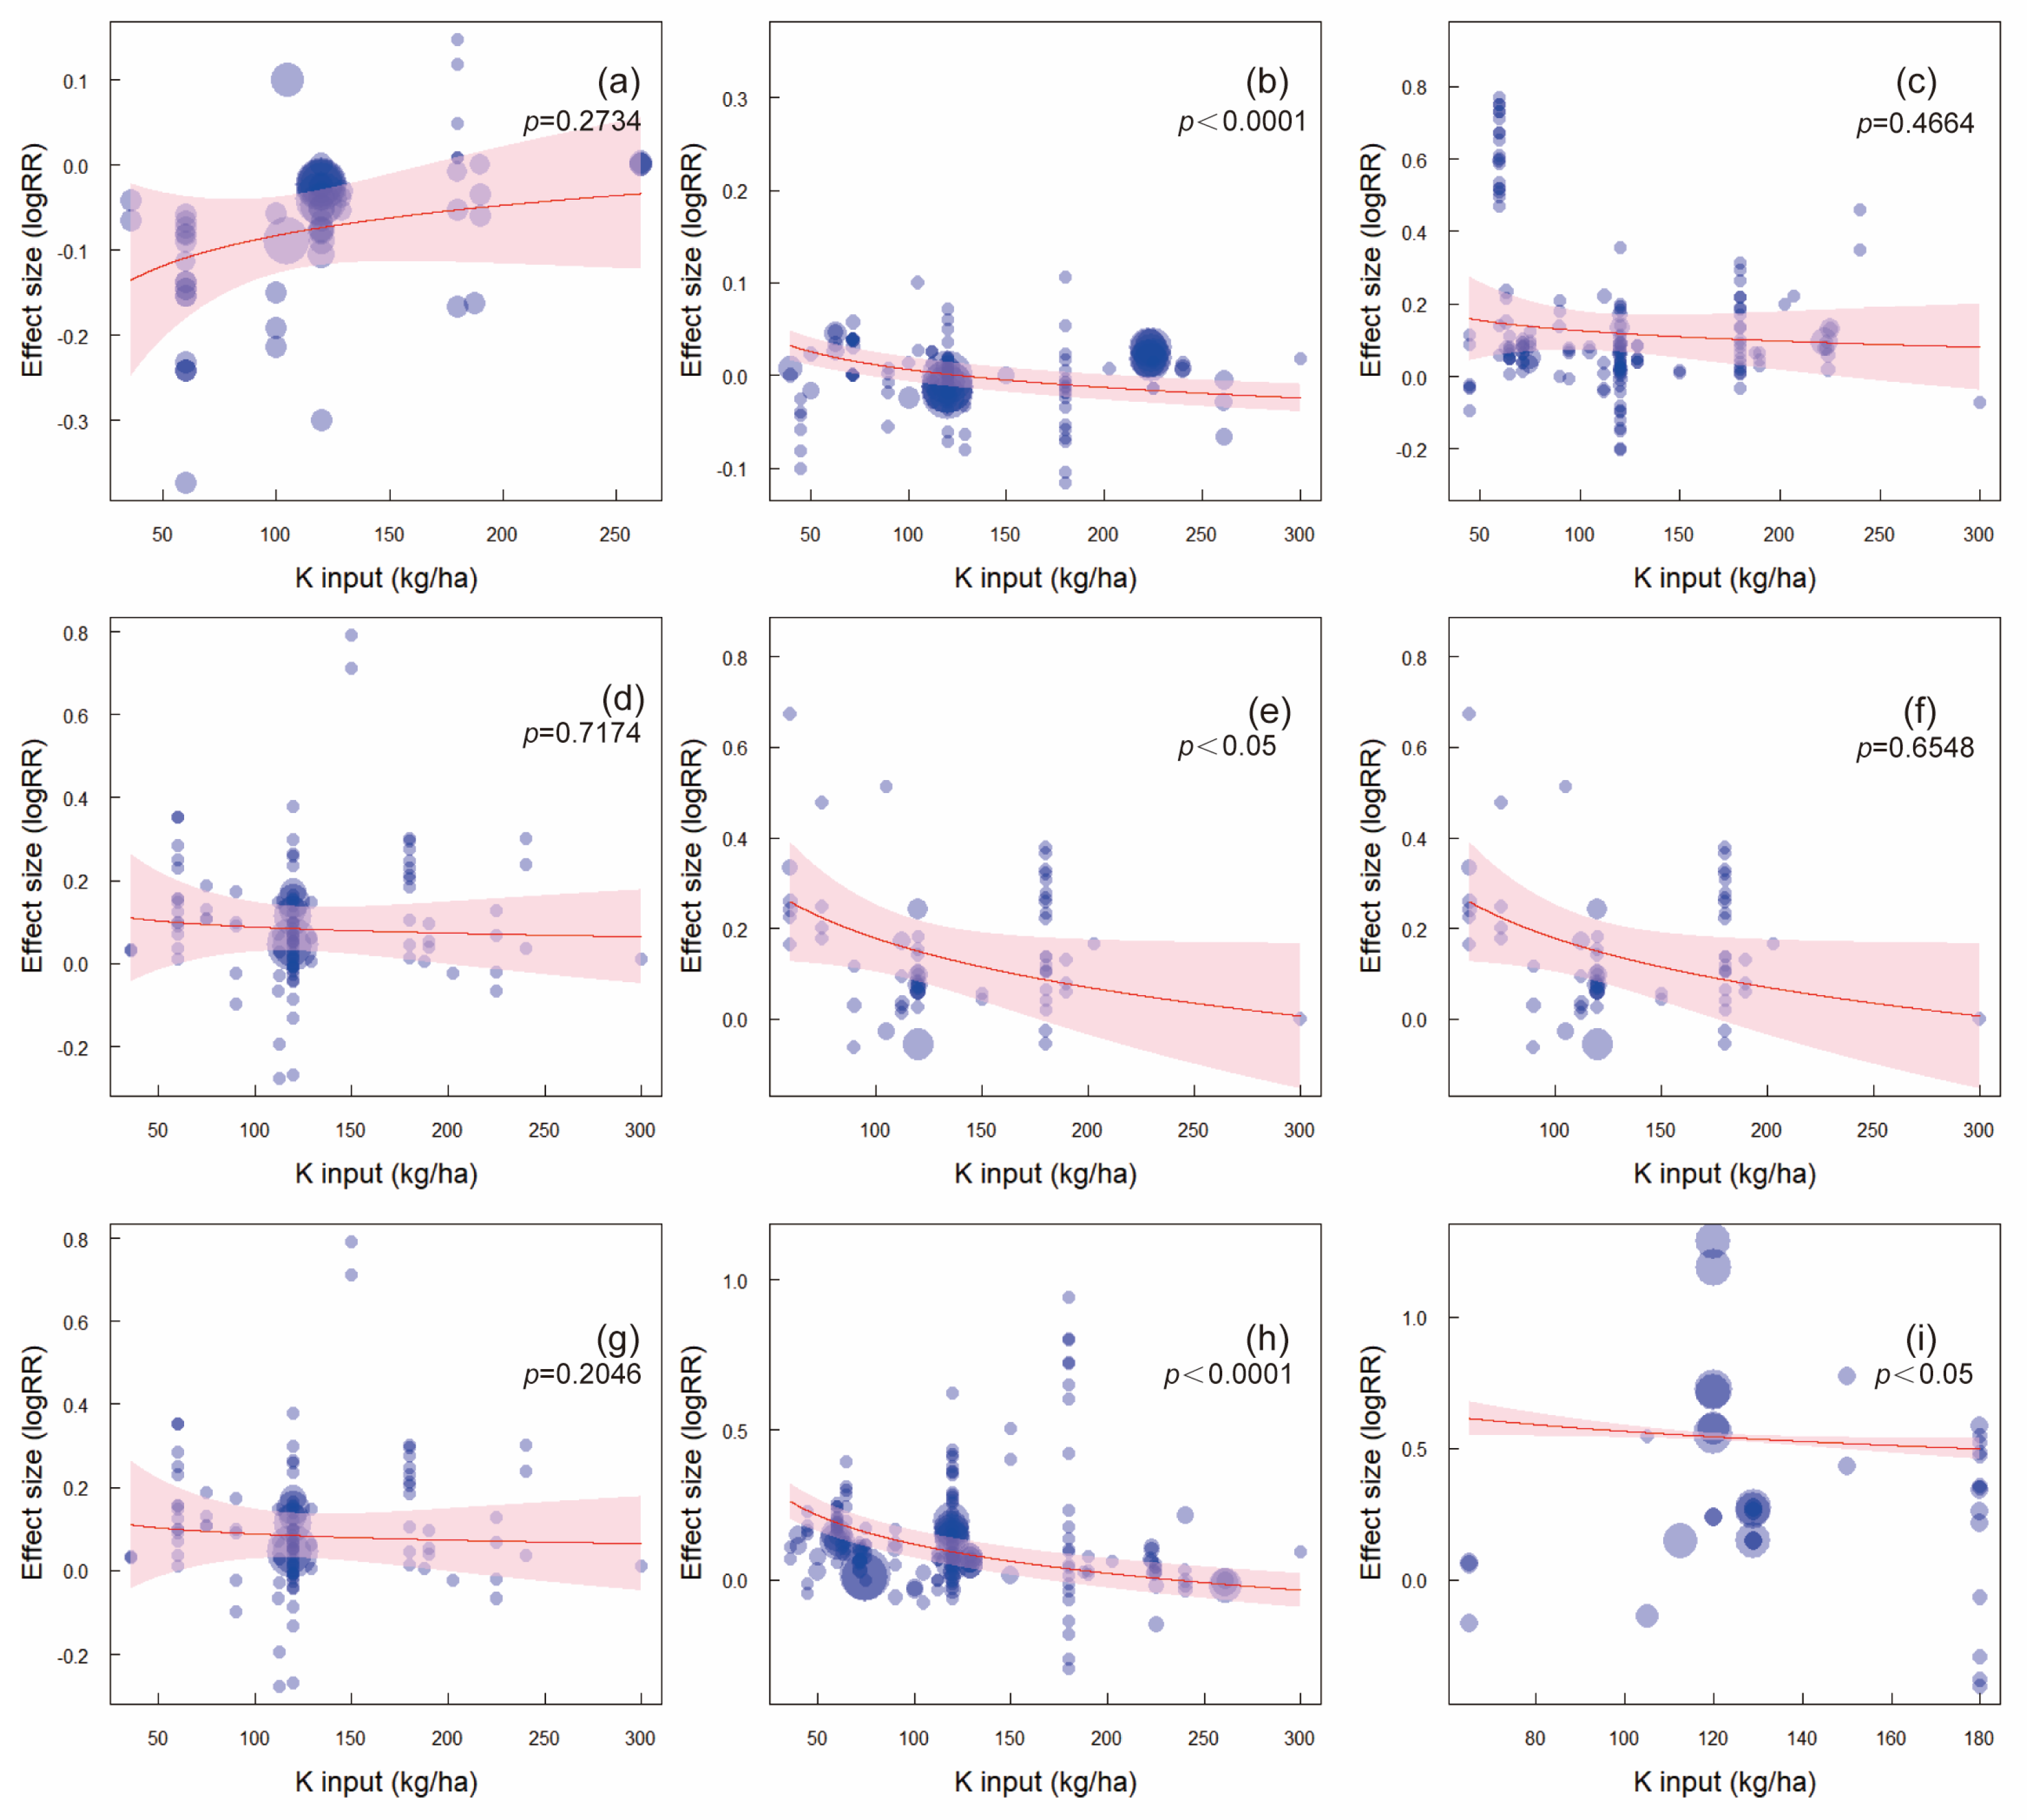
3.3. Effects of Fertilizer Inputs

Meta-regression analyses indicated that nitrogen (N) fertilizer input was significantly negatively correlated with the effect sizes for TP, AK, and SOM (Figure 5). Phosphorus (P) fertilizer input was significantly negatively correlated with the effect sizes for SOM (Figure 6). Potassium (K) fertilizer input was significantly negatively correlated with the effect sizes for pH, TP, SOM, and MBC (Figure 7). However, in contrast, N and P fertilizer input was significantly positively correlated with the effect sizes for MBC.

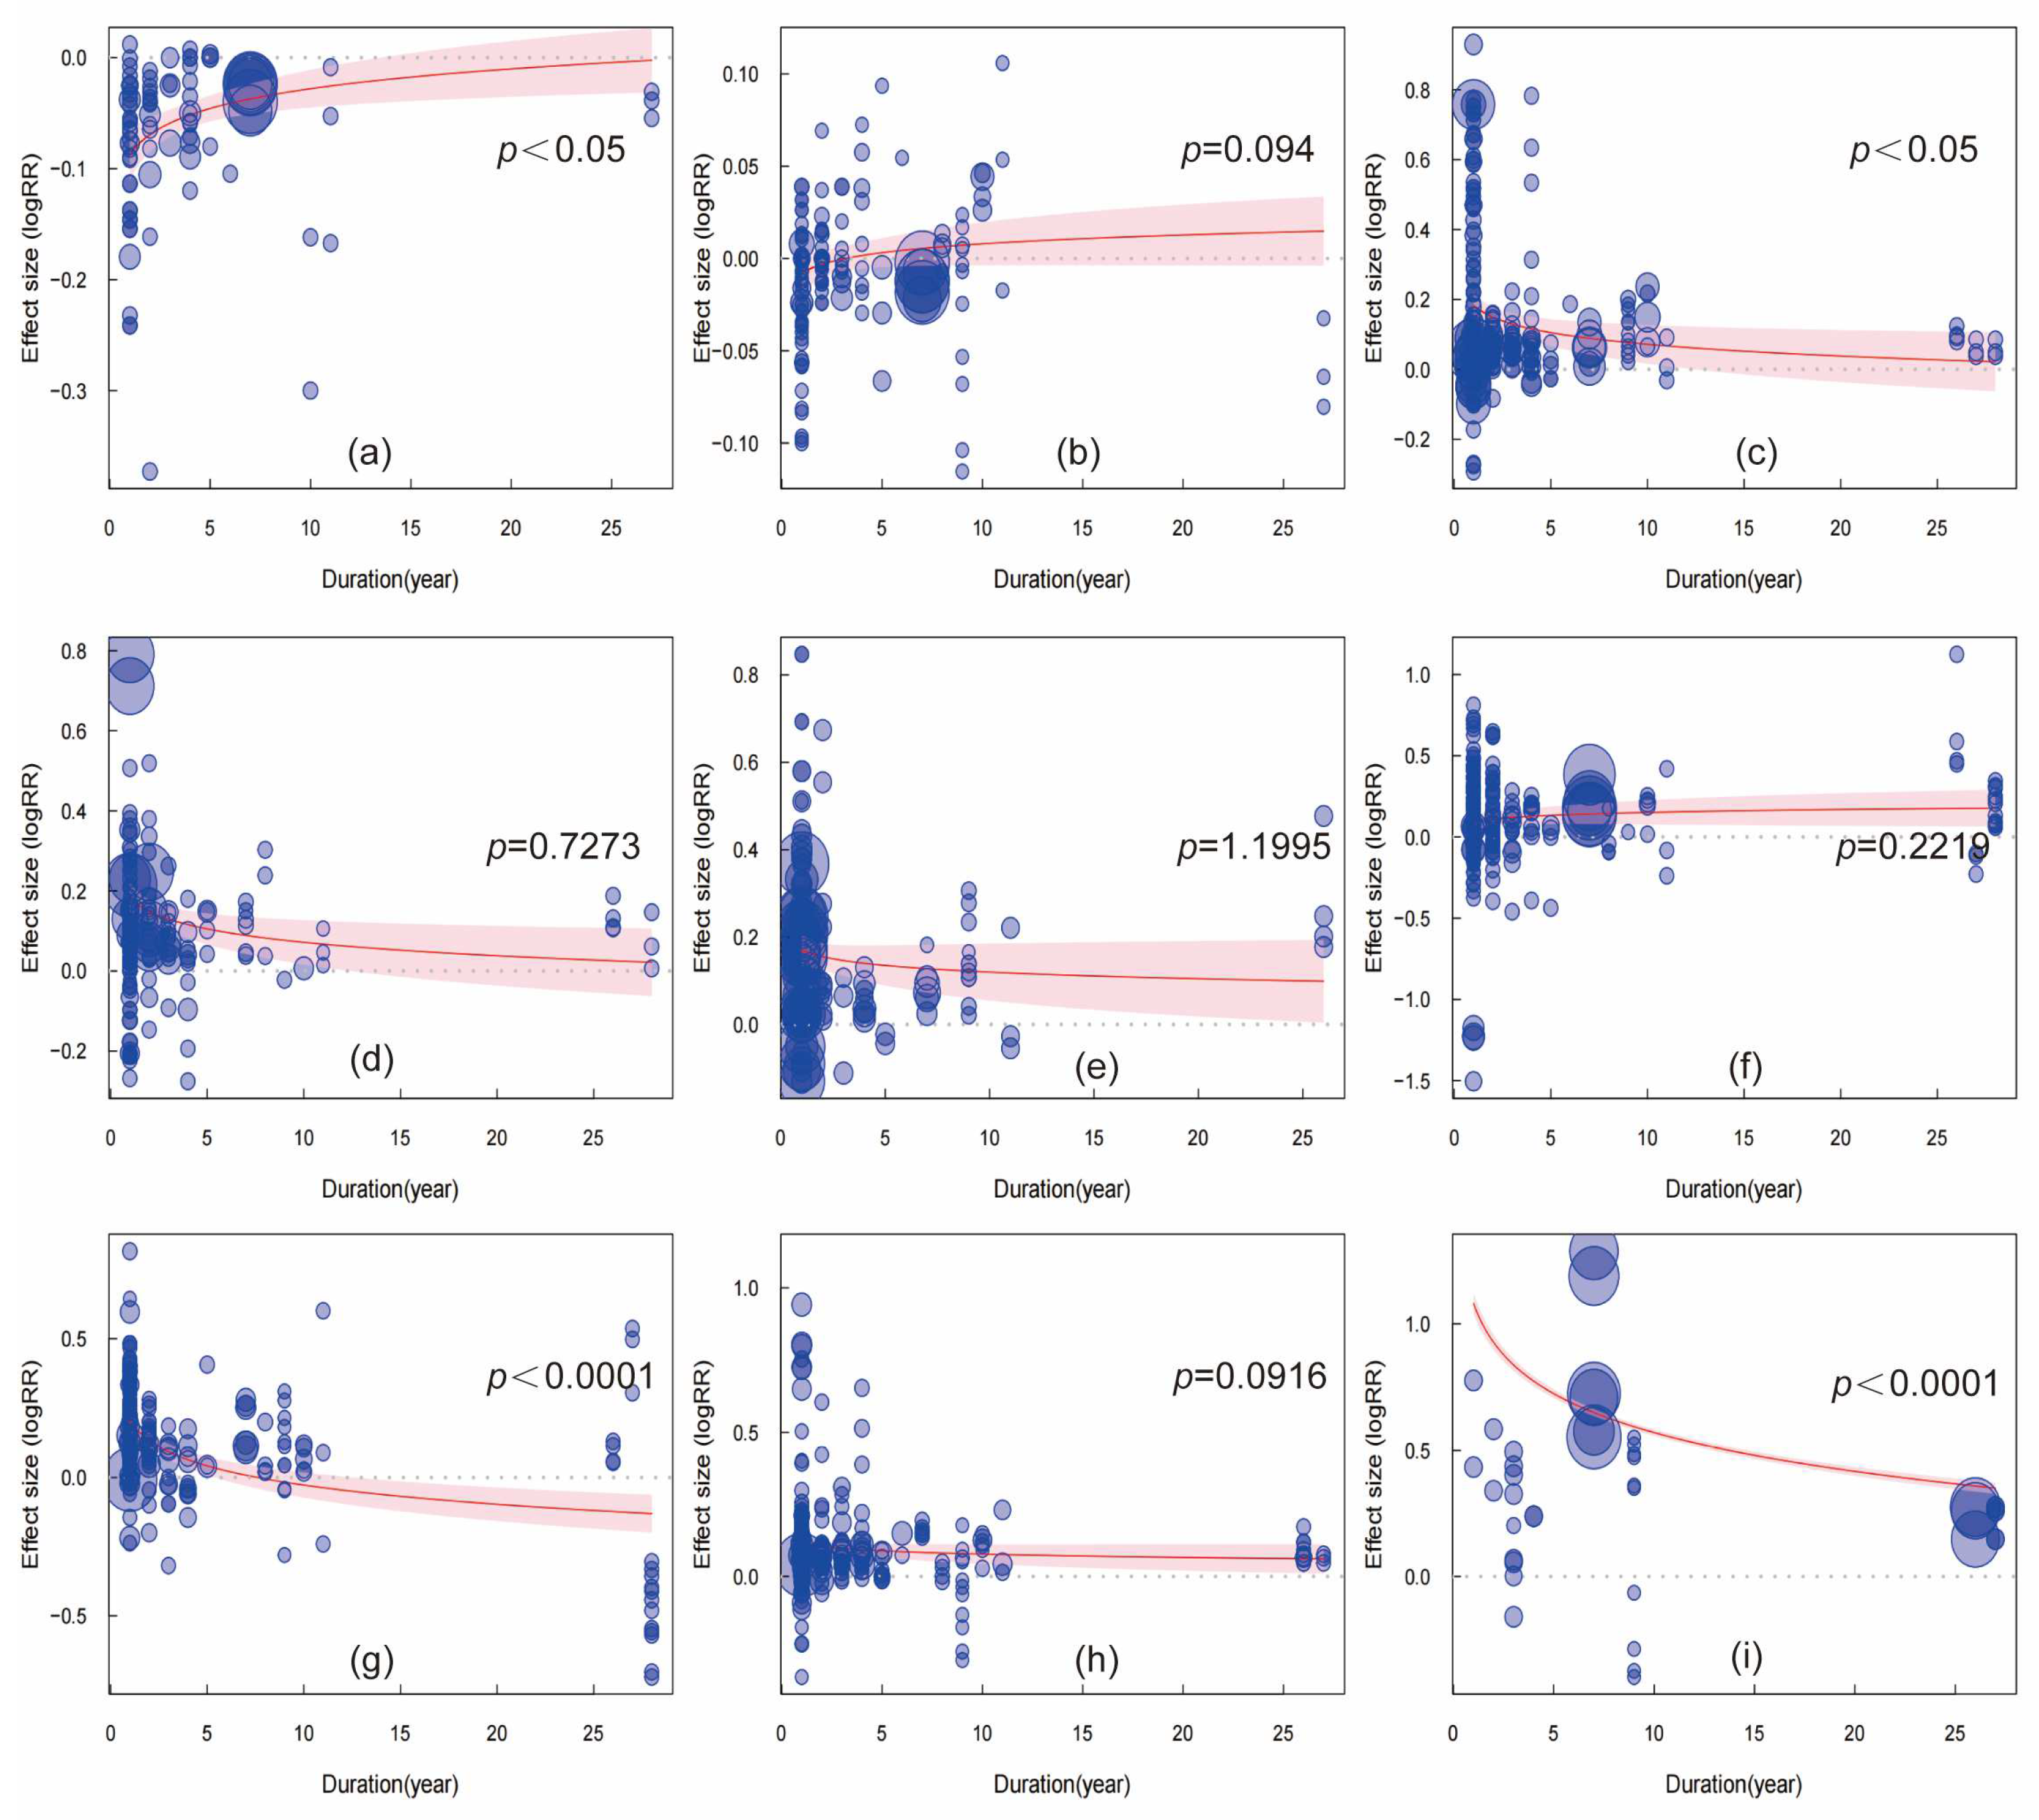
3.4. Effects of Planting Duration

Meta-regression analyses revealed a significant negative correlation between cover cropping duration and the effect sizes for TN, AK, and MBC (Figure 8). In contrast, a significant positive correlation was observed between duration and the effect size for SBD. Specifically, the longer the cover cropping period was, the smaller the observed improvements in TN, AK, MBC content, and SBD were. No significant relationships were found between study duration and other soil parameters.

4. Discussion

4.1. Impacts of Cover Crops on Soil Physicochemical Properties

Soil organic matter (SOM), nitrogen (N), phosphorus (P), and potassium (K) are essential indicators of soil fertility and crop productivity. Our meta-analysis demonstrated that cover crops showed significantly increased SOM, total nitrogen (TN), alkali-hydrolyzable nitrogen (AN), total phosphorus (TP), available phosphorus (AP), and available potassium (AK) compared to fallow treatments (Figure 3). The augmentation of these soil nutrient pools and organic matter content contributes to the enhancement of key soil physicochemical properties—such as nutrient availability, cation exchange capacity, and soil structure—which collectively foster a more favorable environment for root growth, nutrient uptake, and overall plant development [28]. For example, hydrolysable nitrogen (AN), also known as alkali-hydrolyzable nitrogen, represents the labile fraction of soil nitrogen that is readily mineralizable and available for plant uptake. It serves as a reliable indicator of the soil’s short-to-medium-term nitrogen supply capacity [29]. The observed increase in AN under cover cropping systems suggests enhanced nitrogen availability and accelerated nitrogen cycling within the soil nitrogen pool, translating into improved nutrient supply for subsequent crops [30]. These findings align with previous research and can be attributed to two main mechanisms: (1) the extensive root systems of cover crops mobilize and recycle nutrients from deeper soil layers to the surface and (2) upon incorporation, cover crop biomass enriches soil nutrient pools through microbial decomposition [31,32,33].
Moreover, microbial biomass carbon (MBC), a sensitive indicator of soil microbial activity, was significantly increased under cover cropping (Figure 3). This likely resulted from increased carbon inputs via residues and rhizodeposition, which provided substrates for microbial proliferation [34]. Additionally, cover crops improve soil temperature and moisture regimes, further promoting microbial biomass accumulation [35].
Soil bulk density (SBD) was consistently reduced across studies, suggesting improvements in soil structure. This is likely due to the bioturbation effect of cover crop roots and the formation of stable aggregates from organic matter decomposition [36]. Such changes enhance soil porosity, aeration, and water-holding capacity, which are crucial for root development.
Our results indicate that cover cropping tends to buffer soil pH toward neutrality. This neutralizing effect may help mitigate soil acidity in southern regions and reduce alkalinity in northern areas of China, thereby fostering a more favorable pH environment for staple cereal crops such as wheat, maize, and rice, which generally prefer slightly acidic rather than strongly acidic or alkaline conditions [31,37]. This buffering capacity may be attributed to increased organic matter inputs and microbial activity associated with cover crops, which enhance cation exchange capacity and generate organic acids that moderate extreme pH levels [38]. These findings highlight the potential of cover crops as a regionally adaptive strategy for stabilizing soil pH across diverse agroecological zones.

4.2. Influence of Cover Crop Types

Mixed sowing of leguminous and non-leguminous cover crops resulted in more pronounced enhancements in TN, AP, and AK compared to single-species cover cropping (Figure 3). This can be explained by functional complementarity: legumes fix atmospheric N via symbiosis with rhizobia while non-legumes enhance root penetration and nutrient uptake [9]. Additionally, species mixtures likely increase microbial diversity and enzymatic activity, accelerating nutrient cycling [12].
Non-leguminous cover crops alone had limited effects on AP, likely due to the absence of N fixation and possible competition for P [9]. This discrepancy may have been due to the huge differences in climate and soil texture among the farming regions where this effect was tested.

4.3. Modulating Effects of Initial Soil Properties

The initial soil texture plays a key role in mediating cover crop impacts. Our stratified analysis showed that fine-textured soils (e.g., clay loam) exhibited stronger reductions in BD and greater nutrient improvements than medium- and coarse-textured soils (Figure 4). These soils possess higher inherent SOC and moisture retention capacity, creating a favorable environment for root growth and microbial activity. This triggers a cascade of positive effects, including increased aggregation and nutrient retention [20]. In coarse-textured soils, the response of AP was less pronounced, potentially due to the lower P-sorption capacity and limited microbial mineralization [39].
Stratification by initial soil organic carbon (SOC) levels also revealed differential responses (Figure 4). Soils with SOC > 15 g kg−1 experienced the largest reductions in SBD and improvements in nutrient availability, suggesting that SOC acts synergistically with cover crop residues to enhance soil structure and fertility [40]. Conversely, in low-SOC soils (<10 g kg−1), the largest increases in MBC were observed, implying a greater microbial response to carbon inputs [41].

4.4. Interaction with Fertilizer Inputs

Interestingly, high application rates of synthetic N, P, and K fertilizers failed to enhance the benefits of cover cropping, suggesting that the primary advantage of cover crops stems from biological nutrient cycling mechanisms rather than chemical fertilization (Figure 5, Figure 6 and Figure 7). Excessive nitrogen application may mask cover crop benefits by saturating soils with readily available nutrients, thereby diminishing the marginal value of biological inputs. Notably, meta-regression analysis revealed a significant positive correlation between N fertilizer input and microbial biomass carbon (MBC) effect sizes.
This apparent contradiction can be explained through dual mechanistic pathways. On one hand, nitrogen serves as a key substrate for microbial growth, promoting microbial community proliferation [29] and consequently increasing MBC. On the other hand, elevated N inputs accelerate mineralization processes, leading to reduced total phosphorus (TP) and available potassium (AK) through leaching and gaseous losses [42]. Furthermore, the limited sample size in the dataset (N application range: 54–225 kg ha−1) may introduce bias to these observations. Collectively, these results underscore the critical importance of implementing balanced fertilization strategies within cover cropping systems [38,39].

4.5. Impact of Cover Crop Duration

The benefits of cover crops on SBD, MBC, TN, and AK tended to decline with increasing study durations (Figure 8). This may reflect nutrient saturation over time or physical changes such as reduced porosity due to soil compaction or residue buildup [43]. Another explanation could be a shift in microbial communities toward more recalcitrant organic matter decomposition, which slows nutrient mineralization [44]. To sustain long-term benefits, management strategies such as species rotation, periodic tillage, or integrated nutrient management may be necessary. Future research should focus on the temporal dynamics of soil responses and the legacy effects of different cover crop systems.

4.6. Future Perspectives and Research Needs

This meta-analysis confirmed cover cropping benefits but highlighted key gaps. Limited data in some moderators (e.g., soil TP under cover crops mixture systems) introduced uncertainty; these were retained to emphasize research needs. Due to uneven reporting, multivariate models were impractical, so univariate approaches with moderator analysis were used, appropriate for current data but open to future refinement. Economic and resource trade-offs, including water use and input costs, remain unassessed and warrant integration into future studies.
Mechanistic insights are scarce, with few studies addressing microbial communities or soil biological activity. Long-term standardized research is needed to clarify microbial roles in nutrient cycling. Regional variability in climate, soil, and management calls for tailored strategies. Emerging technologies like remote sensing and machine learning could improve spatial predictions. Integrating biochemical, physical, and microbial data will be crucial for designing resilient, sustainable systems.

5. Conclusions

This meta-analysis has demonstrated that cover cropping significantly improves soil physicochemical properties compared to fallow management. Specifically, cover crops reduced soil bulk density by 6.1% and enhanced the soil nutrient status, showing increased total nitrogen (+13.1%), total phosphorus (+15.6%), available nitrogen (+9.3%), available phosphorus (+11.1%), available potassium (+12.4%), soil organic matter (+11.7%), and microbial biomass carbon (+41.1%). Mixed-species cover crops exhibited the most pronounced improvements, particularly in nutrient enrichment and compaction mitigation. Stratified analyses further revealed that fine-textured soils and soils with higher initial SOC levels (>15 g kg−1) experienced greater benefits. While the overall effect on soil pH was not statistically significant, cover cropping exhibited a neutralizing tendency, potentially moderating acidic and alkaline soils to a more favorable pH range for crop growth. These findings highlight the potential of cover cropping as a climate-smart practice to enhance soil health and promote sustainable agricultural systems when tailored to site-specific soil conditions and management regimes.

Supplementary Materials

The following supporting information can be downloaded at: https://www.mdpi.com/article/10.3390/agronomy15081756/s1, Figure S1: Effects of different soil texture on soil physicochemical properties. Panels (a–i) represent changes in (a) bulk density, (b) soil pH, (c) total nitrogen (TN), (d) hydrolysable nitrogen (AN), (e) total phosphorus (TP), (f) available phosphorus (AP), (g) available potassium (AK), and (h) soil organic matter (SOM), and (i) microbial biomass carbon (MBC); Table S1: Egger’s regression tests and fail-safe numbers for assessing publication bias; Figure S2: Normal quantile–quantile (Q-Q) plot for analyzing publication bias. Panels (a–i) represent changes in (a) bulk density, (b) soil pH, (c) total nitrogen (TN), (d) hydrolysable nitrogen (AN), (e) total phosphorus (TP), (f) available phosphorus (AP), (g) available potassium (AK), and (h) soil organic matter (SOM), and (i) microbial biomass carbon (MBC).

Author Contributions

J.M.: investigation, writing—original draft, project administration, methodology. B.Y.: writing—review and editing, conceptualization. T.G.: investigation, Formal analysis. K.H.: investigation, Formal analysis. X.H.: investigation, Formal analysis. T.J.: investigation, Formal analysis. W.Z.: conceptualization, writing—review and editing. All authors have read and agreed to the published version of the manuscript.

Funding

This work was supported by the National Key R&D Program of China (2023YFD2303000) and Modern Agricultural Industrial Technology System in Hebei Province (HBCT2024010202).

Data Availability Statement

Data is contained within the article or Supplementary Material.

Conflicts of Interest

The authors declare that the research was conducted in the absence of any commercial or financial relationships that could be construed as potential conflicts of interest.

References

  1. Ibarrola-Rivas, M.J.; Granados-Ramirez, R.; Nonhebel, S. Is the available cropland and water enough for food demand? A global perspective of the Land-Water-Food nexus. Adv. Water Resour. 2017, 110, 476–483. [Google Scholar] [CrossRef]
  2. Ernst, O.R.; Dogliotti, S.; Cadenazzi, M.; Kemanian, A.R. Shifting crop-pasture rotations to no-till annual cropping reduces soil quality and wheat yield. Field Crops Res. 2018, 217, 180–187. [Google Scholar] [CrossRef]
  3. Qin, S.H.; Yeboah, S.; Xu, X.X.; Liu, Y.H.; Yu, B. Analysis on Fungal Diversity in Rhizosphere Soil of Continuous Cropping Potato Subjected to Different Furrow-Ridge Mulching Managements. Front. Microbiol. 2017, 8, 845. [Google Scholar] [CrossRef]
  4. Soane, B.D.; Ball, B.C.; Arvidsson, J.; Basch, G.; Moreno, F.; Roger-Estrade, J. No-till in northern, western and south-western Europe: A review of problems and opportunities for crop production and the environment. Soil Tillage Res. 2012, 118, 66–87. [Google Scholar] [CrossRef]
  5. Holland, J.; Brown, J.L.; MacKenzie, K.; Neilson, R.; Piras, S.; McKenzie, B.M. Over winter cover crops provide yield benefits for spring barley and maintain soil health in northern Europe. Eur. J. Agron. 2021, 130, 126363. [Google Scholar] [CrossRef]
  6. Krupek, F.S.; Mizero, S.M.; Redfearn, D.; Basche, A. Assessing how cover crops close the soil health gap in on-farm experiments. Agric. Environ. Lett. 2022, 7, e20088. [Google Scholar] [CrossRef]
  7. Zhang, C.Z.; Xue, W.F.; Xue, J.R.; Zhang, J.; Qiu, L.J.; Chen, X.Y.; Hu, F.; Kardol, P.; Liu, M.Q. Leveraging functional traits of cover crops to coordinate crop productivity and soil health. J. Appl. Ecol. 2022, 59, 2627–2641. [Google Scholar] [CrossRef]
  8. Acharya, P.; Ghimire, R.; Acosta-Martinez, V. Cover crop-mediated soil carbon storage and soil health in semi-arid irrigated cropping systems. Agric. Ecosyst. Environ. 2024, 361, 108813. [Google Scholar] [CrossRef]
  9. Koudahe, K.; Allen, S.C.; Djaman, K. Critical review of the impact of cover crops on soil properties. Int. Soil Water Conserv. Res. 2022, 10, 343–354. [Google Scholar] [CrossRef]
  10. Zhang, Z.G.; An, J.; Xiong, S.W.; Li, X.F.; Xin, M.H.; Wang, J.; Han, Y.C.; Wang, G.P.; Feng, L.; Lei, Y.P.; et al. Orychophragmus violaceus-maize rotation increases maize productivity by improving soil chemical properties and plant nutrient uptake. Field Crops Res. 2022, 279, 108470. [Google Scholar] [CrossRef]
  11. Besen, M.R.; Ribeiro, R.H.; Bratti, F.; Locatelli, J.L.; Schmitt, D.E.; Piva, J.T. Cover cropping associated with no-tillage system promotes soil carbon sequestration and increases crop yield in Southern Brazil. Soil Tillage Res. 2024, 242, 106162. [Google Scholar] [CrossRef]
  12. Connell, R.K.; James, T.Y.; Blesh, J. A legume-grass cover crop builds mineral-associated organic matter across variable agricultural soils. Soil Biol. Biochem. 2025, 203, 109726. [Google Scholar] [CrossRef]
  13. Scavo, A.; Restuccia, A.; Lombardo, S.; Fontanazza, S.; Abbate, C.; Pandino, G.; Anastasi, U.; Onofri, A.; Mauromicale, G. Improving soil health, weed management and nitrogen dynamics by Trifolium subterraneum cover cropping. Agron. Sustain. Dev. 2020, 40, 18. [Google Scholar] [CrossRef]
  14. He, Q.; Lu, C.; Cowie, A.; Zhao, S.; Liu, D.L.; Yi, B.; Shi, L.; Zhang, S.; Qiu, T.; Shi, Y.; et al. Optimizing cover cropping application for sustainable crop production. npj Sustain. Agric. 2025, 3, 10. [Google Scholar] [CrossRef]
  15. McDaniel, M.D.; Tiemann, L.K.; Grandy, A.S. Does agricultural crop diversity enhance soil microbial biomass and organic matter dynamics? A meta-analysis. Ecol. Appl. 2014, 24, 560–570. [Google Scholar] [CrossRef]
  16. Chen, G.H.; Weil, R.R.; Hill, R.L. Effects of compaction and cover crops on soil least limiting water range and air permeability. Soil Tillage Res. 2014, 136, 61–69. [Google Scholar] [CrossRef]
  17. Zhu, B.; Yi, L.X.; Guo, L.M.; Chen, G.; Hu, Y.G.; Tang, H.M.; Xiao, C.F.; Xiao, X.P.; Yang, G.L.; Acharya, S.N.; et al. Performance of two winter cover crops and their impacts on soil properties and two subsequent rice crops in Dongting Lake Plain, Hunan, China. Soil Tillage Res. 2012, 124, 95–101. [Google Scholar] [CrossRef]
  18. Kühling, I.; Mikuszies, P.; Helfrich, M.; Flessa, H.; Schlathölter, M.; Sieling, K.; Kage, H. Effects of winter cover crops from different functional groups on soil-plant nitrogen dynamics and silage maize yield. Eur. J. Agron. 2023, 148, 126878. [Google Scholar] [CrossRef]
  19. Rose, T.J.; Parvin, S.; McInnes, J.; van Zwieten, L.; Gibson, A.J.; Kearney, L.J.; Rose, M.T. Summer cover crop and temporary legume-cereal intercrop effects on soil microbial indicators, soil water and cash crop yields in a semi-arid environment. Field Crops Res. 2024, 312, 109384. [Google Scholar] [CrossRef]
  20. Iheshiulo, E.M.-A.; Larney, F.J.; Hernandez-Ramirez, G.; St Luce, M.; Liu, K.; Chau, H.W. Do diversified crop rotations influence soil physical health? A meta-analysis. Soil Tillage Res. 2023, 233, 105781. [Google Scholar] [CrossRef]
  21. Zheng, F.J.; Liu, X.T.; Ding, W.T.; Song, X.J.; Li, S.P.; Wu, X.P. Positive effects of crop rotation on soil aggregation and associated organic carbon are mainly controlled by climate and initial soil carbon content: A meta-analysis. Agric. Ecosyst. Environ. 2023, 355, 108600. [Google Scholar] [CrossRef]
  22. Lajeunesse, M.J. Facilitating systematic reviews, data extraction and meta-analysis with the metagear package for r. Methods Ecol. Evol. 2016, 7, 323–330. [Google Scholar] [CrossRef]
  23. Lajeunesse, M.J. On the meta-analysis of response ratios for studies with correlated and multi-group designs. Ecology 2011, 92, 2049–2055. [Google Scholar] [CrossRef]
  24. de Graaff, M.-A.; van Groenigen, K.-J.; Six, J.; Hungate, B.; van Kessel, C. Interactions between plant growth and soil nutrient cycling under elevated CO2: A meta-analysis. Glob. Change Biol. 2006, 12, 2077–2091. [Google Scholar] [CrossRef]
  25. Yu, L.; Zhao, X.; Gao, X.; Siddique, K.H.M. Improving/maintaining water-use efficiency and yield of wheat by deficit irrigation: A global meta-analysis. Agric. Water Manag. 2020, 228, 105906. [Google Scholar] [CrossRef]
  26. Feng, Z.; Wang, S.; Szantoic, Z.; Chen, S.; Wang, X. Protection of plants from ambient ozone by applications of ethylenediurea (EDU): A meta-analytic review. Environ. Pollut. 2010, 158, 3236–3242. [Google Scholar] [CrossRef] [PubMed]
  27. Benitez-Lopez, A.; Alkemade, R.; Schipper, A.M.; Ingram, D.J.; Verweij, P.A.; Eikelboom, J.A.J.; Huijbregts, M.A.J. The impact of hunting on tropical mammal and bird populations. Science 2017, 356, 180–183. [Google Scholar] [CrossRef]
  28. Schut, A.G.T.; Reymann, W. Towards a better understanding of soil nutrient dynamics and P and K uptake. Plant Soil 2023, 492, 687–707. [Google Scholar] [CrossRef]
  29. Bao, W.; He, P.; Han, L.; Wei, X.; Feng, L.; Zhu, J.; Wang, J.; Yang, X.; Li, L.-J. Soil nitrogen availability and microbial carbon use efficiency are dependent more on chemical fertilization than winter drought in a maize-soybean rotation system. Front. Microbiol. 2024, 15, 1304985. [Google Scholar] [CrossRef]
  30. Fu, H.; Chen, H.; Ma, Q.; Chen, B.; Wang, F.; Wu, L. Planting and mowing cover crops as livestock feed to synergistically optimize soil properties, economic profit, and environmental burden on pear orchards in the Yangtze River Basin. J. Sci. Food Agric. 2023, 103, 6680–6688. [Google Scholar] [CrossRef]
  31. Ma, D.K.; Yin, L.N.; Ju, W.L.; Li, X.K.; Liu, X.X.; Deng, X.P.; Wang, S.W. Meta-analysis of green manure effects on soil properties and crop yield in northern China. Field Crops Res. 2021, 266, 108146. [Google Scholar] [CrossRef]
  32. Seitz, V.A.; Mc Givern, B.B.; Borton, M.A.; Chaparro, J.M.; Schipanski, M.E.; Prenni, J.E.; Wrighton, K.C. Cover crop root exudates impact soil microbiome functional trajectories in agricultural soils. Microbiome 2024, 12, 183. [Google Scholar] [CrossRef] [PubMed]
  33. Alvarez, R.; Steinbach, H.S.; De Paepe, J.L. Cover crop effects on soils and subsequent crops in the pampas: A meta-analysis. Soil Tillage Res. 2017, 170, 53–65. [Google Scholar] [CrossRef]
  34. Thapa, V.R.; Ghimire, R.; Acosta-Martinez, V.; Marsalis, M.A.; Schipanski, M.E. Cover crop biomass and species composition affect soil microbial community structure and enzyme activities in semiarid cropping systems. Appl. Soil Ecol. 2021, 157, 103735. [Google Scholar] [CrossRef]
  35. Chai, Y.; Chai, Q.; Li, R.; Li, Y.; Yang, C.; Cheng, H.; Chang, L.; Chai, S. Straw strip mulching in a semiarid rainfed agroecosystem achieves winter wheat yields similar to those of full plastic mulching by optimizing the soil hydrothermal regime. Crop J. 2022, 10, 879–892. [Google Scholar] [CrossRef]
  36. Lucas, M.; Nguyen, L.T.T.; Guber, A.; Kravchenko, A.N. Cover crop influence on pore size distribution and biopore dynamics: Enumerating root and soil faunal effects. Front. Plant Sci. 2022, 13, 928569. [Google Scholar] [CrossRef]
  37. Ning, Y.; Zhang, X.; Li, B.; Wang, Y.; Guo, J. Distribution of Cd and Cu Fractions in Chinese Soils and Their Relationships with Soil pH: A Meta-Analysis. Sustainability 2019, 11, 337. [Google Scholar] [CrossRef]
  38. Yang, Y.; Zou, J.; Huang, W.H.; Olesen, J.E.; Li, W.J.; Rees, R.M.; Harrison, M.T.; Feng, B.; Feng, Y.P.; Chen, F.; et al. Drivers of soybean-based rotations synergistically increase crop productivity and reduce GHG emissions. Agric. Ecosyst. Environ. 2024, 372, 109094. [Google Scholar] [CrossRef]
  39. Richardson, A.E.; Simpson, R.J. Soil Microorganisms Mediating Phosphorus Availability. Plant Physiol. 2011, 156, 989–996. [Google Scholar] [CrossRef]
  40. Adhikari, A.D.; Shrestha, P.; Ghimire, R.; Liu, Z.M.; Pollock, D.A.; Acharya, P.; Aryal, D.R. Cover crop residue quality regulates litter decomposition dynamics and soil carbon mineralization kinetics in semi-arid cropping systems. Appl. Soil Ecol. 2024, 193, 105160. [Google Scholar] [CrossRef]
  41. Zhu, Z.; Fang, Y.; Liang, Y.; Li, Y.; Liu, S.; Li, Y.; Li, B.; Gao, W.; Yuan, H.; Kuzyakov, Y.; et al. Stoichiometric regulation of priming effects and soil carbon balance by microbial life strategies. Soil Biol. Biochem. 2022, 169, 108669. [Google Scholar] [CrossRef]
  42. Arenberg, M.R.; Arai, Y. Nitrogen species specific phosphorus mineralization in temperate floodplain soils. Sci. Rep. 2021, 11. [Google Scholar] [CrossRef]
  43. Sun, J.; Niu, W.; Du, Y.; Ma, L.; Huang, S.; Mu, F.; Zhang, Q.; Li, G.; Zhu, J.; Siddique, K.H.M. Regionally adapted conservation tillage reduces the risk of crop yield losses: A global meta-analysis. Soil Tillage Res. 2024, 244, 106265. [Google Scholar] [CrossRef]
  44. Li, J.; Sang, C.P.; Yang, J.Y.; Qu, L.R.; Xia, Z.W.; Sun, H.; Jiang, P.; Wang, X.G.; He, H.B.; Wang, C. Stoichiometric imbalance and microbial community regulate microbial elements use efficiencies under nitrogen addition. Soil Biol. Biochem. 2021, 156, 108207. [Google Scholar] [CrossRef]
Figure 1. Preferred reporting items for systematic reviews and meta-analyses (PRISMA) flow diagram for manuscript selection.
Agronomy 15 01756 g001
Figure 2. Geographic distribution of cover cropping experiments across 104 independent study sites included in the meta-analysis.
Agronomy 15 01756 g002
Figure 3. Effects of different cover crop types on soil physicochemical properties. Panels (ai) represent changes in (a) bulk density, (b) soil pH, (c) total nitrogen (TN), (d) hydrolysable nitrogen (AN), (e) total phosphorus (TP), (f) available phosphorus (AP), (g) available potassium (AK), and (h) soil organic matter (SOM), and (i) microbial biomass carbon (MBC).
Agronomy 15 01756 g003
Figure 4. Context-dependent effects of cover cropping on soil properties across gradients of initial soil properties. Panels (ai) represent changes in (a) bulk density, (b) soil pH, (c) total nitrogen (TN), (d) hydrolysable nitrogen (AN), (e) total phosphorus (TP), (f) available phosphorus (AP), (g) available potassium (AK), and (h) soil organic matter (SOM), and (i) microbial biomass carbon (MBC).
Agronomy 15 01756 g004
Figure 5. Relationship between effect size and nitrogen (N) input rate. Panels (ai) represent changes in (a) bulk density, (b) soil pH, (c) total nitrogen (TN), (d) hydrolysable nitrogen (AN), (e) total phosphorus (TP), (f) available phosphorus (AP), (g) available potassium (AK), and (h) soil organic matter (SOM), and (i) microbial biomass carbon (MBC). The red line represents the fitted effect size curve, while the blue circles indicate individual effect sizes. The shaded area around the red line represents the confidence interval.
Agronomy 15 01756 g005
Figure 6. Relationship between effect size and phosphorus (P) input rate. Panels (ai) represent changes in (a) bulk density, (b) soil pH, (c) total nitrogen (TN), (d) hydrolysable nitrogen (AN), (e) total phosphorus (TP), (f) available phosphorus (AP), (g) available potassium (AK), and (h) soil organic matter (SOM), and (i) microbial biomass carbon (MBC). The red line represents the fitted effect size curve, while the blue circles indicate individual effect sizes. The shaded area around the red line represents the confidence interval.
Agronomy 15 01756 g006
Figure 7. Relationship between effect size and potassium (K) input rate. Panels (ai) represent changes in (a) bulk density, (b) soil pH, (c) total nitrogen (TN), (d) hydrolysable nitrogen (AN), (e) total phosphorus (TP), (f) available phosphorus (AP), (g) available potassium (AK), and (h) soil organic matter (SOM), and (i) microbial biomass carbon (MBC). The red line represents the fitted effect size curve, while the blue circles indicate individual effect sizes. The shaded area around the red line represents the confidence interval.
Agronomy 15 01756 g007
Figure 8. Effects of cover cropping duration (years) on soil physicochemical properties based on meta-regression analysis. Panels (ai) represent changes in (a) bulk density, (b) soil pH, (c) total nitrogen (TN), (d) hydrolysable nitrogen (AN), (e) total phosphorus (TP), (f) available phosphorus (AP), (g) available potassium (AK), and (h) soil organic matter (SOM), and (i) microbial biomass carbon (MBC). The red line represents the fitted effect size curve, while the blue circles indicate individual effect sizes. The shaded area around the red line represents the confidence interval.
Agronomy 15 01756 g008
Disclaimer/Publisher’s Note: The statements, opinions and data contained in all publications are solely those of the individual author(s) and contributor(s) and not of MDPI and/or the editor(s). MDPI and/or the editor(s) disclaim responsibility for any injury to people or property resulting from any ideas, methods, instructions or products referred to in the content.

