Article

Limited Short-Term Impact of Annual Cover Crops on Soil Carbon and Soil Enzyme Activity in Subtropical Tree Crop Systems

Faculty of Science and Engineering, Southern Cross University, Military Rd, East Lismore, NSW 2480, Australia
*
Author to whom correspondence should be addressed.
Agronomy 2025, 15(7), 1750; https://doi.org/10.3390/agronomy15071750
Submission received: 3 June 2025 / Revised: 17 July 2025 / Accepted: 18 July 2025 / Published: 21 July 2025
(This article belongs to the Section Farming Sustainability)

Abstract

In wet subtropical environments, perennial groundcovers are common in horticultural plantations to protect the soil from erosion. However, there has been little investigation into whether seeding annual cover crops into the perennial groundcovers provides additional soil services including carbon and nutrient cycling in these systems. To investigate this, farmer participatory field trials were conducted in commercial avocado, macadamia, and coffee plantations in the wet Australian subtropics. Cover crops were direct-seeded into existing inter-row groundcovers in winter (cool season cover crops), and into the same plots the following summer (warm season cover crops). Inter-row biomass was quantified at the end of winter and summer in the control (no cover crop) and cover crops treatments. Soil carbon and nutrient cycling parameters including hot water extractable carbon, water soluble carbon, autoclavable citrate-extractable protein and soil enzyme activities were quantified every two months from early spring (September) 2021 to late autumn (May) 2022. Seeded cover crops produced 500 to 800 kg ha−1 more total inter-row biomass over winter at the avocado coffee sites, and 3000 kg ha−1 biomass in summer at the coffee site. However, they had no effect on biomass production in either season at the macadamia site. Soil functional parameters changed with season (i.e., time of sampling), with few significant effects of cover crop treatments on soil function parameters across the three sits. Growing a highly productive annual summer cover crop at the coffee site led to suppression and death of perennial groundcovers, exposing bare soil in the inter-row by 3 weeks after termination of the summer cover crop. Annual cover crops seeded into existing perennial groundcovers in tree crop systems had few significant impacts on soil biological function over the 12-month period, and their integration needs careful management to avoid investment losses and exacerbating the risk of soil erosion on sloping lands in the wet subtropics.

1. Introduction

Around 10% of global cropland is used for permanent (perennial) crops, equating to >86 Mha worldwide [1]. In tropical and subtropical areas, these perennial systems include commodity crops such as avocado (Persea americana Mill.) and coffee (Coffea arabica), as well as a range of other niche tree crops with regional importance [2]. Among niche tree crops grown in tropical and subtropical regions, Macadamia (Macadamia integrifolia Maiden and Beche) is a high value crop that represents around 1.2% of global nut production, with more than 50% of global production occurring in South Africa and Australia [3].
In subtropical tree crop systems on the east coast of Australia, high annual rainfall (1500–2000 mm year−1) and sloping land has driven producers to maintain perennial groundcovers to protect the soil from erosion. Early studies identified shade-tolerant, prostrate grasses Dactyloctenium australe (sweet smothergrass) and Microlaena stipoides (weeping grass), and the prostrate, shade-tolerant perennial legume Arachis pintoi (pinto peanut) as suitable groundcovers to protect the soil in macadamia plantations [4,5]. The presence of groundcovers and associated water use has no detectable effects on macadamia tree health [4,5], likely due the high rainfall in the region. More recently, we have shown that pinto peanut produces 4–6 t biomass ha−1 year−1 as a groundcover in coffee [6] and avocado [7] plantations, and can fix up to 150 kg shoot N ha−1 year−1 in coffee plantations [7]. These perennial groundcovers therefore make a substantial contribution to the sustainability of perennial tree cropping systems of the wet subtropics.
Annual cover crops are widely promoted to provide insect habitat and increase beneficial insect populations, and to protect the soil from erosion [8,9,10,11] in perennial horticulture systems. However, to fully assess the impacts of cover crops on ecosystem services in these systems, their effect on soil services such as carbon storage and nutrient cycling should also be examined. A number of studies have observed increases in soil biology measures, soil carbon (C) and soil functional indices due to the use of cover crops in perennial tree crop systems [1,12,13,14], however, most studies examine the effects of annual cover crops species compared to bare fallow controls. When comparing a cover crop to a fallow, it could be expected that there is a large scope to shift the soil microbiome and soil function parameters because of the substantial difference in C inputs and then further nutrient cycling shifts as a result of increased organic matter [1]. These systems are vastly different to tropical tree crop systems where annual cover crops are seeded into existing permanent groundcovers, therefore representing a key knowledge gap for decision makers. However, evidence exists to suggest plant diversity may have an impact [15].
Improved soil biological function due to the use of mixed-species annual cover crops in the inter-row of tree crops where permanent groundcover exists has not been demonstrated in this environment. The aim of the present study was therefore to examine the impact of short-term cover crops over-sown into existing perennial groundcovers on soil C and N, protein and enzyme activity associated with the cycling of soil nutrients. These were compared to control treatments with no annual cover crops, across three typical tree crop systems in the subtropics. If additional benefits are not generated, then the cost of implementing this practice is a direct loss for farm decision makers. This study therefore aims to generate this information for informed decision making and investment regarding the sustainability of perennial tree cropping systems. This information is further important for demonstrating sustainability credentials within the industry.

2. Materials and Methods

Field trials were established on commercial avocado, macadamia, and coffee plantations in the Northern Rivers region in the northeast of NSW, Australia, in winter 2021. The soil type at each site was a red Ferralsol [16]. Climate at the sites is classed as subtropical with mean annual rainfall of 1300 mm and mean annual temperatures of 19 °C. Over the duration of the trial, monthly average temperatures ranged from 14 to 24 °C, while the sites received 2600–2800 mm of rainfall (Figure 1). The majority of this rain was received in January and February of 2022. Select soil properties at the start of each trial are presented in Table 1.

2.1. Study Sites

2.1.1. Macadamia Plantation, Alstonville NSW

The Macadamia site was established within a block of 25-year-old macadamia trees on 9 m row spacing near the town of Alstonville, NSW. Cover crop treatments were established as three individual 10-metre-long plots within a single inter-row. These were each interspersed with 10-metre-long control (no cover crop) plots (i.e., three replicates). Control plots comprised existing groundcovers that were allowed to grow (no mowing) until termination of the cover crops. The existing dominant species were sweet smother grass, prairie grass (Bromus catharticus Vahl) and broadleaf paspalum (Paspalum mandiocanum Trin.) (Supplementary Table S1).
The winter cover crop was sown on 24 June 2021 after harvest of the 2021 macadamia crop and following mowing of existing groundcovers. After mowing existing groundcover, the cover crops were sown in 1.5 m wide strips in the middle of the inter-row using a Kimseed disc seeder at rates given in Table 2. Groundcover under the macadamia trees (in the tree line) was mowed by the farmer while the inter-row was unmown, leaving a ‘mohawk’ (Supplementary Figure S1a–c). The winter cover crop plots and control plots were mulched on 10 November 2021 using the farmer’s commercial mulcher.
The summer cover crop was sown on 11 November 2021 at the rates shown in Table 2 by direct seeding into the mulched winter cover crop plots using the Kimseed disc seeder. Control plots were not sown and were allowed to regrow. The summer cover crop was mulched on 10 February 2022 using the farmer’s mulcher.

2.1.2. Avocado Plantation, Alstonville NSW

The Avocado site was established in a block of 4-year-old Hass avocado trees near Alstonville, NSW. The trees were planted on 1.5-metre-high mounds, with 6 m between mounds (row spacing) and 3 m between trees in a row. Three treatment plots comprised the entire inter-row length of the 40-metre-long rows, with alternate inter-rows designated as control or cover crop plots (i.e., three replicates).
The winter cover crop was sown on 9 June 2021 at rates given in Table 2 after mowing of existing groundcovers to around 4 cm height. The dominant species in the existing groundcover were kikuyu (Cenchrus clandestinus) and cobbler’s peg (Bidens pilosa) (Supplementary Table S1). Cover crops were grown in the inter-row space between mounds, but not on the mounds (Supplementary Figure S1a–c). Winter cover crops (and vegetation in control plots) were slashed on 27 October 2021 using the farmer’s slasher.
The summer cover crop was sown on 19 November 2021 at rates shown in Table 2 by direct seeding into the slashed winter cover crop plots using the Kimseed disc seeder. Control plots were not sown and were allowed to regrow following slashing of the winter growth. Cover crop and control treatments were slashed on 17 March 2022 using the farmer’s slasher.

2.1.3. Coffee Plantation, Newrybar NSW

The Coffee site was established in a block of 30-year-old K7 coffee trees near Newrybar, NSW. The trees were planted in rows 4 m apart with 1 m between trees within a row. Plots were a single 30 m length of an individual inter-row, with alternate inter-rows designated as control or cover crop plots. There were three replicate plots of each treatment.
The winter cover crop was sown on 9 June 2021 at rates given in Table 2 after mowing existing groundcovers to approximately 2 cm height. The dominant species present were broadleaf paspalum, sweet smother grass, and prairie grass (Supplementary Table S1). Cover crops were sown in a 1-metre-wide area in the middle of the inter-row with a GreenPRO GP1200 seeder (Coolum Beach, Australia) towed by a quadbike. Cover crop and control treatments were slashed on 28 October 2021 using the farmer’s slasher.
The summer cover crop was sown on 26 November 2021 at rates shown in Table 2 by direct seeding into the slashed winter cover crop plots using the GreenPRO GP1200 seeder towed by a quadbike. Control plots were not sown and were allowed to regrow after slashing of the winter growth. Cover crop and control treatments were slashed on 18 March 2022 using the farmer’s slasher.

2.2. Biomass Measurements

Cover crop emergence counts were taken 2–3 weeks after sowing at each site by counting seedlings of each species along the length of both sides of a 1 m ruler at two random locations in each plot. Prior to the mulching of cover crops and ground covers in control plots, biomass assessments were made by cutting shoots at ground level from two randomly placed 0.5 × 0.5 m2 quadrats per plot. In control plots, plant material was separated into endemic broadleaf species and endemic grass species. In cover crop plots, each cover crop species was separated, and the remaining material was separated into endemic broadleaf species and endemic grass species. All plant material was then dried in an oven at 60 °C for 5 days and weighed.

2.3. Soil Sampling

Several soil biological indicators were assessed every 2 months over the duration of the trials. Soil samples were obtained by taking 10 cores from the 0–10 cm soil layer of each plot using a 30 mm diameter soil corer and compositing the sample to provide one sample per plot. Composite samples were stored in an insulated container at the site before being transported back to Southern Cross University, Lismore, for further analysis. Samples were then dried in an oven at 40 °C for 5 days, homogenised and sieved to <2 mm before analysis for total soil C, total soil N (SN), hot water extractable organic C (HWC), water soluble C (WSC), autoclavable citrate extractable (ACE) soil protein and soil enzyme activities.

2.4. Soil Function Measurements

Total soil C and soil N (SN) were determined via dry combustion [17]. As soil pH at all sites was <6, total carbon was assumed to equate to soil organic C (SOC). The C to N ratio (CN ratio) was calculated from the dry combustion concentrations. HWC was determined following the extraction of WSC from 3 g of sample [18]. For this initial extraction, 30 mL of distilled water was added to the subsample and shaken for 30 min [18]. This was then centrifuged for 20 min at 3500 rpm and filtered through a 0.45 µm membrane filter. The HWC extraction was then conducted on the remaining sediment by adding another 30 mL of water and shaking for 10 s. Samples were then placed in a water bath at 80 °C for 16 h [18]. Following this they were centrifuged at 3500 rpm for 20 min and filtered again. The total carbon content of the extract was then determined using a TOC analyser to give HWC.
The activity of several soil enzymes was quantified in a soil suspension using fluorescent enzyme substrates, as described by [19,20], with slight modification. Briefly, air-dried soil (1 g) was weighed into a 50 mL polypropylene centrifuge tube and 25 mL of deionized (MilliQ) water added to each centrifuge sample. The soil suspensions were shaken horizontally on an orbital shaker at 200 revolutions minute−1 for 30 min. A 100 µL aliquot of soil suspension was transferred in triplicate into another 96-well deep-well plate prefilled with 900 μL distilled water to dilute the sample further, to a final dilution of 1:100 soil/solution. An aliquot of this 1:100 diluted soil suspension (100 µL) was then transferred into a black 96-well microtiter plate prefilled with 50 µL of modified universal buffer adjusted to the site-average soil pH. 100 µL of deionised water was plated into five wells as hydrolysis blanks. Two standard curves were plotted for each measurement plate: one for soil (dilution series of 200 μM 4-methylumbelliferyl (MUF) in 50 µL of soil suspension) and the other for hydrolysis (dilution series of 200 μM MUF in 50 µL of distilled water). MUF substrates (1 mM) were prepared individually for β-glucosidase, arylsulfatase, chitinase, phosphomonoesterase, esterase, and leucine aminopeptidase [20]. These enzymes were selected as their activity influences the cycling of C, N, phosphorus, and sulphur in the soil [20]. After adding 50 µL of substrates to soil and hydrolysis wells, the microtiter plate was immediately read at a wavelength of 450 nm in fluorescence mode using a fluorescent microplate reader (BMG labtech FLUOstar Omega) as time zero readings. The plates were then placed in an incubator at 37 °C and read again after 2 h.
Soil protein was determined on 3 g duplicates of each sample [21]. An amount of 24 mL of 20 mM sodium citrate was added, and the solution was shaken at 180 rpm for 5 min. The samples were then autoclaved at full temperature for 30 min. A total of 1.75 mL of solution was extracted and centrifuged for 3 min at 10,000× g. 10 µL of the resulting liquid was added to 200 µL of BCA protein reagent and then heated at 61.5 °C for 1 h. Using the BCA reagent as a standard calibration, absorbance at 450 nm was then used to determine the concentration of protein.

2.5. Statistical Analysis

Dependency between sites for winter and summer biomass production was assessed using the Granger test (lmtest v 0.9-40; [22]). Winter and summer biomass datasets for all sites were found to be independent of each other. The normality of biomass data was assessed using a Shapiro–Wilk test. Biomass from the winter and summer cuts at all sites were found to be significantly (p < 0.05) non-normal distributed. Therefore, biomass production in treatments was assessed for significant differences using a Kruskal–Wallis test and a significance level of 0.05. These steps were carried out using the native R functions [23].
For each soil variable, dependency between sites was tested using the Granger test. All sites were found to be independent, and therefore differences in soil properties between the control and cover crop treatments were determined for each site individually. For each site, a linear mixed model was created examining treatment, sampling date and their interaction as fixed effects, and block as a random effect on each soil variable. Significant differences between treatments, sampling dates, and their interactions were then assessed using an ANOVA and post hoc testing was conducted using estimated marginal means. This utilised the lme4 (v 1.1-37; [24]) and emmeans (v 1.11.0; [25]) packages in R (version 4.2.3).

3. Results

3.1. Biomass and Species Composition in Winter/Summer Cover Crop and Control Treatments

3.1.1. Macadamia Site

At termination of the winter cover crop, the control treatment had 919 kg ha−1 biomass (Table 3), of which over 96% was endemic grass species (Table 4). The cover crop treatment produced 869 kg ha−1 biomass, which was 68% endemic grass species, 19% cereale rye, 3% mustard, and 8% endemic broadleaf species (Table 4). Cover crop and control treatments produced a similar amount of biomass over the summer period (3.2–3.6 t ha−1), with buckwheat comprising 51% of biomass in the cover crop treatment prior to termination (Table 5). Endemic grasses produced 94% of biomass in the control treatment over summer (Table 5).

3.1.2. Avocado Site

The winter cover crop treatment produced double the biomass of the control treatment at termination (1677 vs. 826 kg ha−1) (Table 3). Around half of the biomass in the over crop treatment was from sown species, mainly radish (23%) and cereale rye (15%) (Table 3). The control treatment comprised 60% endemic grass biomass and 40% endemic broadleaf biomass (Table 3). Over the summer period, the summer cover crop treatment produced a similar amount of biomass to the control treatment (around 4.5 t ha−1) (Table 3). Cowpea contributed 58% of biomass in the cover crop treatment, with 26% contributed by endemic grasses and 11% by buckwheat (Table 4). Over 85% of total biomass in the control plots was from endemic grass species (Table 4).

3.1.3. Coffee Site

Cover crop treatments produced almost twice the biomass of the control treatments over winter (1154 vs. 620 kg ha−1) and over summer (6.2 vs. 3.3 t ha−1) (Table 3). Endemic grass species contributed 60% of the biomass in the winter cover crop treatment, with sown cereale rye contributing 22% (Figure 2). Almost all of the biomass in the winter and summer control treatments was contributed by endemic grass species in (Table 4 and Table 5). In the summer cover crop treatment, the vast majority of biomass was contributed by sown species; lablab 66%, chicory 15%, and sorghum 12% (Table 5). Observations 2–3 weeks after the termination of the summer cover crops indicated much of the perennial groundcover did not persist, resulting in bare ground that is susceptible to erosion in such a high intensity rainfall environment (Supplementary Figure S1d).

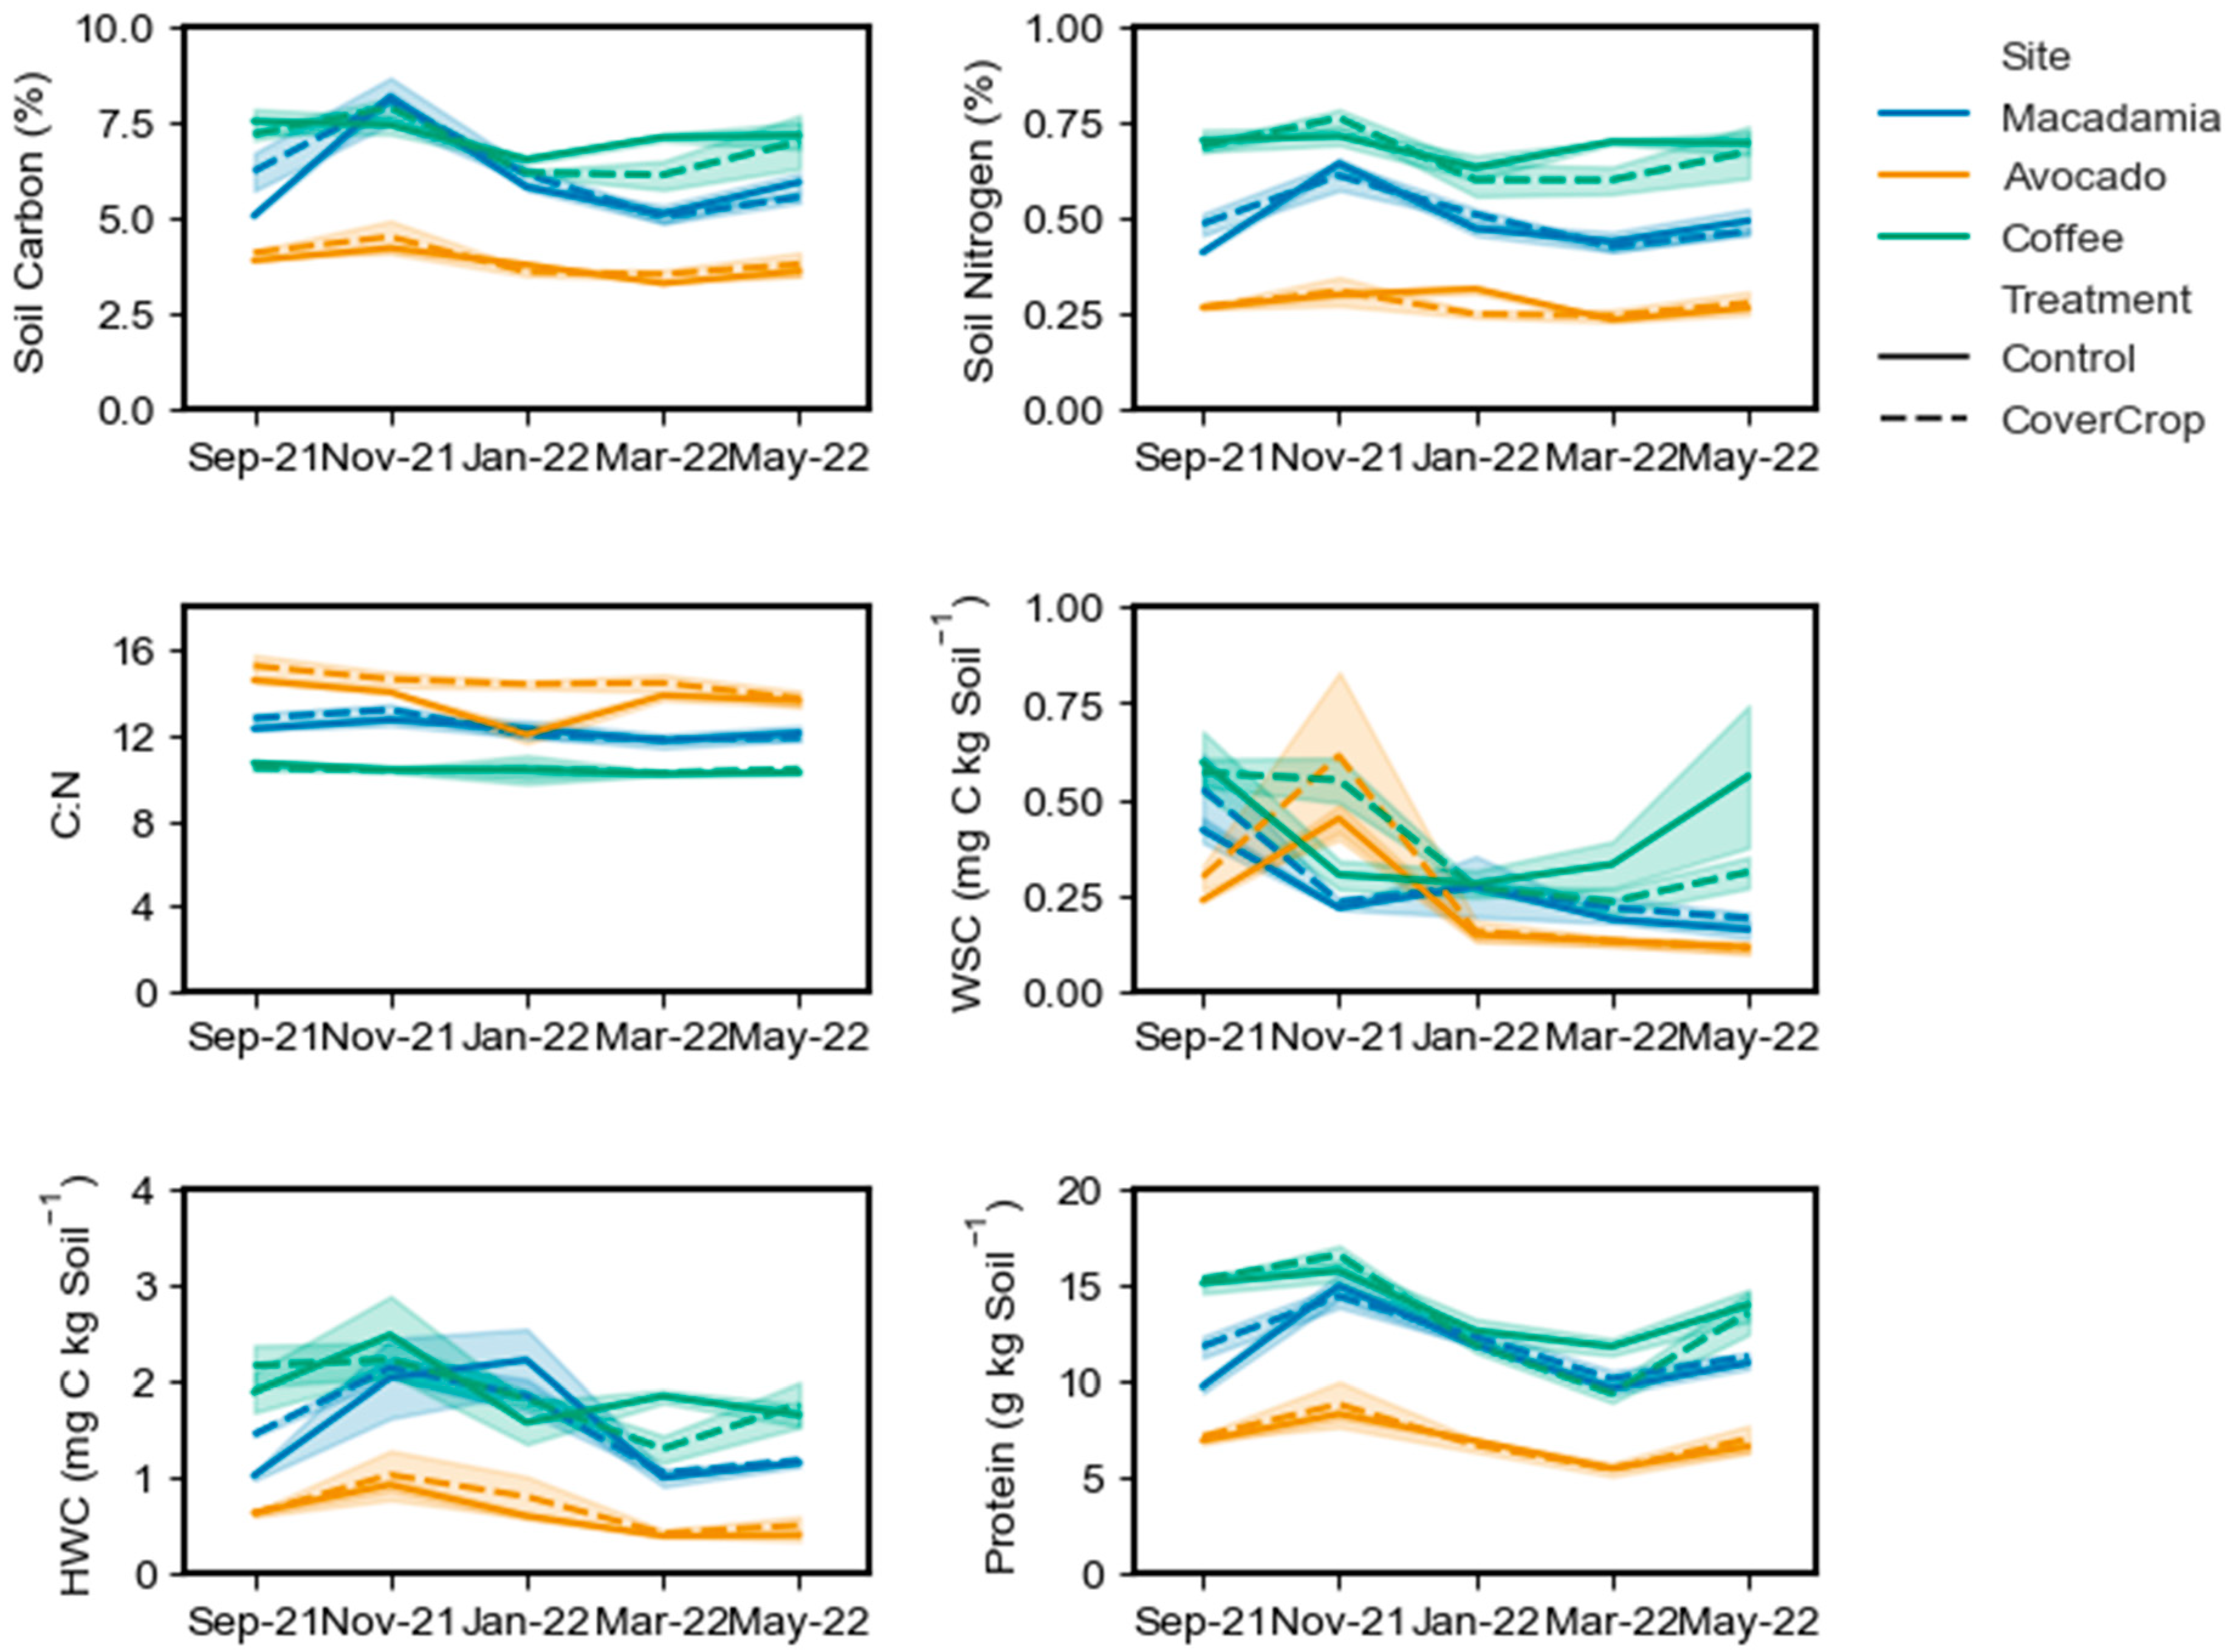
3.2. Soil Carbon, Nitrogen, and Enzyme Dynamics

For SOC, there was no significant treatment effect at any site (Table 6), however there was a significant effect of sample time. For the macadamia site, November 2021 had significantly higher (p < 0.001) SOC than all other time points with a site mean of 8.12% (Figure 2). There were no other differences between sampling time with March 2022 having the lowest value of 5.08% (Figure 2). At the avocado site, November 2021 had significantly higher (p < 0.02) TC (4.38%) than January 2022 (3.70%), March 2022 (3.42%), and May 2022 (3.72%) (Figure 2). September 2021 (4.01%) had significantly higher (p = 0.03) TC than March 2022 (Figure 2). For the coffee site, October and September 2021 sampling returned site mean SOC values of 7.67% and 7.36%; these values were significantly higher than January 2022, where the site mean was 6.37% (Figure 2).
SN showed a similar trend, with no treatment difference, but a significant temporal response at all sites (Table 6). At the macadamia site, SN was highest (p < 0.01) in October with a site mean of 0.63%, compared to values of 0.43–0.48% in other months (Figure 2). At the avocado site, the only two significantly different time points (p = 0.01) were November 2021 (0.31%) and March 2022 (0.24%) (Figure 2). At the coffee site, only November 2021 (0.74%) and January 2022 (0.62%) were significantly different (p = 0.02). The CN ratio showed no treatment response at the macadamia sites but did vary significantly over time. The site mean of 13.0 in November 2021, was significantly higher (p < 0.05) than January 2022 (12.2), March 2022 (11.8), and May 2022 (12.0) (Figure 2). September 2021 (12.5) was also significantly higher (p = 0.04) than March 2022. At the avocado site, there was a significant effect of treatment and time, as well as a significant interaction between the two for CN ratio (Table 6). Overall, the control mean of 13.6 was significantly lower (p < 0.01) than the cover crop treatment mean of 14.5. This was driven by a mean of 12 in the control treatment which was significantly lower than all other timepoints (Figure 2). At the coffee site, there was treatment or temporal response of CN ratio with site means ranging from 10.2 to 10.6 (Figure 2).
At the macadamia and avocado sites, there was no treatment effect on WSC but significant variation over time (Table 6). At the macadamia site, September 2021 had a significantly higher site mean (0.47 mg C kg soil−1; p < 0.01) than all other sample times where mean values ranged from 0.18 to 0.27 mg C kg soil−1 (Figure 2). At the avocado site, WSC was highest in November 2021 with a mean of 0.53 mg C kg soil−1 (Figure 2). This was significantly higher (p < 0.01) than all other time points where site mean ranged from 0.11 to 0.27 mg C kg soil−1 (Figure 2). At the coffee site, there was a significant response of WSC over time, but also a sampling time and treatment interaction (Table 6). This was driven by WSC in the control treatment declining from 0.60 mg C kg soil−1 in September 2021 to 0.30 mg C kg soil−1 in November 2021, while WSC in the cover crop treatment was not significantly different in November 2021 (0.55 mg C kg soil−1) to September 2021 (0.57 mg C kg soil−1) (Figure 2). By January 2022, there were no differences between treatments with means decreasing to 0.27 and 0.28 mg C kg soil−1 in the control and cover crop treatments, respectively (Figure 2). However, WSC increased to 0.56 mg C kg soil−1 in the control in May 2022, while remaining at a mean of 0.31 mg C kg soil−1 in the cover crop treatment (Figure 2).
This trend was not matched in HWC, with no treatment response at any site, but all sites having significant temporal variation (Table 6). At the macadamia site, HWC was highest in November 2021 and January 2022, with means of 2.08 and 2.03 mg C kg soil−1 respectively (Figure 2). These values were higher than all other time points (p < 0.01) with values ranging from 1.02 mg C kg soil−1 (March) to 1.24 mg C kg soil−1 (September) (Figure 2). At the avocado site, site mean HWC in November 2021 (0.98 mg C kg soil−1) was significantly higher (p < 0.01) than all other time points (0.41–0.63 mg C kg soil−1) except January 2022 (0.70 mg C kg soil−1) (Figure 2). HWC was not different between January 2022 and the other months (p > 0.1) (Figure 2). At the coffee site, there was no difference (p = 0.54) in site mean HWC between September 2021 (2.02 mg C kg soil−1) and November 2021 (2.35 mg C kg soil−1). November 2021, however, was significantly higher (p < 0.05) than all other months where means ranged from 1.57 to 1.70 mg C kg soil−1 (Figure 2).
Soil protein showed a treatment effect as well as significant temporal variation at the macadamia site (Table 6). The treatment effect was driven by higher soil protein in September 2021 (11.79 mg C kg soil−1 compared to 9.72 mg C kg soil−1 in the control) and an overall higher mean of 12.0 mg C kg soil−1 in the cover crop treatment compared to 11.4 mg C kg soil−1 in the control (Figure 2). Aside from the September time point, there were no significant differences between treatments. The temporal effect was driven by the highest values being observed in November 2021 (p < 0.01; Figure 2). At the avocado site, there was only a significant effect with sample time. The site mean of 8.56 mg C kg soil−1 in November 2021 was higher than all other sample times (p < 0.01). September 2021 (7.04 mg C kg soil−1) January 2022 (6.81 mg C kg soil−1) and May 2022 were not significantly different (p > 0.9), with March 2022 (5.47 mg C kg soil−1) significantly lower than September 2021 and January 2022 (p < 0.05). At the coffee site, there was a significant interaction between treatment and time of sampling on soil protein (Table 6). The temporal effect is driven by higher values across the September to January period with mean values varying from 12.60 to 15.72 mg C kg soil−1 in the control, and 11.87 to 16.55 mg C kg soil−1 in the cover crop treatment. There was then a general trend towards lower values in the cover crop treatment from January 2022 to May 2022; however, there were no individual treatment differences at the same time point (p = 0.15).
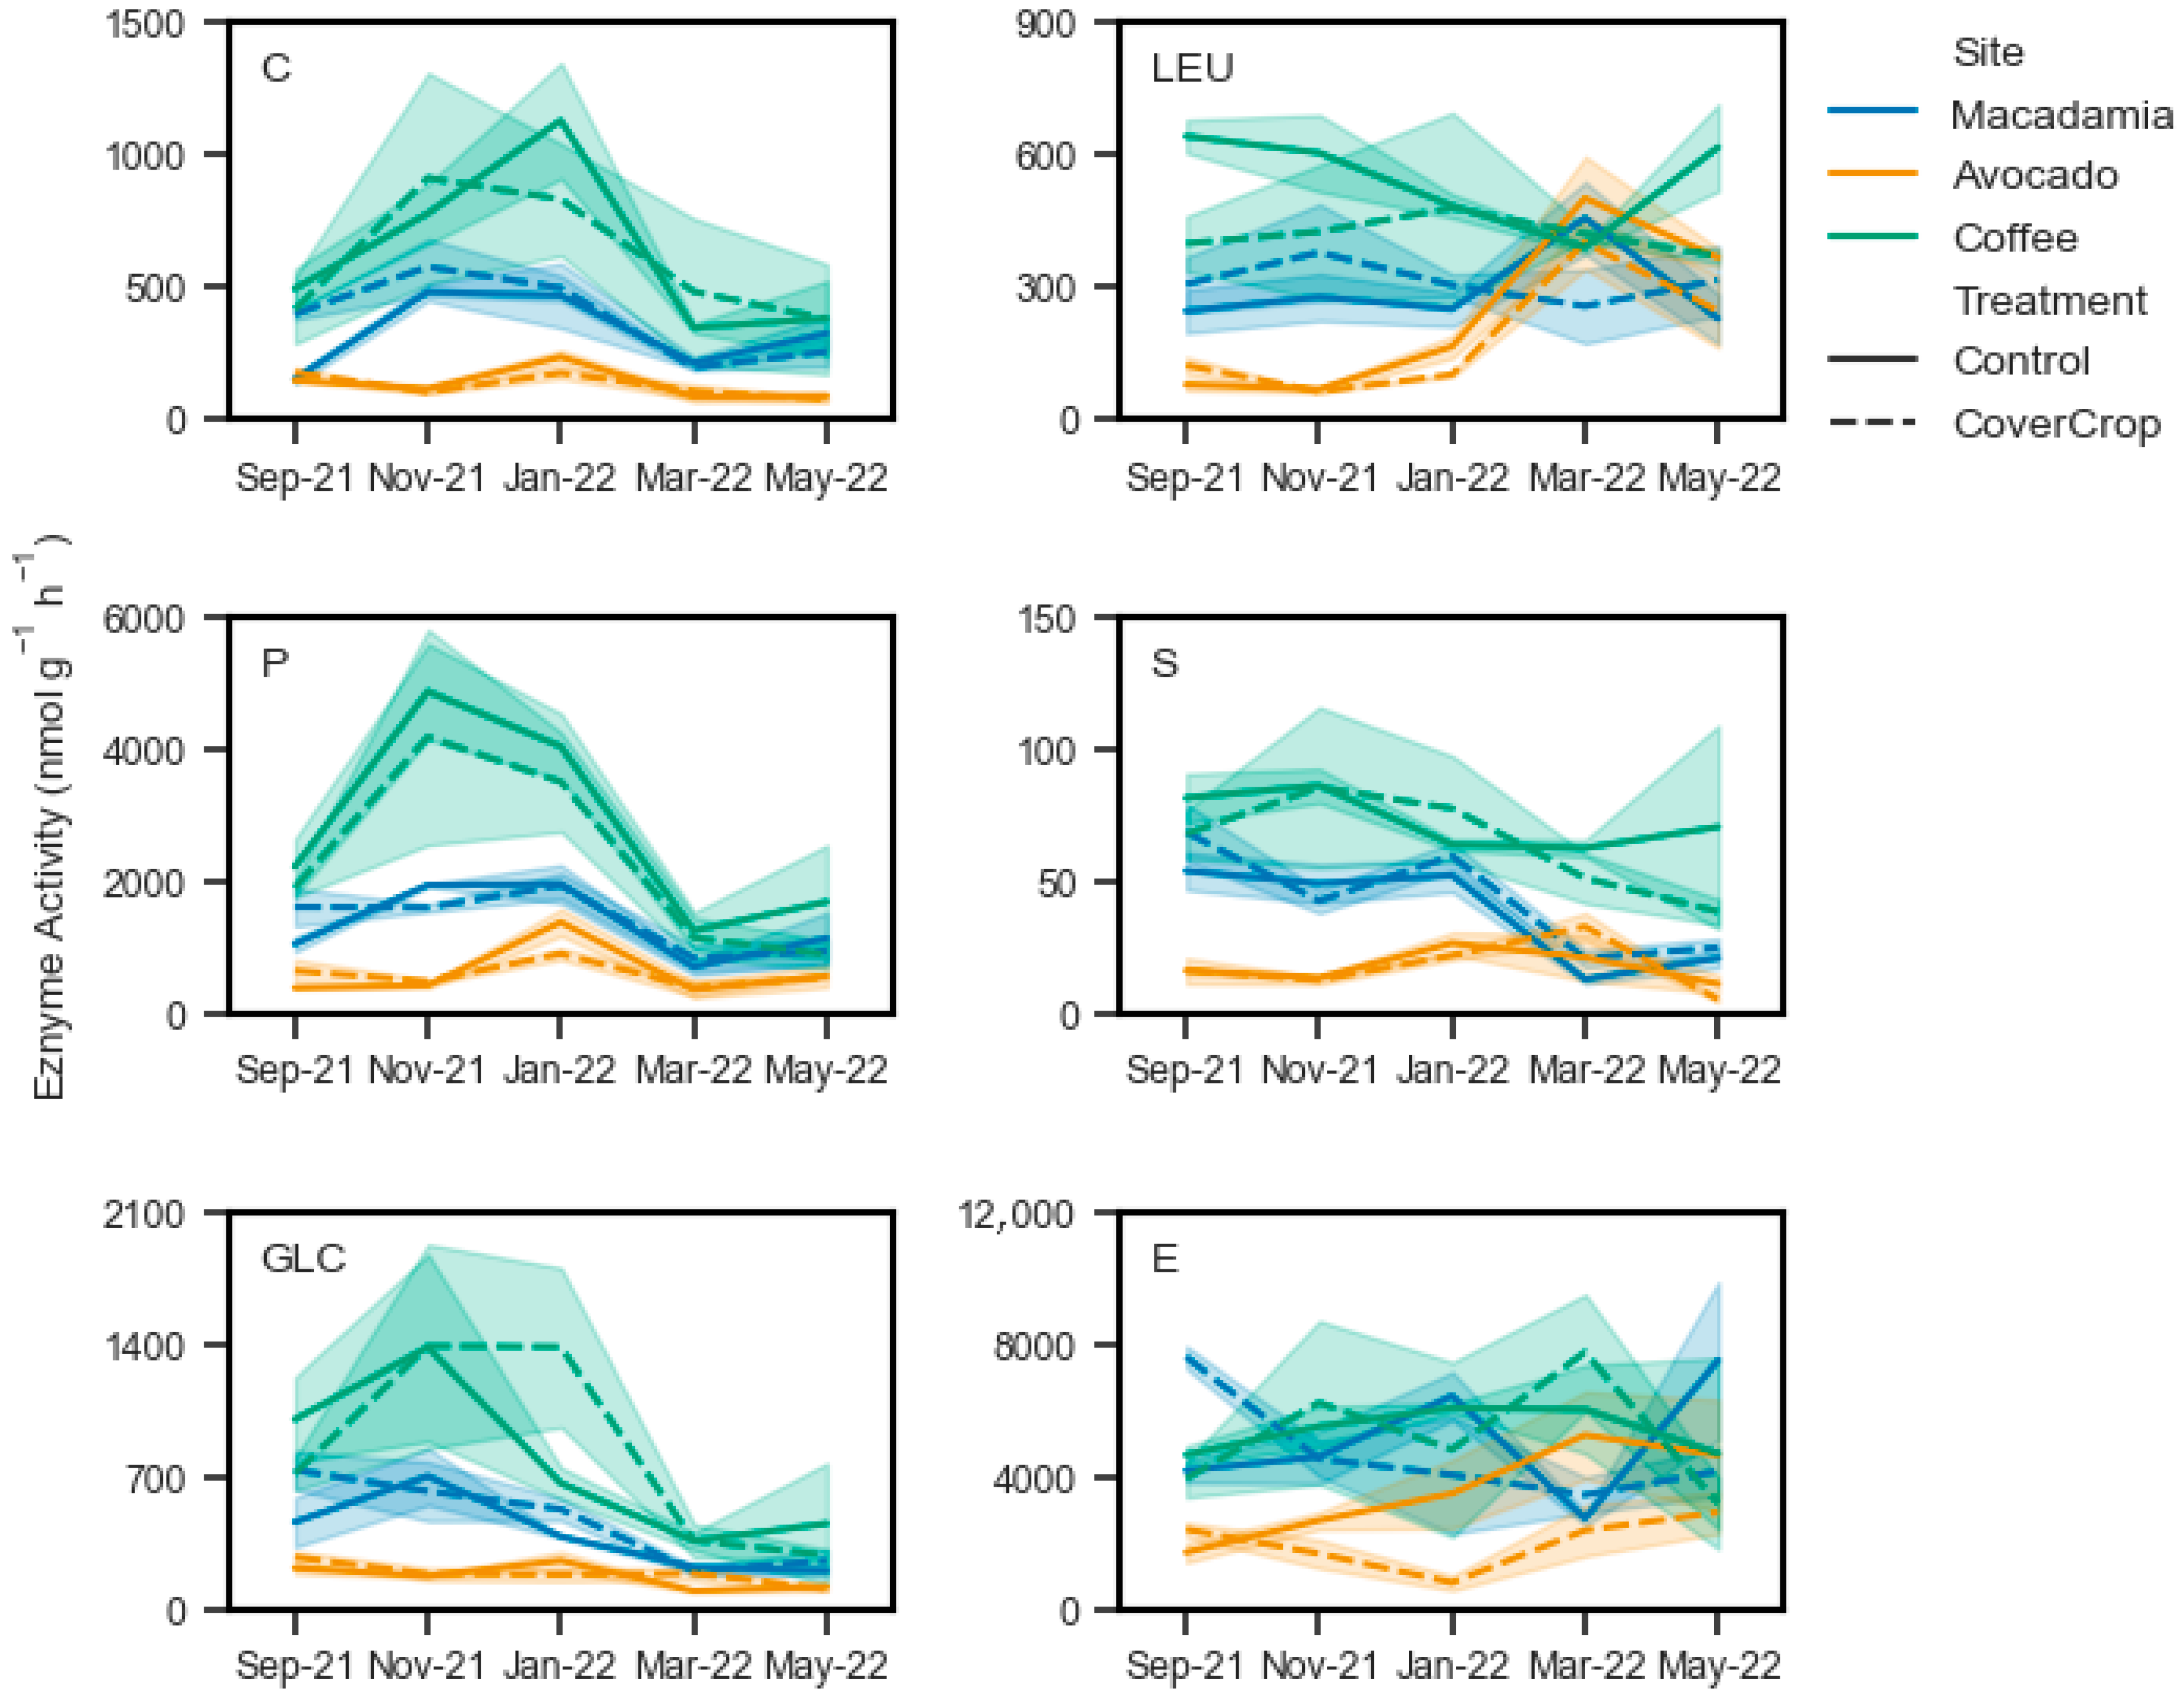
Chitinase activity did not show a treatment effect, but there was significant variation with sampling date at the macadamia and avocado sites (Table 6). At the macadamia site, site means in November 2021 (528 nmol g−1 h−1) and January (481 nmol g−1 h−1) were significantly higher than all other sample months (p < 0.05) (Figure 3). At the avocado site, the site mean of 203.5 nmol g−1 h−1 in January 2022 was significantly higher (p < 0.05) than means for November 2021 (107.2 nmol g−1 h−1), March 2022 (94 nmol g−1 h−1), and May (79.5 nmol g−1 h−1) (Figure 3). The site mean was 159.7 nmol g−1 h−1 in September 2021, which was only significantly higher than March 2022 and May 2022 (p < 0.02). At the coffee site, there were no significant differences (Table 6), with site means ranging from 980 nmol g−1 h−1 in January 2022 to 379 nmol g−1 h−1 in May 2022 (Figure 3). There were no differences (Table 6) between treatments of sample dates for leucine aminopeptidase activity at the macadamia (means 271 to 356 nmol g−1 h−1) or coffee sites (means 404 to 520 nmol g−1 h−1) (Figure 3). While at the avocado site, site means in March 2022 (450.3 nmol g−1 h−1) and May 2022 (305.3 nmol g−1 h−1) were higher (p < 0.01) than all other months with means ranging from 64.3 to 132.2 nmol g−1 h−1 (Figure 3).
Phosphomonoesterase activity did not respond to the different treatments but varied significantly with time (Table 6). Similarly to chitinase activity at the macadamia site, activity in September 2021 (1336 nmol g−1 h−1), November 2021 (1777 nmol g−1 h−1), and January 2022 (1951 nmol g−1 h−1) were significantly higher (p < 0.01) than March 2022 (774 nmol g−1 h−1) and May 2022 (1045 nmol g−1 h−1) (Figure 3). There were no differences between January 2022, November 2021, and September 2021 (p > 0.06) (Figure 3). Phosphomonoesterase activity was highest at the avocado site in January 2022, with a site mean of 1147 P nmol g−1 h−1 (Figure 3). This was significantly higher (p < 0.01) than all other time points with values ranging from 381 to 562 nmol g−1 h−1 (Figure 3). For the coffee site, phosphomonoesterase activity peaked in November 2021 at 4532 nmol g−1 h−1 (Figure 3). This was not significantly different to the site mean of 3777 nmol g−1 h−1 in January 2022 (p = 0.82). These two values were higher (p < 0.03) than all other sample points, with values ranging from 1203 to 2066 nmol g−1 h−1 (Figure 3). Arylsulfatase activity also showed no treatment response at any site, but did show significant variation over time at the macadamia and avocado sites (Table 6). Arylsulfatase activity was highest in September 2021 at the macadamia site, with a site mean of 61.3 nmol g−1 h−1 (Figure 3). This was not significantly different (p > 0.1) to activity in November 2021 (46 nmol g−1 h−1) and January 2022 (56 nmol g−1 h−1) (Figure 3). However, activity in these three months were all significantly higher (p < 0.01) than in March 2022 (17 nmol g−1 h−1) and May 2022 (23 nmol g−1 h−1) (Figure 3). At the avocado site with September 2021 (16.33 nmol g−1 h−1), March 2022 (27.17 nmol g−1 h−1) and January 2022 (24.33 nmol g−1 h−1) site means were significantly higher (p < 0.02) than November 2021 (13.17 nmol g−1 h−1) and May 2022 (nmol g−1 h−1) site means for arylsulfatase activity (Figure 3). There were no significant effects of treatment or time (p > 0.4) on arylsulfatase activity with mean values ranging from 54.7 nmol g−1 h−1 to 86 nmol g−1 h−1 (Figure 3).
β-glucosidase activity showed no treatment response also, but significant variation with sampling date at all sites (Table 6). At the macadamia site this was characterised again by the site mean in September 2021 (600 nmol g−1 h−1), November 2021 (665 nmol g−1 h−1), and January 2022 (458 nmol g−1 h−1) being significantly higher (p < 0.01) than March (213 nmol g−1 h−1) and May (230 nmol g−1 h−1) 2022 (Figure 3), but not different from each other (p > 0.5). At the avocado site, β-glucosidase activity was highest in September 2021, with a site mean of 246 nmol g−1 h−1 (Figure 3). This was significantly higher (p < 0.02) than activity measured in March (143 nmol g−1 h−1) and May (114 nmol g−1 h−1) 2022. Activity in November 2021 (182 nmol g−1 h−1) and January 2022 (220 nmol g−1 h−1) was not significantly different to any other month (p > 0.1) (Figure 3). At the coffee site, β-glucosidase activity peaked at 1388 nmol g−1 h−1, with this significantly higher (p < 0.03) than the site means of 363 and 369 nmol g−1 h−1 in March and May 2022, respectively. β-glucosidase activity in September 2021 (862 nmol g−1 h−1) and January 2022 (1027 nmol g−1 h−1) was not significantly different (p > 0.2) to any other month (Figure 3). At the macadamia site, esterase activity did not have a significant response to treatment or time (p > 0.05) (Table 6). Site mean values ranged from 3103 nmol g−1 h−1 (March 2022) to 5907 nmol g−1 h−1 (September 2021) (Figure 3). At the avocado site, there was significant treatment effect, with the overall mean in the control (3569 nmol g−1 h−1) being higher (p < 0.01; Table 6) than in the cover crop treatment (2044 nmol g−1 h−1). There was no significant response of esterase activity at the coffee site (Table 6), with site means ranging from 4312 to 6904 nmol g−1 h−1 (Figure 3).

4. Discussion

The biomass production from annual cover crops was not sufficient to shift the soil function parameters measured. Biomass production in the control treatments across sites (4–5 t ha−1) over the 9–10 month trial period is typical of biomass production of permanent groundcovers in coffee and avocado orchards in the region [6,7]. The effect of winter and summer cover crops on total biomass production depended on the season (summer/winter) and the site, and can be partially explained by the dominant perennial groundcovers at each site and their growth patterns. At the avocado site, the dominant perennial ground cover was kikuyu, which has vigorous summer growth but is largely dormant in the subtropics over the winter period owing to cooler temperatures [26]. Thus, over-sowing kikuyu with summer annual species improved plant diversity but did not increase summer biomass, while over-sowing the kikuyu-dominant ground cover in winter led to a doubling of winter biomass production. This is typical of many pasture-based production systems in the region that rely on over-sowing of winter annual species, predominantly ryegrass, to fill the winter feed gap created when perennial tropical pasture species such as kikuyu are dormant [27]. In contrast to the avocado site, the perennial groundcovers at the macadamia and coffee sites were dominated by shade-tolerant species such as sweet smother grass, broadleaf paspalum, and weeping grass. This is indicative of the low light levels in the inter-row due to the narrow row spacing in the coffee plantation and canopy management in the macadamia plantation. It is possible that the additional plant species sown in the annual cover crops did not increase biomass production in winter or summer at the macadamia site due to limited light, and the presence of both summer active (sweet smother grass and broadleaf paspalum) and winter active (prairie grass and weeping grass) species in the control plots. The doubling of winter and summer biomass in the inter-rows when annual cover crops were sown at the coffee site may be due to the presence of legumes in the cover crop mix (particularly lablab in the summer mix) which may have driven growth in a nitrogen-limited environment.
In studies investigating cover crops in the inter-rows of perennial orchards versus bare soil, improvements in soil biological parameters are typically seen in the cover crop treatments. For example, ref. [12] reported improvements in soil total organic C, particulate organic C, and soil aggregation under strawberry clover (Trifolium fragiferum L.) cover crops compared to bare fallow controls in an irrigated vineyard in a Mediterranean climate. Similar improvements in soil biological indices are also observed in tree cropping systems, such as apple [13] and almond [14] orchards. However, in the present study where annual cover crops were directly seeded into endemic permanent ground covers, significant changes in most soil function parameters occurred over time (i.e., seasonal effects), but overall, the cover crops had little impact. At the avocado site, this was perhaps unsurprising given that the cover crop treatment did not produce any additional biomass (soil C inputs) compared to the control treatment. However, the limited differences at the coffee site where cover crops produced double the inter-row biomass than the controls may be indicative of the dynamic nature of soil functional assays. For example, WSC was higher under cover crop plots (0.55 g kg−1) than control plots (0.30 g kg−1) immediately after termination of the winter cover crop in 2021, but by May 2022 WSC was significantly higher in control plots (0.56 g kg−1) than cover-crop plots (0.31 g kg−1). It is possible that the inputs of labile C in the cover crop treatments led to an initial increase in WSC that stimulated microbial activity, and these microbes subsequently metabolised this C leading to a decline [28,29]. However, as the initial C (5.7% across all sites) and N (0.48% across all sites) levels were high, with low C:N ratio (12.3 across all sites), a lack of a shift in soil health parameters over a short timeframe is not unexpected. This is due to initial soil health conditions being a major factor governing shifts in these indicators [30], where readily available soil N will not limit microbial processing of increased labile inputs [31]. However, the sustained use of cover crops should be considered in future work.
One potential issue with continual seeding of annual cover crops into perennial groundcovers is that the increased competition may weaken the perennial species, and ultimately cause plant death. This was observed at the coffee site where the vigorous annual summer cover crop caused suppression and death of many summer-active perennial species, which led to bare ground in the weeks after termination of the summer cover crop. On sloping lands in high rainfall environments this presents a strong erosion risk, an integration of annual cover crops in such situations requires careful management. Further studies aimed at refining the species mix and seeding rates, and/or the timing of cover crop termination, may identify management strategies that enable integration of summer cover crops without weakening or killing the perennial groundcovers.

5. Conclusions

Any integration of annual cover crops in tree crop systems with endemic perennial groundcovers needs to be appropriate for regional conditions. Where summer growing perennials are present, over-sowing winter annuals can produce more biomass overall without impacting on the persistence of the perennial groundcovers. Vigorous annual summer cover crops can produce additional biomass. However, there was little, positive impact on soil function parameters. Further, high biomass production can risk killing permanent summer growing perennials, creating bare ground which is then susceptible to erosion. Whether lower seeding rates to avoid intense competition could enable integration of summer cover crops without detrimental effects on perennial groundcovers is not known.

Supplementary Materials

The following supporting information can be downloaded at: https://www.mdpi.com/article/10.3390/agronomy15071750/s1, Figure S1: Inter-row in the control treatment in summer at the avocado site (A); in the summer cover crop before termination at the avocado site (B); at the coffee site 3 weeks after termination of summer cover crop in control plots (C); and at the coffee site 3 weeks after termination of summer cover crop in cover crop plots (D). Table S1: Species composition by dry weight (%) at macadamia, coffee and avocado sites prior to trial establishment.

Author Contributions

Conceptualization, T.J.R.; data curation, A.J.G., K.G., and M.T.R.; formal analysis, A.J.G., L.J.K., K.G., M.T.R., and T.J.R.; investigation, A.J.G., L.J.K., and K.G.; methodology, A.J.G., L.J.K., K.G., M.T.R., and T.J.R.; writing—original draft, A.J.G. and T.J.R.; writing—review and editing, L.J.K., K.G., M.T.R., and T.J.R. All authors have read and agreed to the published version of the manuscript.

Funding

This work was funded by the Australian Government Department of Agriculture, Forestry and Fisheries under the Carbon Farming Program.

Data Availability Statement

Data availability: Raw data are available from the corresponding author on request.

Acknowledgments

The authors express their thanks to the three landholders who participated in the study.

Conflicts of Interest

The authors declare no conflicts of interest.

Abbreviations

The following abbreviations are used in this manuscript:
ACEAutoclavable, citrate extractable
CCarbon
CNCarbon to nitrogen ratio
HWCHot water extractable carbon
MUF4-methylumbelliferyl
NNitrogen
SNTotal soil nitrogen
SOCSoil organic carbon
TOCTotal organic carbon
WSCWater soluble carbon

References

  1. Castellano-Hinojosa, A.; Strauss, S.L. Impact of Cover Crops on the Soil Microbiome of Tree Crops. Microorganisms 2020, 8, 328. [Google Scholar] [CrossRef]
  2. Kreitzman, M.; Toensmeier, E.; Chan, M.K.A.; Smukler, S.; Ramankutty, N. Perennial staple crops: Yields, distribution, and nutrition in the global food system. Front. Sustain. Food Syst. 2020, 4, 588988. [Google Scholar] [CrossRef]
  3. Shabalala, M.; Toucher, M.; Clulow, A. The macadamia bloom—What are the hydrological implications. Sci. Hortic. 2022, 292, 110628. [Google Scholar] [CrossRef]
  4. Firth, D.J.; Jones, R.M.; McFadyen, L.M.; Cook, B.G.; Whalley, R.D.B. Selection of pasture species for groundcover suited to shade in mature macadamia orchards in subtropical Australia. Trop. Grassl. 2002, 36, 1–12. [Google Scholar]
  5. Firth, D.J.; Johns, G.G.; Whalley, R.D.B. Glasshouse and field studies on the effects of groundcovers on banana and macadamia growth and water relations. Aust. J. Exp. Agric. 2003, 43, 1245–1254. [Google Scholar] [CrossRef]
  6. Rose, T.J.; Kearney, L.; Morris, S.; Van Zwieten, L.; Erler, D. Pinto peanut cover crop nitrogen contributions and potential to mitigate nitrous oxide emissions in subtropical coffee plantations. Sci. Total Environ. 2018, 1656, 108–117. [Google Scholar] [CrossRef]
  7. Rose, T.J.; Kearney, L. Biomass production and potential fixed nitrogen inputs from leguminous cover crops in subtropical avocado plantations. Agronomy 2019, 9, 70. [Google Scholar] [CrossRef]
  8. Arias-Giraldo, L.F.; Guzmán, G.; Montes-Borrego, M.; Gramaje, D.; Gómez, J.A.; Landa, B.B. Going beyond soil conservation with the use of cover crops in Mediterranean sloping olive orchards. Agronomy 2021, 11, 1387. [Google Scholar] [CrossRef]
  9. Ferschl, B.; Szalai, M.Z.; Gere, A.; Kocsis, T.; Kotroczó, Z. Effects of Species-Rich Perennial Inter-Row Cover on Weed Flora and Soil Coverage in an Apple Orchard, A Case Study of Opportunities and Limitations in a Dry Continental Climate. Agronomy 2024, 14, 2716. [Google Scholar] [CrossRef]
  10. Freidenreich, A.; Dattamudi, S.; Li, Y.; Jayachandran, K. Influence of leguminous cover crops on soil chemical and biological properties in a no-till tropical fruit orchard. Land 2022, 11, 932. [Google Scholar] [CrossRef]
  11. Ramírez Pérez, P.; López Granados, F.; León Gutiérrez, J.M.; Mesas Carrascosa, F.J.; Pérez Porras, F.; Torres Sánchez, J. Infuence of soil management on vegetative growth, yield, and wine quality parameters in an organic “Pedro Ximénez” vineyard: Field and UAV data. Agron. Sustain. Dev. 2024, 44, 10. [Google Scholar] [CrossRef]
  12. Abad, F.J.; Marín, D.; Imbert, B.; Virto, I.; Garbisu, C.; Santesteban, L.G. Under-vine cover crops: Impact on physical and biological soil proprieties in an irrigated Mediterranean vineyard. Sci. Hortic. 2023, 311, 111797. [Google Scholar] [CrossRef]
  13. Liu, C.-Y.; Wang, Y.-Y.; Chen, X.-Y.; Tan, H.; Jin, X.-M.; Lu, Q.; He, S.-B.; Long, M.-X. Cover cropping increases soil fungal-bacterial community diversity and network complexity in apple orchards on the Loess Plateau, China. Front. Environ. Sci. 2022, 10, 916288. [Google Scholar] [CrossRef]
  14. Rubio-Asensio, J.S.; Abbatantuono, F.; Ramírez-Cuesta, J.M.; Hortelano, D.; Ruíz, J.L.; Parra, M.; Martínez-Meroño, R.M.; Intrigliolo, D.S.; Buesa, I. Effects of Cover Crops and Drip Fertigation Regime in a Young Almond Agroecosystem. Agronomy 2022, 12, 2606. [Google Scholar] [CrossRef]
  15. Cappelli, S.L.; Domeignoz-Horta, L.A.; Loaiza, V.; Laine, A.-L. Plant biodiversity promotes sustainable agriculture directly and via belowground effects. Trends Plant Sci. 2022, 27, 675–687. [Google Scholar] [CrossRef]
  16. IUSS Working Group WRB. World Reference Base for Soil Resources. International Soil Classification System for Naming Soils and Creating Legends for Soil Maps, 4th ed.; International Union of Soil Sciences (IUSS): Vienna, Austria, 2022. [Google Scholar]
  17. Rayment, G.E.; Lyons, D.J. Soil Chemical Methods: Australasia; Rayment, G.E., Lyons, D.J., Eds.; CSIRO Publishing: Collingwood, VIC, Australia, 2011. [Google Scholar]
  18. Ghani, A.; Dexter, M.; Perrott, K.W. Hot-water extractable carbon in soils: A sensitive measurement for determining impacts of fertilisation, grazing and cultivation. Soil Biol. Biochem. 2003, 35, 1231–1243. [Google Scholar] [CrossRef]
  19. Marx, M.C.; Wood, M.; Jarvis, S.C. A microplate fluorimetric assay for the study of enzyme diversity in soils. Soil Biol. Biochem. 2001, 33, 1633–1640. [Google Scholar] [CrossRef]
  20. Turner, B.L. Variation in pH optima of hydrolytic enzyme activities in tropical rain forest soils. Appl. Environ. Microbiol. 2010, 76, 6485–6493. [Google Scholar] [CrossRef]
  21. Stott, D.E. Soil Health Technical Note No 450-03, Recommended Soil Health Indicators Associated Laboratory Procedures; U.S. Department of Agriculture, Natural Resources Conservation Service: Washington, DC, USA, 2019.
  22. Zeileis, A.; Hothorn, T. Diagnostic Checking in Regression Relationships. R News 2002, 2, 7–10. Available online: https://CRAN.R-project.org/doc/Rnews/ (accessed on 31 January 2025).
  23. R Core Team. R: A Language and Environment for Statistical Computing, Version 4.2.3; Version 4.2.3; R Foundation for Statistical Computing: Vienna, Austria, 2021. Available online: https://www.R-project.org/ (accessed on 31 January 2025).
  24. Bates, D.; Mächler, M.; Bolker, B.; Walker, S. Fitting Linear Mixed-Effects Models Using lme4. J. Stat. Softw. 2015, 67, 1–48. [Google Scholar] [CrossRef]
  25. Lenth, R. R Package Emmeans: Estimated Marginal Means, Aka Least-Squares Means, Version 1.11.0-005. 2025. Available online: https://rvlenth.github.io/emmeans/ (accessed on 31 January 2025).
  26. Fulkerson, W.J.; Slack, K.; Hennessey, D.W.; Hough, G.M. Nutrients in ryegrass (Lolium spp.), white clover (Trifolium repens) and kikuyu (Pennisetum clandestinum) pastures in relation to season and stage of growth in a subtropical environment. Aust. J. Exp. Agric. 1998, 38, 227–240. [Google Scholar] [CrossRef]
  27. Smith, A.P.; Beale, P.; Fulkerson, B.J.; Eckard, R.J. Managing the nitrogen status of subtropical dairy pastures for production, efficiency and profit. Agric. Syst. 2019, 176, 102677. [Google Scholar] [CrossRef]
  28. Jian, J.; Du, X.; Reiter, M.S.; Stewart, R.D. A meta-analysis of global cropland soil carbon changes due to cover cropping. Soil Biol. Biochem. 2020, 143, 107735. [Google Scholar] [CrossRef]
  29. Nyabami, P.; Weinrich, E.; Maltais-Landry, G.; Lin, Y. Three years of cover crops management increased soil organic matter and labile carbon pools in a subtropical vegetable agroecosystem. Agrosyst. Geosci. Environ. 2024, 7, e20454. [Google Scholar] [CrossRef]
  30. Luo, Z.; Viscarra Rossel, R.A.; Shi, Z. Distinct controls over the temporal dynamics of soil carbon fractions after land use change. Glob. Change Biol. 2020, 26, 4614–4625. [Google Scholar] [CrossRef]
  31. Grebliunas, B.D.; Armstrong, S.D.; Perry, W.L. Changes in water-extractable organic carbon with cover crop planting under continuous corn silage production. Air Soil Water Res. 2016, 9, 45–54. [Google Scholar] [CrossRef]
Figure 1. Monthly rainfall and mean temperature for the macadamia site (a), avocado site (b) and coffee site (c) over the trial duration from June 2021 to May 2022.
Agronomy 15 01750 g001
Figure 2. Temporal variation in soil organic carbon, total soil nitrogen, carbon to nitrogen ratio (C:N), water soluble carbon (WSC), hot water extractable carbon (HWC), and autoclavable citrate extractable soil protein (Protein) for the control and cover crop treatments across all sites. The line represents the mean and the shading the standard error of the mean.
Agronomy 15 01750 g002
Figure 3. Temporal variation in chitinase (C), leucine aminopeptidase (LEU), phosphomonoesterase (P), arylsulfatase (S), β-glucosidase (GLC), and esterase (E) activity for the control and cover crop treatments across all sites. The line represents the mean and the shading the standard error of the mean.
Agronomy 15 01750 g003
Table 1. Soil organic carbon (SOC), nitrogen (SN), carbon to nitrogen ratio (CN), pH, electrical conductivity (EC), effective cation exchange capacity, Bray I phosphorus (P), mineral nitrogen (N), and basic texture of soils from the site at establishment of the trial.
MacadamiaAvocadoCoffee
SOC (%)6.33.76.3
SN (%)0.530.310.65
CN121210
pH6.135.786.87
EC (dS m−1)0.130.010.14
ECEC (cmol + kg−1)9.23.521
Bray I P (mg kg−1)133.58.5
Mineral N (mg kg−1)16542170
Basic TextureLoamLoamLoam
Table 2. Species and seeding rates (kg ha−1) of winter and summer cover crops.
MixCover Crop SpeciesMacadamia SiteCoffee SiteAvocado Site
WinterSunflower444
Radish0.30.30.3
Buckwheat0.60.60.6
Field pea888
Cereal rye555
Vetch0.50.50.5
Mustard0.20.20.2
Canola0.40.40.4
Chicory0.30.30.3
SummerSunflower0.6 0.6
Millet333
Cowpea2 2
Radish1.21.21.2
Buckwheat4 4
Sorghum 3
Lablab 2
Chicory 0.3
Table 3. Biomass production (mean ± standard error) at termination of cover crops in cover crop and control plots at the three trial sites.
SiteTreatmentControl (kg ha−1)Cover Crop (kg ha−1)
MacadamiaWinter cover crop919 ± 170869 ± 15
Summer cover crop3562 ± 6353268 ± 171
AvocadoWinter cover crop *826 ± 571677 ± 164
Summer cover crop4551 ± 1494425 ± 1023
CoffeeWinter cover crop *620 ± 1701154 ± 38
Summer cover crop *3322 ± 1876171 ± 2057
* Indicates a significant treatment difference at p = 0.05.
Table 4. Mean proportion of each plant group in the winter biomass assessment. Species from Table 2 which are not present indicate that they were not present in the assessment cuts.
Mean Proportion of Biomass (%)
SiteClassControlCover Crop
MacadamiaEndemic Grass9668
Endemic Broadleaf48
Cereal Rye 19
Mustard 3
Vetch 1
Radish 1
AvocadoEndemic Grass6028
Endemic Broadleaf4024
Cereal Rye 15
Field Pea 5
Vetch 5
Radish 23
CoffeeEndemic Grass9860
Endemic Broadleaf24
Cereal Rye 22
Field Pea 8
Vetch 3
Radish 3
Table 5. Mean proportion of each plant group in the summer biomass assessment. Species from Table 2 which are not present indicate that they were not present in the assessment cuts.
Mean Proportion of Biomass (%)
SiteClassControlCover Crop
MacadamiaEndemic Grass9424
Endemic Broadleaf62
Buckwheat 51
Cowpea 13
Millet 5
Radish 2
Sunflower 2
Chicory 1
AvocadoEndemic Grass8526
Endemic Broadleaf151
Buckwheat 11
Cowpea 58
Millet 2
Radish 2
CoffeeEndemic Grass985
Endemic Broadleaf20
Lablab 66
Sorghum 12
Chicory 15
Radish 2
Table 6. Table of p-values from the analysis of variance for significant treatment and temporal differences, and their interaction, in soil indicators, following construction of the mixed linear model.
SiteIndicatorTreatmentTimeInteraction
MacadamiaTotal Soil Carbon0.32<0.010.11
Soil Nitrogen0.52<0.010.06
Carbon to Nitrogen Ratio0.52<0.010.39
Water Soluble Carbon0.19<0.010.77
Hot Water Extractable Carbon0.69<0.010.38
Soil Protein0.04<0.010.04
Chitinase0.18<0.010.17
Phosphomonesterase0.85<0.010.31
Arylsulfatase0.18<0.010.53
β-glucosidase0.23<0.010.39
Leucine Aminopeptidase0.630.640.15
Esterase0.620.060.10
AvocadoTotal Soil Carbon0.27<0.010.37
Soil Nitrogen0.30<0.010.08
Carbon to Nitrogen Ratio<0.01<0.01<0.01
Water Soluble Carbon0.33<0.010.77
Hot Water Extractable Carbon0.28<0.010.92
Soil Protein0.56<0.010.92
Chitinase0.55<0.010.15
Phosphomonesterase0.69<0.010.05
Arylsulfatase1.00<0.010.27
β-glucosidase0.45<0.010.10
Leucine Aminopeptidase0.11<0.010.40
Esterase<0.010.050.20
CoffeeTotal Soil Carbon0.070.040.63
Soil Nitrogen0.110.160.64
Carbon to Nitrogen Ratio0.970.690.95
Water Soluble Carbon0.55<0.010.01
Hot Water Extractable Carbon0.800.010.29
Soil Protein0.17<0.010.09
Chitinase0.880.080.84
Phosphomonesterase0.30<0.010.99
Arylsulfatase0.450.420.78
β-glucosidase0.780.010.52
Leucine Aminopeptidase0.150.770.44
Esterase0.840.390.85
Disclaimer/Publisher’s Note: The statements, opinions and data contained in all publications are solely those of the individual author(s) and contributor(s) and not of MDPI and/or the editor(s). MDPI and/or the editor(s) disclaim responsibility for any injury to people or property resulting from any ideas, methods, instructions or products referred to in the content.

