
Molecular Mechanisms Underlying Sweet Potato (Ipomoea batatas L.) Responses to Phosphorus Deficiency

 ,
,
Abstract
1. Introduction
2. Materials and Methods
2.1. Materials Prepareation
2.2. Experimental Design
2.3. Plant Growth Characteristics and Endogenous Phytohormones
2.4. Cellulose and Lignin
2.5. Transcriptome Analysis
2.6. Metabolome Analysis
2.7. Association Analysis of Transcriptome and Metabolome
2.8. Statistical Analysis
3. Results
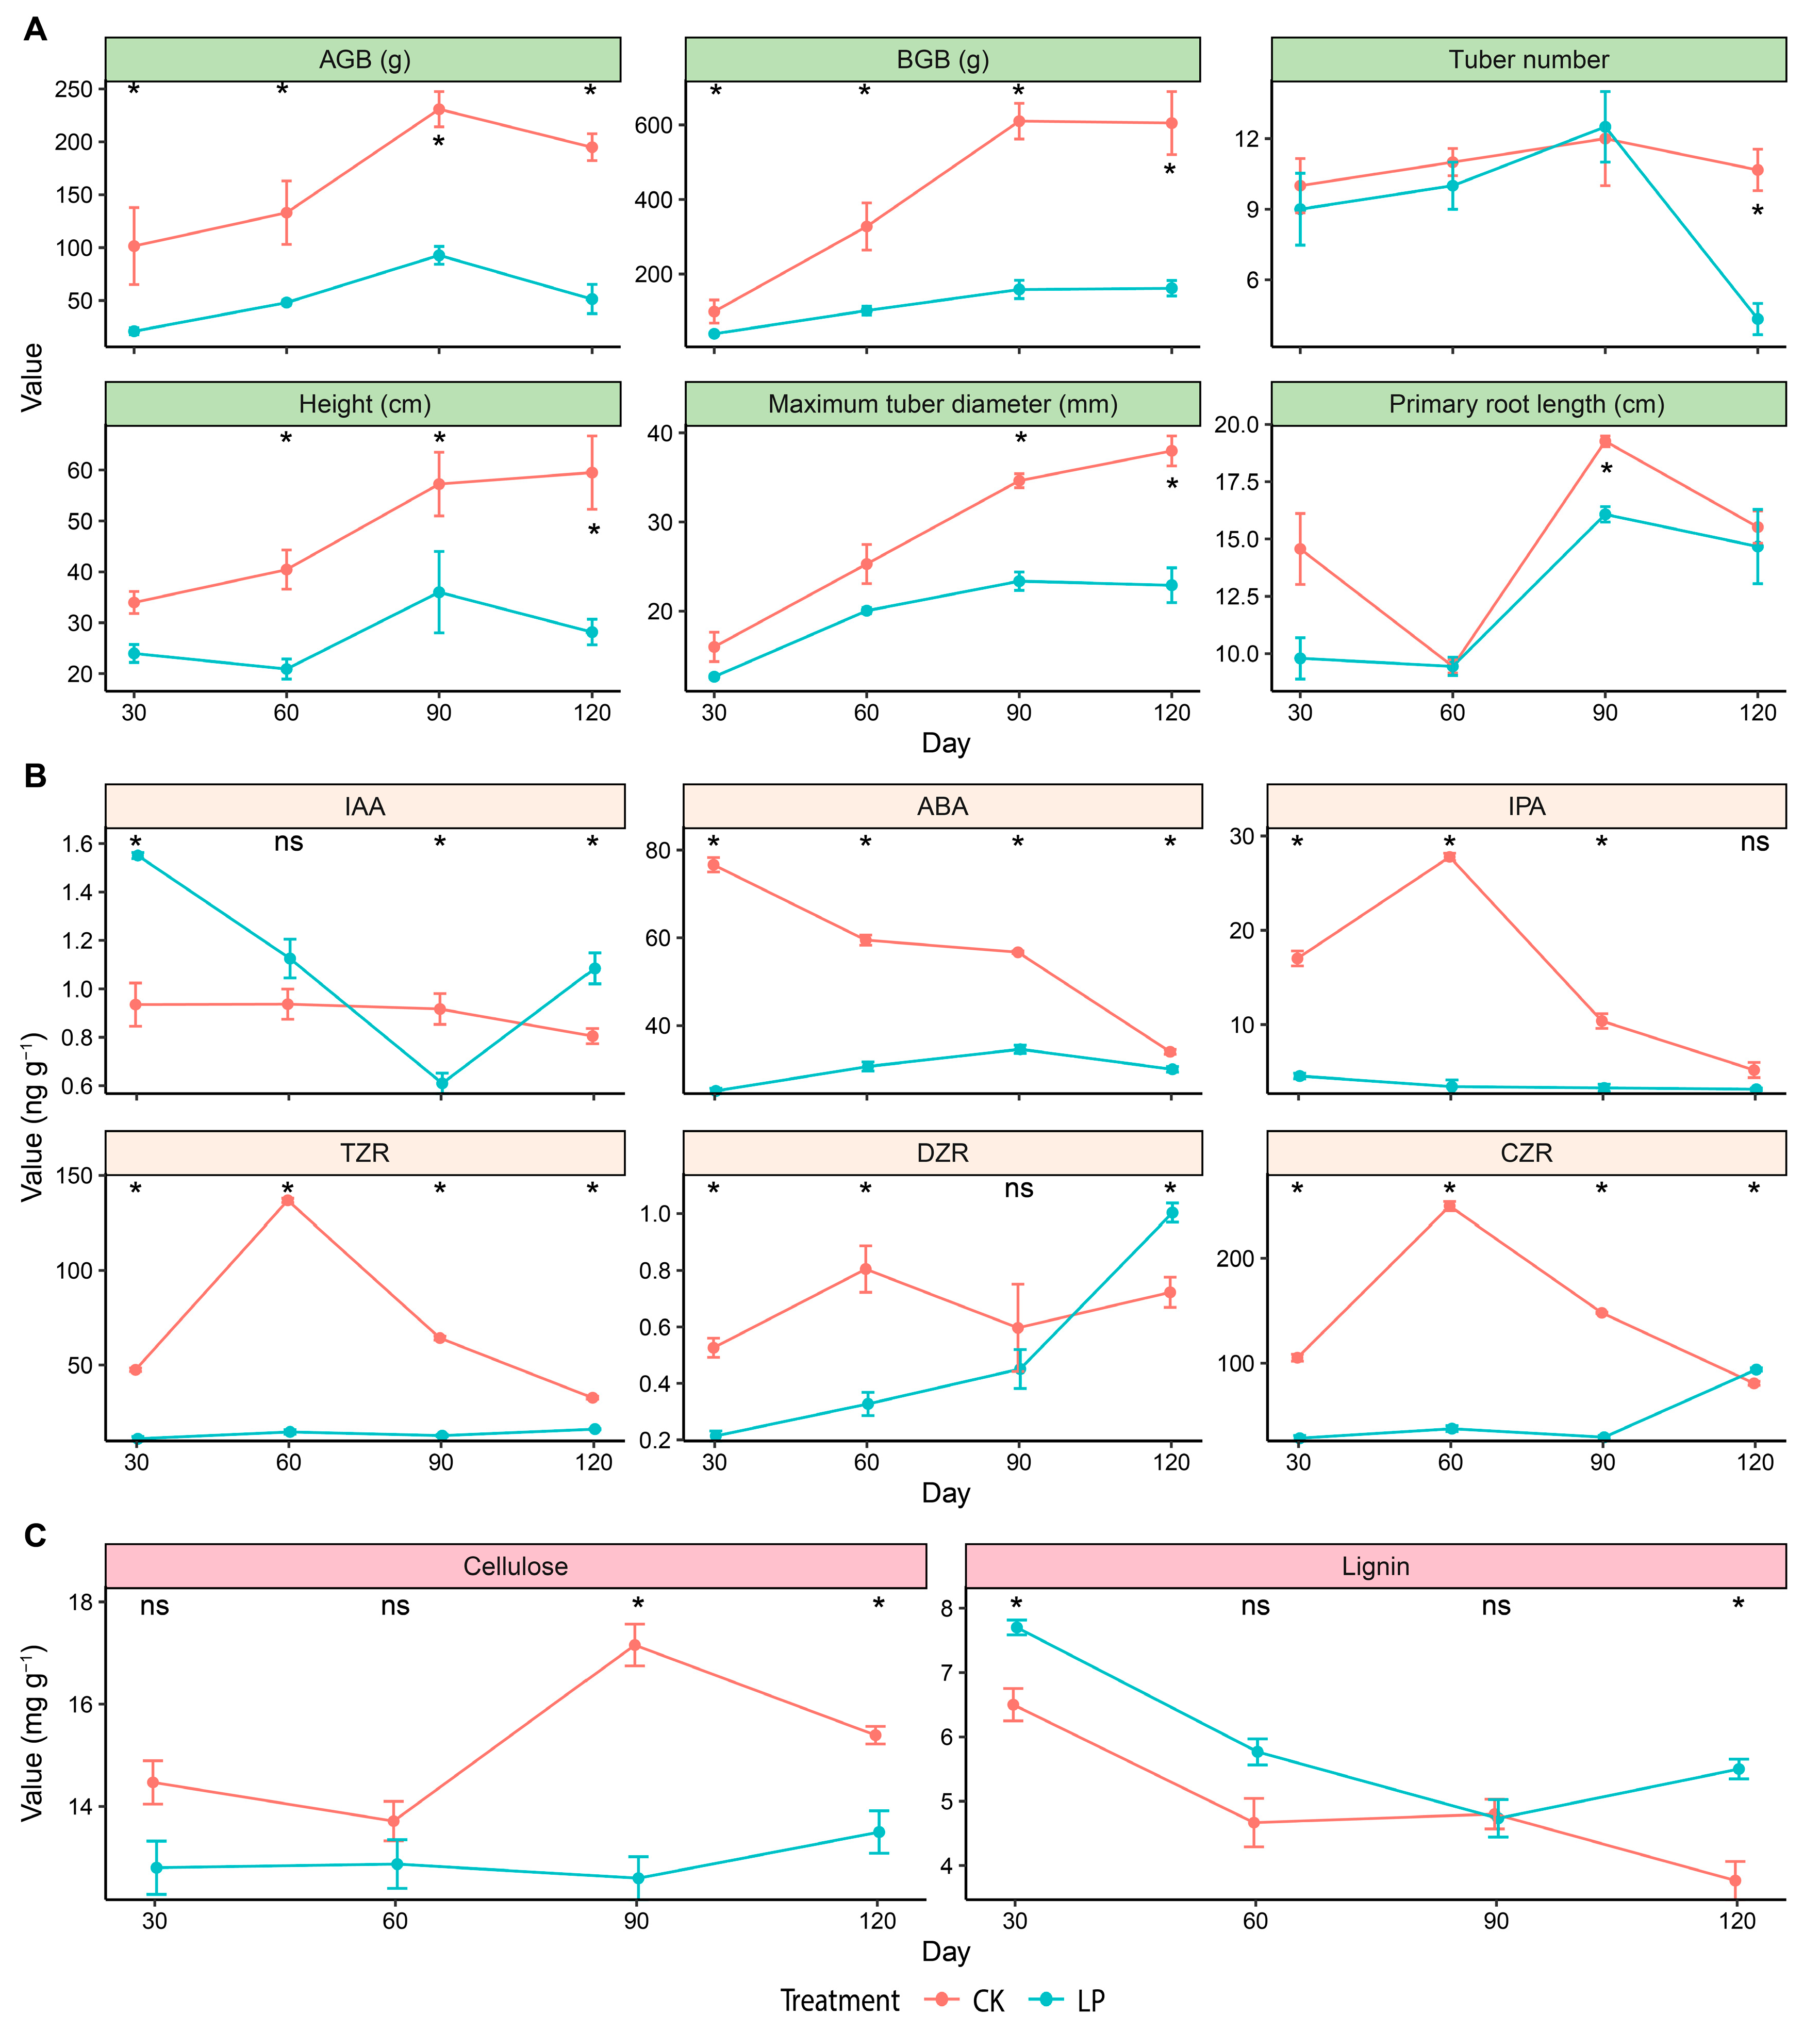
3.1. Plant Growth
3.2. Endogenous Phytohormones
3.3. Cellulose and Lignin
3.4. Transcriptome
3.5. Metabolome
3.6. Association of Transcriptome and Metabolome
4. Discussion
5. Conclusions
Author Contributions
Funding
Data Availability Statement
Acknowledgments
Conflicts of Interest
References
- Liu, C.; Bai, Z.; Luo, Y.; Zhang, Y.; Wang, Y.; Liu, H.; Luo, M.; Huang, X.; Chen, A.; Ma, L.; et al. Multiomics dissection of Brassica napus L. lateral roots and endophytes interactions under phosphorus starvation. Nat. Commun. 2024, 15, 9732. [Google Scholar] [CrossRef]
- Wang, H.; Yang, Y.; Yao, C.; Feng, Y.; Wang, H.; Kong, Y.; Riaz, U.; Zaman, Q.U.; Sultan, K.; Fahad, S.; et al. The correct combination and balance of macronutrients nitrogen, phosphorus and potassium promote plant yield and quality through enzymatic and antioxidant activities in potato. J. Plant Growth Regul. 2024, 43, 4716–4734. [Google Scholar] [CrossRef]
- Santoro, V.; Schiavon, M.; Celi, L. Role of soil abiotic processes on phosphorus availability and plant responses with a focus on strigolactones in tomato plants. Plant Soil 2024, 494, 1–49. [Google Scholar] [CrossRef]
- Nadeem, F.; Abbas, S.; Waseem, F.; Ali, N.; Mahmood, R.; Bibi, S.; Deng, L.; Wang, R.; Zhong, Y.; Li, X. Phosphorus (P) and Zinc (Zn) nutrition constraints: A perspective of linking soil application with plant regulations. Environ. Exp. Bot. 2024, 226, 105875. [Google Scholar] [CrossRef]
- Hu, D.; Cui, R.; Wang, K.; Yang, Y.; Wang, R.; Zhu, H.; He, M.; Fan, Y.; Wang, L.; Wang, L.; et al. The Myb73–GDPD2–GA2ox1 transcriptional regulatory module confers phosphate deficiency tolerance in soybean. Plant Cell 2024, 36, 2176–2200. [Google Scholar] [CrossRef]
- Alam, M.K. A comprehensive review of sweet potato (Ipomoea batatas [L.] Lam): Revisiting the associated health benefits. Trends Food Sci. Technol. 2021, 115, 512–529. [Google Scholar] [CrossRef]
- Minemba, D.; Gleeson, D.B.; Veneklaas, E.; Ryan, M.H. Variation in morphological and physiological root traits and organic acid exudation of three sweet potato (Ipomoea batatas) cultivars under seven phosphorus levels. Sci. Hortic. 2019, 256, 108572. [Google Scholar] [CrossRef]
- Sun, M.; Li, P.; Wang, N.; Zheng, C.; Sun, X.; Dong, H.; Han, H.; Feng, W.; Shao, J.; Zhang, Y. Soil available phosphorus deficiency reduces boll biomass and lint yield by affecting sucrose metabolism in cotton-boll subtending leaves. Agronomy 2022, 12, 1065. [Google Scholar] [CrossRef]
- Sandaña, P.; Pinochet, D. Ecophysiological determinants of biomass and grain yield of wheat under P deficiency. Field Crops Res. 2011, 120, 311–319. [Google Scholar] [CrossRef]
- Ha, S.; Tran, L. Understanding plant responses to phosphorus starvation for improvement of plant tolerance to phosphorus deficiency by biotechnological approaches. Crit. Rev. Biotechnol. 2014, 34, 16–30. [Google Scholar] [CrossRef]
- Lopez, G.; Ahmadi, S.H.; Amelung, W.; Athmann, M.; Ewert, F.; Gaiser, T.; Gocke, M.I.; Kautz, T.; Postma, J.; Rachmilevitch, S.; et al. Nutrient deficiency effects on root architecture and root-to-shoot ratio in arable crops. Front. Plant Sci. 2023, 13, 1067498. [Google Scholar] [CrossRef]
- Niu, Y.F.; Chai, R.S.; Jin, G.L.; Wang, H.; Tang, C.X.; Zhang, Y.S. Responses of root architecture development to low phosphorus availability: A review. Ann. Bot. 2013, 112, 391–408. [Google Scholar] [CrossRef] [PubMed]
- Swain, R.; Sahoo, S.; Behera, M.; Rout, G.R. Instigating prevalent abiotic stress resilience in crop by exogenous application of phytohormones and nutrient. Front. Plant Sci. 2023, 14, 1104874. [Google Scholar] [CrossRef] [PubMed]
- Han, Y.; White, P.J.; Cheng, L. Mechanisms for improving phosphorus utilization efficiency in plants. Ann. Bot. 2022, 129, 247–258. [Google Scholar] [CrossRef]
- Pant, P.; Duan, H.; Krom, N.; Huertas, R.; Scheible, W. Comparative transcriptomics pinpoints conserved and specific transcriptional responses to phosphorus limitation. J. Exp. Bot. 2025, 76, 621–638. [Google Scholar] [CrossRef] [PubMed]
- Feng, X.; Zeng, Q.; Chen, X.; Shan, M.; Wu, Z.; Zhang, N.; Huang, Y.; Wu, J. Full-length transcriptome integrated with RNA-seq reveals potassium deficiency stress-regulated key pathways and time-specific responsive genes in sugarcane roots. Ind. Crops Prod. 2025, 225, 120527. [Google Scholar] [CrossRef]
- BRAY, E.A. Classification of Genes Differentially Expressed during Water-deficit Stress in Arabidopsis thaliana: An Analysis using Microarray and Differential Expression Data. Ann. Bot. 2002, 89, 803–811. [Google Scholar] [CrossRef]
- Lu, X.; Li, L.; Cui, Y.; Zhao, T.; Malik, W.A. Editorial: Identification and functional analysis of differentially expressed genes in plant response to abiotic stresses. Front. Plant Sci. 2023, 14, 1246964. [Google Scholar] [CrossRef]
- Lü, S.; Yu, X.; Wu, X.; Hu, Q.; Zhu, X.; Wu, M.; Hu, Q.; Zhao, S.; Hu, J.; Wu, J.; et al. The microRNA399d-PHOSPHATE2 module alters rice sensitivity to rice ragged stunt virus by manipulating phosphate uptake. Plant Physiol. 2025, 197, kiae517. [Google Scholar] [CrossRef]
- Du, Y.; Gong, J.; Dou, Z.; Zheng, W.; Sun, R.; Gao, S. Genome-wide identification and expression analysis of phosphate-sensing SPX proteins in oats. Front. Genet. 2024, 15, 1469704. [Google Scholar] [CrossRef]
- Zhang, X.Y.; Li, J.L.; Cao, Y.Y.; Huang, J.B.; Duan, Q.H. Genome-Wide Identification and Expression Analysis under Abiotic Stress of BrAHL Genes in Brassica rapa. Int. J. Mol. Sci. 2023, 24, 12447. [Google Scholar] [CrossRef]
- Sun, S.; Li, X.; Nie, N.; Chen, Y.; Gao, S.; Zhang, H.; He, S.; Liu, Q.; Zhai, H. Sweet potato NAC transcription factor NAC43 negatively regulates plant growth by causing leaf curling and reducing photosynthetic efficiency. Front. Plant Sci. 2023, 14, 1095977. [Google Scholar] [CrossRef] [PubMed]
- Haldar, D.; Sen, D.; Gayen, K. Development of spectrophotometric method for the analysis of multi-component carbohydrate mixture of different moieties. Appl. Biochem. Biotechnol. 2017, 181, 1416–1434. [Google Scholar] [CrossRef] [PubMed]
- Fukushima, R.S.; Hatfield, R.D. Comparison of the acetyl bromide spectrophotometric method with other analytical lignin methods for determining lignin concentration in forage samples. J. Agric. Food Chem. 2004, 52, 3713–3720. [Google Scholar] [CrossRef] [PubMed]
- Cao, Y.; Han, Z.; Zhang, Z.; He, L.; Huang, C.; Chen, J.; Dai, F.; Xuan, L.; Yan, S.; Si, Z.; et al. UDP-glucosyltransferase 71C4 controls the flux of phenylpropanoid metabolism to shape cotton seed development. Plant Commun. 2024, 5, 100938. [Google Scholar] [CrossRef] [PubMed]
- Bolger, A.M.; Lohse, M.; Usadel, B. Trimmomatic: A flexible trimmer for Illumina sequence data. Bioinformatics 2014, 30, 2114–2120. [Google Scholar] [CrossRef]
- Kim, D.; Langmead, B.; Salzberg, S.L. HISAT: A fast spliced aligner with low memory requirements. Nat. Methods 2015, 12, 357–360. [Google Scholar] [CrossRef]
- Okonechnikov, K.; Conesa, A.; García-Alcalde, F. Qualimap 2: Advanced multi-sample quality control for high-throughput sequencing data. Bioinformatics 2016, 32, 292–294. [Google Scholar] [CrossRef]
- Anders, S.; Pyl, P.T.; Huber, W. HTSeq—A Python framework to work with high-throughput sequencing data. Bioinformatics 2015, 31, 166–169. [Google Scholar] [CrossRef]
- Robinson, M.D.; McCarthy, D.J.; Smyth, G.K. edgeR: A Bioconductor package for differential expression analysis of digital gene expression data. Bioinformatics 2010, 26, 139–140. [Google Scholar] [CrossRef]
- Klopfenstein, D.V.; Zhang, L.; Pedersen, B.S.; Ramírez, F.; Warwick Vesztrocy, A.; Naldi, A.; Mungall, C.J.; Yunes, J.M.; Botvinnik, O.; Weigel, M.; et al. GOATOOLS: A Python library for Gene Ontology analyses. Sci. Rep. 2018, 8, 10872. [Google Scholar] [CrossRef]
- Want, E.J.; O’Maille, G.; Smith, C.A.; Brandon, T.R.; Uritboonthai, W.; Qin, C.; Trauger, S.A.; Siuzdak, G. Solvent-dependent metabolite distribution, clustering, and protein extraction for serum profiling with mass spectrometry. Anal. Chem. 2006, 78, 743–752. [Google Scholar] [CrossRef]
- Kanehisa, M.; Sato, Y.; Kawashima, M.; Furumichi, M.; Tanabe, M. KEGG as a reference resource for gene and protein annotation. Nucleic Acids Res. 2016, 44, D457–D462. [Google Scholar] [CrossRef]
- Wishart, D.S.; Feunang, Y.D.; Marcu, A.; Guo, A.C.; Liang, K.; Vázquez-Fresno, R.; Sajed, T.; Johnson, D.; Li, C.; Karu, N.; et al. HMDB 4.0: The human metabolome database for 2018. Nucleic Acids Res. 2018, 46, D608–D617. [Google Scholar] [CrossRef] [PubMed]
- Fahy, E.; Subramaniam, S.; Murphy, R.C.; Nishijima, M.; Raetz, C.R.H.; Shimizu, T.; Spener, F.; van Meer, G.; Wakelam, M.J.O.; Dennis, E.A. Update of the LIPID MAPS comprehensive classification system for lipids. J. Lipid Res. 2009, 50, S9–S14. [Google Scholar] [CrossRef] [PubMed]
- Fahy, E.; Subramaniam, S.; Brown, H.A.; Glass, C.K.; Merrill, A.H.; Murphy, R.C.; Raetz, C.R.H.; Russell, D.W.; Seyama, Y.; Shaw, W.; et al. A comprehensive classification system for lipids. J. Lipid Res. 2005, 46, 839–861. [Google Scholar] [CrossRef]
- Wen, B.; Mei, Z.; Zeng, C.; Liu, S. metaX: A flexible and comprehensive software for processing metabolomics data. BMC Bioinform. 2017, 18, 183. [Google Scholar] [CrossRef] [PubMed]
- Feder, D.; McGeary, R.P.; Mitić, N.; Lonhienne, T.; Furtado, A.; Schulz, B.L.; Henry, R.J.; Schmidt, S.; Guddat, L.W.; Schenk, G. Structural elements that modulate the substrate specificity of plant purple acid phosphatases: Avenues for improved phosphorus acquisition in crops. Plant Sci. 2020, 294, 110445. [Google Scholar] [CrossRef]
- Wang, X.; Balamurugan, S.; Liu, S.; Ji, C.; Liu, Y.; Yang, W.; Jiang, L.; Li, H. Hydrolysis of organophosphorus by diatom purple acid phosphatase and sequential regulation of cell metabolism. J. Exp. Bot. 2021, 72, 2918–2932. [Google Scholar] [CrossRef]
- Dai, S.; Chen, H.; Shi, Y.; Xiao, X.; Xu, L.; Qin, C.; Zhu, Y.; Yi, K.; Lei, M.; Zeng, H. PHOSPHATE1-mediated phosphate translocation from roots to shoots regulates floral transition in plants. J. Exp. Bot. 2024, 75, 5054–5075. [Google Scholar] [CrossRef]
- Srivastava, R.; Akash; Parida, A.P.; Chauhan, P.K.; Kumar, R. Identification, structure analysis, and transcript profiling of purple acid phosphatases under Pi deficiency in tomato (Solanum lycopersicum L.) and its wild relatives. Int. J. Biol. Macromol. 2020, 165, 2253–2266. [Google Scholar] [CrossRef] [PubMed]
- Li, C.; Liu, J.; Liao, Y.; Luo, H.; Wang, L.; Shan, J.; Suo, H.; An, K.; Yang, K.; Li, X. Genome-wide identification of the PAP gene family in potatoes and its expression response to phosphorus-solubilizing bacteria, freezing stresses, and phytohormonal regulation. Agronomy 2024, 14, 2735. [Google Scholar] [CrossRef]
- Wege, S.; Khan, G.A.; Jung, J.; Vogiatzaki, E.; Pradervand, S.; Aller, I.; Meyer, A.J.; Poirier, Y. The EXS domain of PHO1 participates in the response of shoots to phosphate deficiency via a root-to-shoot signal. Plant Physiol. 2015, 170, 385–400. [Google Scholar] [CrossRef] [PubMed]
- Wang, Y.; Gao, H.; He, L.; Zhu, W.; Yan, L.; Chen, Q.; He, C. The PHOSPHATE1 genes participate in salt and Pi signaling pathways and play adaptive roles during soybean evolution. BMC Plant Biol. 2019, 19, 353. [Google Scholar] [CrossRef]
- Teng, Z.; Lyu, J.; Chen, Y.; Zhang, J.; Ye, N. Effects of stress-induced ABA on root architecture development: Positive and negative actions. Crop J. 2023, 11, 1072–1079. [Google Scholar] [CrossRef]
- Harris, J. Abscisic acid: Hidden architect of root system structure. Plants 2015, 4, 548–572. [Google Scholar] [CrossRef]
- Li, S.; Liu, S.; Zhang, Q.; Cui, M.; Zhao, M.; Li, N.; Wang, S.; Wu, R.; Zhang, L.; Cao, Y.; et al. The interaction of ABA and ROS in plant growth and stress resistances. Front. Plant Sci. 2022, 13, 1050132. [Google Scholar] [CrossRef]
- Tanimoto, E. Regulation of root growth by plant hormones—Roles for auxin and gibberellin. Crit. Rev. Plant Sci. 2005, 24, 249–265. [Google Scholar] [CrossRef]
- Lu, H.; Lin, R.; Deng, M.; Jin, K.; Mao, C. New mechanistic insights into phosphate-starvation-regulated plant architecture change and nutrient uptake. Mol. Plant 2024, 17, 19–21. [Google Scholar] [CrossRef]
- Santoro, V.; Schiavon, M.; Visentin, I.; Constán Aguilar, C.; Cardinale, F.; Celi, L. Strigolactones affect phosphorus acquisition strategies in tomato plants. Plant Cell Environ. 2021, 44, 3628–3642. [Google Scholar] [CrossRef]
- Slocum, R.D.; Mejia Pena, C.; Liu, Z. Transcriptional reprogramming of nucleotide metabolism in response to altered pyrimidine availability in Arabidopsis seedlings. Front. Plant Sci. 2023, 14, 1273235. [Google Scholar] [CrossRef]
- Sekhon, R.S.; Childs, K.L.; Santoro, N.; Foster, C.E.; Buell, C.R.; de Leon, N.; Kaeppler, S.M. Transcriptional and metabolic analysis of senescence induced by preventing pollination in maize. Plant Physiol. 2012, 159, 1730–1744. [Google Scholar] [CrossRef] [PubMed]
- Parwez, R.; Aftab, T.; Gill, S.S.; Naeem, M. Abscisic acid signaling and crosstalk with phytohormones in regulation of environmental stress responses. Environ. Exp. Bot. 2022, 199, 104885. [Google Scholar] [CrossRef]
- Hou, Z.; Zhang, X.; Tang, Y.; Yu, T.; Zheng, L.; Chen, J.; Zhou, Y.; Liu, Y.; Chen, M.; Xu, Z.; et al. GmSAP5, a soybean A20/AN1 domain-containing stress-associated protein gene activated by GmAREB3, increases drought stress resistance in soybean by mediating ABA signaling. Crop J. 2022, 10, 1601–1610. [Google Scholar] [CrossRef]
- Cheng, S.; Xu, J.; Wu, S.; Li, Q.; Mi, J. Plant chloroplast stress response: Insights from mass spectrometry metabolites analysis. Front. Plant Sci. 2025, 16, 1549156. [Google Scholar] [CrossRef] [PubMed]
- Savchenko, T.; Tikhonov, K. Oxidative stress-induced alteration of plant central metabolism. Life 2021, 11, 304. [Google Scholar] [CrossRef]
- Pavlů, J.; Kerchev, P.; Černý, M.; Novák, J.; Berka, M.; Jobe, T.O.; López Ramos, J.M.; Saiz-Fernández, I.; Rashotte, A.M.; Kopriva, S.; et al. Cytokinin modulates the metabolic network of sulfur and glutathione. J. Exp. Bot. 2022, 73, 7417–7433. [Google Scholar] [CrossRef]
- Kieber, J.J.; Schaller, G.E. Cytokinin signaling in plant development. Development 2018, 145, dev149344. [Google Scholar] [CrossRef]
- Naulin, P.A.; Armijo, G.I.; Vega, A.S.; Tamayo, K.P.; Gras, D.E.; de la Cruz, J.; Gutiérrez, R.A. Nitrate induction of primary root growth requires cytokinin signaling in Arabidopsis thaliana. Plant Cell Physiol. 2020, 61, 342–352. [Google Scholar] [CrossRef]
- EL Sabagh, A.; Islam, M.S.; Hossain, A.; Iqbal, M.A.; Mubeen, M.; Waleed, M.; Reginato, M.; Battaglia, M.; Ahmed, S.; Rehman, A.; et al. Phytohormones as Growth Regulators During Abiotic Stress Tolerance in Plants. Front. Agron. 2022, 4, 765068. [Google Scholar] [CrossRef]
- Pedersen, G.B.; Blaschek, L.; Frandsen, K.E.; Noack, L.C.; Persson, S. Cellulose synthesis in land plants. Mol. Plant 2023, 16, 206–231. [Google Scholar] [CrossRef] [PubMed]
- Wang, Y.; Lambers, H. Root-released organic anions in response to low phosphorus availability: Recent progress, challenges and future perspectives. Plant Soil 2020, 447, 135–156. [Google Scholar] [CrossRef]
- Soni, N.; Hegde, N.; Dhariwal, A.; Kushalappa, A.C. Role of laccase gene in wheat NILs differing at QTL-Fhb1 for resistance against Fusarium head blight. Plant Sci. 2020, 298, 110574. [Google Scholar] [CrossRef] [PubMed]
- Hegde, N.; Joshi, S.; Soni, N.; Kushalappa, A.C. The caffeoyl-CoA O-methyltransferase gene SNP replacement in Russet Burbank potato variety enhances late blight resistance through cell wall reinforcement. Plant Cell Rep. 2021, 40, 237–254. [Google Scholar] [CrossRef]
- Qi, G.; Wang, D.; Yu, L.; Tang, X.; Chai, G.; He, G.; Ma, W.; Li, S.; Kong, Y.; Fu, C.; et al. Metabolic engineering of 2-phenylethanol pathway producing fragrance chemical and reducing lignin in Arabidopsis. Plant Cell Rep. 2015, 34, 1331–1342. [Google Scholar] [CrossRef]
- Wang, H.; Yang, J.; Zhang, M.; Fan, W.; Firon, N.; Pattanaik, S.; Yuan, L.; Zhang, P. Altered phenylpropanoid metabolism in the maize Lc-expressed sweet potato (Ipomoea batatas) affects storage root development. Sci. Rep. 2016, 6, 18645. [Google Scholar] [CrossRef]
- Pazhamala, L.T.; Giri, J. Plant phosphate status influences root biotic interactions. J. Exp. Bot. 2023, 74, 2829–2844. [Google Scholar] [CrossRef]
- Rejeb, I.B.; Pastor, V.; Mauch-Mani, B. Plant responses to simultaneous biotic and abiotic stress: Molecular mechanisms. Plants 2014, 3, 458–475. [Google Scholar] [CrossRef]
- Shukla, D.; Waigel, S.; Rouchka, E.C.; Sandhu, G.; Trivedi, P.K.; Sahi, S.V. Genome-wide expression analysis reveals contrasting regulation of phosphate starvation response (PSR) in root and shoot of Arabidopsis and its association with biotic stress. Environ. Exp. Bot. 2021, 188, 104483. [Google Scholar] [CrossRef]
- O’Hara, L.E.; Paul, M.J.; Wingler, A. How Do Sugars Regulate Plant Growth and Development? New Insight into the Role of Trehalose-6-Phosphate. Mol. Plant 2013, 6, 261–274. [Google Scholar] [CrossRef]
- Figueroa, C.M.; Feil, R.; Ishihara, H.; Watanabe, M.; Kölling, K.; Krause, U.; Höhne, M.; Encke, B.; Plaxton, W.C.; Zeeman, S.C.; et al. Trehalose 6–phosphate coordinates organic and amino acid metabolism with carbon availability. Plant J. 2016, 85, 410–423. [Google Scholar] [CrossRef] [PubMed]
- Sun, Y.; Mu, C.; Chen, Y.; Kong, X.; Xu, Y.; Zheng, H.; Zhang, H.; Wang, Q.; Xue, Y.; Li, Z.; et al. Comparative transcript profiling of maize inbreds in response to long-term phosphorus deficiency stress. Plant Physiol. Bioch. 2016, 109, 467–481. [Google Scholar] [CrossRef] [PubMed]
- Prathap, V.; Kumar, S.; Tyagi, A. Comparative proteome analysis of phosphorus-responsive genotypes reveals the proteins differentially expressed under phosphorous starvation stress in rice. Int. J. Biol. Macromol. 2023, 234, 123760. [Google Scholar] [CrossRef] [PubMed]
- Jones, C.L.C.; Shafer, A.B.A.; Frost, P.C. Characterizing nutritional phenotypes using experimental nutrigenomics: Is there nutrient-specificity to different types of dietary stress? Mol. Ecol. 2023, 32, 1073–1086. [Google Scholar] [CrossRef]
- Smeulders, M.J.; Peeters, S.H.; van Alen, T.; de Bruijckere, D.; Nuijten, G.H.L.; Op Den Camp, H.J.M.; Jetten, M.S.M.; van Niftrik, L. Nutrient limitation causes differential expression of transport- and metabolism genes in the compartmentalized anammox bacterium Kuenenia stuttgartiensis. Front. Microbiol. 2020, 11, 1959. [Google Scholar] [CrossRef]
- Boer, V.M.; Crutchfield, C.A.; Bradley, P.H.; Botstein, D.; Rabinowitz, J.D. Growth-limiting intracellular metabolites in yeast growing under diverse nutrient limitations. Mol. Biol. Cell 2009, 21, 198–211. [Google Scholar] [CrossRef]
- Jogawat, A.; Yadav, B.; Chhaya; Lakra, N.; Singh, A.K.; Narayan, O.P. Crosstalk between phytohormones and secondary metabolites in the drought stress tolerance of crop plants: A review. Physiol. Plantarum 2021, 172, 1106–1132. [Google Scholar] [CrossRef]
- Gao, Y.; Jin, Y.; Guo, W.; Xue, Y.; Yu, L. Metabolic and physiological changes in the roots of two oat cultivars in response to complex saline-alkali stress. Front. Plant Sci. 2022, 13, 835414. [Google Scholar] [CrossRef]
- Zhou, T.; Xing, Q.; Bu, J.; Han, W.; Shen, Z. Integrated metabolomic and transcriptomic analysis reveals the regulatory mechanisms of flavonoid and alkaloid biosynthesis in the new and old leaves of Murraya tetramera Huang. BMC Plant Biol. 2024, 24, 499. [Google Scholar] [CrossRef]
- Spitzer-Rimon, B.; Duchin, S.; Bernstein, N.; Kamenetsky, R. Architecture and Florogenesis in Female Cannabis sativa Plants. Front. Plant Sci. 2019, 10, 350. [Google Scholar] [CrossRef]
- Shi, H.; Chan, Z. Improvement of plant abiotic stress tolerance through modulation of the polyamine pathway. J. Integr. Plant Biol. 2014, 56, 114–121. [Google Scholar] [CrossRef]
- Shao, J.; Huang, K.; Batool, M.; Idrees, F.; Afzal, R.; Haroon, M.; Noushahi, H.A.; Wu, W.; Hu, Q.; Lu, X.; et al. Versatile roles of polyamines in improving abiotic stress tolerance of plants. Front. Plant Sci. 2022, 13, 1003155. [Google Scholar] [CrossRef]
- Zandalinas, S.I.; Balfagón, D.; Gómez-Cadenas, A.; Mittler, R. Plant responses to climate change: Metabolic changes under combined abiotic stresses. J. Exp. Bot. 2022, 73, 3339–3354. [Google Scholar] [CrossRef]
- Weng, J.; Lynch, J.H.; Matos, J.O.; Dudareva, N. Adaptive mechanisms of plant specialized metabolism connecting chemistry to function. Nat. Chem. Biol. 2021, 17, 1037–1045. [Google Scholar] [CrossRef]


| No. | Nutrient | PDNS (mg/L) | FPNS (mg/L) |
|---|---|---|---|
| 1 | KNO3 | 607.2 | 506 |
| 2 | NH4NO3 | 40 | 80 |
| 3 | KH2PO4 | 0 | 136 |
| 4 | MgSO4 | 241 | 241 |
| 5 | FeNaEDTA | 36.7 | 36.7 |
| 6 | KI | 0.83 | 0.83 |
| 7 | H3BO3 | 6.2 | 6.2 |
| 8 | MnSO4·H2O | 22.3 | 22.3 |
| 9 | ZnSO4·7H2O | 8.6 | 8.6 |
| 10 | Na2MoO4·2H2O | 0.25 | 0.25 |
| 11 | CuSO4·5H2O | 0.025 | 0.025 |
| 12 | CoCl2·6H2O | 0.025 | 0.025 |
| 13 | Ca(NO3)2·4H2O | 945 | 945 |
Disclaimer/Publisher’s Note: The statements, opinions and data contained in all publications are solely those of the individual author(s) and contributor(s) and not of MDPI and/or the editor(s). MDPI and/or the editor(s) disclaim responsibility for any injury to people or property resulting from any ideas, methods, instructions or products referred to in the content. |
© 2025 by the authors. Licensee MDPI, Basel, Switzerland. This article is an open access article distributed under the terms and conditions of the Creative Commons Attribution (CC BY) license (https://creativecommons.org/licenses/by/4.0/).
Share and Cite
Yao, Z.; Luo, Z.; Zou, H.; Yang, Y.; Jiang, B.; Huang, L.; Wang, Z. Molecular Mechanisms Underlying Sweet Potato (Ipomoea batatas L.) Responses to Phosphorus Deficiency. Agronomy 2025, 15, 1745. https://doi.org/10.3390/agronomy15071745
Yao Z, Luo Z, Zou H, Yang Y, Jiang B, Huang L, Wang Z. Molecular Mechanisms Underlying Sweet Potato (Ipomoea batatas L.) Responses to Phosphorus Deficiency. Agronomy. 2025; 15(7):1745. https://doi.org/10.3390/agronomy15071745
Chicago/Turabian StyleYao, Zhufang, Zhongxia Luo, Hongda Zou, Yiling Yang, Bingzhi Jiang, Lifei Huang, and Zhangying Wang. 2025. "Molecular Mechanisms Underlying Sweet Potato (Ipomoea batatas L.) Responses to Phosphorus Deficiency" Agronomy 15, no. 7: 1745. https://doi.org/10.3390/agronomy15071745
APA StyleYao, Z., Luo, Z., Zou, H., Yang, Y., Jiang, B., Huang, L., & Wang, Z. (2025). Molecular Mechanisms Underlying Sweet Potato (Ipomoea batatas L.) Responses to Phosphorus Deficiency. Agronomy, 15(7), 1745. https://doi.org/10.3390/agronomy15071745