Article

Effects of Conservation Tillage and Nitrogen Management on Yield, Grain Quality, and Weed Infestation in Winter Wheat

by
Željko Dolijanović
1,
Svetlana Roljević Nikolić
2,*,
Srdjan Šeremešić
3,
Danijel Jug
4,
Milena Biljić
1,
Stanka Pešić
2 and
Dušan Kovačević
1
1
Faculty of Agriculture, University of Belgrade, 6 Nemanjina, 11080 Belgrade, Serbia
2
“Tamiš” Research and Development Institute, 33 Novoseljanski Put, 26000 Pančevo, Serbia
3
Faculty of Agriculture, University of Novi Sad, Sq Dositeja Obradovića 8, 21000 Novi Sad, Serbia
4
Faculty of Agrobiotechnical Sciences Osijek, Josip Juraj Strossmayer University of Osijek, 31000 Osijek, Croatia
*
Author to whom correspondence should be addressed.
Agronomy 2025, 15(7), 1742; https://doi.org/10.3390/agronomy15071742
Submission received: 11 June 2025 / Revised: 15 July 2025 / Accepted: 17 July 2025 / Published: 19 July 2025
(This article belongs to the Section Innovative Cropping Systems)

Abstract

Choosing appropriate tillage methods and nitrogen application are important steps in the management of wheat production for obtaining high-yield and high-quality products, as well as managing the level of weed infestation. The aim of this research was to examine the impacts of three different tillage practices (conventional tillage—CT, mulch tillage—MT, and no tillage—NT), and two top dressing fertilization nitrogen levels (rational—60 kg ha−1 and high—120 kg ha−1) on the grain yield and quality of winter wheat, as well as on weed infestation. The present study was carried out in field experiments on chernozem luvic type soil at the Faculty of Agriculture Belgrade-Zemun Experimental field trial “Radmilovac”, in the growing seasons of 2020/2021–2022/2023. The C/N ratio in the soil was also assessed on all plots. The results showed that the number of weeds and their fresh and air-dry weights were higher on the MT and NT plots, compared to the CT plots. Therefore, the CT system has better effects on the yield (5.91 and 5.36 t ha−1) and the protein content (13.3 and 13.1%). Furthermore, the grain weight per spike and the 1000-grain weight were higher in the wheat from the CT system (41.83 and 42.75 g) than from the MT (40.34 and 41.49 g) and NT (40.26 and 41.08 g) systems. Also, the crops from the CT system had higher values of grain density and grain uniformity compared to the crop from the MT and NT systems. Fertilization with a high nitrogen level (120 kg ha−1) causes higher grain yield and more weediness compared with the rational level (60 kg ha−1). Top dressing fertilization in each tillage system resulted in an increase in the number of weeds, but, at the same time, it also resulted in stronger competitive ability of the wheat crop against weeds. The most favorable C/N ratio occurred on the NT plots, and the least beneficial one on the CT ones. A correlation analysis showed strong negative correlations of number (r = −0.82) and fresh weed mass (r = −0.72) with yield. It is concluded that the conventional tillage practice with a low nitrogen dose manifests its superior performance in minimizing weed infestation and maximizing crop productivity.

1. Introduction

Wheat (Triticum aestivum L.) stands as a globally important staple crop, cultivated across an estimated 225 million hectares and yielding an annual production of around 750 million tons [1]. Taking into account the overall economic importance and the land area, wheat is the second most important crop in Serbia. The area sown with wheat in Serbia in 2023 was 545,492 ha, the grain harvest was 2,230,626 t, and the mean yield was 4.1 t ha−1 [2]. However, as with other field crops, it shows a multi-year trend of decreasing areas and yields, as well as increasing exposure to climate change. A similar situation has been observed throughout Europe, where declining wheat yields due to climate change are estimated at 5%, 10%, and 15% in France [3], Poland [4], and Russia [3], respectively.
Crop production, particularly of winter wheat, is significantly influenced by interaction among different factors, mainly weather, soil quality, and farming strategies [5,6]. Among these, weather stands out as the most unpredictable element. Its increasing variability, driven by climate change, poses a major threat to global yields. In addition to natural sources, human-influenced (anthropogenic) sources also contribute to the interplay of factors impacting winter wheat production. Given that agricultural soil is non-renewable resource essential for food production, its degradation poses an existential threat to humankind’s future. Current data indicates that, in Serbia, 75% of arable land is cultivated by plowing, 24% by conservation tillage (CST), and 1% by no-tillage methods [7].
Disadvantages of conventional tillage include increased soil compaction, the possibility of plow-soil formation, increased susceptibility to water and wind erosion, and increased energy costs of mechanical operations. In recent years, less intensive practices such as reduced tillage, conservation tillage, and no tillage have been promoted to overcome some of the negative impacts of conventional tillage. Alternative tillage practices reduce energy consumption and carbon dioxide emissions through reduced use of fossil fuels [8]. On the other hand, no-till yields are 8.5% lower than those for conventional tillage, and N2O emissions are higher due to higher soil moisture and density, which may offset the positive effects of these practices [9].
The introduction of conservation tillage systems has also been accompanied by some problems. Weed pressure, nitrogen availability, and environmental benefits vary significantly when conventional, reduced tillage, and no-tillage methods are applied and depend on the extent to which farmers will accept them. Weed control, such as assessment of the effects of various seed rates and line-to-line spacing on weed dynamics, demonstrated the cost-effectiveness of the examined treatments [10]. However, studies that have focused on the use of chemicals to control weeds showed that the application of a sole herbicide or multiple herbicides in the sequence offered more economic profit than manual weeding (from 0.3% to 38%). The assessment of the interactive effects of two key agronomic practices, conservation tillage and optimized nitrogen management, on winter wheat weeding is a step further in understanding how these conservation tillage and nitrogen nutrition strategies can influence weed dynamics and crop competitiveness within cropping systems [11].
Organic farmers are reluctant to switch from reduced tillage to no tillage due to increased weed pressure and reduced crop yields [12]. To improve soil fertility, reduce weed pressure, and, thus, create conditions for reducing tillage intensity, it is necessary to cover the soil throughout the season, preferably with diverse cover crops with high legume percentage [13]. This makes production significantly more expensive. On the other hand, the costs of applying herbicides and other weed control measures have steadily increased over time, particularly in conservation systems.
However, CST enhances water infiltration and soil structure by leaving crop residues on the surface, which also significantly reduces surface runoff and erosion while protecting the soil from excessive solar radiation and decreasing evaporation, which can lead to reduced crop stress from moisture fluctuations or extreme temperatures [14]. It goes along with lower demands for machinery, labor, and fuel costs. Looking at the long term, the application of CST contributes to a substantial increase in soil organic matter, improving soil structure, nutrient availability, and water retention capacity, ultimately leading to stabilized and increased crop yields [15,16]. Furthermore, it fosters greater biological activity in the soil and environment, aiding in natural pest control and reducing weed growth, all while leading to lower overall production costs [15,16,17].
Crop rotation, fertilization, and soil tillage exert significant influences on crop yield, weed infestation, and soil properties, especially if those cultural practices are compatible and carefully chosen. Fertilization, especially top dressing with higher nitrogen content in interaction with crop rotation and tillage systems, gives good results because it shows that, by reducing tillage, yields can be increased by applying higher amounts of nitrogen fertilizers [18]. To secure sustainable yields, increased nutrient efficiency, and resource maintenance, it is important to establish effective fertilizer use. Both macro- and micronutrients significantly influence crop nutrition, fostering higher yields and robust plant growth [19]. According to estimates, the consumption of mineral fertilizers will reach 200 million tons in 2023, which is 60 million tons more than at the beginning of the 21st century [20]. The application of mineral fertilizers, especially nitrogen fertilizers, ensures the achievement of high crop yields, but, at the same time, leads to expensive and dangerous circumstances for the environment and human health [21].
The main aim of this study was to evaluate productive traits and weed infestation of winter wheat, as well as to determine the C/N ratio in the soil cultivated in the conventional, mulch, and no-till systems with high and reduced N doses in the top dressing.

2. Materials and Methods

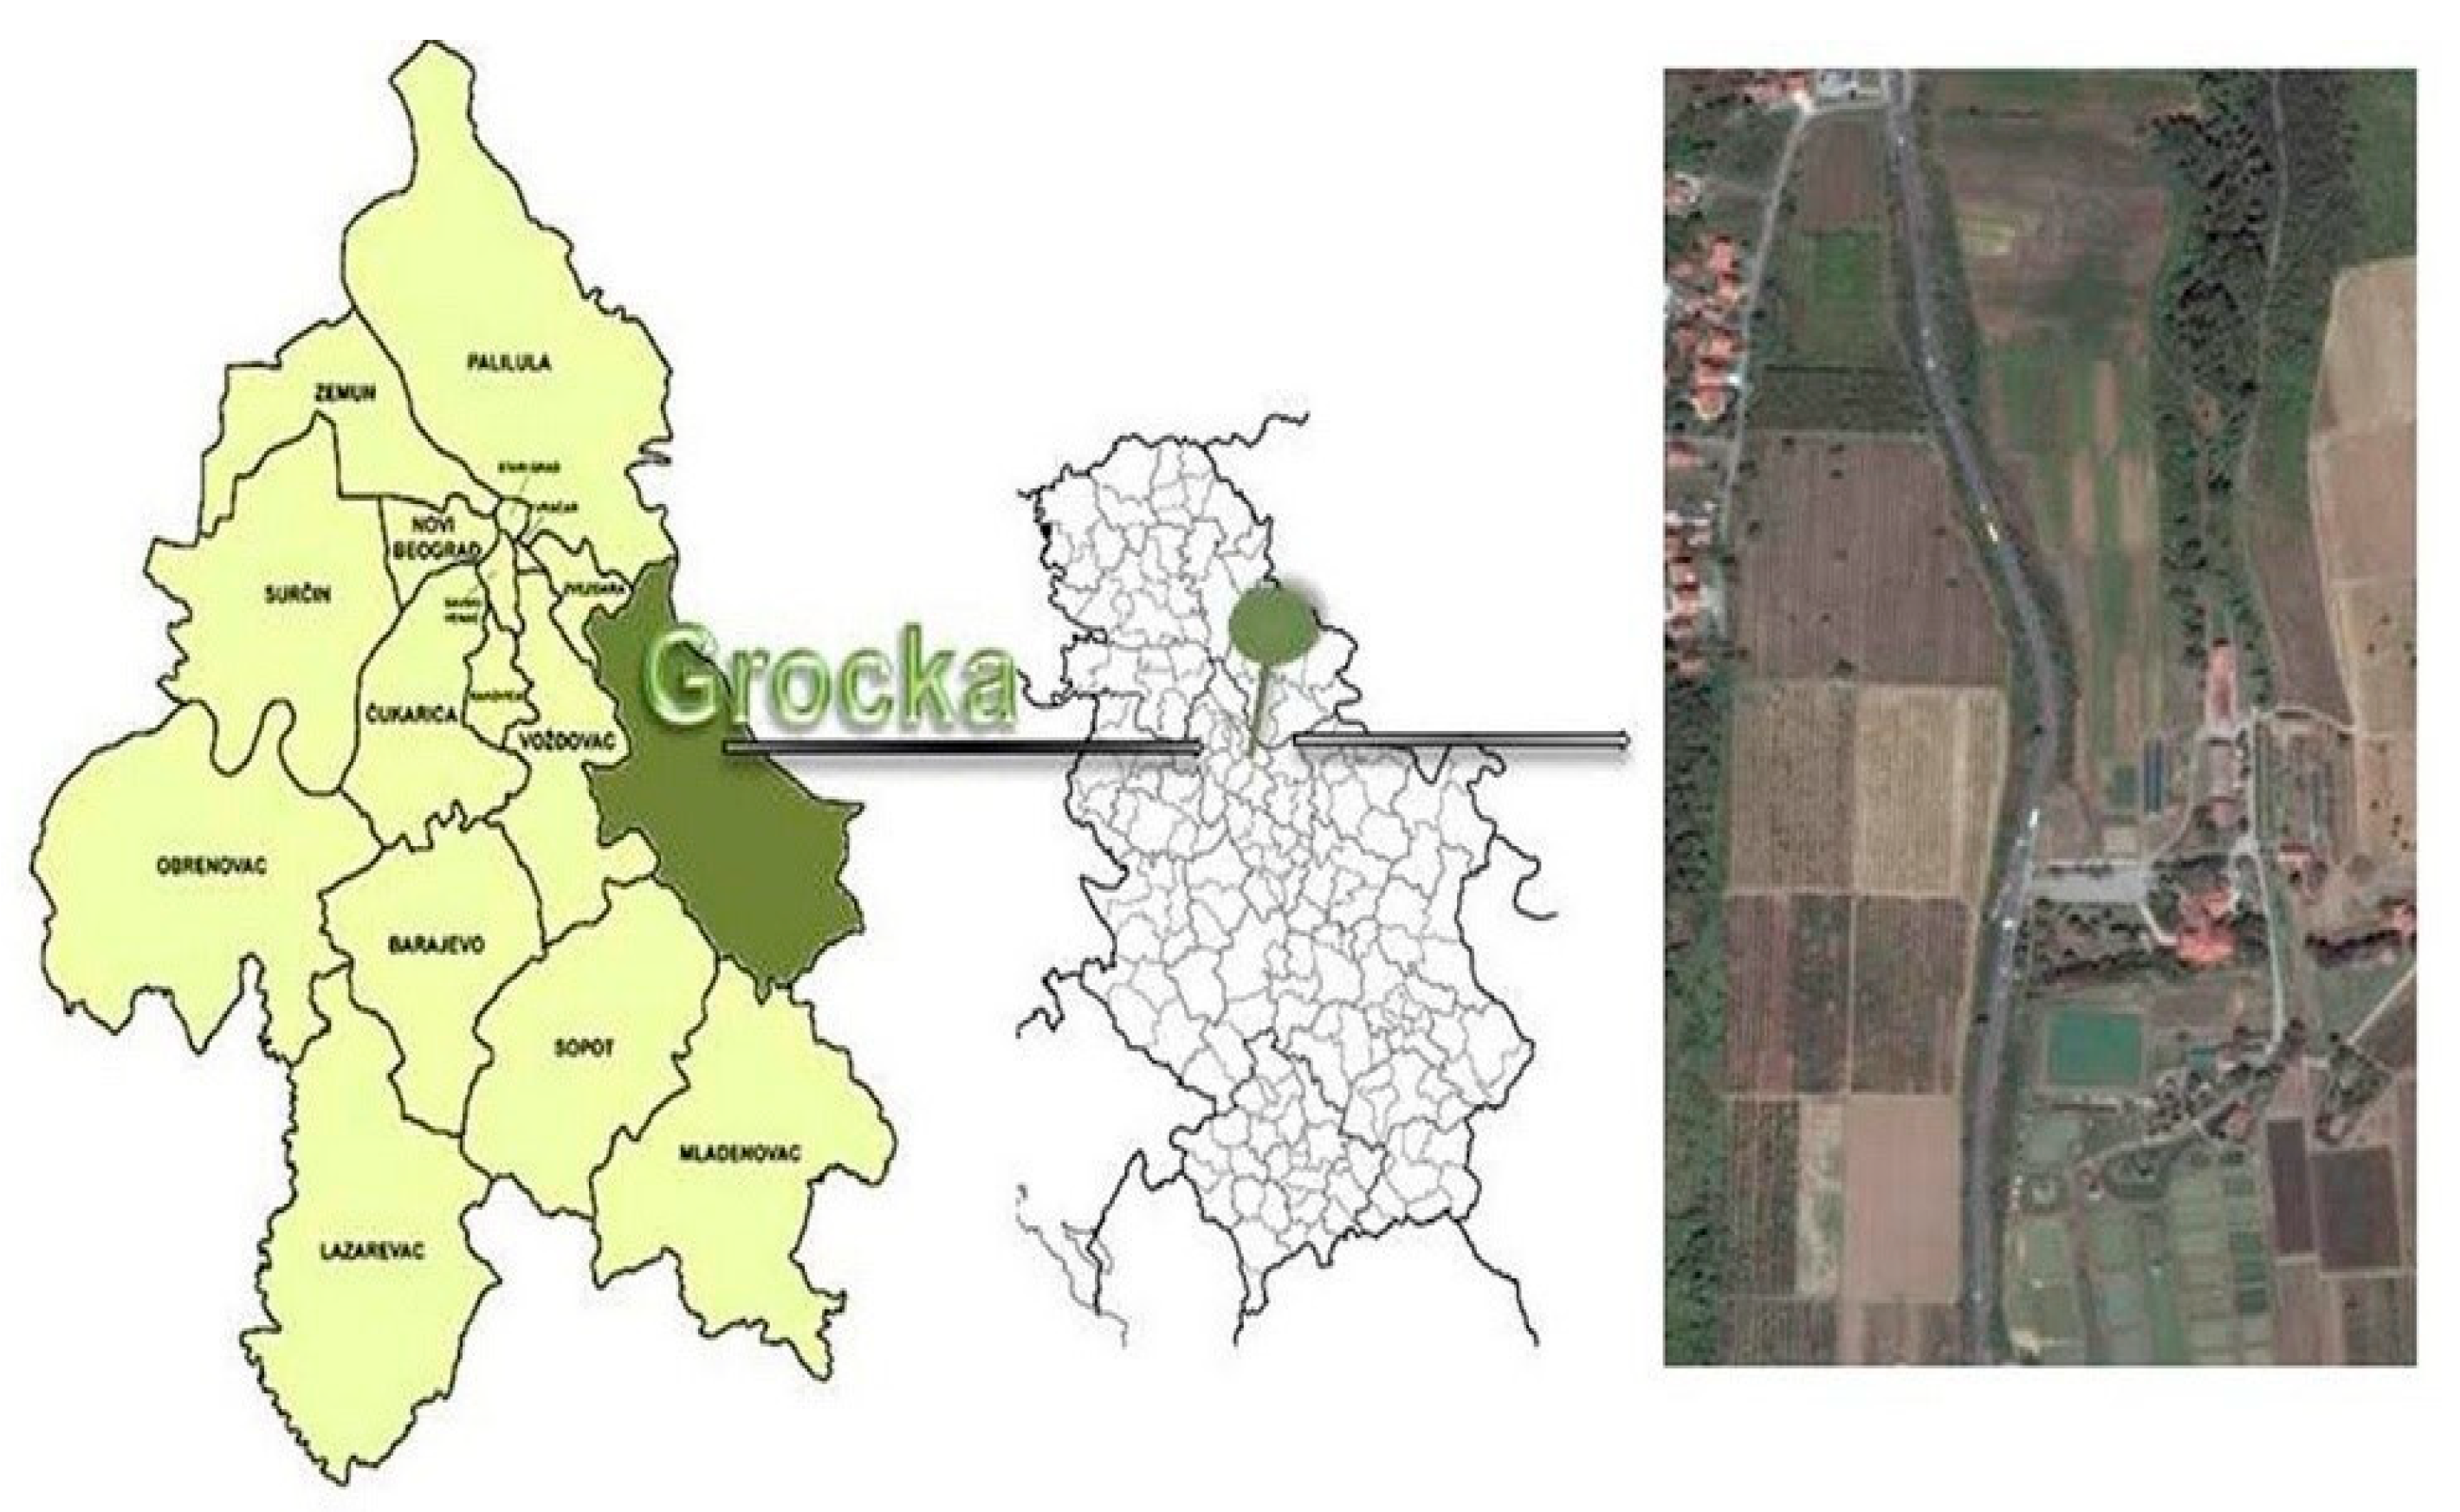
2.1. Study Site and Experimental Design

A field experiment was established in 1990 at the Faculty of Agriculture Belgrade-Zemun Experimental field trial “Radmilovac”, Republic of Serbia (44°45′ N, 20°35′ E Serbia, 130 m a.m.s.l.) (Figure 1). The results presented in the manuscript were collected in the years 2020/21–2022/23. The field experiment was established in completely randomized blocks (25 m × 6 m) in three replications. The subject of the study was a common winter wheat cultivar (Triticum aestivum L., NS Pobeda, selected at the Institute of field and vegetable crops Novi sad, Serbia) grown in three tillage methods (conventional (CT), mulch (MT), and no tillage (NT)). In all tillage systems, the crop rotation was identical and included four crops (winter wheat → spring barley + red clover → red clover→ maize). In the no-tillage system, seeds were sown directly into unplowed soil, with the complete maize crop residues left on the surface. The plowing at 30 cm and pre-sowing soil preparations were carried out in the conventional system using a disc harrow and a harrow. In the mulch system, soil was tilled using a chisel plow at 15 cm, with a third of maize crop residues retained on the soil surface, and pre-sowing tillage was carried out using a disc harrow and a harrow. For all tillage systems, basal fertilization was conducted in autumn, with 600 kg ha−1 NPK (15:15:15), and top dressing was conducted in spring with a high N dose (120 kg ha−1 N) or a reduced N dose (60 kg ha−1 N) in the form of ammonium nitrate (N total 34%) at the tillering stage. Weed control was carried out with Maton (2.4D active substance, Chemical Agrosava, Serbia) in tillering if stem elongations were 1.0 l ha−1 (in the CT plot) or 0.5 l ha−1 (in the MT and NT plots).
The sowing density of wheat was 550 seeds per m2, and sowing was carried out in the middle or last week of October. Wheat grain was harvested using a plot harvester during the full ripeness phase (89 on the BBCH scale) (at the beginning of July in all investigated years).
Unify (Pyraclostrobin 170 g L−1 + Prothioconazole 200 g L−1, Chemical Agrosava, Serbia), in an amount of 0.8 L ha−1, and Ison (Azoxystrobin 200 g L−1 + Cyproconazole 80 g L−1, Zorka Klotild Agrotehnohem, Serbia), in an amount of 0.6 L/ha, were used to protect plants against fungal diseases.

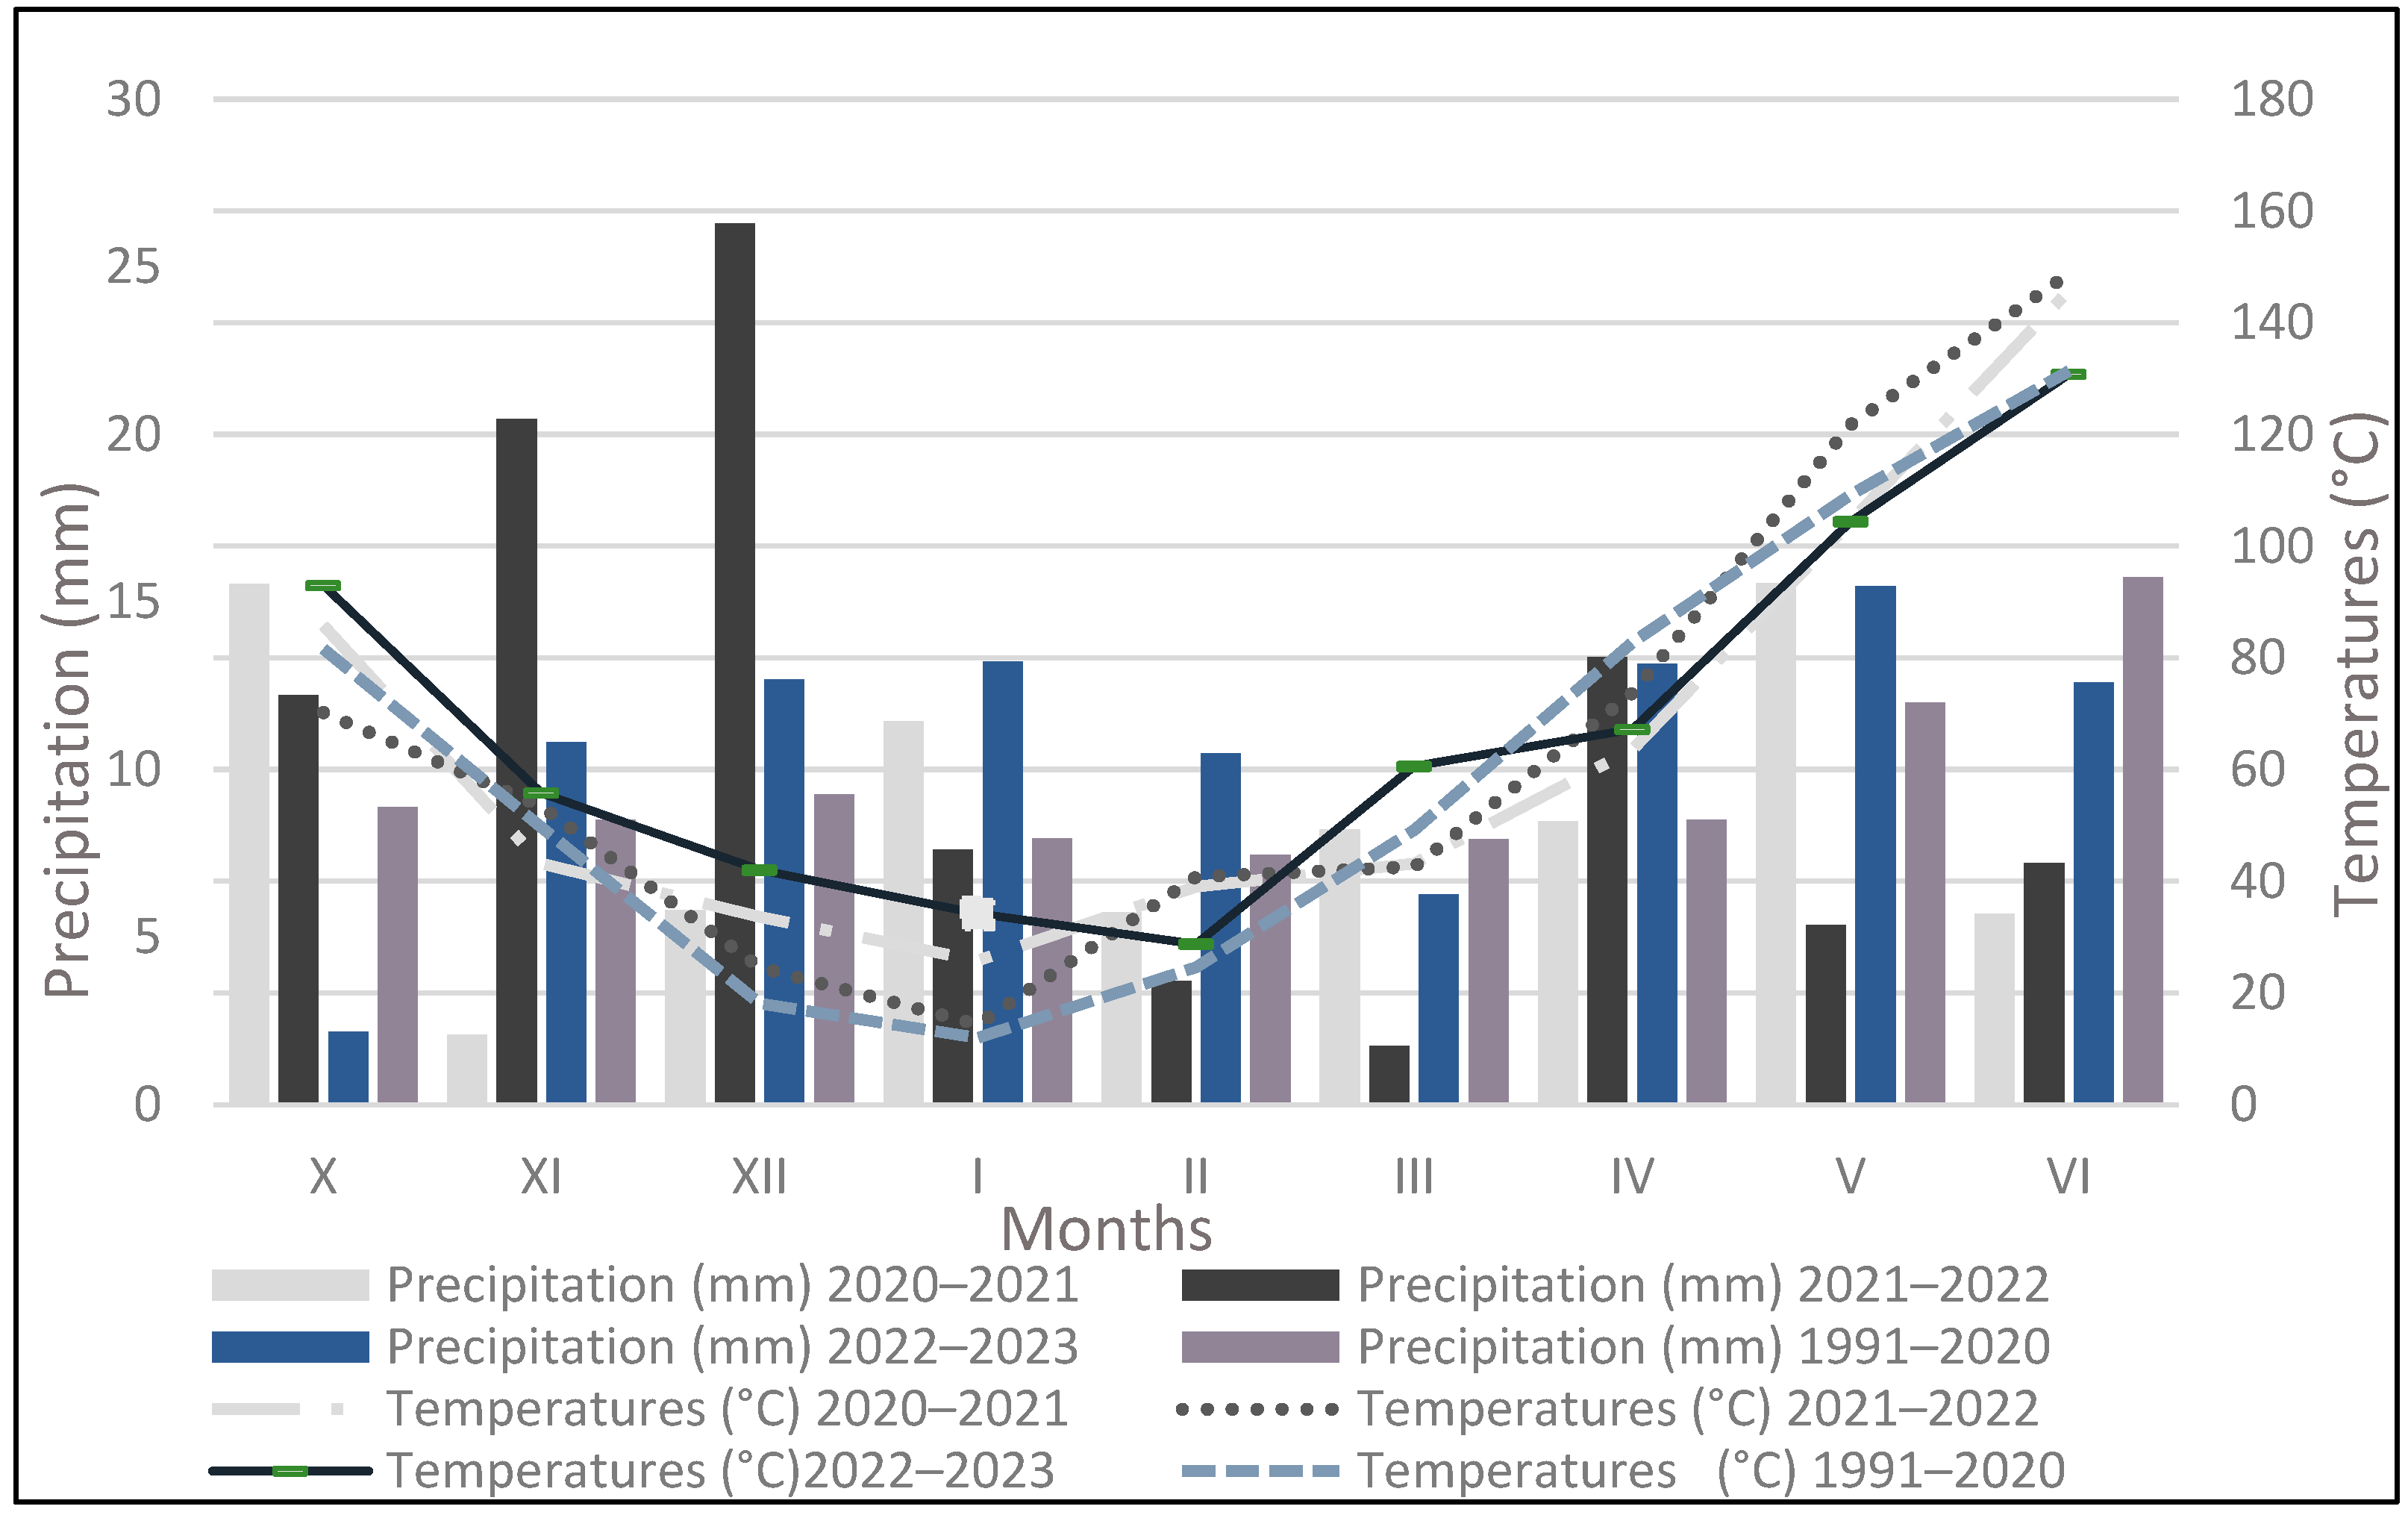
2.2. Soil and Weather Conditions

According to [22], the experiment was established in soil classified as the chernozem luvic soil type. According to the soil texture, the study site was classified as silty clay loam soil with the following characteristics: pH-(H2O) 8.04, total content of N 0.13%, available forms of phosphorus 22.18 mg P2O5 100 g−1 dw and potassium 19.10 mg K2O 100 g−1 dw, and content of organic matter in the topsoil layer 3.26% (Table 1).
The long-term average precipitation in this area is 517.4 mm, and the mean annual temperature is 10.3 °C. Over the experimental period, the annual precipitation ranged from 471 to 588 mm, with 588 mm of precipitation recorded in the vegetative season of 2021/22, and 471 mm in 2020/21 (Figure 2). The average air temperature was the lowest in the vegetative season of 2020/21, at 10.8 °C, while the highest was in 2022/23, at 11.4 °C (Figure 2).
The seasons 2021/22 and 2022/23 had similar annual precipitation (588 and 581.3 mm), but the average air temperature in 2022/23 was much higher (11.4 °C) compared to the other investigated years and the long-term average. The highest levels of precipitation in 2021/22 were recorded in November (122.8 mm) and December (157.8 mm), and the lowest levels were recorded in March (10.5 mm). Higher monthly average temperatures in 2022/2023 were registered in December and January (7 and 5.7 °C), compared to the long-term average.
On the other hand, the amount of precipitation during 2020/21 (471.2 mm) was lower than the long-term average, especially in November (12.5 mm), December (34.8 mm), and February (34.4 mm). The average air temperature (10.8 °C) was higher than the long-term average, but the lowest compared to the other investigated years. The increase in average air temperatures in the examined years, compared to the multi-year period, is mainly due to the increase in monthly air temperatures during the winter months (December, January and February) (Figure 2). Generally, indicators of climate change in our production area include an increase in air temperature during the winter months and an unfavorable distribution of precipitation, both throughout the year and especially during the growing season of crops.

2.3. Production Traits

The experiment aimed to assess the following: (1) the yield of winter wheat grain and its components, (2) the grain quality parameters, (3) the weed structure in the canopy, and (4) the C/N ratio in the soil. The wheat grain was harvested with the Wintersteiger field combine, the grain yield was determined at 14% moisture content of the grain, the number of plants after emergence (in the phase of 2–3 leaves) and the number of spikes were calculated on the area of one m2, the grain weight per spike was determined based on 50 randomly collected spikes, and the 1000-grain weight was assessed by counting and weighing 2 × 500 grains [23].
Total protein content and starch content of the grains were determined by means of Near-Infrared Reflectance Spectroscopy (NIRS), using the OmegAnalyzer Grain device (Bruins Instruments) [24]. The wet gluten content was determined using a gluten washing machine in conjunction with a centrifuge, adhering to International Cereal Association (ICC) Standard No. 137 [25]. Grain density was measured using a 1 L cereal densitometer, whereas grain uniformity was determined using a sorter with a mesh size of 2.5 mm × 25 mm.
Canopy infestation by weeds was assessed at the waxy maturity stage of winter wheat. This evaluation consisted of determining the following: the number of weeds from an area of one m2, the species composition of weeds, and the fresh and air-dry weights of weeds. Weeds collected from a surface area of one m2 were separated from their root systems and placed in an airy room on openwork racks until their constant weight had been obtained.
After winter wheat was harvested, the total N content of the soil was determined with the Kjeldahl method [26], and organic C content was obtained with the Turin method [27]. The C/N ratio in the soil was determined, as well.

2.4. Statistical Analysis

The results obtained were developed statistically using analysis of variance (ANOVA), whereas the significance levels of the differences between mean values for the tillage systems and dose of N in top dressing were evaluated with the LSD test, p < 0.05. For all characteristics, the coefficients of variation (CV%s) were calculated according to the formula: CV = Std/µx100, where Std is the standard deviation and µ is the arithmetic mean. A correlation analysis was conducted to quantify the strength and direction of each relationship among the evaluated agronomic indices, namely weed count, fresh weed mass, and yield. The correlation matrix was calculated using the Pearson correlation coefficient, and the results were visualized as a heatmap to facilitate the interpretation of pairwise associations. Additionally, a radar plot was constructed to compare the performance profiles of each treatment across standardized values of weed count, fresh weed mass, and yield. Prior to visualization, each variable was normalized to a 0–1 scale to ensure comparability among variables with different units and ranges. The radar plot provided a simultaneous overview of treatment-specific patterns in weed infestation levels and yield outcomes. All data processing and visualization were performed using the online application DataExplorer online, which is part of the Atomistica.online platform, as well as custom local code written in the Python programming environment (version 3.10.16).

3. Results

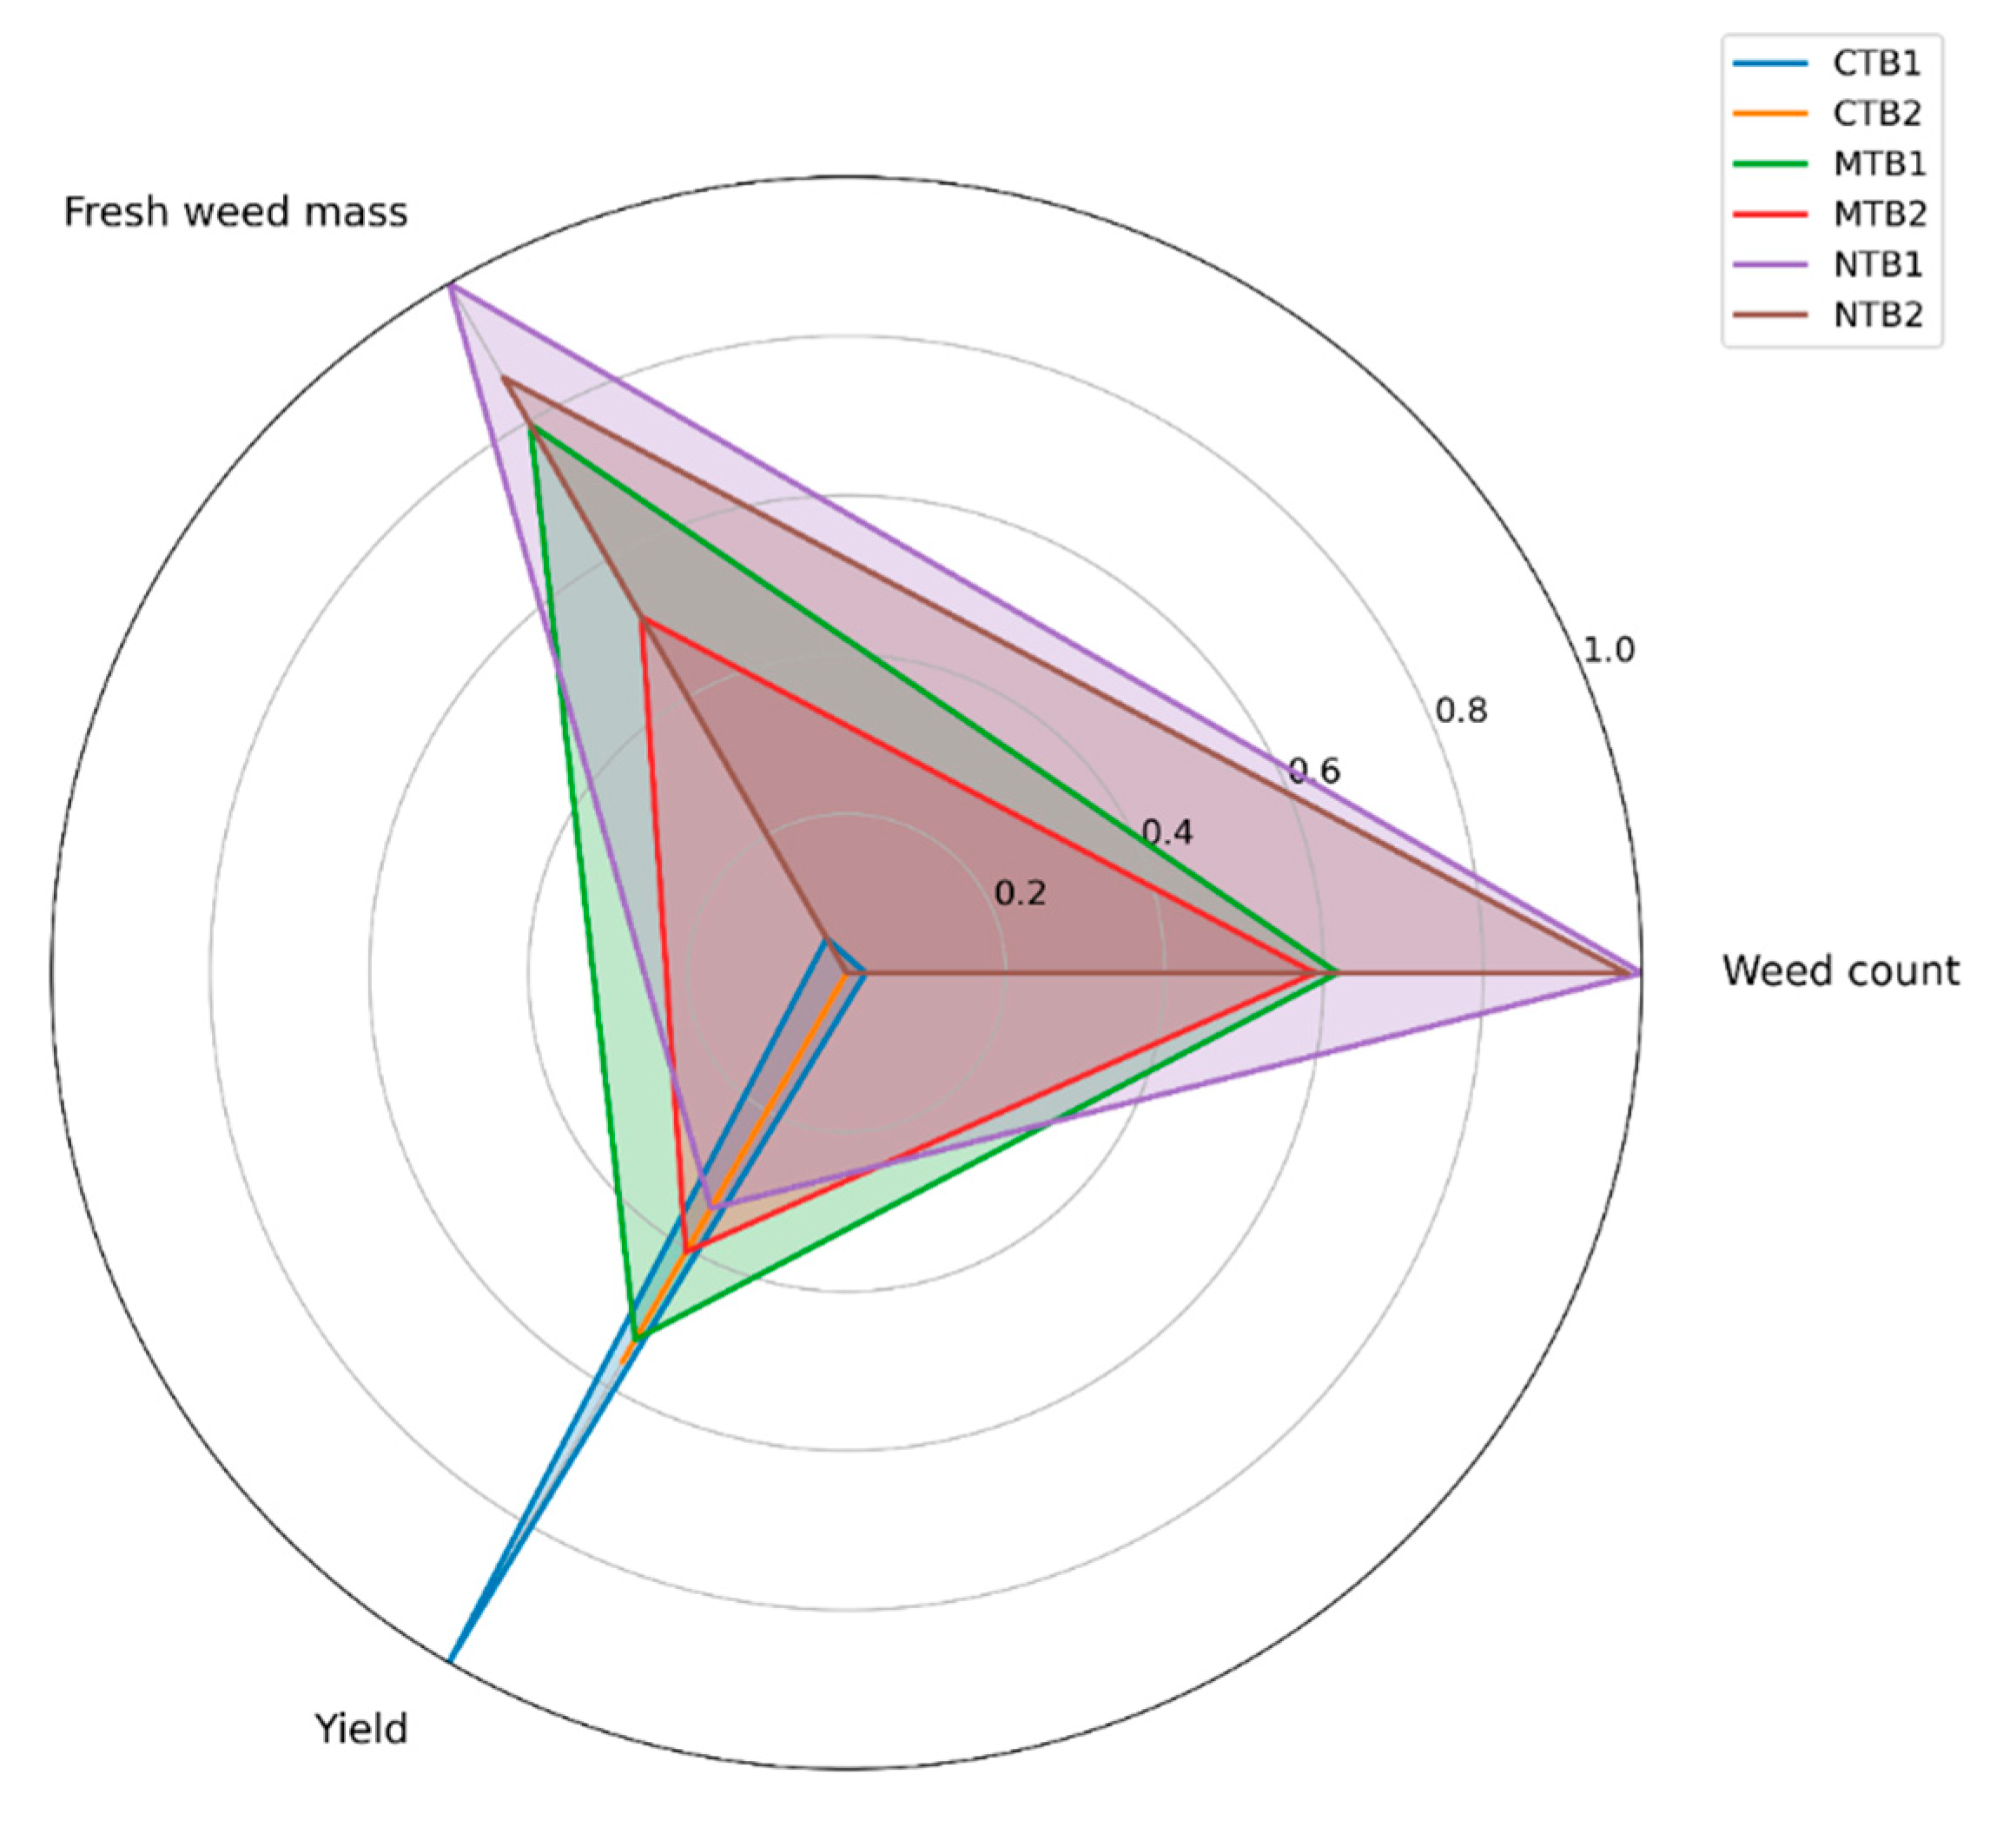
3.1. Weed Infestation Indices

The tillage systems were very significantly differentiated by the number of weeds per m2 (Table 2). The numbers of weeds were 58.6% and 45.1% higher on MT and NT plots, respectively, than on the CT plots. A similar observation was made for the fresh and air-dry weights of weeds, which were 54.0 and 69.1% and 45.3 and 55.2% higher in the MT and NT systems than in the CT system. The application of a higher dose of N in top dressing in all tillage systems contributed to a statistically significant increase in the fresh and air-dry weights of weeds. The numbers of weeds per m2 were also higher in the variants using a higher dose of N, but statistical analysis established that this difference was not statistically significant (Table 2).
The number of weeds per m2, as well as the fresh and air-dry weights produced by them on MT and NT plots were characterized by greater variability compared to the respective parameters assessed on the CT plots. Also, in all tillage systems with increased fertilization, the variation in the investigated weed parameters was more pronounced (Table 2).
The tillage systems also influenced the number and composition of weed species. Among them, the most abundant were segetal short-lived spring and winter weeds. Four weed species were identified on CT plots, and the most numerous of them included the following: Sonchus arvensis L., Avena fatua L., and Convolvulus arvensis L. (Table 3). On MT plots, five (high N dose) and six (reduce N dose) weed species were found, including three and four perennial ones. Of the annual weeds, the most abundant were Avena fatua. Wheat crops on these plots were also heavily infested by Papaver rhoeas. The perennial weeds identified included the following: Sonchus arvensis L. and Cirsium arvense (L.) Scop. In the NT farming system, grassy weeds (Avena fatua L.) and P. rhoeas prevailed quantitatively, and Sorghum halepense L. was also abundant.

3.2. Grain Yield and Its Components

The grain yield of winter wheat was strongly influenced by the tillage system used (Table 4), which was higher on the CT plots than on the MT and NT plots by 6.9% and 14.5%, respectively. The highest grain yield was in the CT system with a high N dose (5.91 t ha−1), and the lowest was in the NT system with a reduced N dose (4.65 t ha−1). The tillage systems also influenced the number of plants after emergence (at the stage of 2–3 leaves) where the CT plot had a 2.5 and 4.0% higher plant density than MT and NT plots. Also, more spikes per m2 were found on the CT plots, as compared to MT and NT plots, especially in treatments with a high N dose. Similarly, the grain weight per spike and the 1000-grain weight were higher on CT plots when compared with those of MT and NT plots.
The tillage systems and different N doses in top dressing influenced the variability of grain yield and its components (Table 4). Higher yield variability (CV%) was found in the MT and NT systems than in the CT one. Also, the least variations in plant density after emergence and spike number per m2, as well as grain weight per spike and 1000-grain weight, were determined in the CT system.
To better understand the interrelationships among the key agronomic indices, a correlation heatmap was constructed to quantify the strength and direction of each association between weed infestation parameters and crop yield (Figure 3).
A correlation analysis was performed to better understand the relationships among the evaluated indices, namely the number and fresh weight of weeds, as well as crop yield. The correlation heatmap (Figure 3) revealed a very strong positive correlation (r = 0.97) between the number and fresh weight of weeds, indicating that plots with higher weed populations also exhibited greater total weed biomass. On the other hand, both weed number (r = −0.82) and fresh weight of weeds (r = −0.72) showed strong negative correlations with yield. This result indicates that the increased weed infestation is associated with significant yield losses. These findings show the critical role of weed management practices in maintaining crop productivity and support the observed yield improvements under treatments with lower weed infestation. The correlation analysis therefore provides quantitative evidence of the interconnectedness of weed infestation traits and their substantial contributions to yield performance.
In addition to comprehensively comparing the overall performance profiles of each treatment, a radar plot was developed, enabling the simultaneous visualization of standardized values for weed count, fresh weed mass, and yield across the various management practices (Figure 4).
The radar plot analysis revealed clear distinctions among the evaluated treatments. Treatment CTB1 was positioned furthest from the axes representing the number of weeds and the fresh weight of weeds, while sharply extending toward the yield axis, indicating its superior performance in minimizing weed infestation and maximizing crop productivity. CTB2 also showed a favorable profile with reduced weed infestation and increased yield, but to a lesser extent than CTB1. Treatment MTB1 exhibited a profile more strongly oriented toward the fresh weight of weeds, yet maintained a relatively favorable contribution to yield, suggesting intermediate effectiveness. In contrast, the remaining treatments demonstrated profiles with greater emphasis on the number and fresh weight of weeds, while contributing less to yield performance. Overall, these patterns underscore the advantage of conventional tillage practices, particularly CTB1, in promoting higher yields through more effective weed control strategies.

3.3. Grain Quality Parameters

Significantly higher contents of total protein, wet gluten, and starch were determined in wheat grains harvested from the CT plots compared to those from the MT and NT plots (Table 5). Top dressing with a higher dose of N influenced a statistically significant or very significant increase in the investigated wheat grain quality parameters, especially in the conventional and mulch tillage soil systems.
Similarly, grain density and grain uniformity were higher in the CT system than in the MT and NT systems. The coefficients of variation (CV%s) computed for the grain quality parameters, i.e., protein, gluten, and starch contents, as well as grain density and grain uniformity, were higher for the crops from the MT and NT systems than from the CT system (Table 5).

3.4. C/N Ratio in the Soil

Tillage systems were significantly differentiated by the C/N ratio in the soil (Table 6). The highest C/N ratio was determined in the soil from the CT plots, the lowest from the NT system. Also, the coefficients of variation determined for soil C/N were higher in the CT system than those in the MT and NT systems.

4. Discussion

Weediness in crops, especially broad-row crops, in conservation tillage systems is often the biggest challenge and cause of reduced grain yields. In order to reduce weediness in these systems, it is important to ensure the best possible soil coverage throughout the year and/or during the growing season. In this work, multi-field crop rotation, with significant participation from legumes (dense crops), could contribute to the reduction in weed pressure on the wheat crop. Similar results for winter wheat cropping were presented in the study [28], where the intensity of weed infestation was lowest in the multi-field rotation. Increased weed infestation and deteriorating health of the plants caused adverse changes in the soil under monoculture, resulting in decreased grain yield [29,30]. Increased doses of fertilizers caused increases in the values of the tested weed parameters, especially in conservation tillage systems. Researchers have reported that some weeds absorb chemical fertilizers, especially nitrogen, more rapidly and in comparatively higher doses than crops, which reduces the amount of fertilizer absorbed by the crop [31,32]. Therefore, to increase the efficiency and productivity of fertilizer consumption and reduce crop production costs, it is necessary to control and manage weeds in the field. The tillage systems also had strong impacts on the floristic composition of weeds and in the present study, and significantly more weeds were found on the NT plot than on the MT and CT plots. These weeds also produced a much higher biomass than those identified on plots cultivated in the conventional system. According to [33,34], the no-till system causes an increase in the proportion of weeds that ripen on the stubble fields, sprinkling their seeds and thereby increasing the seed bank in the soil. Perennial weed species prevailed in the present research, especially on the NT plots. For perennial weed species control, the application of conventional tillage is especially efficient [35]. It can be speculated that the absence of perennial weeds on CT plots is due to the mechanical cultivation of the soil. The reduced amount of herbicide in the conservation tillage compared to the conventional method of tillage did not cause greater differences in weediness, which is often the case in broad-row crops. In long-term experiments with maize, when reduced tillage or no-tillage methods were applied, greater amounts of herbicides were needed for weed control, particularly when perennials prevailed [36,37].
Opinions on the impacts of tillage systems and fertilization on cereal grain yields are ambiguous and depend on the research site or agroecological conditions [38,39]. In addition to soil properties, the way soil is tilled significantly impacts how yield components develop and, consequently, the final grain yield [40]. Some studies have repeatedly shown that wheat yields are often lower in conservation tillage systems compared to conventional tillage systems [41,42]. According to Liliane et al. (2020) [42], grain yield, the amount of grain a crop produces, is a complex trait influenced by a multitude of interacting factors, broadly categorized into environmental, biological, and technological aspects. These factors can significantly impact both the quantity and quality of grain. In general, however, a slightly lower grain yield is obtained in no-till systems compared to conventional ones. Also in our experiment, the grain yield of winter wheat was higher in the CT system than in the MT and NT systems, with the difference being significantly smaller than it was in the same location more than 20 years ago [43]. Given that the optimal pH value for growing winter wheat is usually below 7 (or between 6 and 7), the data indicate that the cultivar ‘NS Pobeda’ performed well, even in conditions with a pH higher than 7. Accordingly, 1000-grain weight was also higher in the CT system. This is consistent with a range of investigations which reported higher 1000-grain weights in conventional tillage systems compared to no-tillage and minimum tillage systems [44,45]. In conditions of more pronounced climate change, especially drought in the growing season of crops, conservation systems show greater efficiency and adaptability. In areas with low rainfall and high air temperature, it was found that durum wheat yields are higher in the no-tillage system [46], whereas ref. [47] claims that, in regions with higher precipitation, conventional farming practices often result in higher crop yields compared to other tillage systems. These observations were also confirmed in our study, where annual precipitation amounts, on average, showed a significant predominance during the growing season of plants. Weather conditions and cultural practices (tillage system and fertilization) also affect grain quality. In the study by Amato et al. (2013) [48], the highest content of protein in the grain was achieved with conventional tillage (CT), with a lower one found in the grain from reduced tillage (RT), and the lowest one in the grain from no tillage (NT). Fertilization with a higher amount of N led to an increase in protein content, especially in the NT system. According to Amato et al. (2013) [48], wheat fertilization requirements for nitrogen are higher in NT systems than CT ones, due to the lower availability of nitrogen for plants. Also in the present study, grains of winter wheat from the conventional tillage (CT) system contained more protein, gluten, and starch, and was denser and more uniform than grains collected from both conservation soil systems (MT and NT). It is in accordance with the results of [48,49,50], which demonstrated decreased wheat grain content of protein under NT conditions, in comparison to CT or reduced tillage (RT) systems. However, ref. [51] showed that the type of tillage system (CT or NT) did not influence protein content, nor wet gluten content, in wheat grain. Reduced crude protein content in crops under low tillage systems is linked to altered nitrogen (N) dynamics. Studies by ref. [52,53] showed that conventional and reduced tillage lead to higher soil organic carbon (SOC) mineralization, compared to no tillage. This increased SOC breakdown resulted in lower net N and potassium (K) availability levels. The reduced net supply of inorganic N directly limits the plant’s ability to synthesize protein, thereby lowering crude the protein content of the crop.
Both tillage systems and fertilization methods can significantly impact the chemical characteristics of soil, but the greatest impact on the C/N ratio can be weather conditions [54]. Authors [55] state that no-till cultivation reduces N and organic C losses in the soil compared to conventional tillage, thereby narrowing the C/N ratio values and increasing nitrogen availability to plants. This was also confirmed in the conducted study, in which the C/N ratio was most preferable in the soil from the NT plots, compared to those from the MT and CT plots.

5. Conclusions

The tillage systems differed significantly in the weed parameters investigated. The numbers of weeds per m2 and their fresh and aerial dry weights were higher in the MT and NT plots than in the CT plots. The grain yield of winter wheat was higher with conventional tillage (CT) than with mulch tillage (MT) and no tillage (NT). In addition, more spikes per m2 were found in the CT plots than in the MT and NT plots. The grain weight per spike and the 1000-grain weight were also higher in the CT plots than in the MT and NT plots. Higher levels of total protein, wet gluten, and starch were found in the wheat grains of the CT plots than in those of the MT and NT plots. Grain density and grain uniformity also reached higher values in the CT system than in MT and NT systems. The most favorable C/N ratio was achieved in the NT plots, while the least favorable was achieved in the CT plots. The results obtained showed the potential advantages of conventional and conservation tillage, which should be carefully considered when establishing a wheat-based system and adapting it to future climate changes. Also, the farmer should carefully recognize the cultivation technology of winter wheat and consider the climate and soil conditions.

Author Contributions

Conceptualization, Ž.D. and D.K.; methodology, Ž.D. and D.K.; software, M.B.; validation, M.B., D.J., and S.Š.; formal analysis, Ž.D. and S.R.N.; investigation, Ž.D. and M.B.; resources, D.J. and S.R.N.; data curation, Ž.D.; writing—original draft preparation, Ž.D.; writing—review and editing, S.Š. and D.J.; visualization, S.R.N. and S.P.; supervision, Ž.D.; project administration, S.R.N. and S.P.; funding acquisition, all. All authors have read and agreed to the published version of the manuscript.

Funding

This research received no external funding.

Data Availability Statement

The original contributions presented in the study are included in the article; further inquiries can be directed to the corresponding author.

Acknowledgments

This paper was created within the framework of the “Agreement on the implementation and financing of scientific research in 2025 between the Ministry of Science, Technological Development and Innovation of the Republic of Serbia and the Faculty of Agriculture of the University of Belgrade, contract registration number: 451-03-137/2025-03/200116” and the “Agreement on the implementation and financing of scientific research in 2025 between the Ministry of Science, Technological Development and Innovation of the Republic of Serbia and “Tamiš” Research and Development Institute, Pančevo, contract registration number: 451-03-136/2025-03/200054”.

Conflicts of Interest

The authors declare no conflicts of interest.

References

  1. Zheng, J.; Zhang, S. Assessing the Impact of Climate Change on Winter Wheat Production in the North China Plain from 1980 to 2020. Agriculture 2025, 15, 449. [Google Scholar] [CrossRef]
  2. Statistical Yearbook 2024; Statistical Office of the Republic of Serbia: Belgrade, Serbia, 2024. Available online: https://publikacije.stat.gov.rs/G2024/Pdf/G20242057.pdf (accessed on 23 May 2025).
  3. Lobell, D.B.; Schlenker, W.; Costa-Roberts, J. Climate Trends and Global Crop Production Since 1980. Science 2011, 333, 616–620. [Google Scholar] [CrossRef] [PubMed]
  4. Pinke, Z.; Lovei, G.L. Increasing temperature cuts back crop yields in Hungary over the last 90 years. Glob. Change Biol. 2017, 23, 5426–5435. [Google Scholar] [CrossRef] [PubMed]
  5. Qiao, L.; Wang, X.; Smith, P.; Fan, J.; Lu, Y.; Emmett, B.; Li, R.; Dorling, S.; Chen, H.; Liu, S.; et al. Soil quality both increases crop production and improves resilience to climate change. Nat. Clim. Change 2022, 12, 574–580. [Google Scholar] [CrossRef]
  6. Abubajar, S.A.; Hamani, A.K.M.; Wang, G.; Liu, H.; Mehmood, F.; Abdullahi, A.S.; Gao, Y.; Duan, A. Growth and nitrogen productivity of drip-irrigated winter wheat under different nitrogen fertigation strategies in the North China Plain. J. Integr. Agric. 2023, 22, 908–922. [Google Scholar] [CrossRef]
  7. RZS. Survey on the Structure of Agricultural Holdings—Soil. 2018. Available online: https://www.stat.gov.rs/sr-latn/oblasti/poljoprivreda-sumarstvo-i-ribarstvo/anketaostrukturipopgazdinstava/ (accessed on 26 April 2025).
  8. Haddaway, N.R.; Hedlund, K.; Jackson, L.E.; Kätterer, T.; Lugato, E.; Thomsen, I.K.; Isberg, P.E. How does tillage intensity affect soil organic carbon? A systematic review protocol. Environ. Evid. 2017, 6, 30. [Google Scholar] [CrossRef]
  9. Fangueiro, D.; Becerra, D.; Albarrán, Á.; Peña, D.; Sanchez-Llerena, J.; Rato-Nunes, J.M.; López-Piñeiro, A. Effect of tillage and water management on GHG emissions from Mediterranean rice growing ecosystems. Atmos. Environ. 2017, 150, 303–312. [Google Scholar] [CrossRef]
  10. Hossain, M.S.; Al-Mamun, M.; Ferdous, J.; Kamrujjaman, M.; Miah, A.; Hasan, A.K.; Parvez Anwar, M.; Begum, M.; Romij Uddin, M. Effective Weed Control and Fiber Yield Improvement in Jute Through Seeding and Row Spacing Strategies. J. Soil Plant Environ. 2025, 4, 72–93. [Google Scholar] [CrossRef]
  11. Shukla, A.; Kumar, M.; Shukla, A. Effect of conservation tillage and precision nitrogen management on wheat: A review. Int. J. Plant Soil Sci. 2022, 34, 87–97. [Google Scholar] [CrossRef]
  12. Zikeli, S.; Gruber, S. Reduced tillage and no-till in organic farming systems, Germany-Status quo, potentials and challenges. Agriculture 2017, 7, 35. [Google Scholar] [CrossRef]
  13. Junge, S.M.; Storch, J.; Finckh, M.R.; Schmidt, J.H. Developing organic minimum tillage farming systems for Central and Northern European conditions. In No-Till Farming Systems for Sustainable Agriculture: Challenges and Opportunities; Springer: Cham, Switzerland, 2020; pp. 173–192. [Google Scholar]
  14. Jaćimović, G.; Aćin, V.; Crnobarac, J.; Latković, D.; Manojlović, M. Effects of crop residue incorporation on the wheat yield in a long-term experiment. Ann. Agron. 2017, 41, 1–8. [Google Scholar]
  15. Molnar, I.; Ðević, M.; Marković, D.; Martinov, M.; Momirović, N.; Lazić, V.; Škrbić, N.; Turan, J.; Kurjački, J. Terminology and classification of soil conservation tillage. Contemp. Agric. Eng. 1999, 25, 139–153. [Google Scholar]
  16. Šeremešić, S.; Ćirić, V.; Jaćimović, G.; Milošev, D.; Belić, M.; Vojnov, B.; Živanov, M. The influence of conventional and conservation tillage on content of total and labile soil organic matter. Soil Plant 2016, 65, 7–18. [Google Scholar]
  17. Šeremešić, S.; Ćirić, V.; Djalović, I.; Vasin, J.; Zeremski, T.; Siddique, K.H.; Farooq, M. Long-term winter wheat cropping influenced soil organic carbon pools in different aggregate fractions of Chernozem soil. Arch. Agron. Soil Sci. 2020, 66, 2055–2066. [Google Scholar] [CrossRef]
  18. Jug, D.; Jug, I.; Brozović, B.; Šeremešić, S.; Dolijanović, Ž.; Zsembeli, J.; Ujj, A.; Marjanovic, J.; Smutny, V.; Dušková, S.; et al. Conservation Soil Tillage: Bridging Science and Farmer Expectations—An Overview from Southern to Northern Europe. Agriculture 2025, 15, 260. [Google Scholar] [CrossRef]
  19. Dolijanović, Ž.; Šeremešić, S.; Simić, M.; Kovačević, D. Conservation tillage in Serbia: Status and perspectives. In Proceedings of the Scientific Conference on the Occasion of 25 Years of Existence and Work of the Department of Biotechnical Sciences of the Academy of Engineering Sciences of Serbia “The Importance and Place of Biotechnology in the Economic Development of Serbia”, Zemun Polje, Zemun, Belgrade, Serbia, 7 November 2024; Thematic proceedings. pp. 77–93. [Google Scholar]
  20. Mikos-Szymańska, M.; Borowik, M.; Wyzińska, M.; Rusek, P. Effects of different fertilizer treatments on grain yield and yield components of spring wheat. Res. Rural. Dev. 2018, 2, 100–106. [Google Scholar] [CrossRef]
  21. Food and Agriculture Organization of the United Nations (FAO). Strategic Work of FAO for Sustainable Food and Agriculture; FAO: Rome, Italy, 2017; p. 28. [Google Scholar]
  22. IUSS Working Group WRB. World Reference Base for Soil Resources. In International Soil Classification System for Naming Soils and Creating Legends for Soil Maps, 4th ed.; International Union of Soil Sciences (IUSS): Vienna, Austria, 2022; p. 236. [Google Scholar]
  23. Nikolic, S.R.; Dolijanovic, Z.; Kovacevic, D.; Oljaca, S.; Seremesic, S. Morphological and productive characteristics of hulless barley in organic farming. Field Veg. Crops Res./Ratar. I. Povrt. 2020, 57, 27–34. [Google Scholar]
  24. Andruszczak, S.; Kraska, P.; Kwiecińska-Poppe, E.; Skowrońska, M. Cultivar and foliar feeding of plants as factors determining the chemical composition of spelt (Triticum aestivum ssp. spelta L.) grain. Appl. Ecol. Environ. Res. 2020, 18, 2949–2958. [Google Scholar] [CrossRef]
  25. ICC Standard No. 137/1; Mechanical Determination of the Wet Gluten Content of Wheat Flour (Glutomatic). International Association for Cereal Science and Technology: Wien, Austria, 1994.
  26. ISO 5983-1:2005; Animal Feeding Stuffs. Determination of Nitrogen Content and Calculation of Crude Protein Content. Part 1. Kjeldahlmethod. ISO: Geneva, Switzerland, 2019.
  27. Angelova, V.R.; Akova, V.I.; Ivanov, K.I. Comparative study of the methods for the determination of organic carbon and organic matter in soils, compost and sludge. Bulg. Chem. Commun. 2019, 51, 342–347. [Google Scholar] [CrossRef]
  28. Nikolić, L.; Šeremešić, S.; Milošev, D.; DJalović, I.; Latković, D. Weed infestation and biodiversity of winter wheat under the effect of long-term crop rotation. Appl. Ecol. Environ. Res. 2018, 16, 1413–1426. [Google Scholar] [CrossRef]
  29. Sieling, K.; Stahl, C.; Winkelmann, C.; Christen, O. Growth and yield of winter wheat in the first 3 years of a monoculture under varying N fertilization in NW Germany. Eur. J. Agron. 2005, 22, 71–84. [Google Scholar] [CrossRef]
  30. Shahzad, M.; Farooq, M.; Jabran, K.; Hussain, M. Impact of different crop rotations and tillage systems on weed infestation and productivity of bread wheat. Crop Prot. 2016, 89, 161–169. [Google Scholar] [CrossRef]
  31. Di Tomaso, J.M. Approaches for improving crop competitiveness through the manipulation of fertilization strategies. Weed Sci. 1995, 43, 491–497. [Google Scholar] [CrossRef]
  32. Barker, D.C.; Knezevic, S.Z.; Martin, A.R.; Walters, D.T.; Lindquist, J.L. Effect of nitrogen addition on the comparative productivity of corn and velvetleaf (Abutilon theophrasti). Weed Sci. 2006, 54, 354–363. [Google Scholar] [CrossRef]
  33. Davis, A.S.; Renner, K.A.; Gross, K.L. Weed seedbank community shifts in a long-term cropping experiment. Weed Sci. 2005, 53, 296–306. [Google Scholar] [CrossRef]
  34. Chauhan, B.S.; Gill, G.S.; Preston, C. Tillage system effects on weed ecology, herbicide activity and persistence: A review. Aust. J. Exp. Agríc. 2006, 46, 1557–1570. [Google Scholar] [CrossRef]
  35. Simić, M.; Dragičević, V.; Chachalis, D.; Dolijanović, Ž.; Brankov, M. Integrated weed management in long-term maize cultivation. Zemdirbyste-Agriculture 2020, 107, 33–40. [Google Scholar] [CrossRef]
  36. Simić, M.; Brankov, M.; Dragičević, V.; Videnović, Ž.; Kresović, B. Maize weed infestation under different soil tillage systems and fertilization levels. Herbologia 2012, 13, 59–72. Available online: http://www.anubih.ba/images/publikacije/herbologia/herbologia_13_1.pdf (accessed on 25 June 2025).
  37. Simić, M.; Spasojević, I.; Kovacević, D.; Brankov, M.; Dragicević, V. Crop rotation influence on annual and perennial weed control and maize productivity. Rom. Agric. Res. 2016, 33, 125–133. Available online: https://www.incda-fundulea.ro/rar/nr33/rar33.14.pdf (accessed on 25 June 2025).
  38. Morris, N.L.; Miller, P.C.H.; Orson, J.H.; Froud-Williams, R.J. The adoption of non-inversion tillage systems in the United Kingdom and the agronomic impact on soil, crops and the environment—A review. Soil Tillage Res. 2010, 108, 1–15. [Google Scholar] [CrossRef]
  39. Woźniak, A.; Rachoń, L. Effect of Tillage Systems on the Yield and Quality of Winter Wheat Grain and Soil Properties. Agriculture 2020, 10, 405. [Google Scholar] [CrossRef]
  40. Piao, L.; Li, M.; Xiao, J.; Gu, W.; Zhan, M.; Cao, C.; Zhao, M.; Li, C. Effects of Soil Tillage and Canopy Optimization on Grain Yield, Root Growth, and Water Use Efficiency of Rainfed Maize in Northeast China. Agronomy 2019, 9, 336. [Google Scholar] [CrossRef]
  41. Seepamore, M.K.; du Preez, C.C.; Ceronio, G.M. Impact of long-term production management practices on wheat grain yield and quality components under a semi-arid climate. S. Afr. J. Plant Soil 2020, 37, 194–201. [Google Scholar] [CrossRef]
  42. Liliane, T.N.; Charles, M.S. Factors Affecting Yield of Crops. In Agronomy—Climate Change & Food Security; Khan, A., Ed.; IntechOpen: London, UK, 2020; pp. 9–24. [Google Scholar] [CrossRef]
  43. Kovačević, D.; Denčić, S.; Kobiljski, B.; Momirović, N.; Oljača, S.; Dolijanović, Ž. Effect of farming systems on soil compaction, weed synuzia and yield of winter wheat. Acta Herbol. 2004, 13, 385–392. [Google Scholar]
  44. Šíp, V.; Vavera, R.; Chrpová, J.; Kusá, H.; Růžek, P. Winter wheat yield and quality related to tillage practice, input level and environmental conditions. Soil Tillage Res. 2013, 132, 77–85. [Google Scholar] [CrossRef]
  45. Ruisi, P.; Saia, S.; Badagliacca, G.; Amato, G.; Frenda, A.S.; Giambalvo, D.; Di Miceli, G. Long-term effects of no tillage treatment on soil N availability, N uptake, and 15N-fertilizer recovery of durum wheat differ in relation to crop sequence. Field Crops Res. 2016, 189, 51–58. [Google Scholar] [CrossRef]
  46. López-Bellido, L.; Fuentes, M.; Castillo, J.E.; López-Garrido, F.J. Effect of tillage, crop rotation and nitrogen fertilization on wheat grain quality grown under rainfed Mediterranean conditions. Field Crops Res. 1998, 57, 265–276. [Google Scholar] [CrossRef]
  47. Fishman, R. More uneven distributions overturn benefits of higher precipitation for crop yields. Environ. Res. Lett. 2016, 11, 024004. [Google Scholar] [CrossRef]
  48. Amato, G.; Ruisi, P.; Frenda, A.S.; Di Miceli, G.; Saia, S.; Plaia, A.; Giambalvo, D. Long-term tillage and crop sequence e_ects on wheat grain yield and quality. Agron. J. 2013, 105, 1317–1327. [Google Scholar] [CrossRef]
  49. Ahmadi, H.; Mirseyed Hosseini, H.; Moshiri, F.; Alikhani, H.A.; Etesami, H. Impact of varied tillage practices and phosphorus fertilization regimes on wheat yield and grain quality parameters in a five-year corn-wheat rotation system. Sci. Rep. 2024, 14, 14717. [Google Scholar] [CrossRef] [PubMed]
  50. Ali, S.A.; Tedone, L.; Verdini, L.; Cazzato, E.; De Mastro, G. Wheat response to no-tillage and nitrogen fertilization in a long-term faba bean-based rotation. Agronomy 2019, 9, 50. [Google Scholar] [CrossRef]
  51. Gawęda, D.; Haliniarz, M. Grain Yield and Quality of Winter Wheat Depending on Previous Crop and Tillage System. Agriculture 2021, 11, 133. [Google Scholar] [CrossRef]
  52. Loke, P.F.; Heine, H.G.; Rhode, O.H.J.; Kotzé, E.; Du Preez, C.C. Tillage and its temporal effects on soil organic matter and microbial characteristics in the semi-arid central South Africa. Soil Res. 2021, 60, 294–309. [Google Scholar] [CrossRef]
  53. Sarker, J.R.; Singh, B.P.; Dougherty, W.J.; Fang, Y.; Badgery, W.; Hoyle, F.C.; Dalal, R.C.; Cowie, A.L. Impact of agricultural management practices on the nutrient supply potential of soil organic matter under long-term farming systems. Soil Tillage Res. 2018, 175, 71–81. [Google Scholar] [CrossRef]
  54. Xia, Y.; Congsheng, F.; Liao, A.; Wu, H.; Wu, H.; Zhang, H.; Xu, X.; Chen, J. Influences of extreme weather events on the carbon to nitrogen ratios of major staple crops. Sci. Total Eng. 2025, 969, 178943. [Google Scholar] [CrossRef] [PubMed]
  55. Wang, X.; Fan, J.; Xing, Y.; Xu, G.; Wang, H.; Deng, J.; Wang, Y.; Zhang, F.; Li, P.; Li, Z. Chapter three—the effects of mulch and nitrogen fertilizer on the soil environment of crop plants. Adv. Agron. 2019, 153, 121–173. [Google Scholar] [CrossRef]
Figure 1. The location of the study area (44°45′ N, 20°35′ E Serbia, 130 m a.m.s.l) at different scales.
Agronomy 15 01742 g001
Figure 2. Average monthly mean air temperature (°C) and precipitation sum (mm) over a long-term period and during the examination.
Agronomy 15 01742 g002
Figure 3. Correlation heatmap of the evaluated indices, weed count, fresh weed mass, and yield.
Agronomy 15 01742 g003
Figure 4. Radar plot of standardized number of weeds, fresh weight of weeds, and yield indices across treatments.
Agronomy 15 01742 g004
Table 1. Physicochemical properties of soil—September, 2021 (0–30 cm).
TraitsValue
Clay (<0.002 mm)27%
Silt (0.002–0.05 mm)22%
Sand (0.05–2.0 mm)51%
Total N (%)0.13
P (mg 100 g−1 dw)22.18
Organic matter (%)3.26
K (mg 100 g−1 dw)19.10
pHH2O8.04
Table 2. Number, and fresh and air-dry weights of weeds in winter wheat crop (means from 2020/21 to 2022/23 ± CV%).
SpecificationTillage System (A)p
CTMTNT
Top Dressing in Spring (B)ABAB
B1B2B1B2B1B2
Number of weeds per m216.4 ±19.4 c15.9 ± 18.5 d28.8 ± 28.6 b28.2 ± 27.1 b36.8 ± 32.2 a36.4 ± 31.7 a**ns**
Fresh weight of weeds g m−221.7 ± 22.4 d20.3 ± 21.2 e42.5 ± 27.9 c34.7 ± 27.5 c48.2 ± 33.9 a44.4 ± 32.0 b******
Air-dry weight of weeds g m−216.4 ± 30.1 e16.1 ± 31.9 d25.5 ± 32.6 c21.7 ± 32.1 cd26.6 ± 37.4 a32.3 ± 36.5 b*****
CT—conventional tillage; MT—mulch tillage; NT—no tillage. B1—high N dose (120 kg ha−1 N); B2—reduced N dose (60 kg ha−1 N). Coefficients of variation (CV%s). Different letters indicate significant differences. * p < 0.05; ** p < 0.01; ns—no statistical differences.
Table 3. Species composition of weeds in a canopy of winter wheat (means from 2020/21 to 2022/23).
Species CompositionTillage System (A)
CTMTNT
Top Dressing in Spring (B)
B1B2B1B2B1B2
Annual weeds
Avena fatua L.2.4 7.65.46.95.1
Sinapis arvensis L. 3.64.73.53.4
Papaver rhoeas 2.22.8
Perennial weeds
Bellis perennis L.1.8 3.33.11.9
Cirsium arvense (L.) Scop. 4.35.44.25.84.1
Convolvulus arvensis L.6.35.55.95.55.26.4
Lolium perenne L. 6.1
Sonchus arvensis L.8.92.66.15.0 3.9
Sorghum halepense L. 5.54.1
Number of weeds per m219.418.528.627.132.231.7
Number of species445678
Table 4. Grain yield of winter wheat and its components (means from 2020/21 to 2022/23 ± CV%).
SpecificationTillage System (A)p
CTMTNT
Top Dressing in Spring (B)ABAB
B1B2B1B2B1B2
Grain yield in t ha−15.91 ± 6.2 e5.36 ± 6.6 e5.32 ± 11.1 d5.16 ± 11.7 c5.08 ± 13.7 b4.65 ± 14.5 a****ns
Plant number after emergence per m2551.1 ± 9.5 b537.7 ± 14.7 a529.3 ± 14.8 a*n.a n.a
Spike number per m215.34 ± 8.1 d14.98 ± 8.8 c14.98 ± 15.4 a14.36 ± 15.3 a14.92 ± 14.8 b14.4 ± 14.9 b****ns
Grain weight per spike in g2.03 ± 9.5 e1.81 ± 10.2 d1.82 ± 17.8 b1.64 ± 18.4 a1.49 ± 16.3 c1.4 ± 16.8 c****ns
1000-grain weight in g41.83 ± 10.1 e42.75 ± 10.9 d 40.34 ± 12.6 c41.49 ± 12.1 c40.26 ± 14.2 b41.08 ± 15.6 a*nsns
CT—conventional tillage; MT—mulch tillage; NT—no tillage. B1—high N dose (120 kg ha−1 N); B2—reduced N dose (60 kg ha−1 N). Coefficients of variation (CV%s). Different letters indicate significant differences. * p < 0.05; ** p < 0.01; ns—no statistical differences; n.a—not applicable.
Table 5. Quality parameters of winter wheat grain (means from 2020/21 to 2022/23).
SpecificationTillage System (A)p
CTMTNT
Top Dressing in Spring (B)ABAB
B1B2B1B2B1B2
Total protein content %13.3 ± 9.4 a13.1 ± 9.7 a12.8 ± 13.9 b12.2 ± 14.4 b12.4 ± 15.7 c12.0 ± 15.9 c*nsns
Wet gluten content %33.1 ± 7.9 a32.9 ± 8.3 a31.4 ± 13.3 b31.9 ± 13.9 b29.2 ± 15.7 c30.7 ± 16.3 c****
Starch content %58.7 ± 7.5 a57.4 ± 7.2 a54.9 ± 15.5 b54.1 ± 15.9 b53.2 ± 16.3 c54.0 ± 16.7 c****
Grain density kg hL−1 71.2 ± 9.8 a70.4 ± 9.9 a69.6 ± 20.2 b68.1 ± 20.4 b68.2 ± 18.6 c67.8 ± 19.1 c****
Grain uniformity %88.8 ± 8.0 a88.1 ± 8.2 a80.4 ± 17.7 b79.6 ± 17.9 b77.5 ± 19.5 c76.8 ± 19.8 c***ns
CT—conventional tillage; MT—mulch tillage; NT—no tillage. B1—high N dose (120 kg ha−1 N); B2—reduced N dose (60 kg ha−1 N). Coefficients of variation (CV%s). Different letters indicate significant differences. * p < 0.05; ** p < 0.01; ns—no statistical differences.
Table 6. C/N ratio in the soil (layer 0–30 cm) and coefficients of variation (CV%s) (means from 2020/21 to 2022/23).
SpecificationTillage System (A)Value p
CTMTNT
C/N ratio18.2 a17.4 b15.6 c*
CV%18.3 a8.7 c9.5 b-
CT—conventional tillage; MT—mulch tillage; NT—no tillage. Different letters indicate significant differences; * p < 0.05.
Disclaimer/Publisher’s Note: The statements, opinions and data contained in all publications are solely those of the individual author(s) and contributor(s) and not of MDPI and/or the editor(s). MDPI and/or the editor(s) disclaim responsibility for any injury to people or property resulting from any ideas, methods, instructions or products referred to in the content.

