Article

Method and Optimization of Key Parameters of Soil Organic Matter Detection Based on Pyrolysis Coupled with Artificial Olfaction

1
School of Agricultural Engineering and Food Science, Shandong University of Technology, Zibo 255000, China
2
Institute of Modern Agricultural Equipment, Shandong University of Technology, Zibo 255000, China
3
Shandong Provence Key Laboratory of Smart Agricultural Technology and Intelligent Farm Machinery Equipment for Field Crops, Zibo 255000, China
*
Author to whom correspondence should be addressed.
Agronomy 2025, 15(7), 1740; https://doi.org/10.3390/agronomy15071740
Submission received: 21 June 2025 / Revised: 11 July 2025 / Accepted: 15 July 2025 / Published: 19 July 2025

Abstract

Accurate quantification of soil organic matter (SOM) is crucial for improving soil fertility and maintaining ecosystem health. The content of SOM affects soil nutrient availability and is closely linked to the global carbon cycle. The use of an electronic nose to detect SOM contents has the advantages of rapidity, accuracy, and low pollution to the environment. This study proposes a method for obtaining SOM contents via pyrolysis coupled with an artificial olfaction system. To improve the accuracy of SOM content determination, the effects of three parameters (pyrolysis temperature, pyrolysis time, and soil sample mass) related to the pyrolysis process on the distinguishability of pyrolysis gases were investigated. Firstly, single-factor experiments were conducted to determine the optimal values of three parameters that can improve the differentiation of pyrolysis gases. Secondly, a regression model based on the Box–Behnken experiment was established to analyze the interrelationships between the three parameters and the discrete ratio. The experimental results showed that the three parameters exerted significant influences on the discrete ratio, with pyrolysis time having the greatest impact, followed by soil sample mass and pyrolysis temperature. The optimal discrimination and minimal dispersion ratio of the pyrolysis gases were achieved at a pyrolysis temperature of 384 °C, with a pyrolysis time of 2 min 41 s and a soil sample mass of 1.68 g. Finally, the Back-Propagation Neural Network (BPNN) and Partial Least-Squares Regression (PLSR) algorithms were used to establish an SOM prediction model after obtaining soil pyrolysis gases under the optimal combination of pyrolysis parameters. The experimental results demonstrated that the SOM prediction model based on PLSR achieved the best accuracy and the highest generalization capability, with R2 > 0.85 and RMSE < 7.21. This study could provide a theoretical basis for the prediction of SOM contents via pyrolysis coupled with an artificial olfaction system.

1. Introduction

Soil organic matter (SOM), as an important component of soil, has a significant impact on plant growth and soil fertility [1,2]. It supplies essential nutrients, such as nitrogen, phosphorus, and potassium, while components like humic acid and vitamins can enhance plant respiration, increase cell membrane permeability, and facilitate nutrient absorption [3,4]. SOM also improves soil physical properties by enabling different soil types to form a granular structure, increasing porosity, enhancing water retention and permeability, and promoting plant growth and development [5,6,7]. In addition, SOM provides energy to microorganisms; promotes their activities; breaks down organic matter to release nutrients; and improves soil fertility, fertility retention, and buffer capacity [8]. SOM content is positively correlated with soil fertility level within a certain range, which can represent high and low levels of soil fertility and guide the application of fertilizers [9,10]. Therefore, accurate and rapid measurement of SOM content and its dynamic changes is crucial for realizing precision agriculture and promoting sustainable agricultural development [11,12,13].
Currently, the main methods for measuring SOM content include the scorching method, the volumetric method with potassium dichromate, the spectroscopic method, and the nuclear magnetic resonance (NMR) technique [14]. The scorching method involves burning soil samples at a high temperature to oxidize the carbon in the organic matter into carbon dioxide and then calculating the SOM content by measuring the amount of carbon dioxide released through weighing or with a gas analyzer. This method is easy to implement and accurate, but it is time-consuming [15]. The volumetric method with potassium dichromate is one of the commonly used methods in the laboratory. The method involves adding a potassium dichromate–sulfuric acid solution to air-dried soil samples, oxidation of the organic carbon in the soil under heating conditions, titration of the remaining potassium dichromate with a standard solution of ferrous sulphate, calculation of the content of organic carbon based on the amount of potassium dichromate that has been consumed, and finally, the multiplication of this value by a conversion factor to obtain the organic matter content of the soil. The principle of the method is simple, the measurements are accurate, and the cost is low, but there are problems, such as the complicated operation, the limitation on organic matter contents, and the high reagent consumption [16,17,18,19]. Spectroscopy involves the use of spectroscopic principles and experimental methods. The organic matter content of soil samples is determined by measuring their spectral characteristics, and this method is suitable for rapid batch experimentation [20,21,22,23]. However, this method is susceptible to soil moisture, iron oxide, and texture. The nuclear magnetic resonance (NMR) technique is used to analyze the organic matter content of soil by determining the chemical structural characteristics of SOM. This method can provide detailed chemical information, but the equipment cost is relatively high [24].
Pyrolysis gas chromatography–mass spectrometry (Py-GC/MS) is widely used in the analysis of soil constituents due to its advantages of rapidity, sensitivity, and small sample size requirement [25]. Chen et al. [26] used the Py-GC/MS technique to study fingerprint differences in the organic matter of alpine grassland soils; analyzed 150 pyrolysis products qualitatively and quantitatively; and classified them on the basis of similar chemical properties into alkyl compounds, aromatics, polycyclic aromatic hydrocarbons, lignin, phenolic compounds, polysaccharides, nitrogenous compounds, and chitin. Campo et al. [27] determined the effect of heating soil samples from the Mediterranean region under laboratory conditions on the quality and quantity of SOM by comparing the samples with unheated control samples (25 °C) at different temperatures (220 °C, 380 °C, and 500 °C). Then, they used Py-GC/MS to analyze the changes in the cleavage products of the samples treated at different temperatures. The Py-GC/MS method requires pyrolysis equipment, gas chromatography–mass spectrometry (GC-MS), and other equipment. This method detects the content of each component of SOM; the operation process is complicated, it involves the measurement of many elements, and it is not conducive to rapid detection in agriculture.
Electronic nose technology is a comprehensive detection technology. It incorporates sensor technology, signal processing, computer science, pattern recognition, deep learning, etc. It mimics the process of sensing, analyzing, and identifying gases using the human olfaction system [28,29]. Currently, electronic nose technology is widely used in the fields of food safety [30,31], medical analysis [32,33], and environmental detection [34]. Several studies have also explored its application in soil properties and SOM detection [35]. For example, Bieganowski et al. [36] used an electronic nose to classify soils with different moisture levels. Lavanya et al. [37] determined the hyaluronic acid and free fatty acid contents in soil using an electronic nose. Zhu et al. [38] detected SOM contents using an electronic nose system with a single sensor array. They developed predictive models using three methods: the partial least squares regression (PLSR) algorithm, the back propagation neural network (BPNN) algorithm, and the support vector regression (SVR) algorithm. Among them, the SVR model has the highest predictive performance, with an R2 of 0.91.
In summary, this study proposes a rapid detection method for detecting SOM contents using a pyrolysis furnace coupled with artificial olfaction and optimizes the key parameters of the pyrolysis furnace. The author uses the pyrolysis furnace technique to pyrolyze a small amount of soil sample, generating gas that a gas sensor array detects to obtain a response curve. Response curves of soil samples with different organic matter contents were selected for the study, along with the pyrolysis temperature, pyrolysis time, and soil sample mass as experimental factors. The discrete ratio was used as an indicator for single-factor optimization experiments and response surface experiments to derive optimal parameter combinations. Under the optimal experiment parameters, response curves of soil samples were collected using a pyrolysis furnace coupled with an artificial olfaction system to capture pyrolysis gases. Predictive modeling of SOM using BPNN and PLSR algorithms enables rapid, low-cost detection of SOM content.

2. Materials and Methods

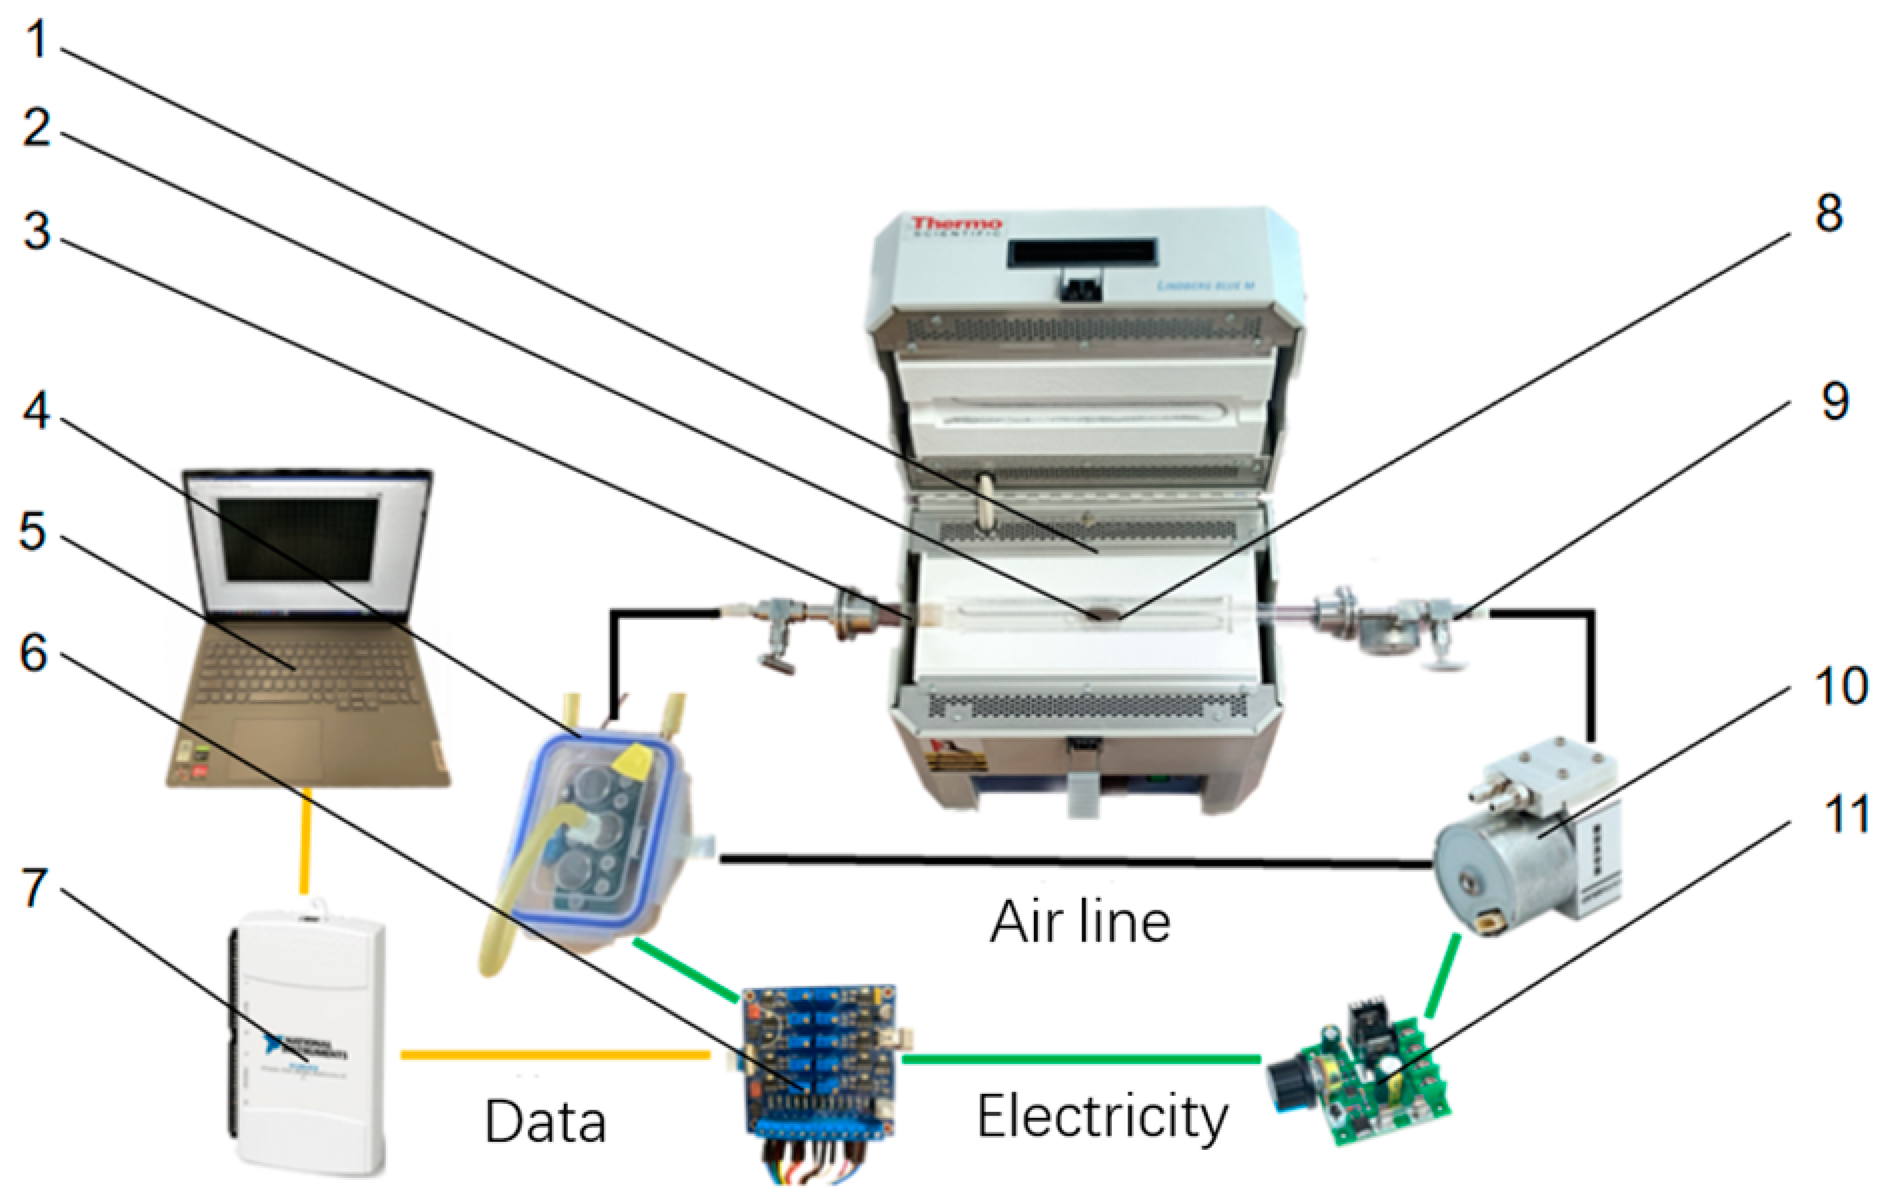
2.1. Detection System Hardware Design

As shown in Figure 1, we designed an SOM detection system based on a pyrolysis furnace. This system consists of a pyrolysis device and an artificial olfactory system. The pyrolysis device is used for the pyrolysis of soil samples. It mainly consists of a pyrolysis furnace, a vacuum flange, a quartz boat, and a quartz tube. The pyrolysis furnace was manufactured by Thermo Scientific Lindberg, located in Waltham, MA, USA. The vacuum pyrolysis chamber is composed of vacuum flanges and quartz tubes and is used to enable the soil to undergo pyrolysis under vacuum conditions. The artificial olfaction system mainly consists of a gas reaction chamber (built-in gas sensor array), a signal processing circuit, an NI data acquisition card, and a computer. The gas reaction chamber is rectangular in shape, made of polypropylene resin, and has good chemical stability and corrosion resistance. The gas sensor array produces a specific response to soil gases generated by the pyrolysis furnace; signal processing circuitry can power the gas sensor array and convert the resistance signal of the gas sensor into a voltage signal. The data acquisition card is connected to the signaling circuitry via a DuPont line, which in turn enables the acquisition of sensor data. Finally, the collected data are transferred to the computer via USB data line, displayed, and stored using LabView2020 software. The products of the pyrolysis furnace of soil are mainly hydrocarbons, olefins, aromatic hydrocarbons, nitrogen-containing compounds, fatty acids, lignin, phenolic compounds, polysaccharides, chitin, and other materials. Therefore, ten oxide semiconductor gas sensors, TGS 826, TGS 2602, TGS 2610, TGS 2620, TGS 821, TGS 2603, TGS 2611, TGS 823, TGS 2600, and TGS 2612, manufactured by Figaro, located in Shanghai, China, were selected to form the gas sensor array and were numbered sequentially as S1 to S10 [39].

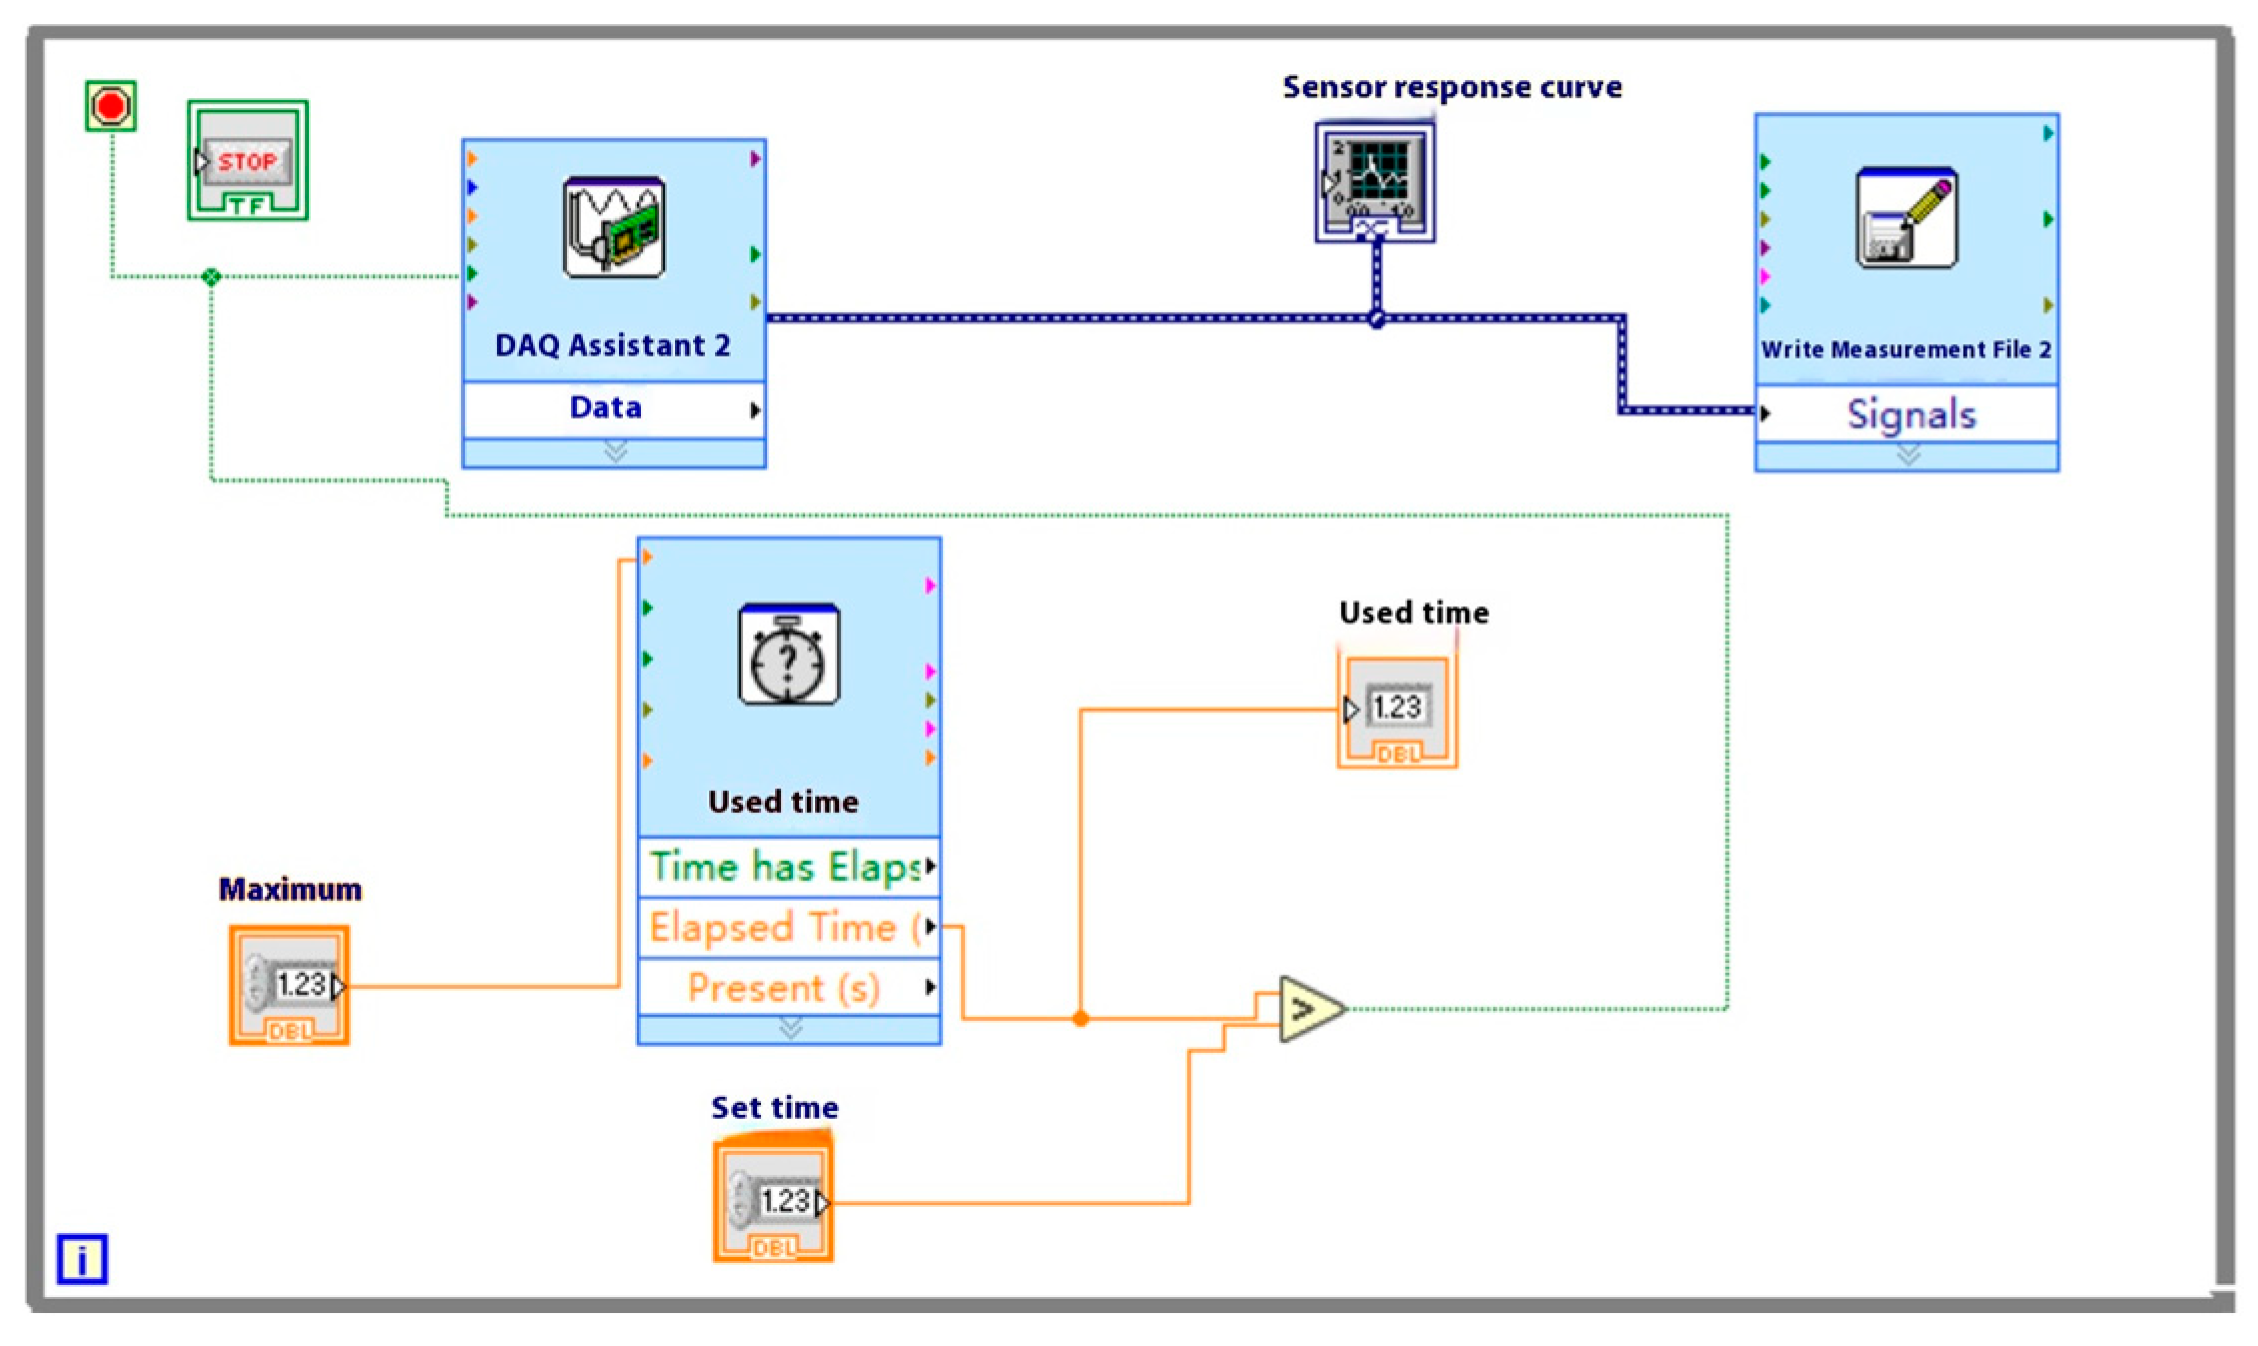
2.2. Detection System Software Design

The detection system is composed of 10 different types of gas sensors. Therefore, it is necessary to simultaneously collect the output signals from all 10 sensors. In this study, the USB-6210 data acquisition card manufactured by National Instruments (NI), located in Austin, TX, USA, was selected as the hardware device for data acquisition in the pyrolysis-coupled artificial olfaction SOM detection system. The USB-6210 data acquisition card connects directly to the computer via USB for both power supply and data transmission. It provides sixteen 16-bit analog input interfaces and supports sampling frequency up to 250 Ks/s, with four digital input and digital output interfaces, respectively, which meet the needs of this system design.
The upper computer software developed using LabVIEW 2020 can display and store the signal values of the sensor array in real time. The development of the upper computer software is divided into two parts: the block diagram and the front panel. The block diagram is shown in Figure 2.
The block diagram mainly contains DAQ Assistant, oscillogram, writing the measurement file, elapsed time, and the whole cycle. The DAQ Assistant is used to set the operating mode and operating status of the data acquisition card and output the collected data to an oscillogram and write measurement files; the display of data and the storage of data are performed, respectively. The elapsed time sets the duration of data collection, enabling timed acquisition. The whole cycle ensures that the entire program remains in operation unless the stop button is pressed or the set time is reached.
The front panel of the host computer monitoring software mainly consists of a numerical input control, a numerical display control, a stop button, and an oscillogram. These components are used to set the acquisition time and display the data acquired by the data acquisition card in real time through an oscillogram. The software interface is shown in Figure 3.

2.3. Experiment Material

In agricultural production, there are slight differences in soil conditions in the same region due to anthropogenic or natural factors, and the distribution of soil nutrients is characterized by field variability and inhomogeneity [40]. A wide variety of factors influence soil nutrients, including factors such as fertilizer application, precipitation, and plant type [41]. To ensure that the sampling points are as responsive as possible to the changes in SOM content in the study area, one soil sample was collected from the 121 sampling points across Jilin Province. Sixteen samples were collected from each sampling point following an S-shaped route. The depth of soil sampling in this study ranged from 0 to 20 cm (plow layer).
First, the collected soil samples were spread on a plastic sheet and placed in a well-ventilated area indoors for storage, and they were turned over frequently while removing dead leaves, stones, and rubbish. The air-dried soil was crushed and sieved to obtain a soil sample ready for experimentation. Finally, the soil samples were encapsulated in sterile self-sealing bags. When the dried soil is heated in the pyrolysis furnace, the remaining moisture in the soil will gradually evaporate. At the beginning of heating, the evaporation of water from the soil sample increases with increasing temperature, which leads to an increase in air pressure inside the quartz tube. At this time, the vacuum flange is opened to release gas, and the flange is closed when the air pressure returns. At this stage, the temperature is below 120 °C, and the soil sample has not yet been pyrolyzed. The above operation is effective in reducing the water vapor content during pyrolysis. We will continue to explore the effect of water vapor on the prediction model in subsequent experiments.

2.4. Experiment Design

Soil pyrolysis experiments were conducted in June 2024, and relevant data were collected. Three samples with minimum, average, and maximum values of organic matter content in soil samples were selected for the study. The organic matter distribution of 121 soil samples approximately conformed to a normal distribution. The minimum, average, and maximum values of organic matter content can initially characterize the distribution range and central tendency of the sample set. Although this choice cannot fully cover all the variations of the 121 samples, it has already met the requirements for exploring the influence of working parameters on the discrete ratio in a single-factor experiment. Therefore, no other values were further selected for analysis. A single-factor optimization experiment was carried out using the parameters of the assay in operation: pyrolysis temperature, pyrolysis time, and soil sample mass as experiment factors. In the experiment, a single-factor experiment was selected as a variable, and the other experiment factors were fixed for each of the three soil samples with organic matter content. The discrete ratio was used as the experiment index, and each experiment was repeated five times. The factor levels of the experiments are shown in Table 1.
Table 1. Factors and levels of single-factor experiment.
Experimental FactorsExperimental Level
Pyrolysis temperature/°C200, 300, 400, 500
Pyrolysis time/min1, 3, 5, 10
Soil sample mass/g1, 2, 3
Response surface regression analysis experiment factor level coding is shown in Table 2.
Table 2. Experiment factors and levels of response surface analysis.
LevelExperimental Factors
Pyrolysis Temperature/°CPyrolysis Time/minSoil Sample Mass/g
−135021.5
040032
145042.5
Based on the results of the single-factor experiment, the optimal range of experimental factors was selected for response surface regression analysis. A three-factor, three-level response surface experiment was designed using the Box–Behnken design of experimental protocols in Design-Expert 12 software, with the pyrolysis temperature, pyrolysis time, and soil sample mass as independent variables and the discrete ratio (DT) as the response value. The design scheme used 17 experimental points with 12 analytical factors and 5 zeros. Repeated calculations and hence estimation of the experimental error were performed to obtain the regression equation of the model. The optimal parameters affecting the performance of this detection system were also derived, and finally, the detection method was validated using the optimal parameters.

2.5. Characteristic Value and Evaluation Index

According to the design of the sensor array and signal processing circuit in this study, 10 sets of sensor data were collected in each experiment, the mean value of the data was used as the eigenvalue, and a total of 10 eigenvalues were obtained. Based on the characteristics of the Principal Component Analysis (PCA) method, the ratio of the average coefficient of variation, which can express the degree of aggregation within the sample groups, to the average relative rate of change, which characterizes the degree of differentiation between the sample groups, was chosen as the indicator. The formula is shown below:
C V = 1 s k = 1 s ( 1 F j = 1 F ( 1 N i = 1 N ( x i x ¯ ) 2 χ ¯ ) )
R V = 1 F j = 1 F ( 1 s ( x ¯ 1 x ¯ 2 x ¯ 2 + x ¯ 2 x ¯ 3 x ¯ 3 + x ¯ 1 x ¯ 3 x ¯ 1 ) )
D T = C V R V
where s is the number of SOM content classes and takes the value of 3. F is the number of sensors and takes the value of 10. N is the number of repetitions of the experiment and takes the value of 5. x i is the experiment data of the ith sample. x ¯ is the mean value of the data from 5 replicated experiments. x ¯ 1 ,   x ¯ 2 ,   x ¯ 3 are the means of the data from five replicates at low, medium, and high SOM content classes, respectively. CV is the mean value of the coefficient of variation between soil samples with the same SOM content. RV is the average of the relative rates of change between soil samples with different organic matter contents. DT is the discrete ratio. The smaller the DT, the more distinct the differentiation between soil samples with different organic matter contents and the higher the degree of aggregation within groups of soil samples with the same organic matter content.

2.6. Data Processing

The data were preprocessed using Origin Pro 2021 software. MATLAB R2023b software was used to build the BPNN and PLSR models. Response surface regression analysis was performed using Design-Expert 12 software.

3. Results and Discussion

3.1. Results of Chemical Analyses of Soil Organic Matter Content

In order to accurately determine the SOM contents, this study initially employed the classic potassium dichromate method for measurement. Subsequently, pattern recognition algorithms (PLSR and BPNN) were used to establish the relationship between the actual SOM contents and the response characteristics of the sensor array so as to realize the prediction of SOM content.
The potassium dichromate method was used to derive the SOM contents of 121 soil samples, as shown in Table 3. SOM contents ranged from 6.30 to 78.8 g/kg, with a mean value of 31.38 g/kg, a standard deviation of 14.90 g/kg, and a coefficient of variation of 47.47%. These results indicate that the coefficient of variation of the organic matter content of the soil samples collected in the study area has a large trend, which is conducive to improving the predictive power of the model.

3.2. Single-Factor Experiment

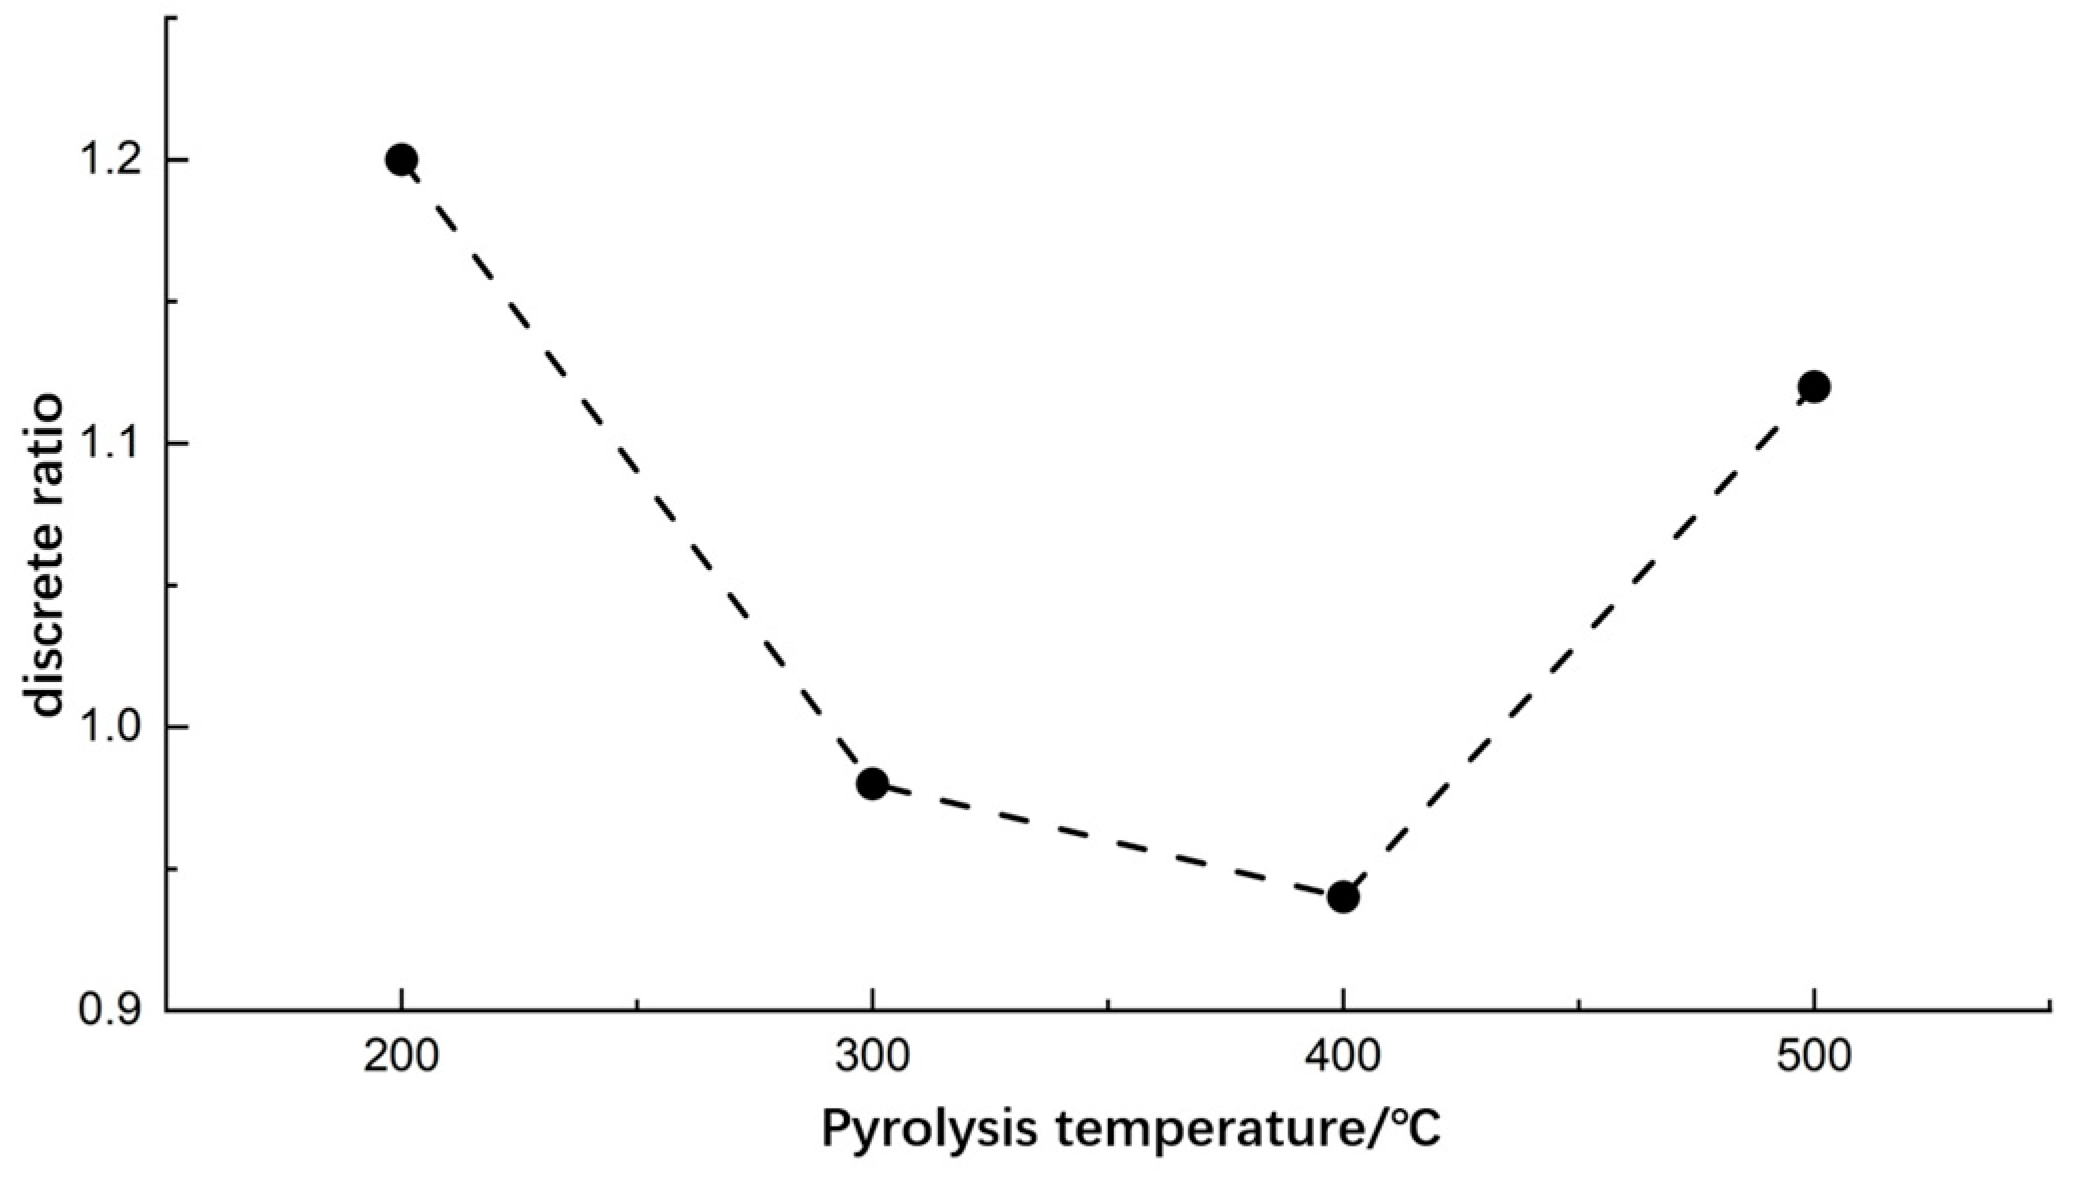
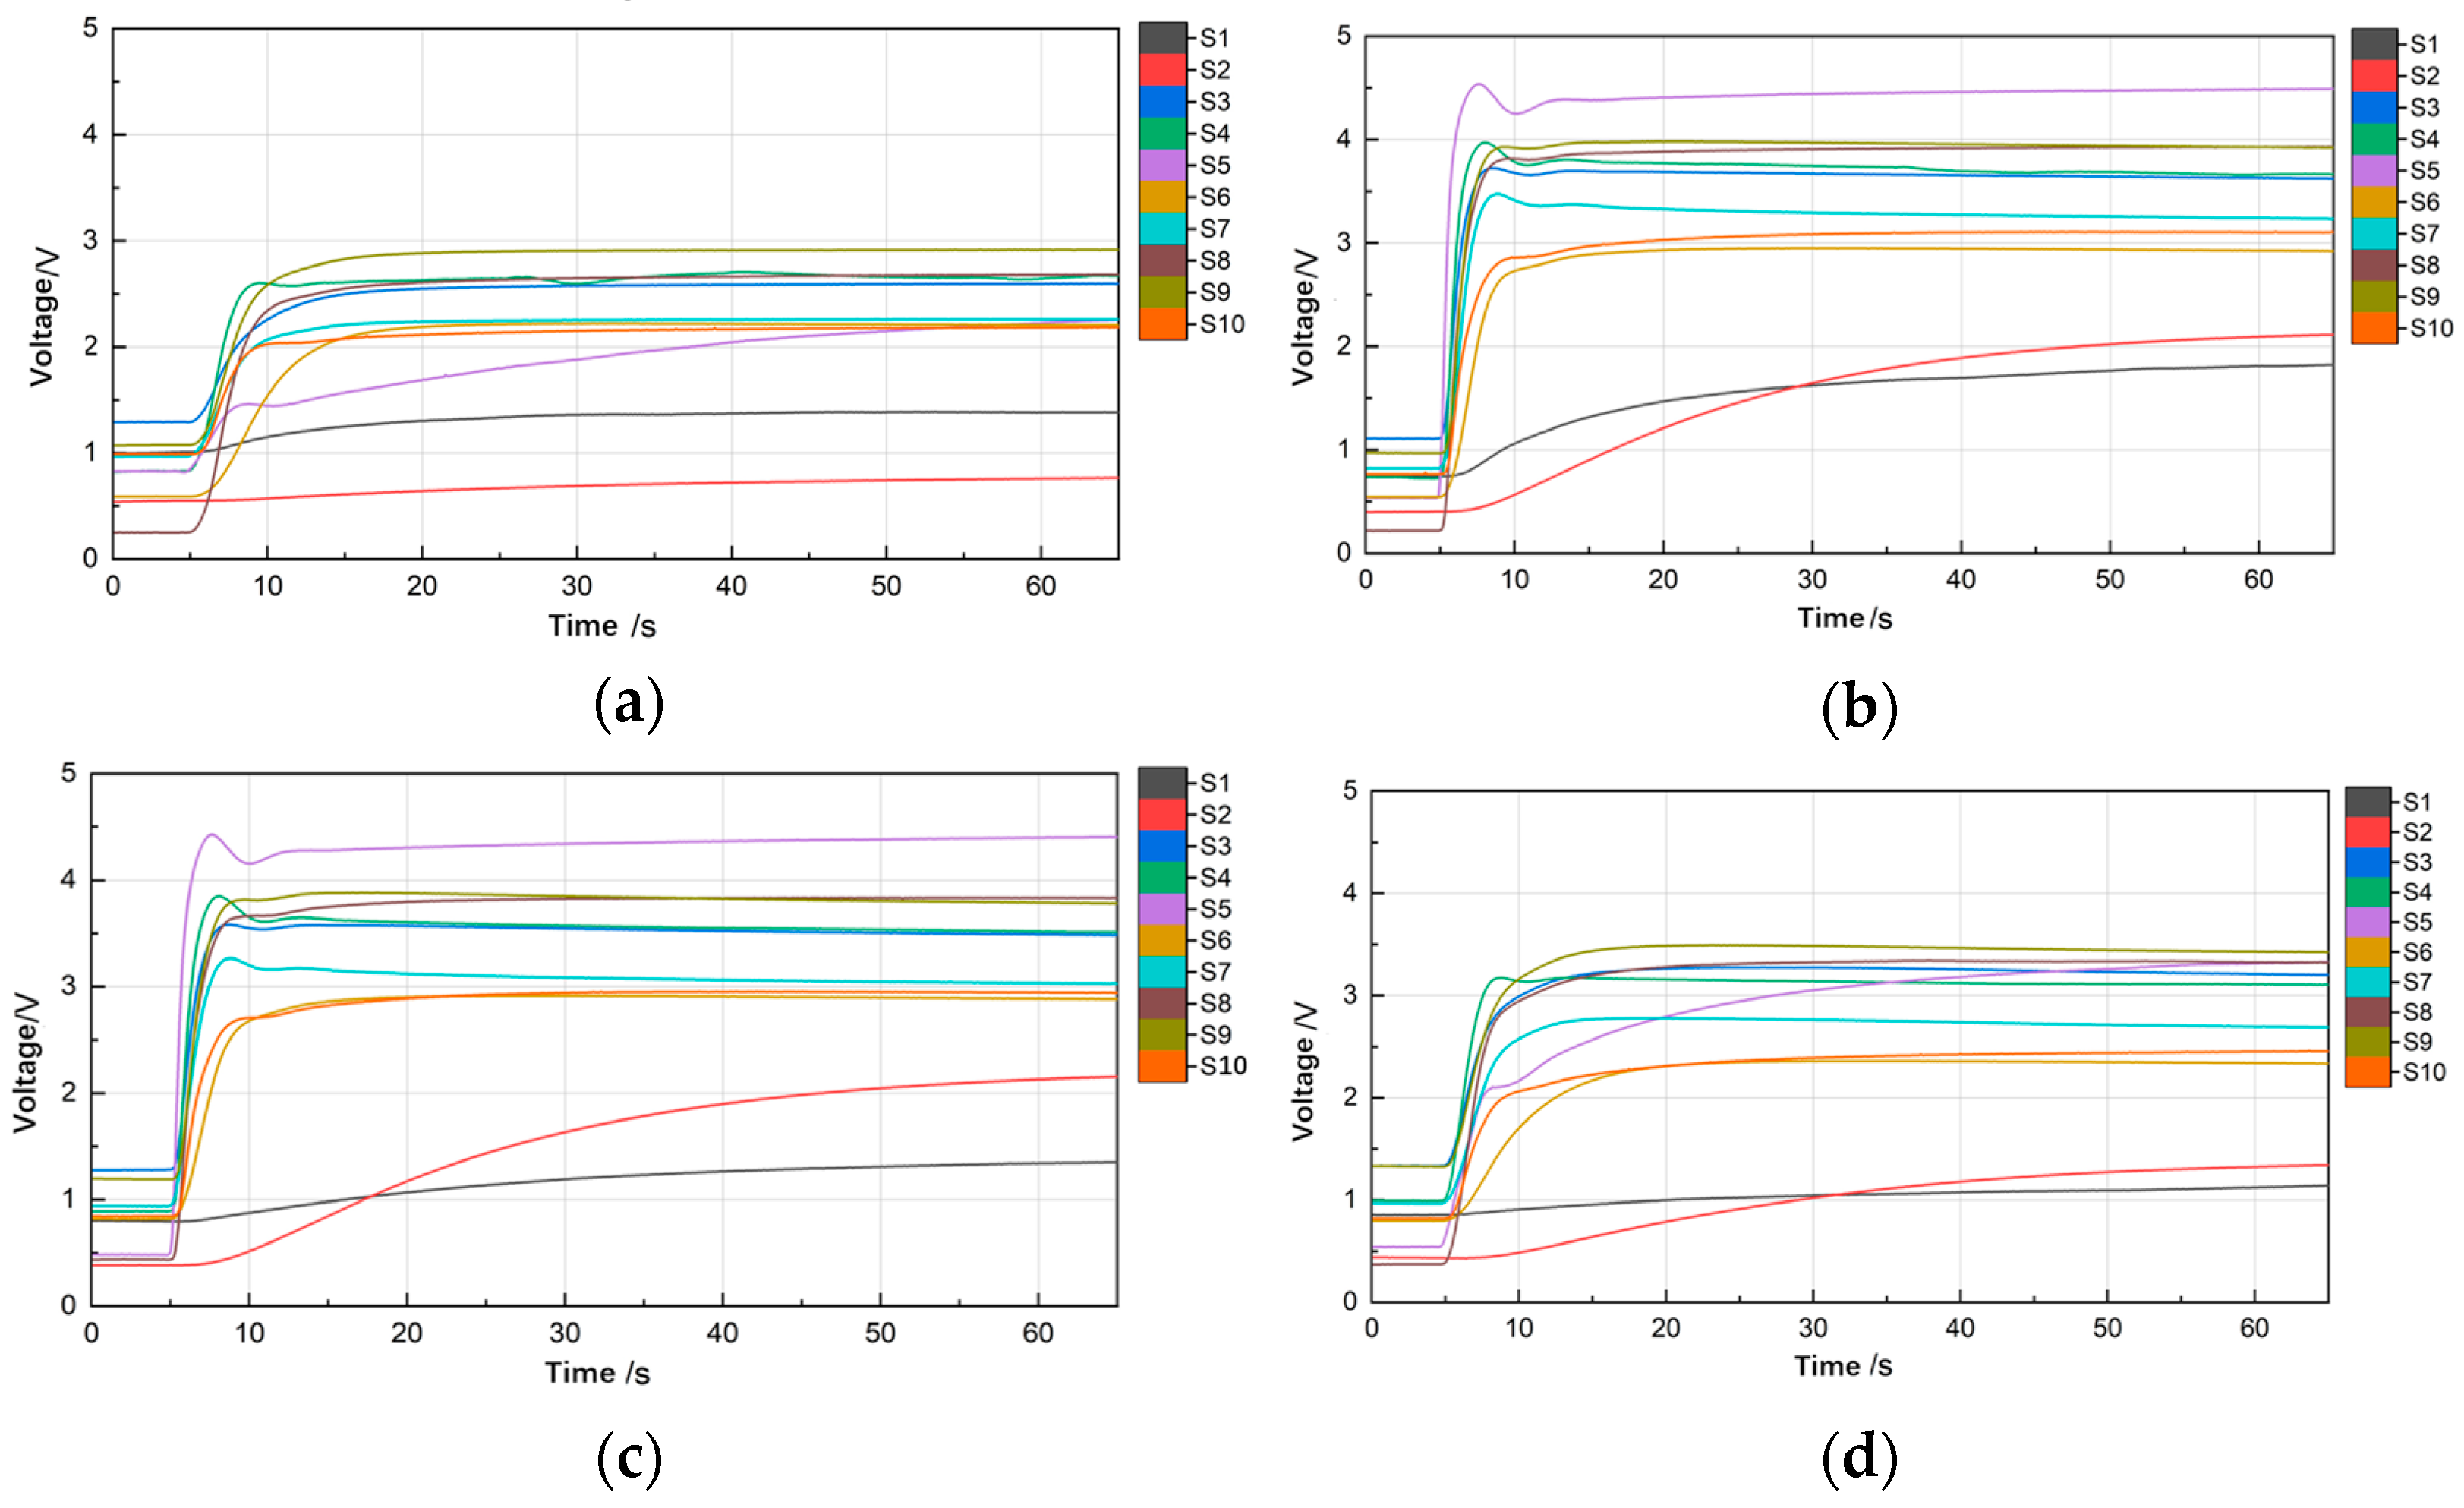
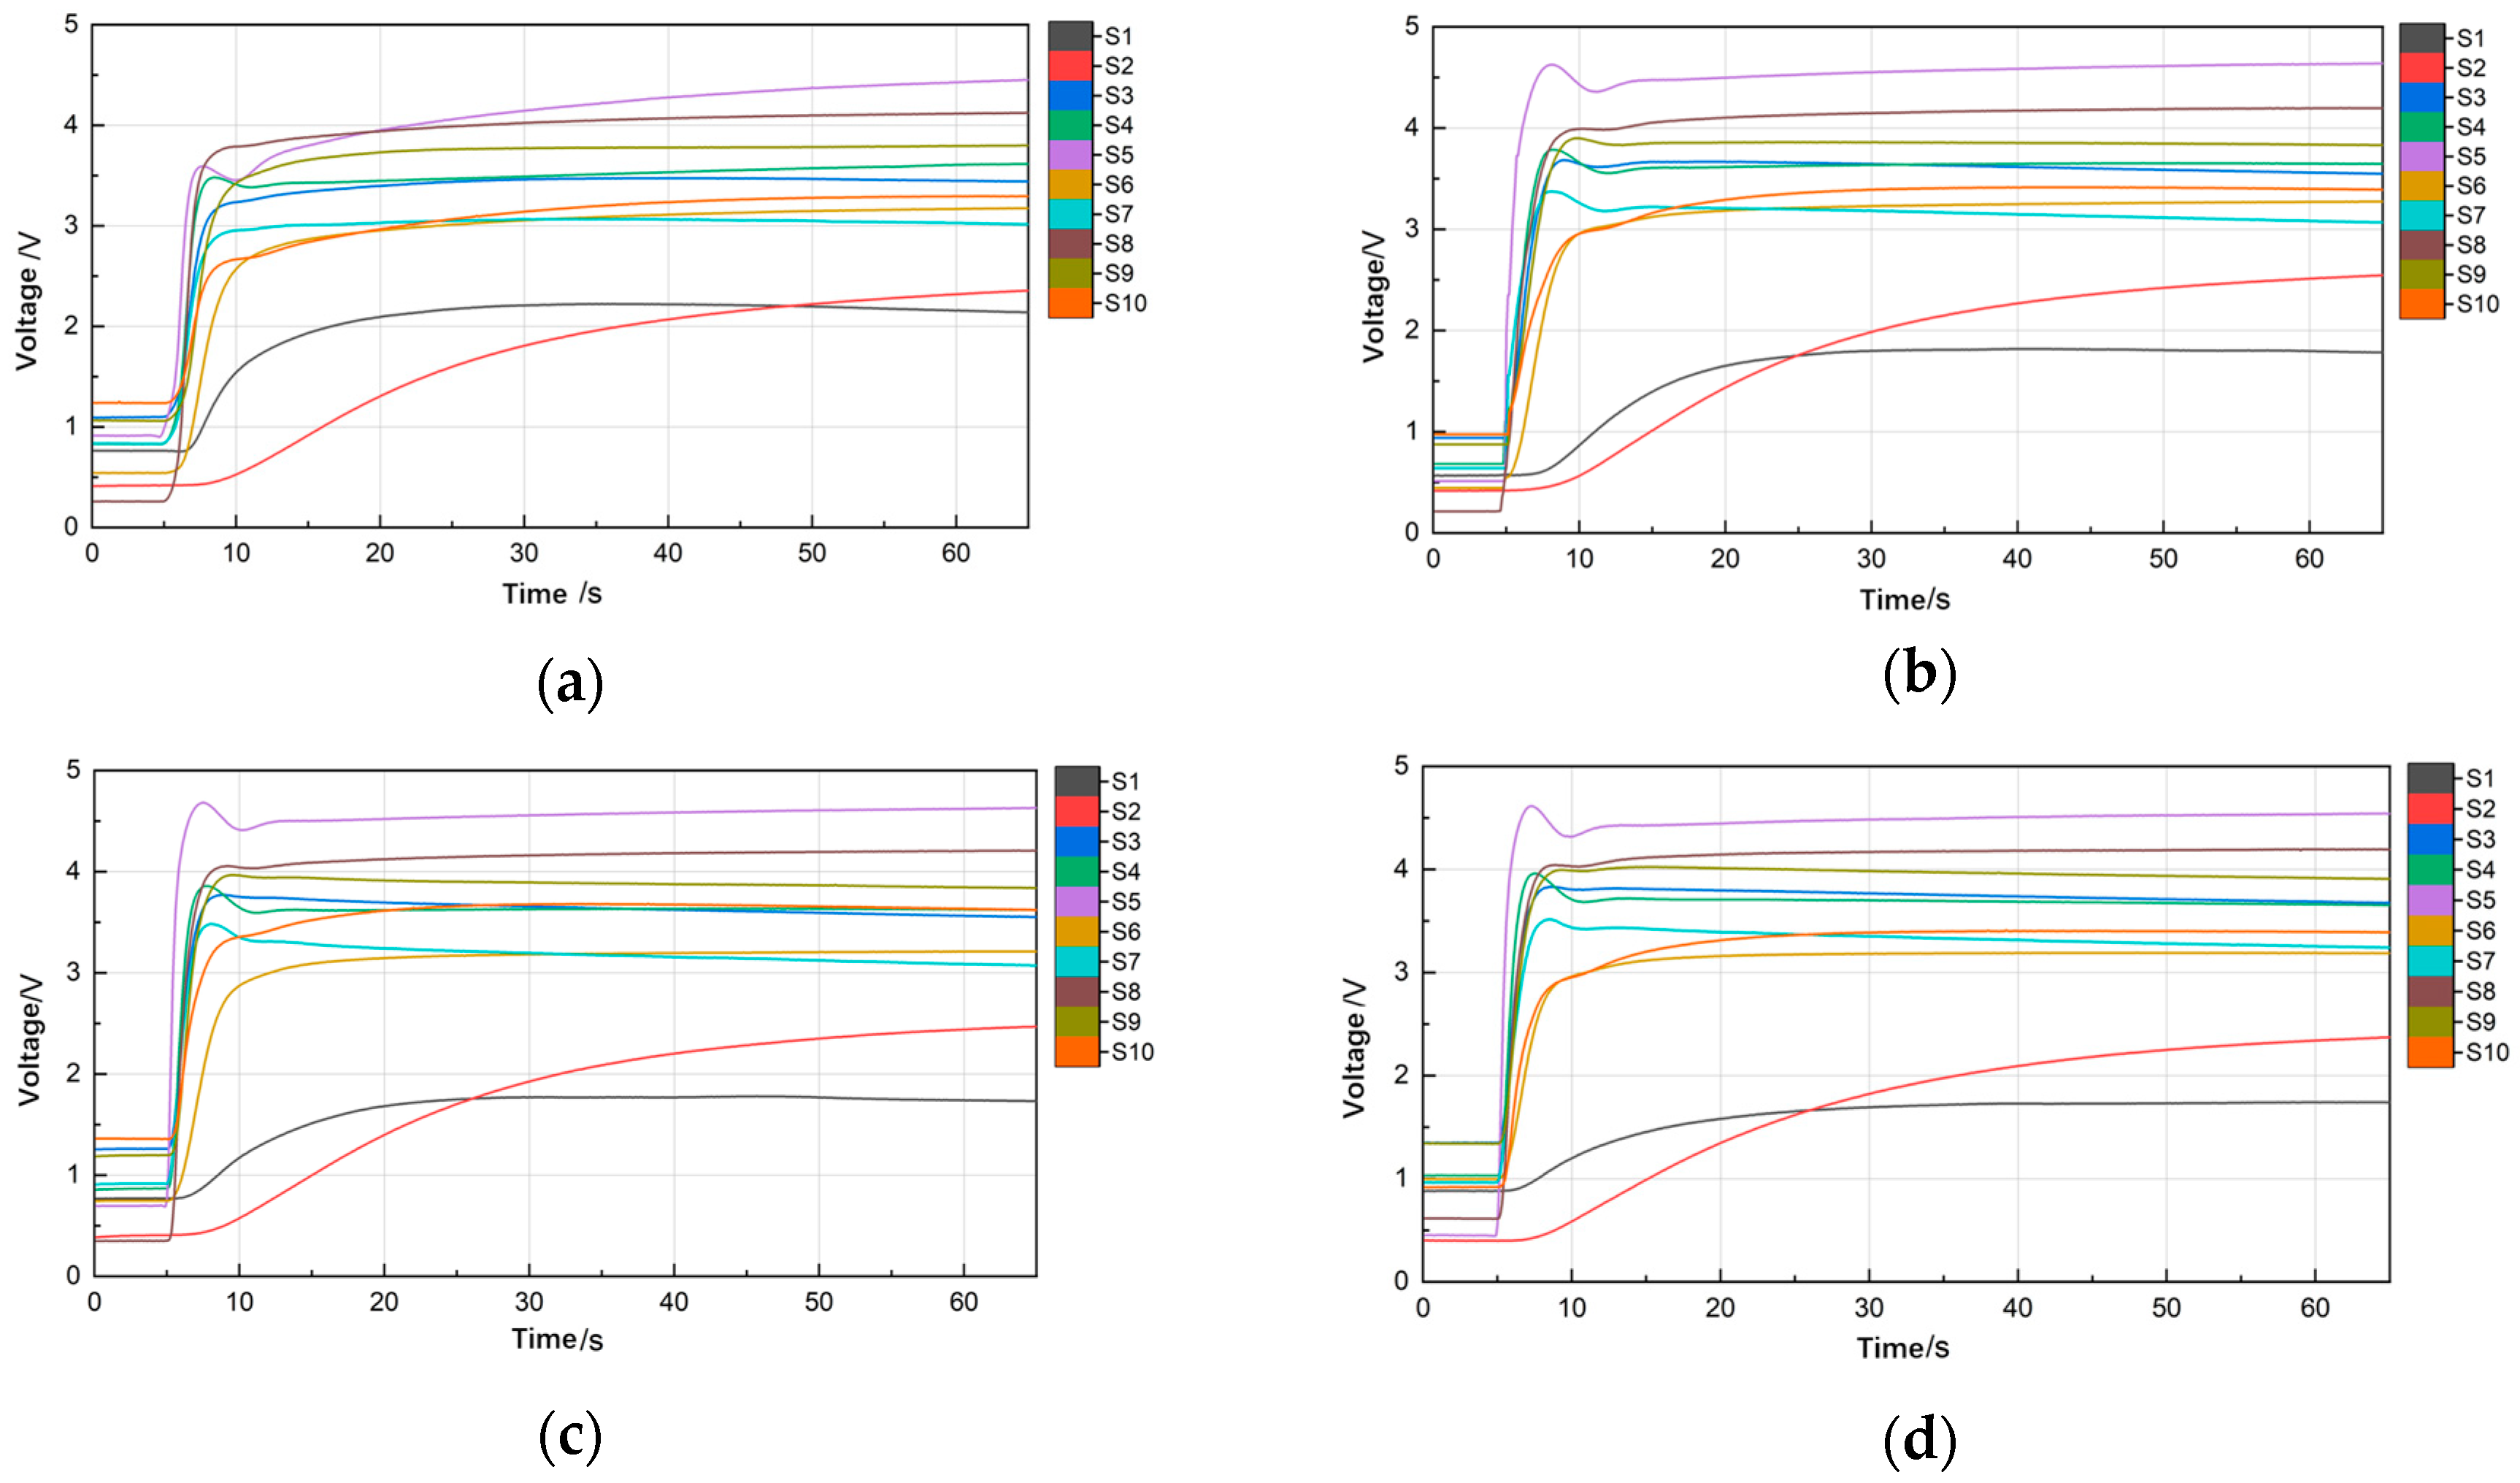
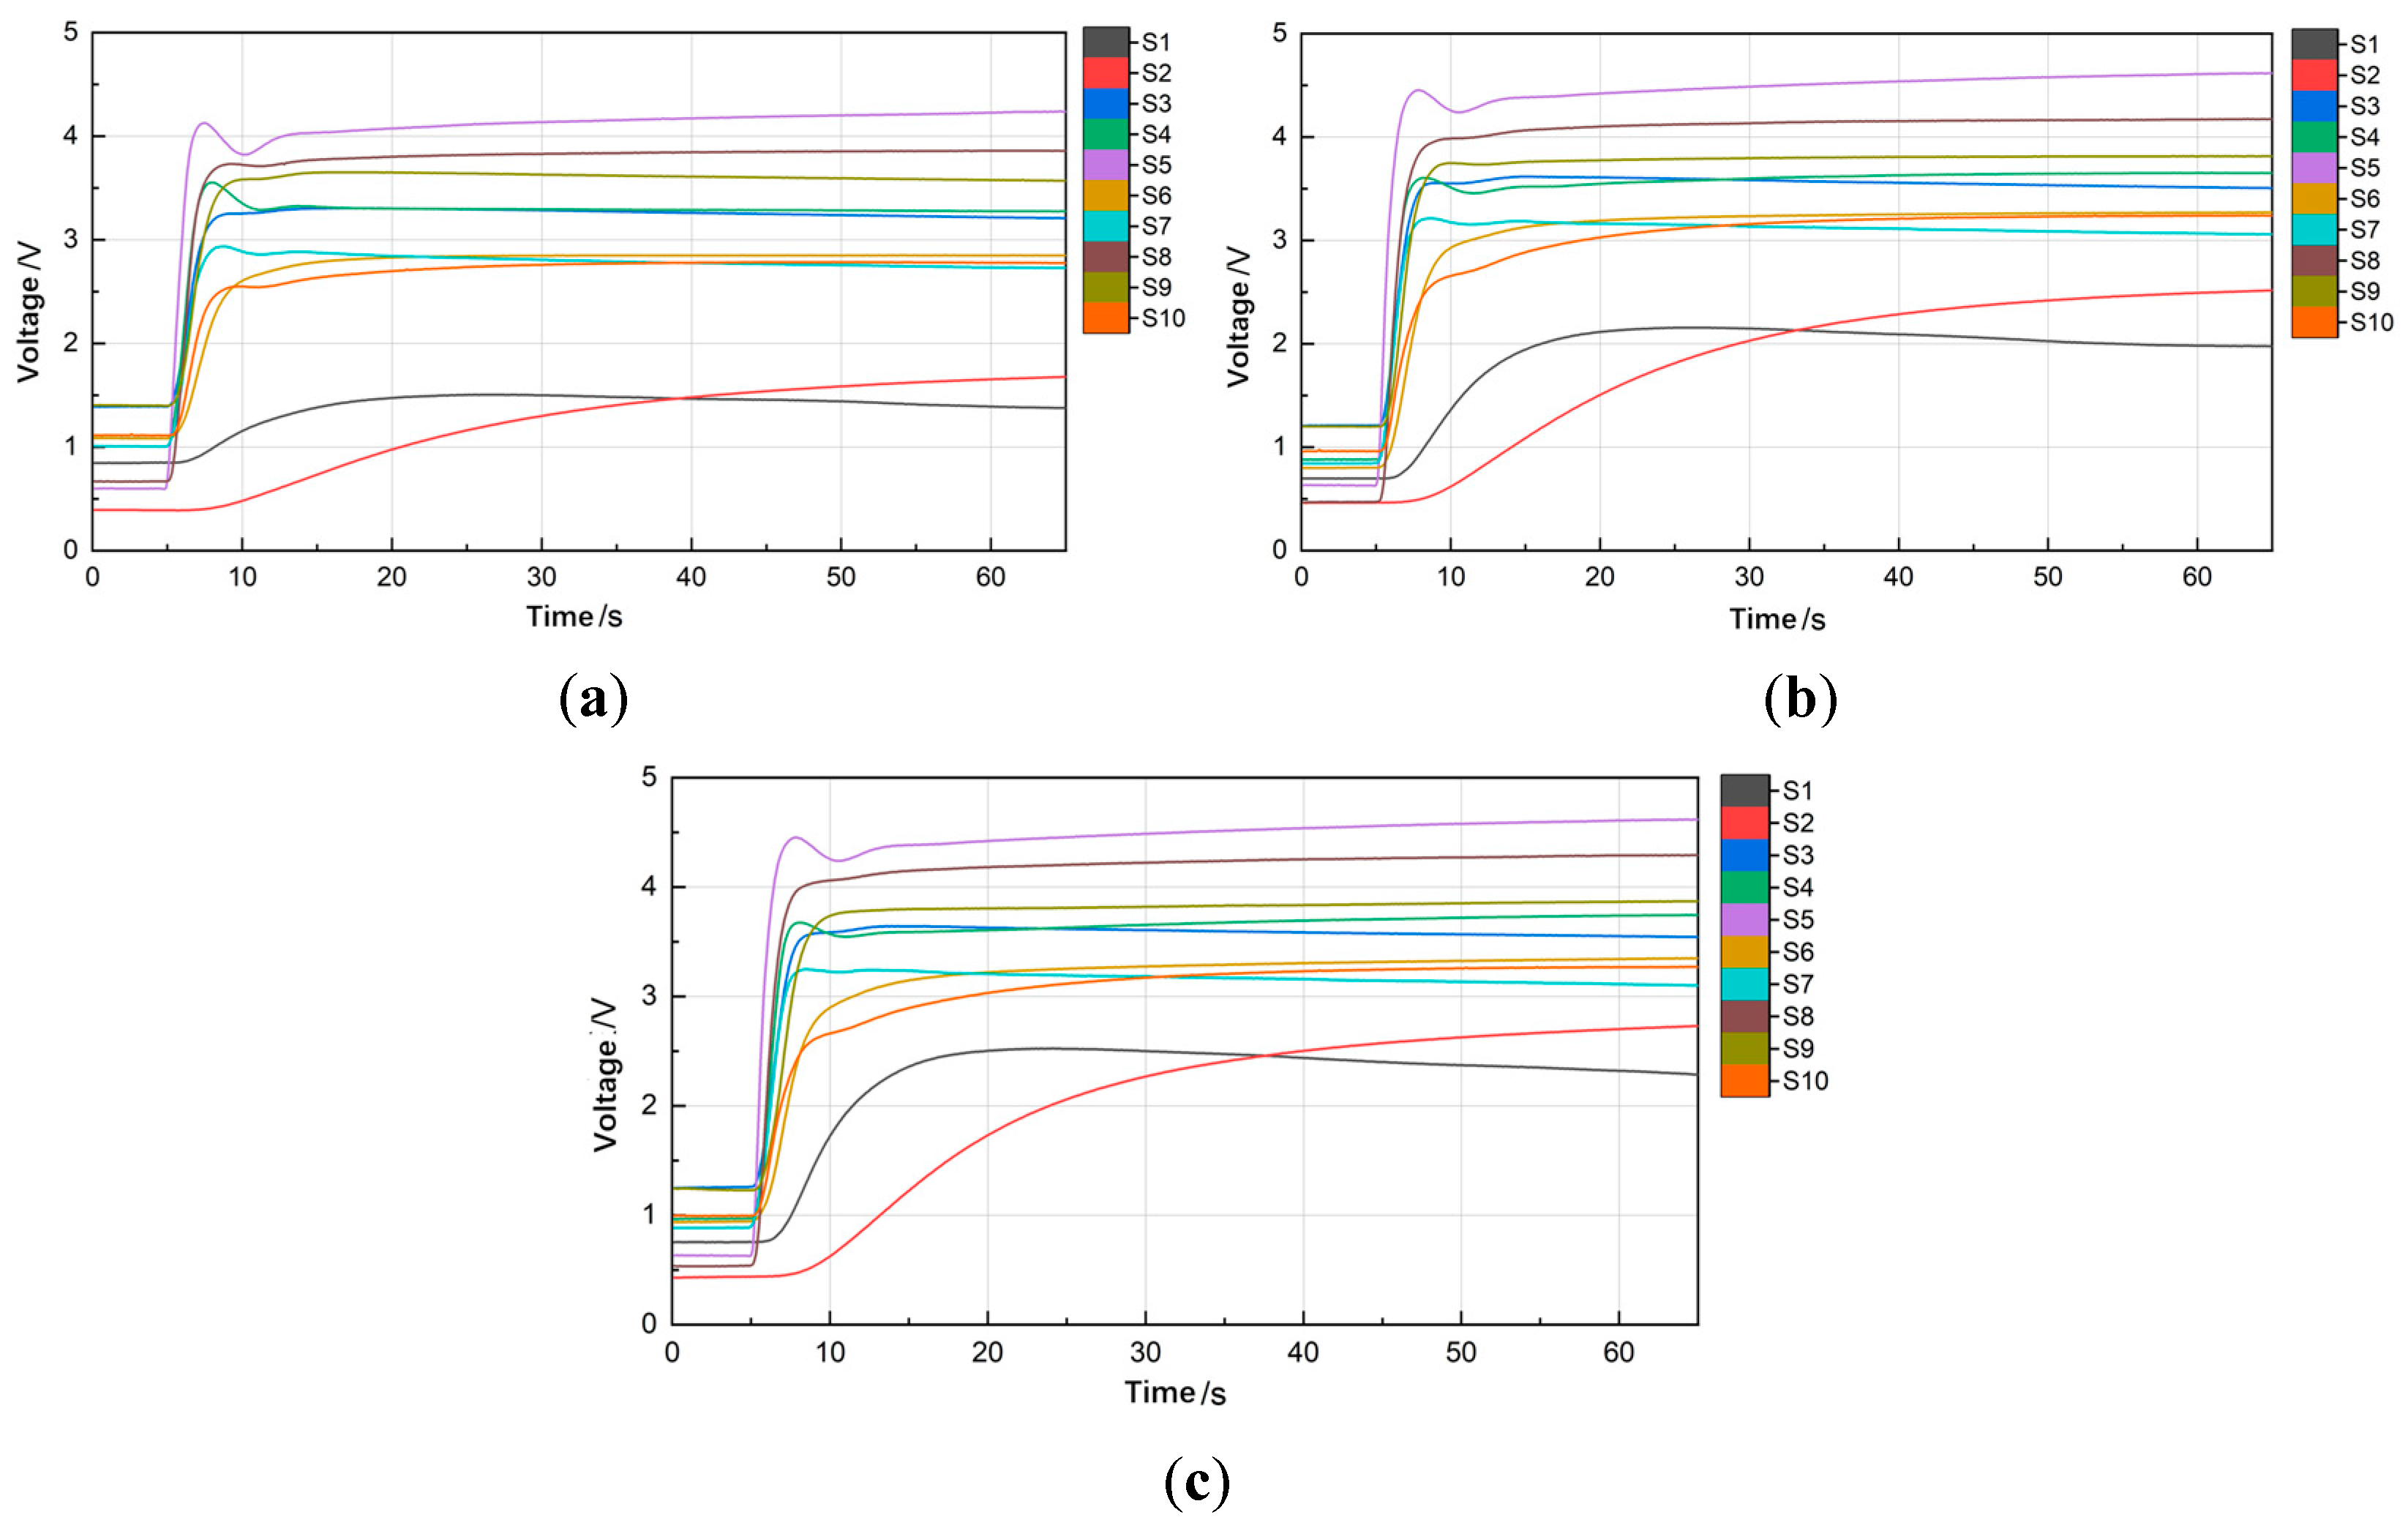
3.2.1. Pyrolysis Temperature

The temperature of thermal lysis directly affects the products of lysis of soil samples. De la Rosa et al. [42] analyzed in detail the pyrolysis products of fire-burnt and unburnt topsoil and qualitatively and quantitatively analyzed the pyrolysis products at 300 °C and 500 °C, which showed that the pyrolysis products at 500 °C were much larger than those at 300 °C. A soil sample of 2 g was weighed; the pyrolysis time was 10 min; the data collection time was 1 min; and the pyrolysis temperatures were set at 200 °C, 300 °C, 400 °C, and 500 °C, respectively. A gas flow rate of 3 L/min was used for gas washing, and the gas washing time was 2 min. Experiments were carried out on soils with high, medium, and low organic matter content separately and plotted with the pyrolysis temperature as the horizontal coordinate and the discrete ratio as the vertical coordinate to obtain the results shown in Figure 4.
Figure 4 demonstrates that the discrete ratio tends to decrease and then increase with an increasing pyrolysis temperature. When the pyrolysis temperature is 400 °C, the discrete ratio reaches the minimum value, and when the pyrolysis temperature continues to increase, the discrete ratio also increases. The reason for this phenomenon is that when the pyrolysis temperature is small, the soil is not completely cracked, fewer types of cracked gases are released, and the gas content is low; the response of the sensor array is not apparent, and its discrete ratio is high. As the pyrolysis temperature increases, the type of soil pyrolysis gas increases and the gas concentration rises, resulting in a significant response in the sensor array response and a subsequent decrease in the discrete ratio. When the pyrolysis temperature reaches 500 °C, the pyrolysis of the soil sample produces the most significant number of cracked gas species. Many of the gases that could have made the sensor array responsive are cracked into smaller gas molecules that do not make it responsive, resulting in a lower response from the sensor and making its discrete ratio increase. This is in agreement with De la Rosa’s findings that the cleavage products of soil at 500 °C are much larger than those at 300 °C. As the pyrolysis temperature increases, many of the components in the soil are cleaved into smaller molecular mass substances. In order to more intuitively observe the effect of pyrolysis temperature on the sensor array response, we selected samples whose SOM content is close to the average value of the total samples, and their response data at different pyrolysis temperatures were plotted, as shown in Figure 5.
In Figure 5, the first 5 s show the results of the response of the sensor array in air, and after the 5th second, the response of the sensor array after the pyrolysis gas is passed into the reaction chamber. At a 200 °C pyrolysis temperature, the response of the sensors is more obvious, except for sensor S2. The response of the sensor array was significantly improved at a pyrolysis temperature of 300 °C, and the response of sensor S2 was very strong. This indicates that the pyrolysis temperature of 300°C increased the pyrolysis products and the concentration of pyrolysis gases in the soil samples, producing gases such as ammonia, volatile organic compounds (VOCs), or hydrogen sulfide. At a 400 °C pyrolysis temperature, sensor S1 exhibited enhanced response intensity compared to lower temperatures, while the remaining sensors maintained response levels comparable to those observed at 300 °C. This indicates that more ammonia was pyrolyzed at this pyrolysis temperature, causing sensor S1 to respond strongly. In contrast, when the pyrolysis temperature was 500 °C, the responses of the sensor arrays all showed a large decrease. This is because many of the gases that would otherwise make the sensor array responsive are pyrolyzed into smaller gas molecules that do not make it responsive, resulting in a reduced sensor response. This result is essentially the same as the effect of pyrolysis temperature on discrete ratio. Therefore, a pyrolysis temperature of 400 °C was chosen as the zero level for the next response surface regression experiment.

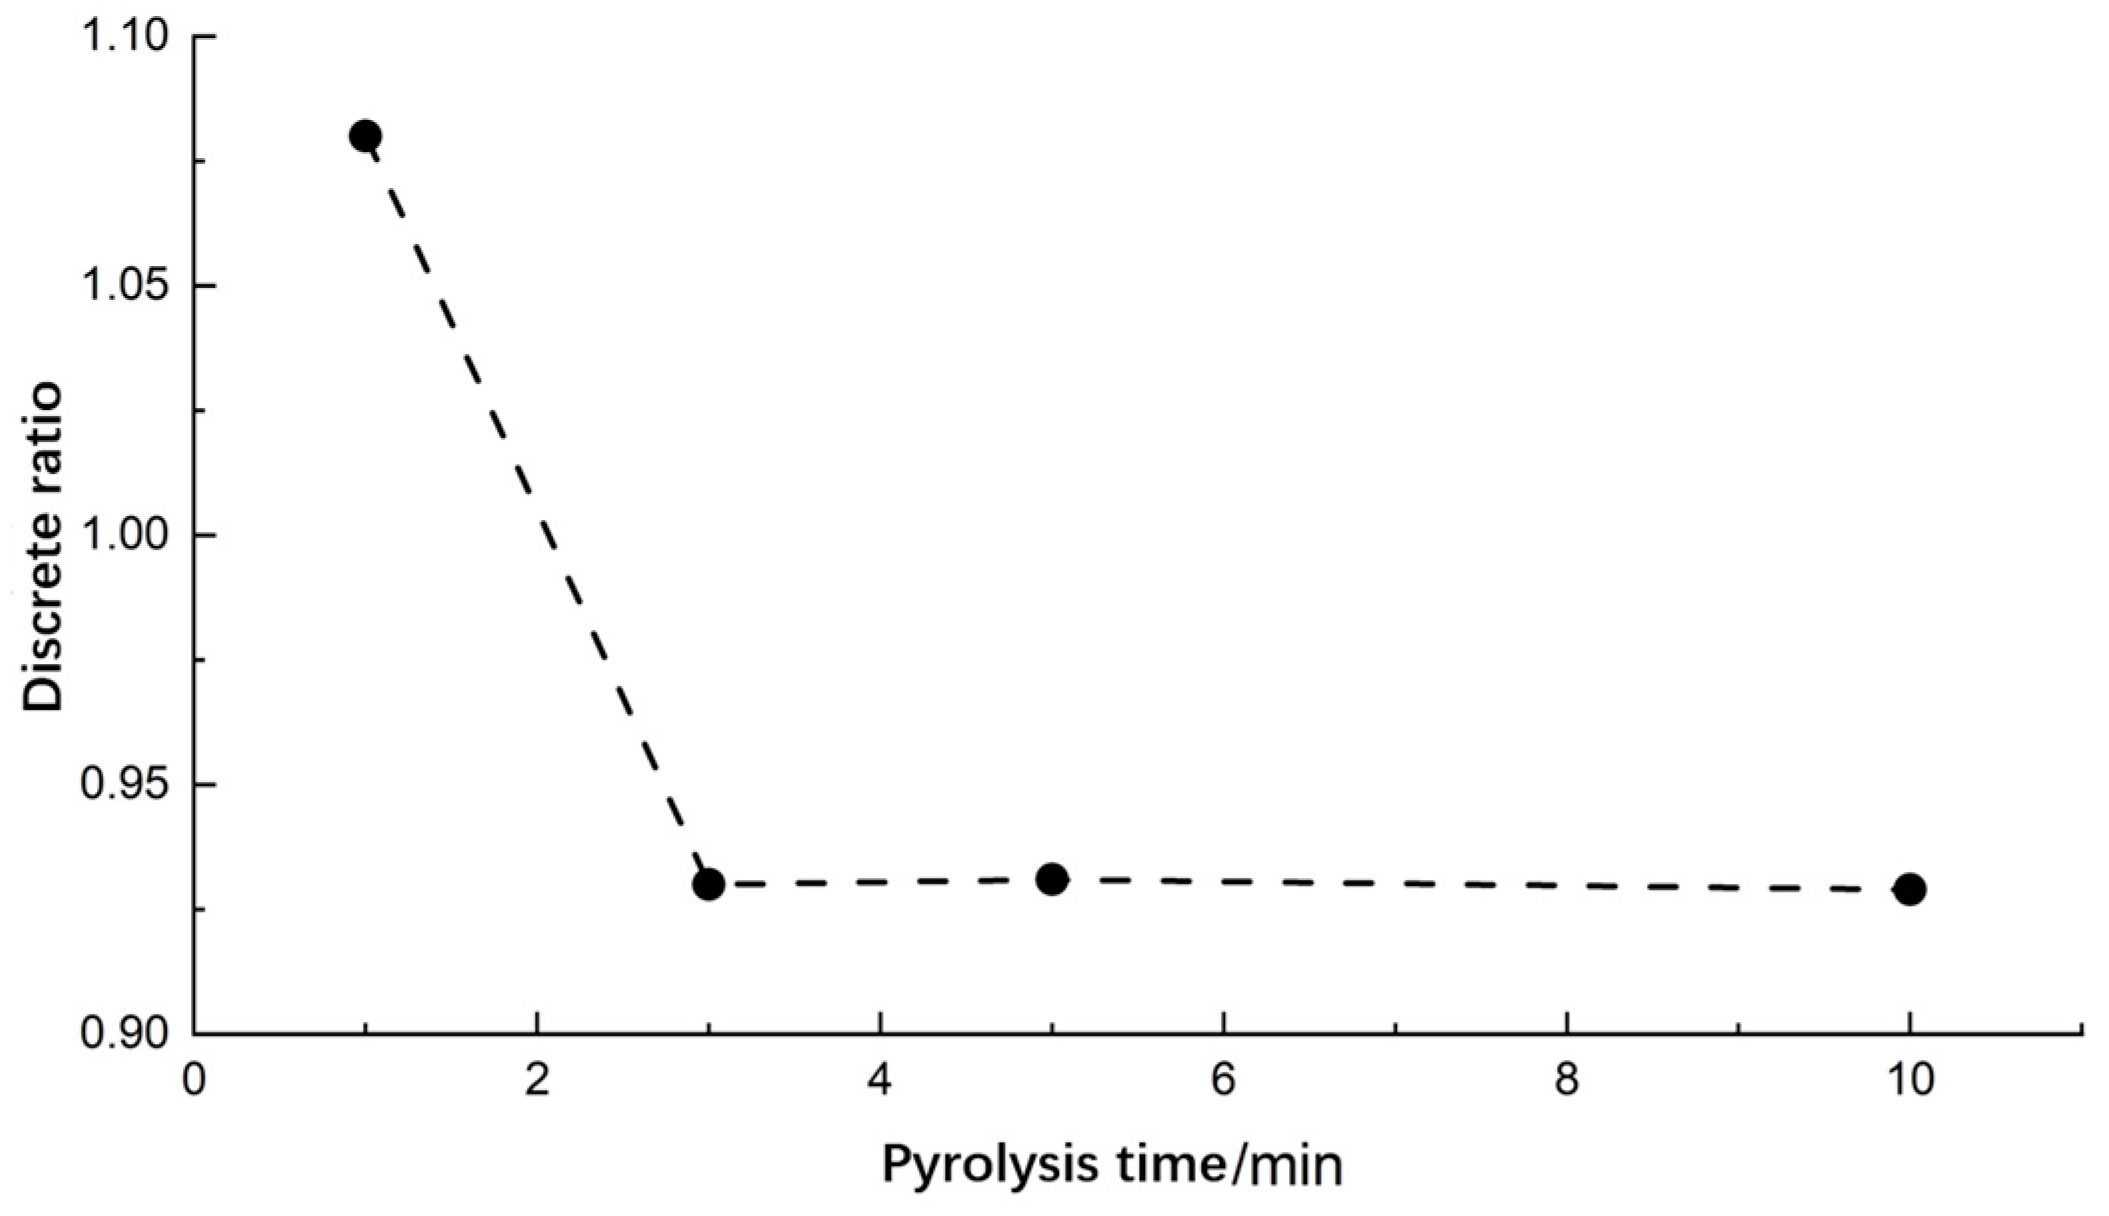
3.2.2. Pyrolysis Time

The pyrolysis time may have an effect on the response of the sensor array, and pyrolysis times of 1, 3, 5, and 10 min were selected for this experiment. This study determined the parameter range of pyrolysis time through a preliminary experiment. The result shows that the soil was not pyrolyzed sufficiently before 1 min, and by 10 min, the soil was completely pyrolyzed; further heating had little effect on pyrolysis effectiveness. Therefore, in this study, the pyrolysis time was determined to be in the range of 1–10 min, and the two parameters of 3 min and 5 min were selected within the range. A soil sample of 2 g was weighed, the pyrolysis temperature was 400 °C, the data collection time was 1 min, the gas washing time was 2 min, and the gas washing flow rate was 3 L/min. Soil samples with high, medium, and low organic matter content were experimented on separately and plotted with the pyrolysis time as the horizontal coordinate and the discrete ratio as the vertical coordinate; the results are shown in Figure 6.
As can be seen in Figure 6, the discrete ratio first decreases and then tends to level off as the pyrolysis time increases. At a pyrolysis time of 3 min, the discrete ratio is essentially minimized. As the pyrolysis time continued to increase, the discrete ratio remained essentially unchanged. The reason for this is that when the pyrolysis time is short, the soil is not completely cracked, there are fewer types and a lower content of released cracked gas, the sensor array response is not obvious, and there is a higher dispersion ratio. As the pyrolysis time increases, the variety of cracked gas in the soil increases, and the concentration of the gas rises, which makes the sensor array response produce an obvious response, and the dispersion ratio decreases. The soil completed pyrolysis after about 3 min of pyrolysis; pyrolysis over 3 min only consumes heat, and the soil is no longer cracked. In order to more intuitively observe the effect of the pyrolysis time on the sensor array response, we selected samples whose SOM content is close to the average value of the total samples, and their response data at different pyrolysis times were plotted, as shown in Figure 7.
In Figure 7, when the pyrolysis temperature is 400 °C and the pyrolysis time is 1 min, the sensor array has a significant response. In particular, sensor S1 responded more strongly than the other pyrolysis times, but the initial response of the other sensors within 5–10 s was relatively low. The sensor array response curves at pyrolysis times of 3, 5, and 10 min did not change significantly. This result is essentially consistent with the effect of the pyrolysis time on the discrete ratio, and the pyrolysis time was chosen to be 3 min in order to improve efficiency.

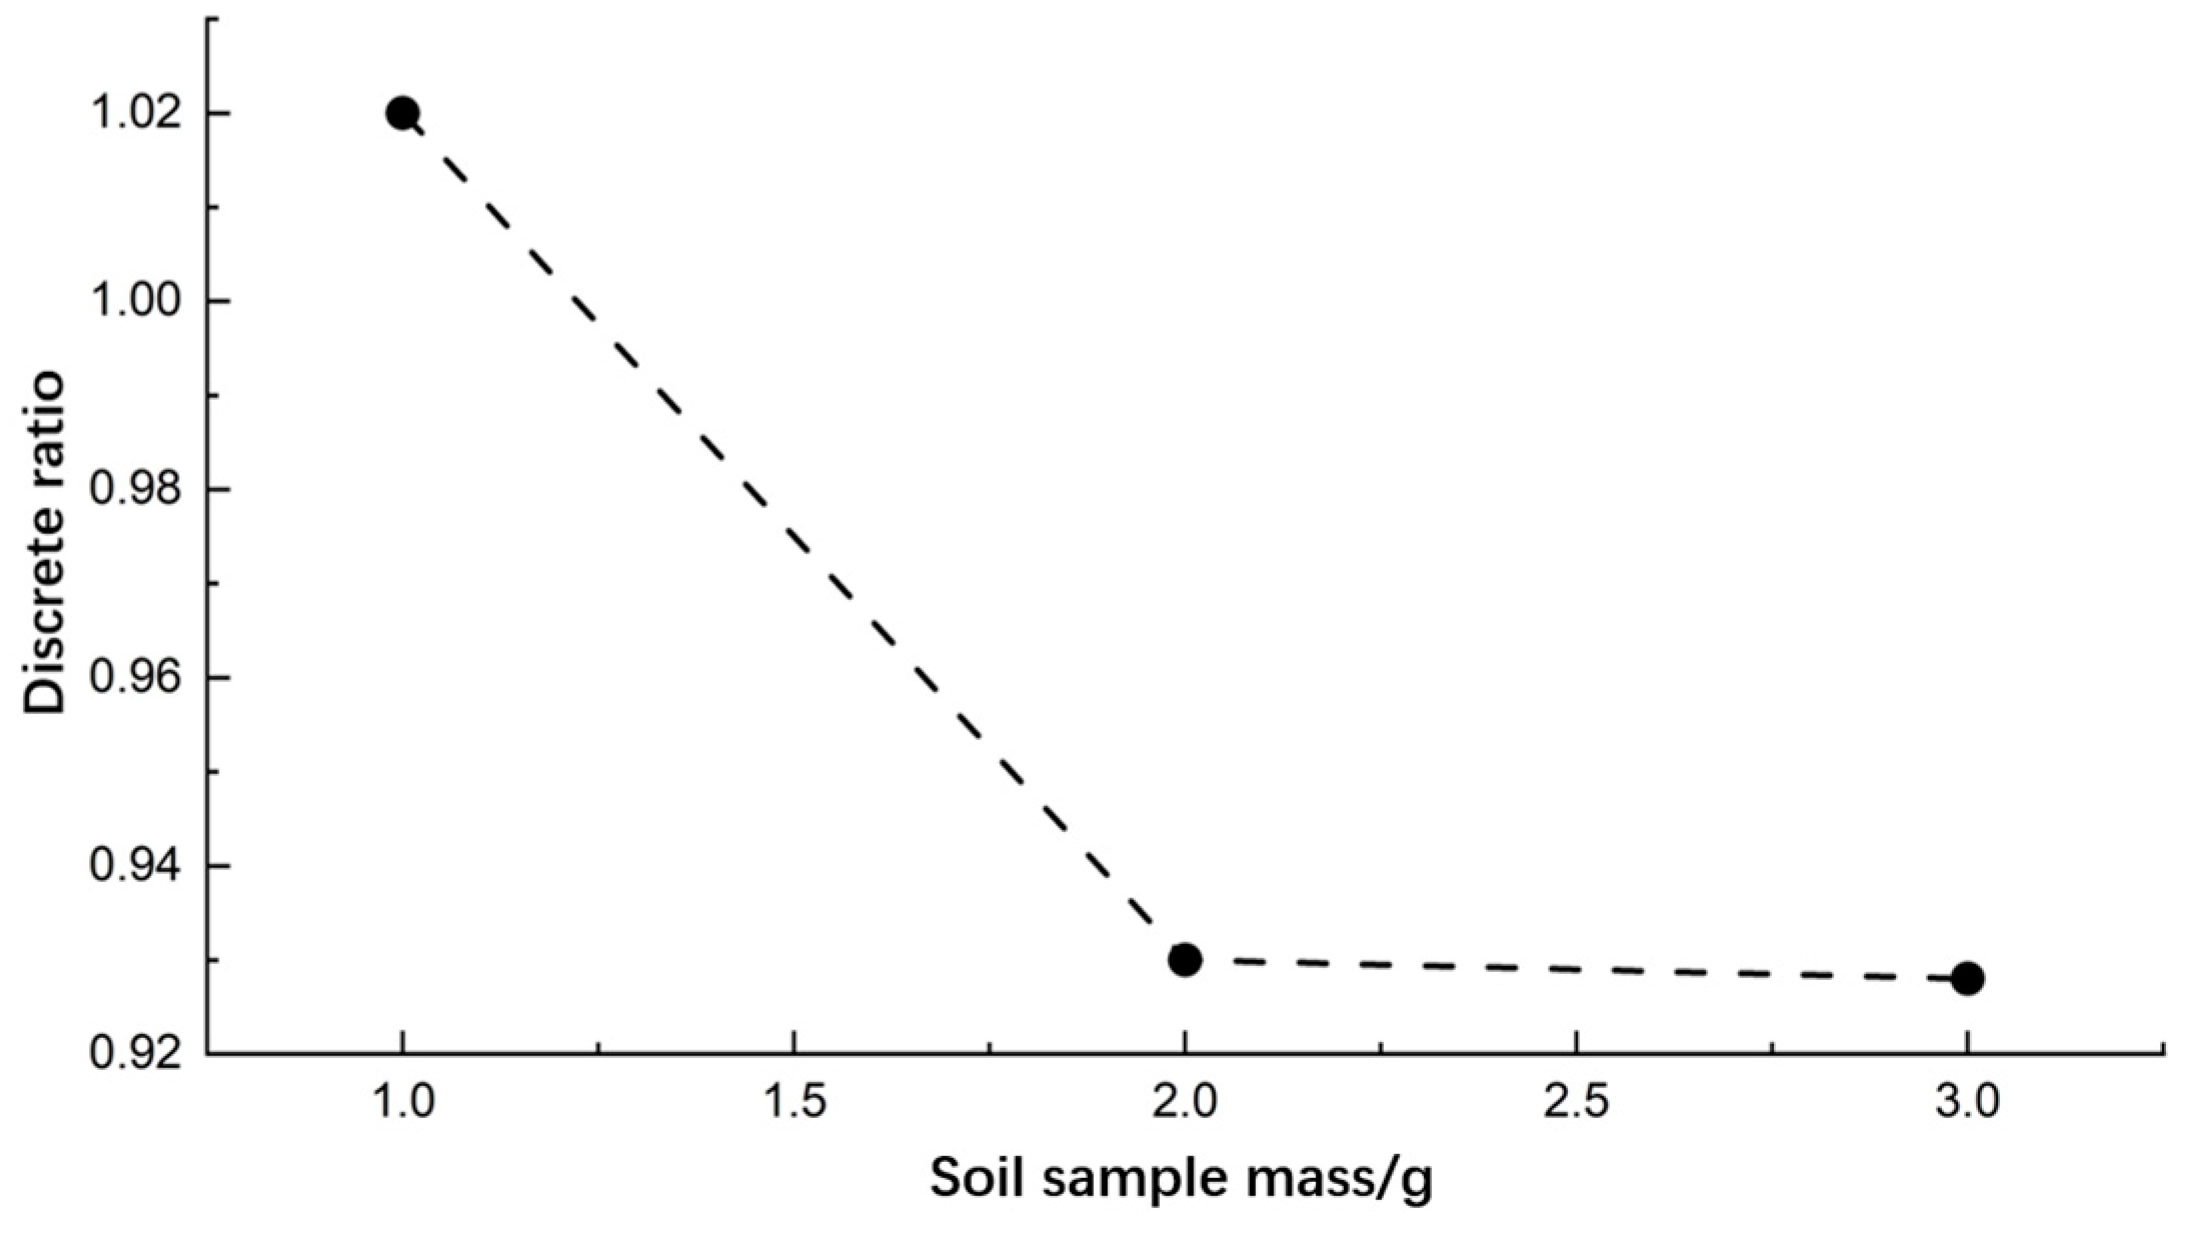
3.2.3. Soil Sample Mass

The mass of the soil sample influences the concentration of soil lysate gas and may have some effect on the sensor response. In this experiment, 1, 2, and 3 g masses of soil samples were weighed for experimenting. The pyrolysis temperature was 400 °C, the pyrolysis time was 3 min, the data acquisition time was 1 min, the gas washing time was 2 min, and the gas washing flow rate was 3 L/min. Experiments were conducted on soil samples with three organic matter contents: high, medium, and low, respectively. The effect of soil sample mass on the response of the sensor array was determined by plotting the soil sample mass on the horizontal coordinate and the discrete ratio on the vertical coordinate, as shown in Figure 8.
As shown in Figure 8, the discrete ratio initially decreases and then plateaus with increasing soil sample mass, reaching its minimum value at 3 g. There is a difference in the discrete ratio between 2 g and 3 g soil samples. The reason for this is that when there is less soil, the concentration of gases produced by soil pyrolysis is relatively low, and the sensor array response values are relatively low, resulting in a higher discrete ratio. As the soil sample mass increases, the concentration of soil pyrolysis gas rises, resulting in an enhanced sensor array response and a subsequent decrease in the discrete ratio. At a soil sample mass of 2 g, the concentration of pyrolysis gas essentially maximizes the response of the sensor array. There is a slight but insignificant decrease in the discrete ratio for the 3 g soil sample mass. In order to more intuitively observe the effect of the soil sample mass on the sensor array response, we selected samples whose SOM content is close to the average value of the total samples, and their response data to different soil sample masses were plotted, as shown in Figure 9.
As can be seen in Figure 9, the sensor arrays all responded significantly when the soil sample mass was 1 g, but the responses were relatively lower than those at 2 and 3 g soil sample mass. At a 2 g soil sample mass, the maximum response values of sensors S1 and S2 were slightly lower than those at 3 g, while the remaining sensors showed nearly identical responses. This result is essentially consistent with the effect of the soil sample mass on the discrete ratio. To reduce the number of soil samples, 2 g soil samples were chosen as the zero level for subsequent response surface regression experiments.

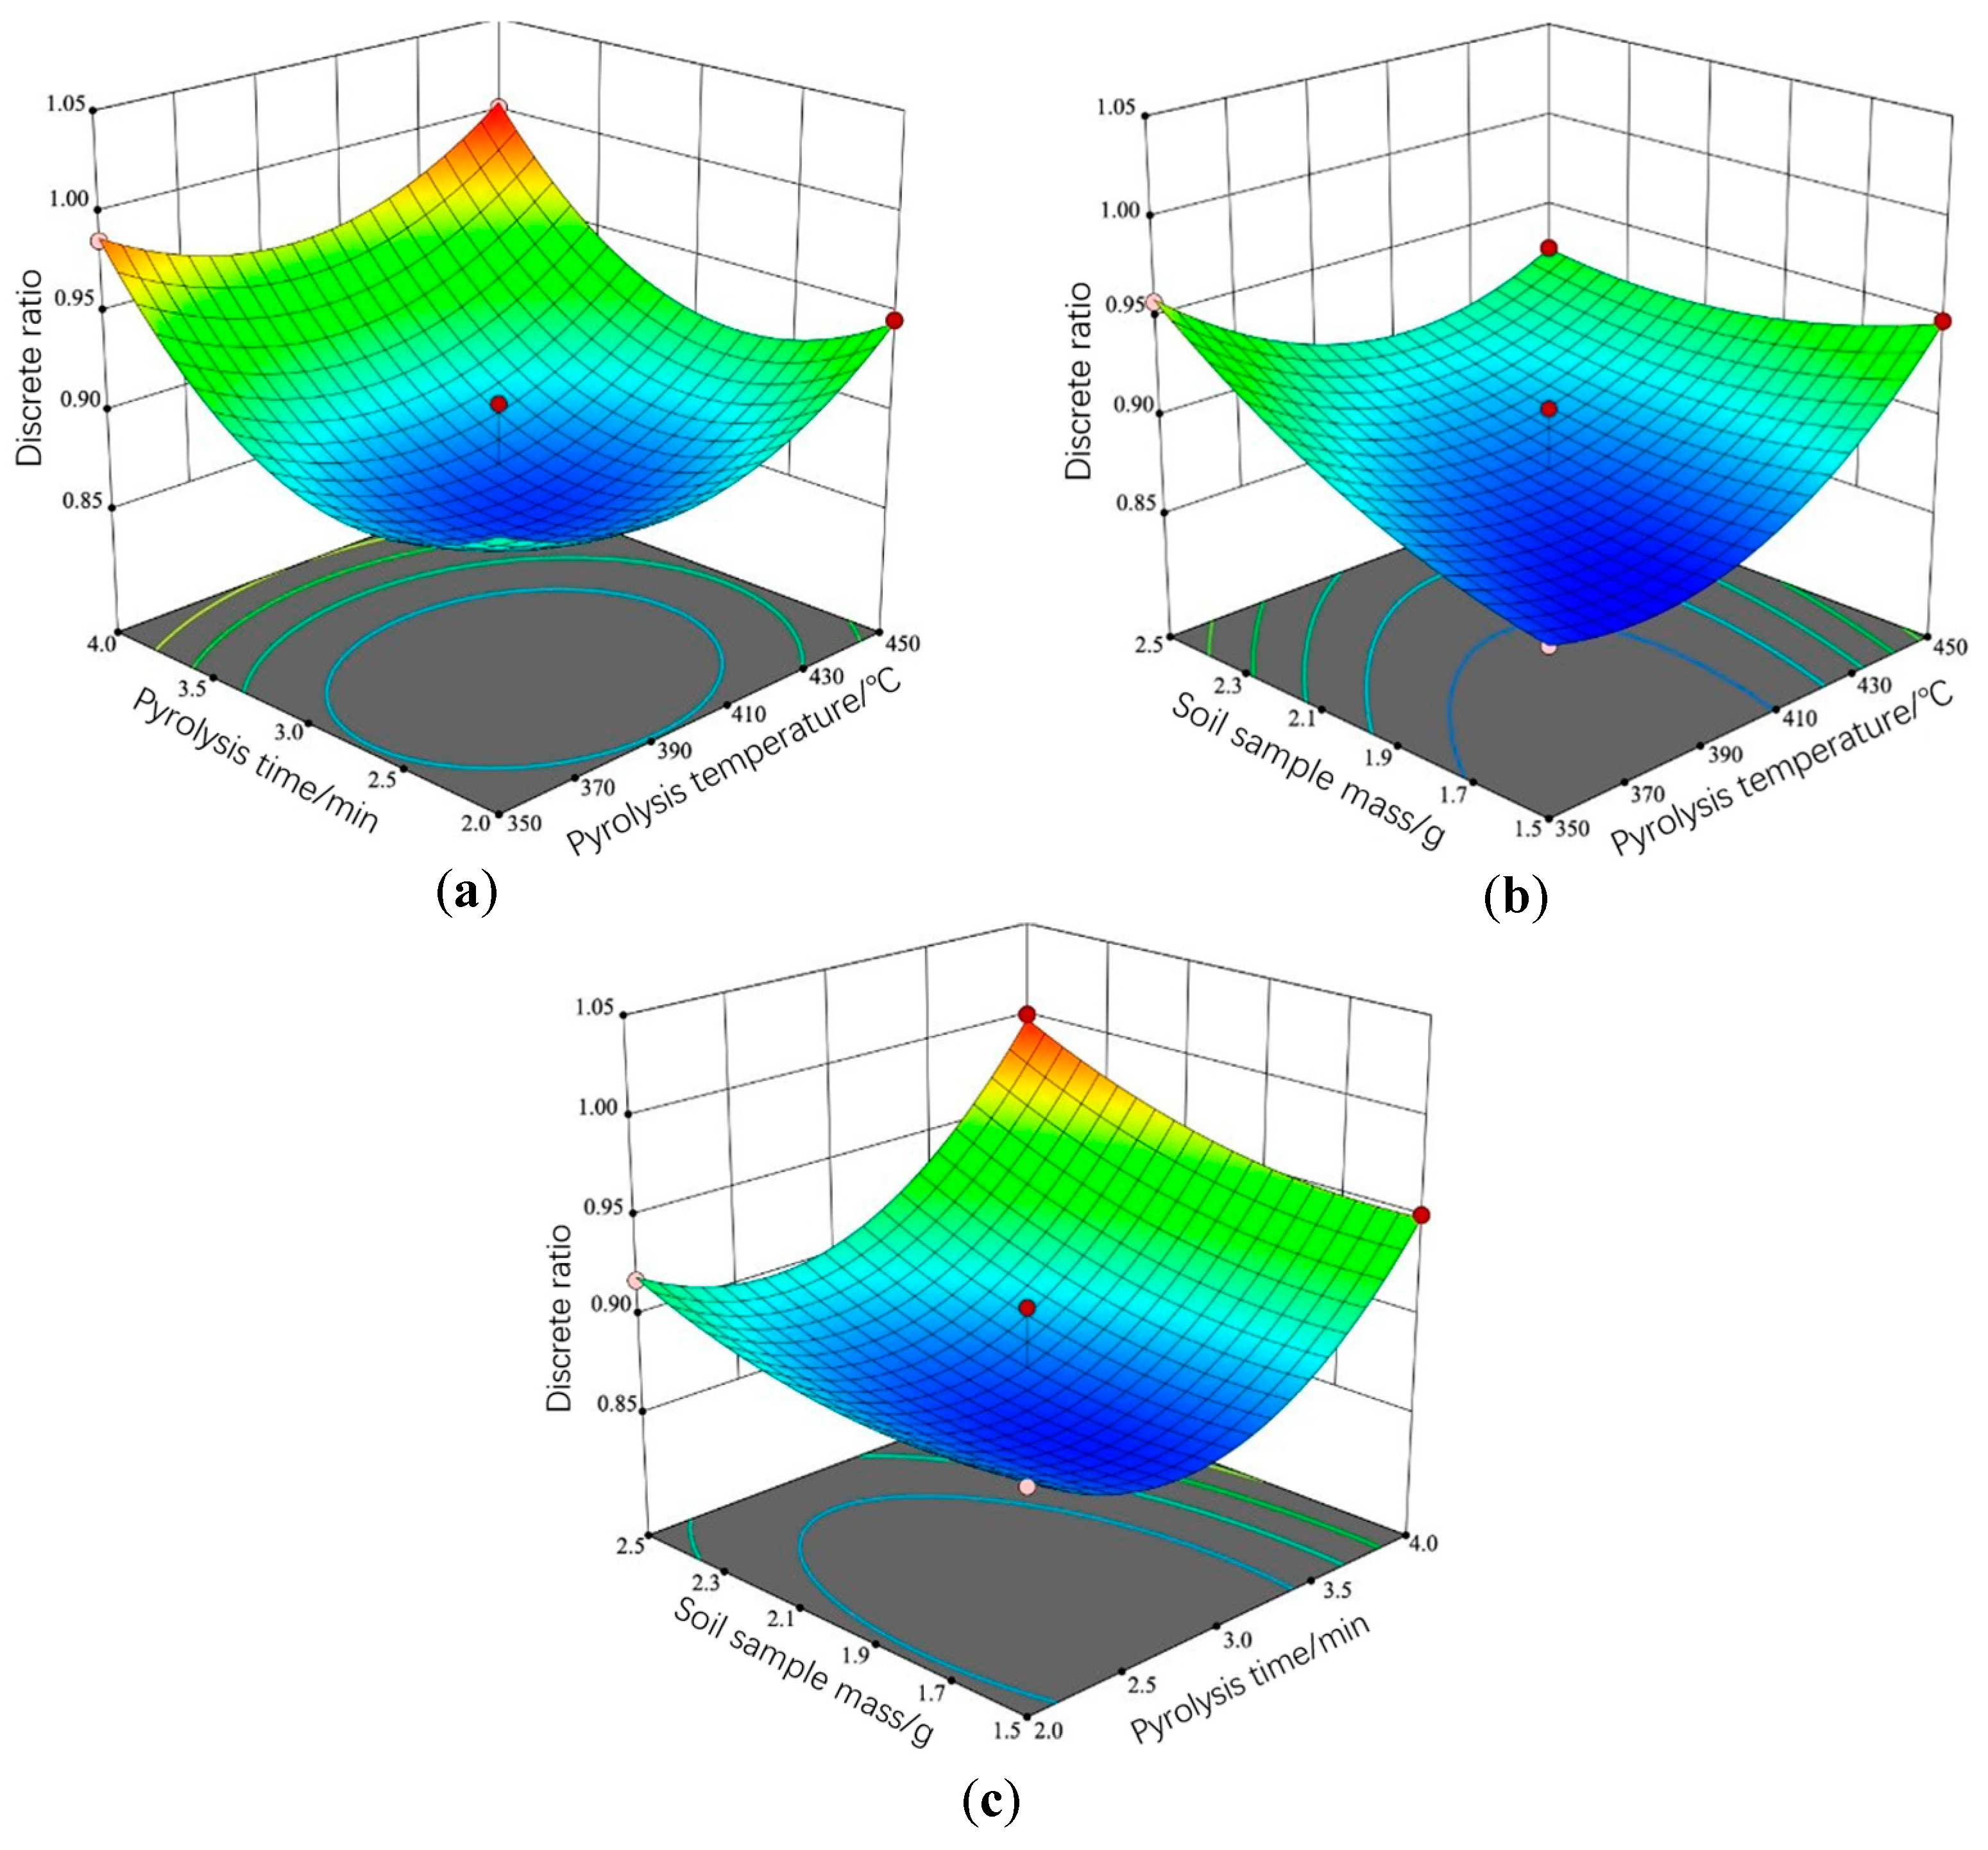
3.3. Analysis of Response Surface Results

3.3.1. Regression Analysis

Polynomial regression analyses and significance experiments were performed on the data in Table 3 using Design-Expert 12 software, modeling the regression between parameters and the discrete ratio of SOM and total nitrogen detection methods. The regression equations were obtained as follows:
D T = 0.87 + 0.012 × A + 0.033 × B + 0.018 × C 0.0034 × A B 0.029 × A C + 0.0061 × B C + 0.037 × A 2 + 0.053 × B 2 + 0.015 × C 2
where A is the coded value for the pyrolysis temperature, B is the coded value for the pyrolysis time, and C is the coded value for the soil sample mass.
The analysis of variance (ANOVA) of the quadratic model for the response surface experiment is shown in Table 4. In Table 4, the significance experiment F-value of the model is 21.64, and the p-value is 0.0003, indicating that the established quadratic regression model is highly significant. The experiment for misfit has an F-value of 0.0434 and a p-value of 0.9863, which is not significant relative to the pure error. The results of the experiment showed that the factors and levels chosen for the response surface experiment could fit the model well. Residuals in the model may be due to noise. The effects of three factors—the pyrolysis temperature, pyrolysis time, and soil sample mass—can be analyzed and predicted using this model and equations, and the optimum experiment parameters can be obtained.
According to Table 5, it can be seen that in the primary terms of the model, factors A, B, and C have significant effects, with B and C having highly significant effects, interaction AC having highly significant effects, and secondary terms A2 and B2 having highly significant effects on the experiment. It can be seen that the effect of each experiment factor on the discrete ratio presents a quadratic relationship rather than a simple proportional relationship. Based on the selected experimental factor levels, the relative importance of factors was determined as the pyrolysis time > soil sample mass > pyrolysis temperature. The model-predicted R2 was 0.93, and the adjusted model had a corrected coefficient of determination adjusted R2 of 0.92. The difference between the two was less than 0.2, which indicated that the established model fit the experiment well and the experimental error was small. The measured signal-to-noise ratio was 13.215 (rates greater than 4 are desirable), indicating that the model can be used to guide the design of experiments.

3.3.2. Response Surface Analysis and Parameter Optimization

A response surface plot is a three-dimensional spatial surface drawn from the response values under the interaction of the experiment factors, based on the regression equation, which can be used to determine the interrelationships between variables and to predict and experiment with the response values of the variables. The effects of AB, BC, and AC on the discrete ratio were analyzed according to the response surface plots, and the response surface 3D plots of the effects of the experiment factor interactions on the discrete ratio are shown in Figure 10.
It can be seen in Figure 10a that the discrete ratio DT shows a trend of decreasing and then increasing as the pyrolysis temperature and pyrolysis time increase. This indicates that there exists an optimal pyrolysis temperature and pyrolysis time that minimizes the discrete ratio. The reason for this is that the pyrolysis temperature and time directly determine the pyrolysis products. When both parameters are low, soil pyrolysis produces relatively few pyrolysis gas components, and the gas concentration is insufficient to produce a statistically significant response from the gas sensor array. When the two are large, excessive soil pyrolysis occurs, causing some of the soil pyrolysis gas to break down into smaller gas molecules to which the sensor array is unable to respond. The discrete ratio reached minimal values when the pyrolysis temperature ranged from 360 °C to 420 °C and the pyrolysis time was in the range of 2.2–3.1 min. As can be seen in Figure 10b, the discrete ratio shows a tendency to decrease and then increase with increasing pyrolysis temperature and decreasing soil sample mass, but the decrease is relatively smaller than that in Figure 10a. The reason for this is that the mass of the soil directly affects the amount of energy consumed per unit of soil. The pyrolysis time was 3 min, and an optimal pyrolysis temperature existed to make the soil cracking gas most responsive to the sensor array. However, too much soil consumes the energy utilized per unit of soil, preventing the soil from cracking sufficiently to obtain pyrolysis gases that are responsive to the sensor. The discrete ratio obtained from the experiments was smaller when the pyrolysis temperature was in the range from 350 °C to 420 °C and the soil sample mass was in the range from 1.5 to 2.1 g. The discrete ratio was lower than that obtained from the experiments. In Figure 10c, it can be seen that the discrete ratio shows a trend of decreasing and then increasing with an increasing pyrolysis time and decreasing soil sample mass, indicating that there exists an optimal pyrolysis time and soil sample mass to minimize the discrete ratio. The reason for this is similar to Figure 10b, where excess soil consumes too much energy, resulting in insufficient soil cracking, and the resulting pyrolysis gas is not sufficiently responsive to the sensor. The discrete ratio obtained from the experiment was relatively small when the pyrolysis time was in the range from 2.2 to 3.2 min and the soil sample mass was in the range from 1.5 to 2.2 g.
The discrete ratio can be used to indicate the response effect of this detection system. When this detection system had a clear distinction between groups and a higher degree of aggregation within groups, a smaller discrete ratio was obtained in the experiment. The optimization function of Design-Expert 12 was applied to optimize and analyze the response surface experiment to obtain the optimal parameter combination. The smallest discrete ratio of 0.8576 was obtained at a pyrolysis temperature of 384.11 °C, a pyrolysis time of 2.68 min, and a soil sample mass of 1.68 g. In practice, the optimization results were rounded to facilitate the setting of system parameters; the experiment parameters were set to the pyrolysis temperature of 384 °C, the pyrolysis time of 2 min 41 s, and the soil sample mass of 1.68 g.
In order to verify the performance of the model prediction, the optimal parameters were used to repeat the experiment, and there were five experiments. The measured value of the discrete ratio of the optimal parameters was 0.8591, which differed from the model-predicted value of 0.8576 by 0.17%. This shows that the predicted values of the model and the actual measured values are in good agreement, which verifies the accuracy and reliability of the established model. Therefore, the experimental parameters derived from Box–Behnken design optimization demonstrate both reliability and practical utility for this detection system.

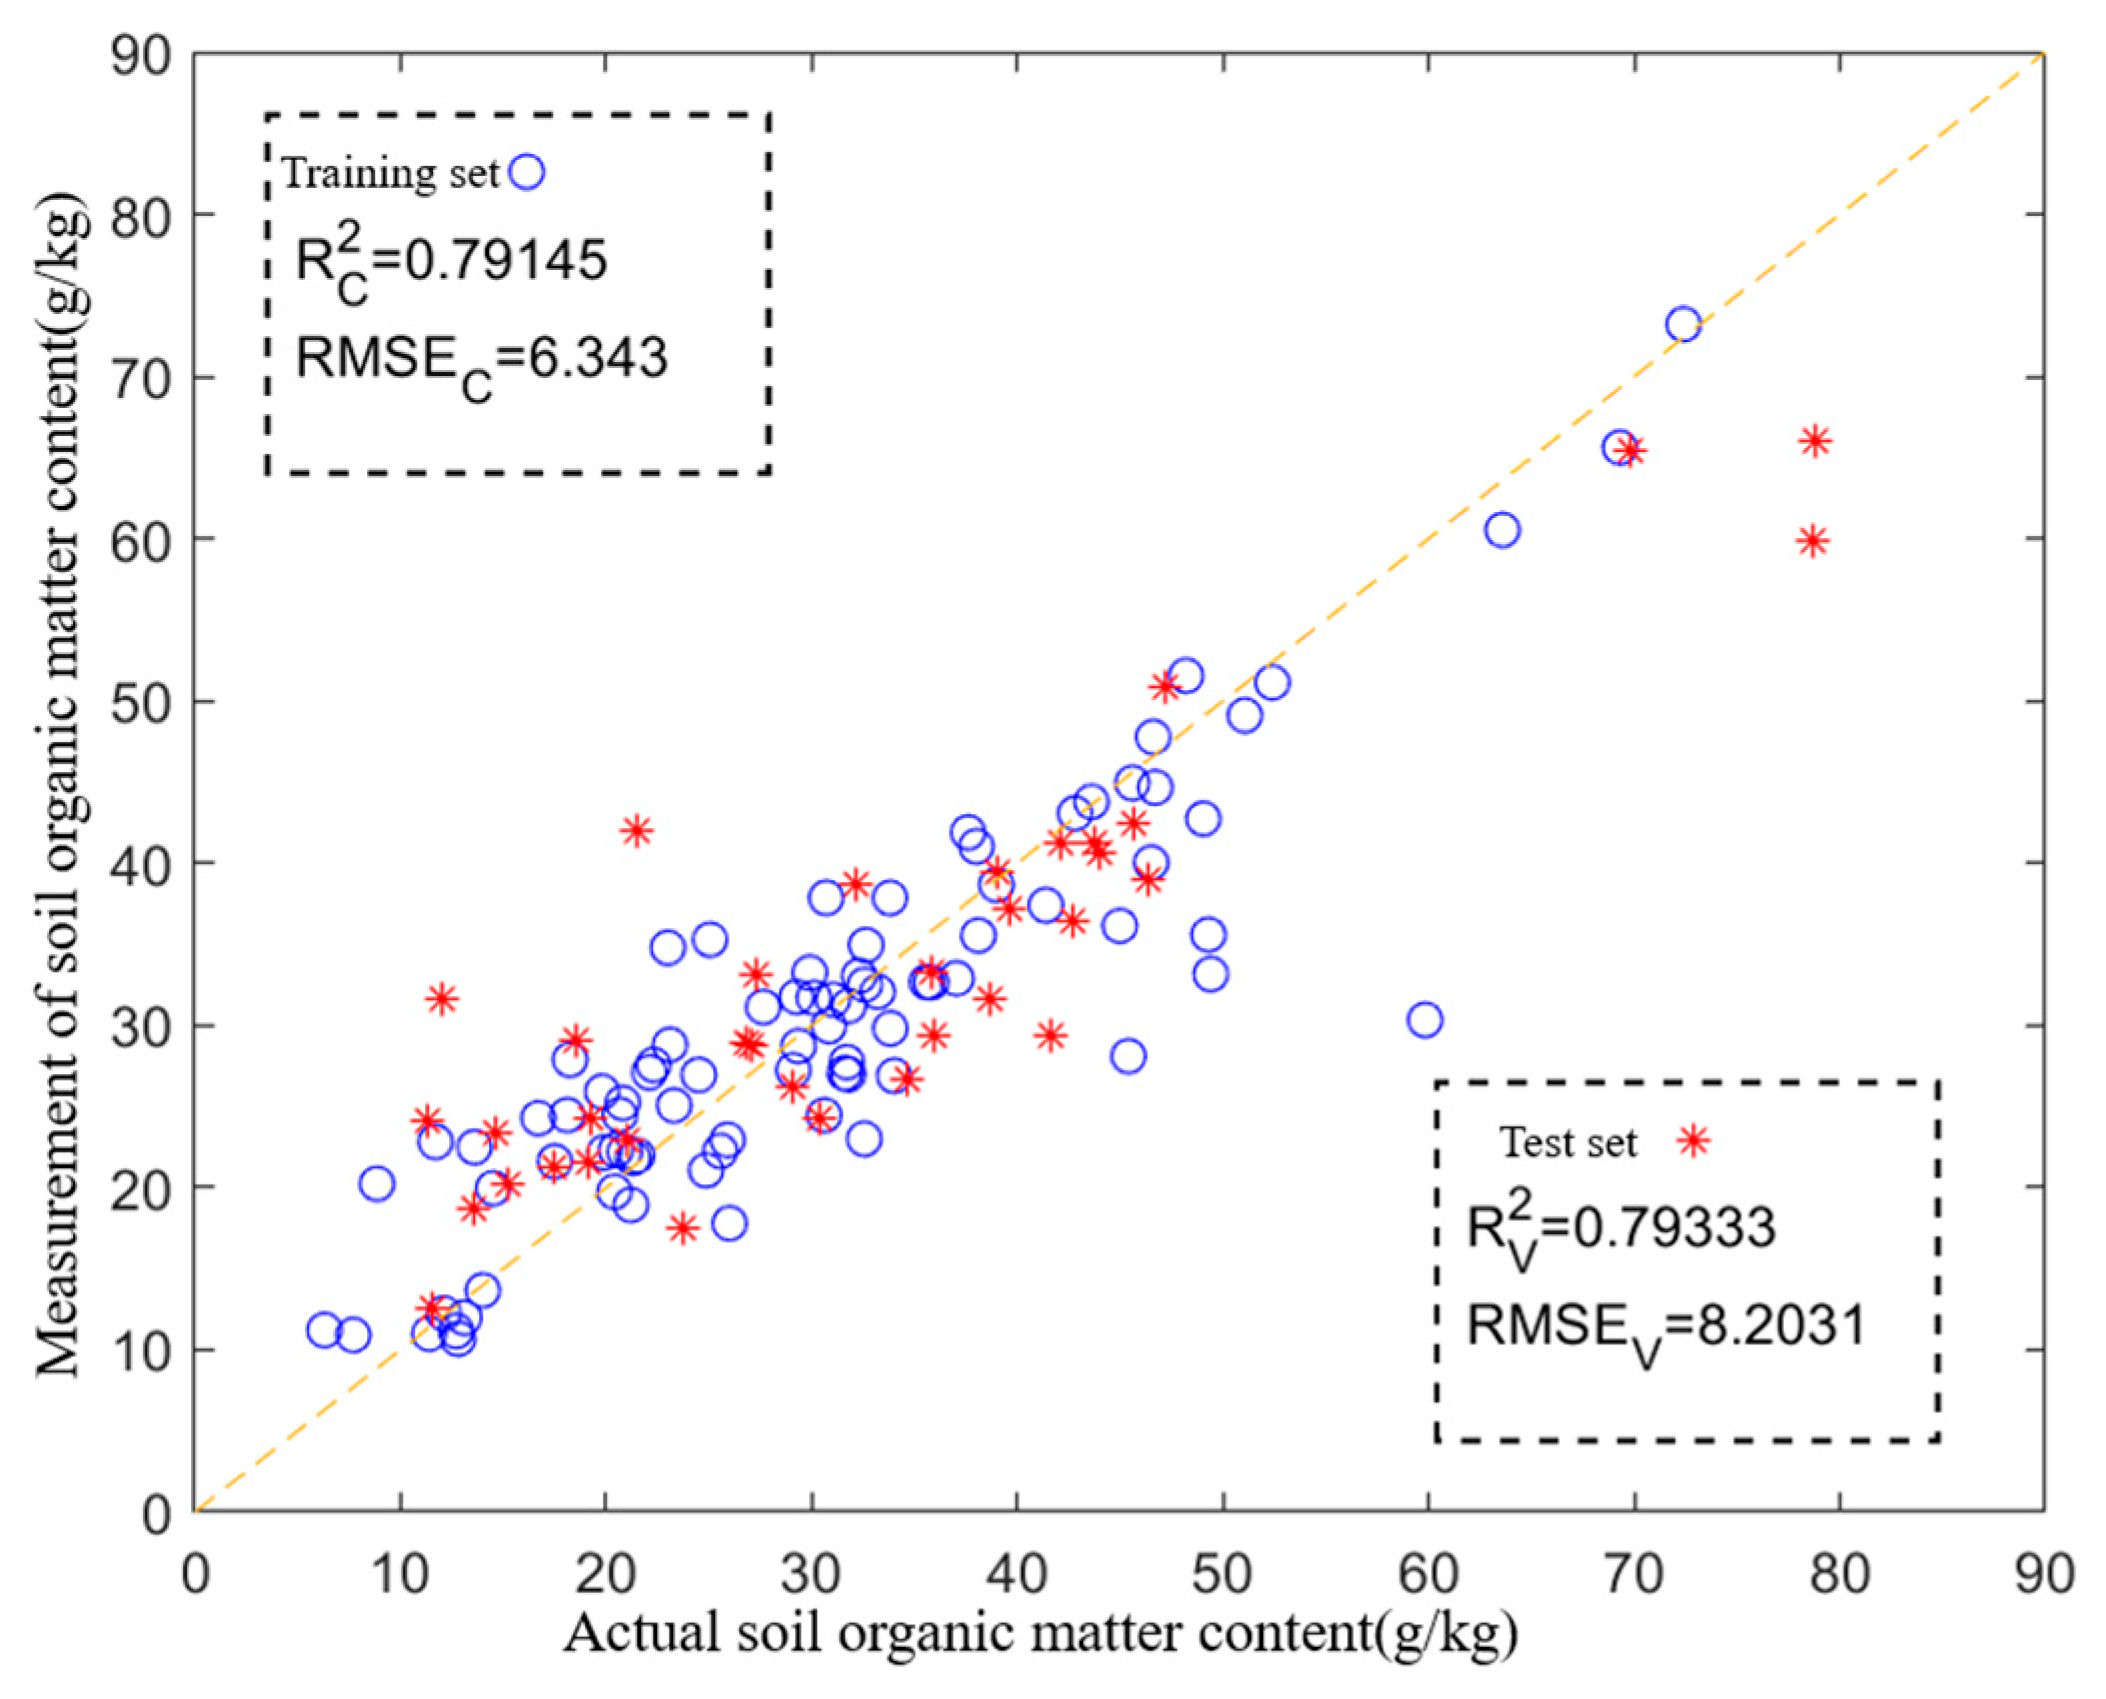
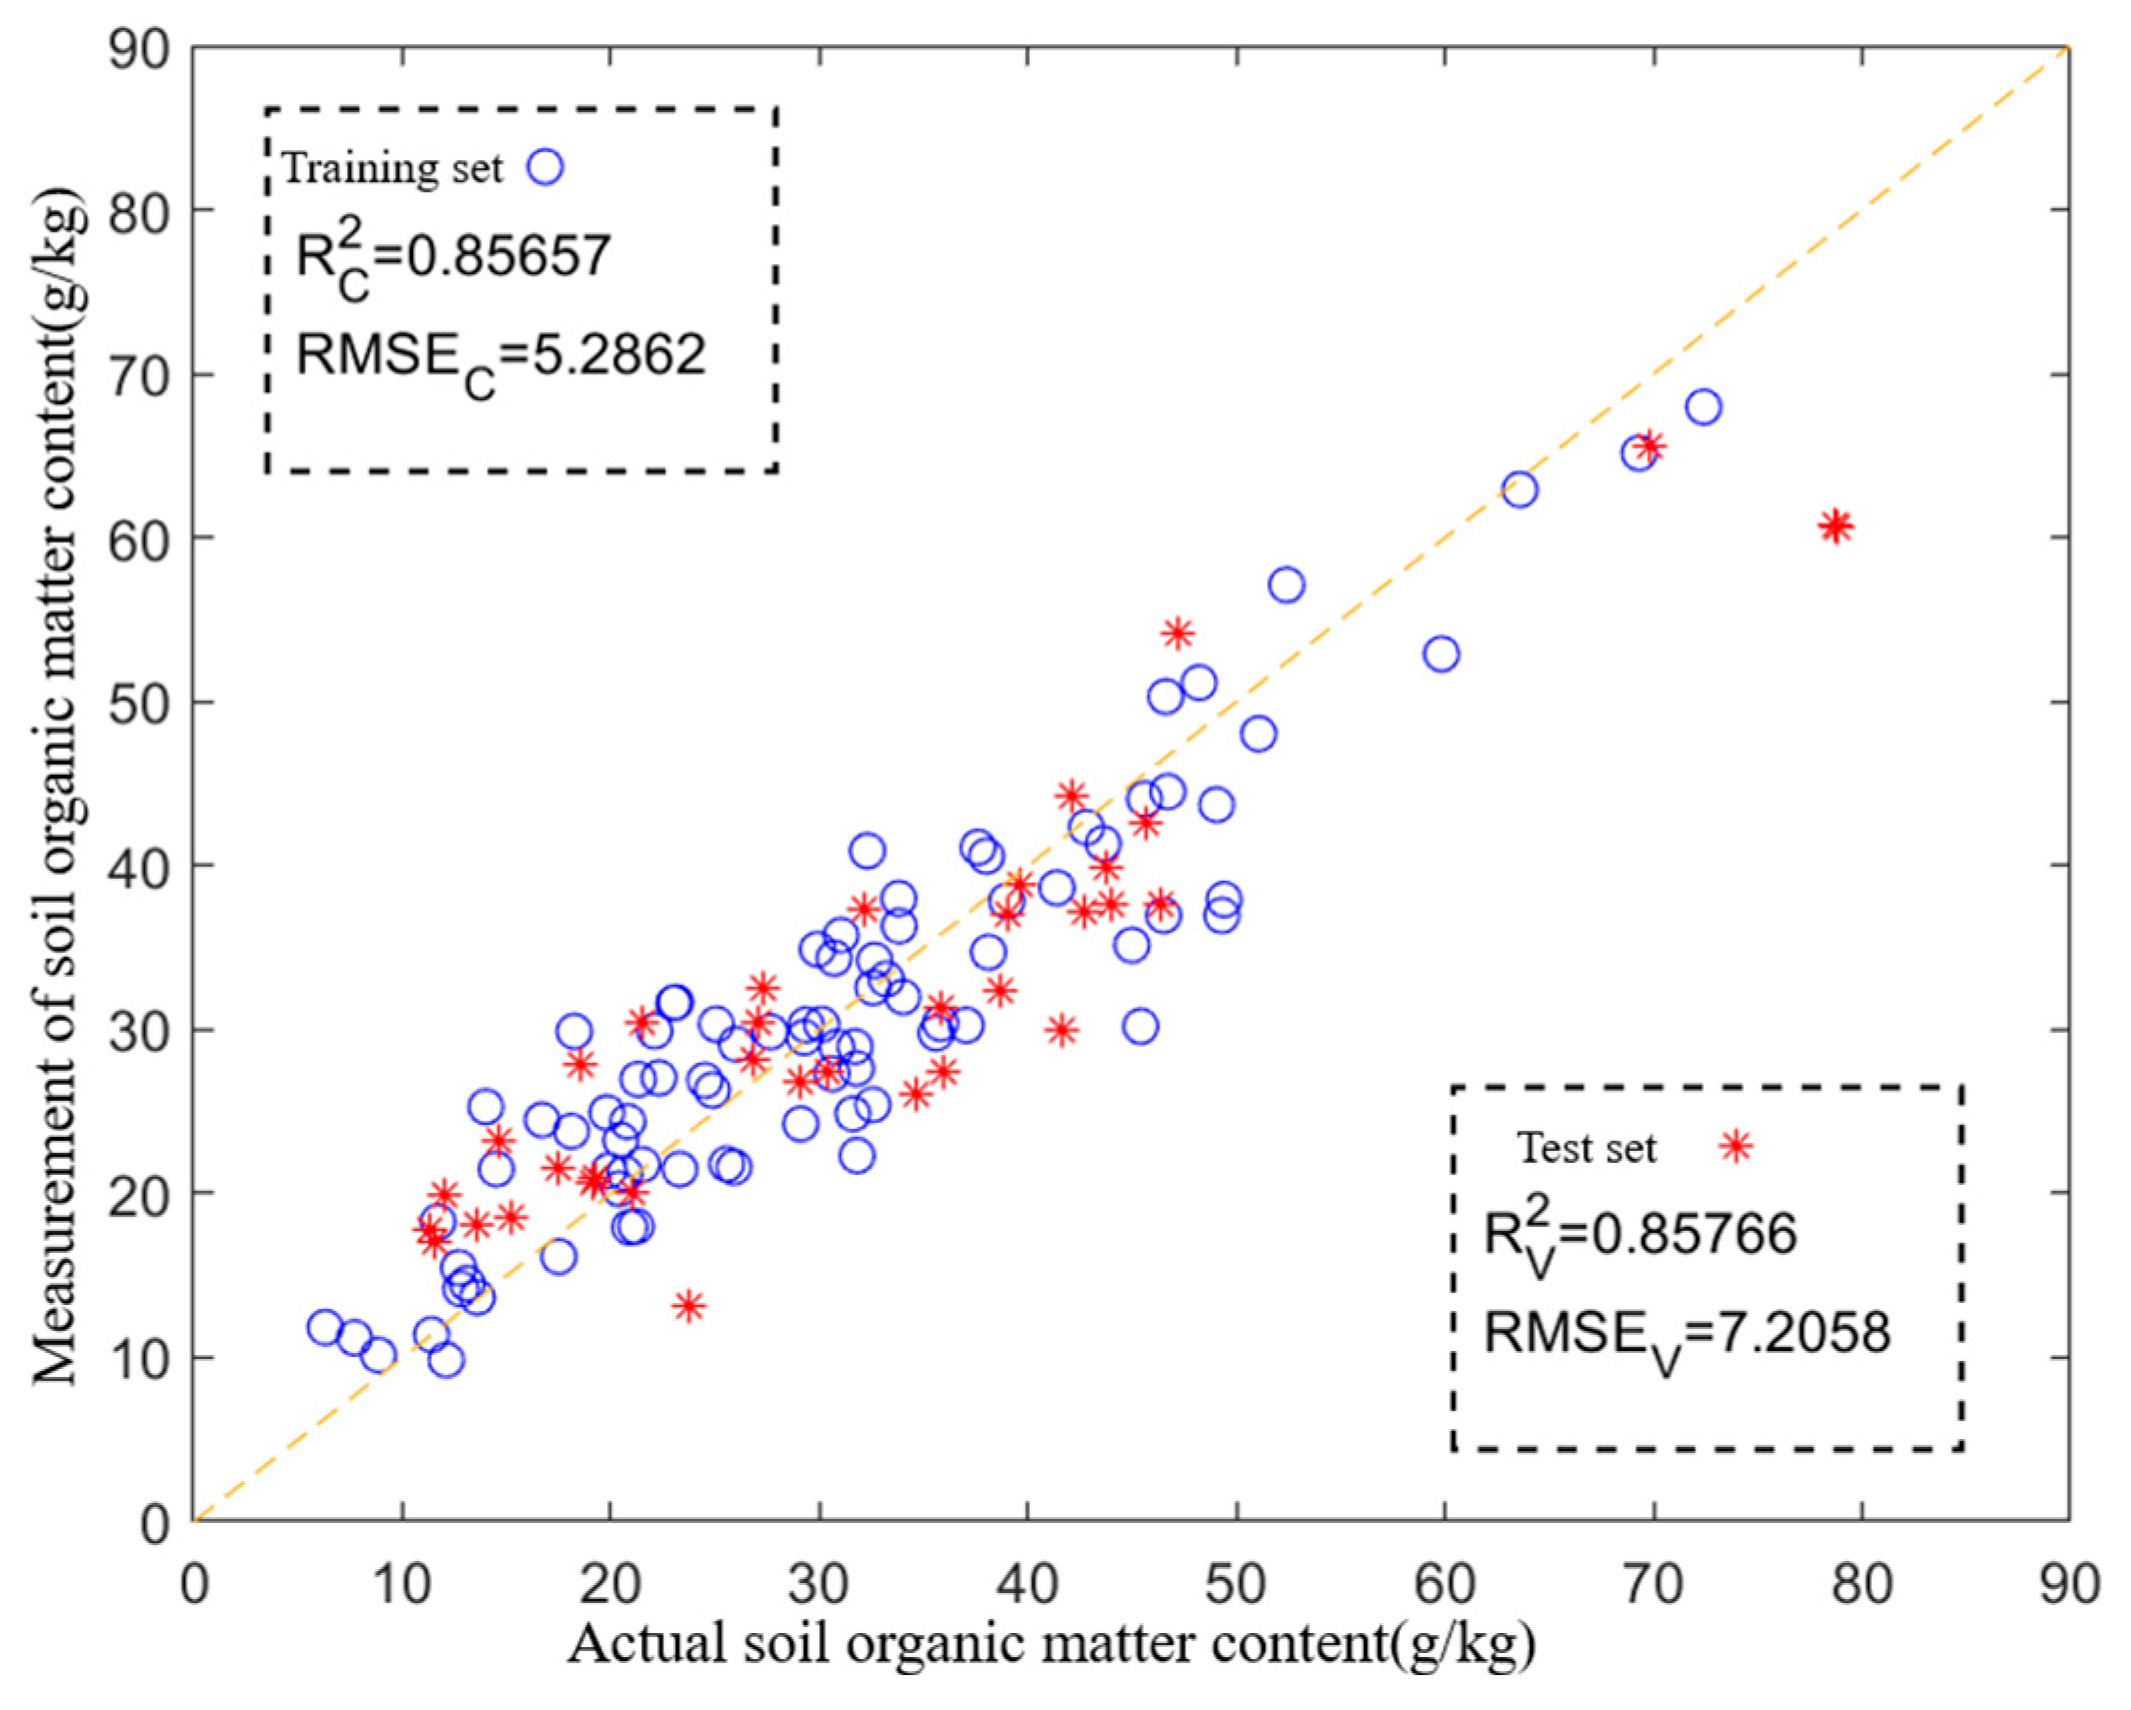
3.4. Application Under Optimal Experiment Parameters

Under the optimal experiment parameters, 121 collected soil samples were pyrolyzed, and the response curves of the resulting gases were recorded using an artificial olfaction system. The mean, variance, maximum gradient, maximum, response area, transient at the third and second, and average differential coefficient values of the response curves were used as the characteristics. Partial least squares regression (PLSR) and back propagation neural network (BPNN) algorithms were used for modeling, and the prediction performance of the models was evaluated using the root mean square error (RMSE) and coefficient of determination (R2). The Kennard–Stone algorithm was used to set the training and testing sets to 7:3, comprising 85 and 36 soil samples, respectively. The prediction results for the training and testing sets of the BPNN model were obtained, as shown in Figure 11.
In Figure 11, the BPNN algorithm builds a prediction model with R2 = 0.79 and RMSE = 6.34 for the training set and R2 = 0.79 and RMSE = 8.20 for the testing set. The model can basically realize the prediction of SOM contents. However, as can be seen in Figure 11, the predicted values of individual samples in the training and testing sets deviate significantly from the actual values. The prediction results for the training and testing sets of the PLSR model are shown in Figure 12.
In Figure 12, the PLSR algorithm builds a prediction model with R2 = 0.86 and RMSE = 5.29 for the training set and R2 = 0.86 and RMSE = 7.21 for the testing set. The PLSR model demonstrated accurate quantitative analysis capabilities and strong generalization ability, with R2 > 0.85 and RMSE < 7.21 for both training and testing sets.

3.5. Discussion

This study provides a new method for detecting SOM contents using pyrolysis coupled with an artificial olfaction system. The feasibility of this method was demonstrated well when modeling the data. The SOM content is closely related to smart agriculture and precision fertilization. The method proposed in this study for detecting the contents of SOM has greatly enriched the research tools for modern agriculture and is conducive to the realization of agricultural modernization.

4. Conclusions

In this study, a method for predicting SOM content based on pyrolysis coupled with an artificial olfaction system was proposed. The effects of the pyrolysis temperature, pyrolysis time, and soil sample mass related to the pyrolysis process on the differentiation of pyrolysis gases were analyzed using single-factor and multi-factor experiments. The following conclusions were obtained:
(1)
Single-factor experiments were conducted to determine the optimal values of pyrolysis process parameters. Higher differentiation and lower discrete ratio of pyrolysis gases were observed at a pyrolysis temperature of 400 °C, a pyrolysis time of 3 min, and a soil sample mass of 2 g.
(2)
A multi-factor experiment based on the Box–Behnken method was conducted to specify the optimal combination of parameters. The experimental results showed that the pyrolysis time had the greatest effect on the differentiation of pyrolysis gases, followed by soil sample mass and pyrolysis temperature. The pyrolysis gases exhibited the maximum differentiation and the minimum discrete ratio at a soil cracking temperature of 384 °C, a pyrolysis time of 2 min 41 s, and a soil sample mass of 1.68 g.
(3)
The SOM prediction model was developed. The back propagation neural network (BPNN) and partial least squares regression (PLSR) algorithms were used to establish an SOM prediction model after obtaining soil pyrolysis gases under the optimal combination of pyrolysis parameters. And the experimental results showed that the SOM prediction model constructed based on PLSR had the best prediction accuracy and the highest generalization ability (R2 > 0.85, RMSE < 7.21).
The optimized pyrolysis parameters in this paper could effectively improve the differentiation of pyrolysis gases, thereby enhancing the performance of the SOM content prediction model. This study provides a theoretical basis for exploring the mechanism of pyrolysis coupled with an artificial olfaction system to predict SOM contents. The method proposed in this study is currently used for laboratory measurements as an alternative to conventional chemical methods for measuring SOM contents. Field measurements will be the focus of future research.

5. Patents

This article covers two patents:
1. <A soil nutrient detection device based on visual olfaction>. Patent number: ZL 2019 1 1264408.9.
2. <A soil nutrient detection device based on pyrolysis and artificial olfaction>. Patent number: ZL 2019 1 1264407.4.

Author Contributions

M.L.: funding acquisition, conceptualization, methodology, writing—original draft. X.L. (Xiao Li): data curation, investigation, software, writing—original draft. X.L. (Xuexun Li): visualization, investigation. W.W.: funding acquisition, project administration, writing—reviewing and editing. Y.C.: software, validation. L.Z.: funding acquisition, validation. X.X.: visualization, investigation. All authors have read and agreed to the published version of the manuscript.

Funding

This work was supported by the National Key Research and Development Program of China (2024YFD2000404-03), the National Natural Science Foundation of China (52405280), the Natural Science Foundation of Shandong Province (ZR2024QE004, ZR2023QF143, ZR2023QE198), the High-quality Development Project for the Ministry of Industry and Information (2023ZY02009), and the Youth Innovation Team Development Plan for Higher Education Institutions in Shandong Province (2022KJ225).

Data Availability Statement

All data required for this paper are provided in tables, figures, or directly in the text.

Acknowledgments

Thanks are expressed to all the colleagues who contributed to this study.

Conflicts of Interest

The authors declare no conflicts of interest.

References

  1. Zhou, P.; Kong, Y.; Hao, S.; Yin, X.; Xiao, X.; Jin, C. Influence of soil moisture on the inversion accuracy of near-infrared spectra of organic matter. Trans. Chin. Soc. Agric. Eng. 2024, 40, 113–123, (In Chinese with English abstract). [Google Scholar]
  2. Wei, L.; Yuan, Z.; Wang, Z.; Zhao, L.; Zhang, Y.; Lu, X.; Cao, L. Hyperspectral Inversion of Soil Organic Matter Content Based on a Combined Spectral Index Model. Sensors 2020, 20, 2777. [Google Scholar] [CrossRef] [PubMed]
  3. Yan, M.; Zhang, X.; Liu, K.; Lou, Y.; Wang, Y. Particle size primarily shifts chemical composition of organic matter under long-term fertilization in paddy soil. Eur. J. Soil Sci. 2022, 73, e13170. [Google Scholar] [CrossRef]
  4. Dufour, L.J.P.; Wetterlind, J.; Nunan, N.; Quenea, K.; Shi, A.; Weih, M.; Herrmann, A.M. Salix species and varieties affect the molecular composition and diversity of soil organic matter. Plant Soil 2024, 508, 767–784. [Google Scholar] [CrossRef]
  5. Zhou, J.; Qiao, N.; Zhu, T.; Pang, R.; Sun, Y.; Zhou, X.; Xu, X. Native soil labile organic matter influences soil priming effects. Appl. Soil Ecol. 2023, 182, 104732. [Google Scholar] [CrossRef]
  6. Maharjan, G.R.; Prescher, A.-K.; Nendel, C.; Ewert, F.; Mboh, C.M.; Gaiser, T.; Seidel, S.J. Approaches to model the impact of tillage implements on soil physical and nutrient properties in different agro-ecosystem models. Soil Tillage Res. 2018, 180, 210–221. [Google Scholar] [CrossRef]
  7. Kotroczó, Z.; Kocsis, T.; Juhos, K.; Halász, J.; Fekete, I. How Does Long-Term Organic Matter Treatment Affect the Biological Activity of a Centre European Forest Soil? Agronomy 2022, 12, 2301. [Google Scholar] [CrossRef]
  8. Li, X.; Cao, S.; Bai, X.; Li, H. Research Progress of Multi-Spectral Technique in the Determination of Soil Componet Cotent. Spectrosc. Spectr. Anal. 2020, 40, 2042–2047, (In Chinese with English abstract). [Google Scholar]
  9. Černý, J.; Balík, J.; Suran, P.; Sedlář, O.; Procházková, S.; Kulhánek, M. The Content of Soil Glomalin Concerning Selected Indicators of Soil Fertility. Agronomy 2024, 14, 1731. [Google Scholar] [CrossRef]
  10. Zhao, Z.; Zhang, C.; Wang, H.; Li, F.; Pan, H.; Yang, Q.; Li, J.; Zhang, J. The Effects of Natural Humus Material Amendment on Soil Organic Matter and Integrated Fertility in the Black Soil of Northeast China: Preliminary Results. Agronomy 2023, 13, 794. [Google Scholar] [CrossRef]
  11. Oldfield, E.E.; Wood, S.A.; Bradford, M.A. Direct effects of soil organic matter on productivity mirror those observed with organic amendments. Plant Soil 2018, 423, 363–373. [Google Scholar] [CrossRef]
  12. Zhang, X.; Liu, D.; Ma, J.; Wang, X.; Li, Z.; Zheng, D. Visible Near-Infrared Hyperspectral Soil Organic Matter Prediction Based on Combinatorial Modeling. Agronomy 2024, 14, 789. [Google Scholar] [CrossRef]
  13. Cao, Y.; Yang, W.; Wang, D.; Li, H.; Meng, C. Soil Organic Matter Characteristic Wavelength Extraction and Prediction Model Based on Moisture and Particle Size. Trans. Chin. Soc. Agric. Mach. 2022, 5, 241–248, (In Chinese with English abstract). [Google Scholar]
  14. Ye, M.; Zhu, L.; Liu, X.; Huang, Y.; Chen, B.; Li, H. Hyperspectral Inversion of Soil Organic Matter Content Based on Continuous Wavelet Transform, SHAP, amd XGBoost. Environ. Sci. 2024, 45, 2280–2291, (In Chinese with English abstract). [Google Scholar]
  15. Wei, D.; Zheng, G.; Gao, G. Estimation of Soil Total Phosphorus Content in Coastal Areas Based on Hyperspectral Reflectance. Spectrosc. Spectr. Anal. 2022, 42, 517–523, (In Chinese with English abstract). [Google Scholar]
  16. Horta, A.; Azevedo, L.; Neves, J.; Soares, A.; Pozza, L. Integrating portable X-ray fluorescence (pXRF) measurement uncertainty for accurate soil contamination mapping. Geoderma 2021, 382, 114712. [Google Scholar] [CrossRef]
  17. Li, G.; Gao, X.; Xiao, N.; Xiao, Y. Estimation Soil Organic Matter Contents with Hyperspectra Based on sCARS and RF Algorithms. Chin. J. Lumin. 2019, 40, 1030–1039, (In Chinese with English abstract). [Google Scholar]
  18. Li, C.; Zhao, J.; Li, Y.; Meng, Y.; Zhang, Z. Modeling and prediction of soil organic matter content based on visible-near-Infrared spectroscopy. Forests 2021, 12, 1809. [Google Scholar] [CrossRef]
  19. He, D.; Chen, X. Real-time Measurement of Soil Organic Matter Content in Field. Trans. Chin. Soc. Agric. Mach. 2015, 46, 127–132, (In Chinese with English abstract). [Google Scholar]
  20. Jiao, C.; Zheng, G.; Xie, X.; Cui, X.; Shang, G. Prediction of Soil Organic Matter Using Visible-Short Near-Infrared Imaging Spectroscopy. Spectrosc. Spectr. Anal. 2020, 40, 3277–3281. [Google Scholar]
  21. Sowoidnich, K.; Vogel, S.; Maiwald, M.; Sumpf, B. Determination of Soil Constituents Using Shifted Excitation Raman Difference Spectroscopy. Appl. Spectrosc. 2022, 76, 712–722. [Google Scholar] [CrossRef] [PubMed]
  22. Kania, M.; Kupka, D.; Gruba, P. The application of near infrared (NIR) spectroscopy for the quantitative assessment of soil organic matter fraction in forests. Sylwan 2022, 166, 635–646. [Google Scholar]
  23. Mai, M.; Wang, X. Hyperspectral Estimatioon of Soil Organic Matter Content Based on Continuous Wavelet Transformatiion. Spectrosc. Spectr. Anal. 2022, 42, 1278–1284, (In Chinese with English abstract). [Google Scholar]
  24. Albrecht, R.; Sebag, D.; Verrecchia, E. Organic matter decomposition: Bridging the gap between Rock-Eval pyrolysis and chemical characterization (CPMAS 13C NMR). Biogeochemistry 2015, 122, 101–111. [Google Scholar] [CrossRef]
  25. Biache, C.; Lorgeoux, C.; Saada, A.; Colombano, S.; Faure, P. Fast method to quantify PAHs in contaminated soils by direct thermodesorption using analytical pyrolysis. Talanta 2017, 166, 241–248. [Google Scholar] [CrossRef] [PubMed]
  26. Chen, Q.; Wu, Y.; Lei, T.; Si, G.; Zhang, G. Study on the fingerprints of soil organic components in alpine grassland based on Py-GC-MS/MS Technology. Acta Ecol. Sin. 2018, 38, 2864–2873, (In Chinese with English abstract). [Google Scholar]
  27. Campo, J.; Nierop, K.; Cammeraat, E.; Andreu, V.; Rubio, J. Application of pyrolysis-gas chromatography/mass spectrometry to study changes in the organic matter of macro- and microaggregates of a Mediterranean soil upon heating. J. Chromatogr. A 2011, 1218, 4817–4827. [Google Scholar] [CrossRef] [PubMed]
  28. Zong, B.; Wu, S.; Yang, Y.; Li, Q.; Tao, T.; Mao, S. Smart gas sensors: Recent developments and future prospective. Nano-Micro Lett. 2025, 17, 54. [Google Scholar] [CrossRef] [PubMed]
  29. Dragonieri, S.; Pennazza, G.; Carratu, P.; Resta, O. Electronic Nose Technology in Respiratory Diseases. Lung 2017, 195, 157–165. [Google Scholar] [CrossRef] [PubMed]
  30. Rahman, M.A.; Karthikeyan, M.; Johnson, I.; Raja, K.; Sekar, C.; Mary, X.A.; Basha, J.S. Ensuring food security through rapid and in-field detection of diseases in food crops using real time and portable sensors. Anal. Biochem. 2025, 705, 115925. [Google Scholar] [CrossRef] [PubMed]
  31. Qiao, J.; Su, G.; Liu, C.; Zou, Y.; Chang, Z.; Yu, H.; Wang, L.; Guo, R. Study on the application of electronic nose technology in the detection for the artificial ripening of crab apples. Horticulturae 2022, 8, 386. [Google Scholar] [CrossRef]
  32. Wojnowski, W.; Dymerski, T.; Gębicki, J.; Namieśnik, J. Electronic Noses in Medical Diagnostics. Curr. Med. Chem. 2019, 26, 197–215. [Google Scholar] [CrossRef] [PubMed]
  33. Li, Y.; Wang, Z.; Zhao, T.; Li, H.; Jiang, J.; Ye, J. Electronic nose for the detection and discrimination of volatile organic compounds: Application, challenges, and perspectives. TrAC-Trends Anal. Chem. 2024, 180, 117958. [Google Scholar] [CrossRef]
  34. Shooshtari, M.; Salehi, A. An electronic nose based on carbon nanotube-titanium dioxide hybrid nanostructures for detection and discrimination of volatile organic compounds. Sens. Actuators B Chem. 2022, 357, 131418. [Google Scholar] [CrossRef]
  35. Liu, S.; Chen, X.; Xia, X.; Jin, Y.; Wang, G.; Jia, H.; Huang, D. Electronic sensing combined with machine learning models for predicting soil nutrient content. Comput. Electron. Agric. 2024, 221, 108947. [Google Scholar] [CrossRef]
  36. Bieganowski, A.; Jaromin-Glen, K.; Guz, Ł.; Łagód, G.; Jozefaciuk, G.; Franus, W.; Suchorab, Z.; Sobczuk, H. Evaluating Soil Moisture Status Using an e-Nose. Sensors 2016, 16, 886. [Google Scholar] [CrossRef] [PubMed]
  37. Lavanya, S.; Deepika, B.; Narayanan, S.; Murthy, V.K.; Uma, M.V. Indicative extent of humic and fulvic acids in soils determined by electronic nose. Comput. Electron. Agric. 2017, 139, 198–203. [Google Scholar] [CrossRef]
  38. Zhu, L.; Li, M.; Xia, X.; Huang, D. Soil Organic Matter Detection Method Based on Artificial Olfaction System. Trans. Chin. Soc. Agric. Mach. 2020, 51, 171–179, (In Chinese with English abstract). [Google Scholar]
  39. Li, M.; Zhu, Q.; Xia, X.; Liu, H.; Huang, D. Detection Method of Soil Organic Matter Based on Multi-sensor Artificial Olfactory System. Trans. Chin. Soc. Agric. Mach. 2021, 52, 109–119. [Google Scholar]
  40. Wang, J.; Niu, W.; Zhang, W.; Li, G.; Sun, J.; Wang, Y. Spatial variability of soil nutrients in topsoil of cultivated land. Trans. Chin. Soc. Agric. Eng. 2020, 36, 37–46, (In Chinese with English abstract). [Google Scholar]
  41. Xian, Y.; Song, J.; Wang, J.; Li, W.; Zhang, W.; Wang, H. Spatial Interpolation of Soil Nutrients Content Based on Environment Variables Screening and Machine Learning. Trans. Chin. Soc. Agric. Mach. 2024, 55, 379–391, (In Chinese with English abstract). [Google Scholar]
  42. De la Rosa, J.M.; Faria, S.R.; Varela, M.E.; Knicker, H.; González-Vila, F.J.; González-Pérez, J.A.; Keizer, J. Characterization of wildfire effects on soil organic matter using analytical pyrolysis. Geoderma 2012, 191, 24–30. [Google Scholar] [CrossRef]
Figure 1. Soil organic matter detection system with pyrolysis furnace coupled with artificial olfaction. 1. Pyrolysis furnace. 2. Soil sample. 3. Quartz tube. 4. Gas sensor array. 5. Laptop. 6. Signal processing circuit. 7. NI data acquisition. 8. Quartz boat. 9. Vacuum flange. 10. Vacuum pump. 11. PWM speed control module.
Agronomy 15 01740 g001
Figure 2. Upper computer software program block diagram.
Agronomy 15 01740 g002
Figure 3. Upper computer software interface.
Agronomy 15 01740 g003
Figure 4. Influence of pyrolysis temperature on discrete ratio.
Agronomy 15 01740 g004
Figure 5. Influence of pyrolysis temperature on sensor array response. (a) Pyrolysis temperature of 200 °C, (b) pyrolysis temperature of 300 °C, (c) pyrolysis temperature of 400 °C, and (d) pyrolysis temperature of 500 °C. Note: S1~S10 are the sensor numbers in the figure.
Agronomy 15 01740 g005
Figure 6. Influence of pyrolysis time on discrete ratio.
Agronomy 15 01740 g006
Figure 7. Influence of pyrolysis time on sensor array response. (a) 1 min pyrolysis time, (b) 3 min pyrolysis time, (c) 5 min pyrolysis time, and (d) 10 min pyrolysis time. Note: S1–S10 are the sensor numbers in the figures.
Agronomy 15 01740 g007
Figure 8. Influence of soil sample mass on discrete ratio.
Agronomy 15 01740 g008
Figure 9. Influence of soil sample mass on sensor response. (a) 1 g soil sample mass, (b) 2 g soil sample mass, and (c) 3 g soil sample mass. Note: S1–S10 are the sensor numbers in the figure.
Agronomy 15 01740 g009
Figure 10. Response surface 3D diagram of the influence of interaction of experimental factors on discrete ratio. (a) DT (A, B, 2), (b) DT (A, 3, C), and (c) DT (400, B, C).
Agronomy 15 01740 g010
Figure 11. Prediction results of BPNN model practice set and experiment set.
Agronomy 15 01740 g011
Figure 12. Prediction results of PLSR model practice set and experiment set.
Agronomy 15 01740 g012
Table 3. Content of organic matter in soil samples.
ParameterSoil Samples
SOM content/(g·kg−1)32.55; 49.04; 23.30; 33.2; 16.7; 20.4; 24.86; 51.06; 32.64; 24.5; 63.59; 31.77; 12.7; 20.8; 21.3; 44.98; 23.1; 29.35; 21.2; 18.1; 48.2; 23; 14; 13.59; 42.8; 41.38; 59.83; 38.98; 45.59; 12.8; 34; 22.3; 20.47; 26; 17.5; 20.9; 19.9; 46.70; 19.8; 72.4; 21.5; 52.4; 33.8; 35.59; 33.82; 25.9; 8.85; 49.29; 31.6; 30.6; 11.39; 29.26; 31.7; 32.57; 25.55; 30.83; 27.64; 38; 37.04; 35.80; 13.1; 32.30; 20.66; 25.05; 31.03; 29.9; 7.7; 12.1; 38.1; 45.40; 46.5; 46.60; 30.1; 29.1; 6.3; 22.1; 11.7; 18.24; 14.5; 69.3; 37.6; 43.6; 31.8; 30.7; 49.4; 13.6; 45.63; 35.89; 15.2; 69.8; 42.15; 11.33; 39.60; 21.49; 27.27; 78.7; 14.6; 18.52; 44; 34.63; 23.7; 42.7; 30.42; 38.7; 20.98; 32.16; 35.86; 47.15; 46.4; 17.5; 43.8; 11.5; 19.2; 19.1; 11.97; 29.11; 41.59; 27.01; 39; 26.8; 78.8
Maximum/(g·kg−1)78.8
Minimum/(g·kg−1)6.3
Average value/(g·kg−1)31.38
Standard deviation/(g·kg−1)14.90
Coefficient of variation/%47.47
Table 4. Response surface experiment design and results.
Experiment No.Pyrolysis Temperature A/°CPyrolysis Time B/minSoil Sample Mass C/gDiscrete Ratio DT
10−110.918189
21010.926607
310−10.949034
41−100.94676
50000.865316
6−10−10.866407
70000.867172
8−1−100.917608
90000.859884
100000.868839
110−1−10.89344
12−1100.986423
131101.00188
140000.904234
15−1010.958502
160111.0006
1701−10.951452
Table 5. ANOVA of the secondary model of response surface experiment.
SourceSquare SumDegree of FreedomMean SquareF-Valuep-ValueSignificance
Model0.036190.00421.640.0003**
A—Pyrolysis temperature0.001110.00116.120.0425*
B—Pyrolysis time0.008710.008747.080.0002**
C—Soil sample mass0.002610.002613.880.0074**
AB<0.00011<0.00010.25280.6305
AC0.003310.003317.670.004**
BC0.000110.00010.80190.4003
A20.005810.005831.320.0008**
B20.011810.011863.58<0.0001**
C20.000910.00095.040.0597
Residual0.001370.0002
Lack of fit<0.00013<0.00010.04340.9863
Net error0.001340.0003
Total variation0.037416
Note: ** is a highly significant effect at p < 0.01, and * is a significant effect at p < 0.05.
Disclaimer/Publisher’s Note: The statements, opinions and data contained in all publications are solely those of the individual author(s) and contributor(s) and not of MDPI and/or the editor(s). MDPI and/or the editor(s) disclaim responsibility for any injury to people or property resulting from any ideas, methods, instructions or products referred to in the content.

