Article

Frequency-Domain Collaborative Lightweight Super-Resolution for Fine Texture Enhancement in Rice Imagery

School of Information Engineering, Sichuan Agricultural University, No. 46, Xinkang Road, Ya’an 625014, China
*
Author to whom correspondence should be addressed.
These authors contributed equally to this work.
Agronomy 2025, 15(7), 1729; https://doi.org/10.3390/agronomy15071729
Submission received: 18 June 2025 / Revised: 7 July 2025 / Accepted: 15 July 2025 / Published: 18 July 2025
(This article belongs to the Collection AI, Sensors and Robotics for Smart Agriculture)

Abstract

In rice detection tasks, accurate identification of leaf streaks, pest and disease distribution, and spikelet hierarchies relies on high-quality images to distinguish between texture and hierarchy. However, existing images often suffer from texture blurring and contour shifting due to equipment and environment limitations, which affects the detection performance. In view of the fact that pests and diseases affect the whole situation and tiny details are mostly localized, we propose a rice image reconstruction method based on an adaptive two-branch heterogeneous structure. The method consists of a low-frequency branch (LFB) that recovers global features using orientation-aware extended receptive fields to capture streaky global features, such as pests and diseases, and a high-frequency branch (HFB) that enhances detail edges through an adaptive enhancement mechanism to boost the clarity of local detail regions. By introducing the dynamic weight fusion mechanism (CSDW) and lightweight gating network (LFFN), the problem of the unbalanced fusion of frequency information for rice images in traditional methods is solved. Experiments on the 4× downsampled rice test set demonstrate that the proposed method achieves a 62% reduction in parameters compared to EDSR, 41% lower computational cost (30 G) than MambaIR-light, and an average PSNR improvement of 0.68% over other methods in the study while balancing memory usage (227 M) and inference speed. In downstream task validation, rice panicle maturity detection achieves a 61.5% increase in mAP50 (0.480 → 0.775) compared to interpolation methods, and leaf pest detection shows a 2.7% improvement in average mAP50 (0.949 → 0.975). This research provides an effective solution for lightweight rice image enhancement, with its dual-branch collaborative mechanism and dynamic fusion strategy establishing a new paradigm in agricultural rice image processing.

1. Introduction

High-resolution rice images can accurately present key information during crop growth, such as the number of grains as well as disease characteristics, details that are critical to rice yield and quality. Based on these high-definition images, artificial intelligence methods can quickly and accurately detect pests and diseases [1,2] and provide timely decision support for agricultural management. High-definition images not only provide rich features but also enhance key details more effectively, helping to recognize difficult microstructures and improve the accuracy of image analysis [3,4]. However, the process of rice image acquisition often leads to image quality degradation in the form of blurriness, loss of details, and resolution degradation due to the performance limitations of imaging equipment, imaging environmental factors, and other issues. This detail information is crucial for the accurate identification of pests and diseases, as shown in Figure 1, the key parts of the rice spike and leaves, and the loss of details will directly affect the identification accuracy. Therefore, enhancing the details in rice images and effectively resisting the noise provides a high-precision image preprocessing solution for rice phenotyping and disease inspection.
High-resolution imagery is critical in agricultural decision-making [4,5]. In pest management, it clearly shows tiny pests or eggs on leaves, helping early precision prevention and control and reducing pesticide use. In yield estimation, it analyzes the details of rice spikes through high-resolution imaging, providing data support for accurate yield estimation. In addition, it helps to monitor crop growth conditions and detect disease or nutritional deficiency problems in time for fine management. These applications enhance the practical value and interdisciplinary significance of this study.
In recent years, deep-learning-driven image processing techniques have shown significant advances, among which convolutional neural network (CNN)-based methods have demonstrated unique advantages in the processing of high-frequency information in images [6,7]. CNN can efficiently extract the local texture and edge features of an image through a multilayer convolutional structure, and their parameter sharing mechanism and hierarchical feature extraction capability make them perform. Its parameter-sharing mechanism and hierarchical feature extraction capability make it excel in detail-recovery tasks. However, due to the limitation of local sensory fields, CNN is difficult to model global dependencies across regions, which leads to obvious deficiencies in the global contextual understanding of low-frequency information. In contrast, the Transformer-based [8] model achieves the modeling of global dependencies through the self-attention mechanism [9,10], and its theoretical receptive field can cover the whole map range, which has a significant advantage in the integration of low-frequency information (e.g., light distribution and overall structure). However, this global focus characteristic also leads to its lack of sensitivity to local high-frequency details (e.g., texture mutation regions), and the Transformer model has a systematic flaw in its ability to capture the spectrum of high-frequency components. In order to balance the advantages of the two architectures, hybrid models such as TCSR [11] try to combine the local feature extraction module of CNN with the global attention of the Transformer, but experiments show that it still suffers from insufficient adaptation during channel feature fusion, leading to artifacts or blurring when high-frequency details are recovered.
As shown in Figure 2, the low-frequency information of an image usually carries global structural information (e.g., object contours and large color blocks), while the high-frequency information is closely related to detailed features (e.g., texture, edges, and noise) [12]. Current image restoration methods still have significant limitations in coping with such differences in frequency-domain characteristics: existing frameworks mostly adopt fixed-weight frequency-domain processing strategies [13,14,15,16,17], which are difficult to adapt to the dynamic demands of different degradation types (e.g., motion blur vs. noise overlay) and degradation levels (e.g., mild blur vs. severe blur). In super-resolution scenes where high-frequency information is severely lost, traditional methods tend to neglect the directional enhancement of high-frequency components, resulting in detail blurring in the reconstructed image; while in denoising tasks where the low-frequency structure is intact, over-smoothing operations destroy the global continuity that should be preserved [18]. The root of this contradiction can be traced back to the inherent frequency-awareness bias of deep models: although convolutional neural networks can effectively capture high-frequency details through the local receptive field, their translational invariance and local correlation properties limit their ability to model the global structure. In contrast, Transformer excels at low-frequency global modeling by virtue of its self-attentional mechanism, but its computational complexity has a significant negative correlation with the accuracy of high-frequency detail restoration. However, its computational complexity and high-frequency detail recovery accuracy are significantly negatively correlated. The CNN-based recovery network has the defect of limited effective sensing field, while the standard the Transformer [8] is difficult to be practical due to the secondary computational complexity; although MambaIR [19] overcomes these two types of problems to some extent through the improved Mamba [20] architecture, its inference speed is still insufficient.
In rice image restoration, low-frequency information, such as global leaf region stripe and pest distribution, and high-frequency information, such as detail region rice spike hierarchy, are coordinately associated, which together constitute the complete image features, and the existing restoration methods often neglect this coordinated connection, resulting in texture blurring and contour offset problems. Relevant studies have shown that the potential of image processing can be fully exploited through the dual-branch multi-frequency structure. For example, methods such as DB-MFENet [21] and SMFANet [22] effectively improve the performance of the model by enhancing the low-frequency and high-frequency features separately through frequency division processing. By decomposing image features into low-frequency and high-frequency parts and enhancing them separately, this structure can fully utilize both global and local information, thus achieving better image processing results. In order to solve the above problems, a lightweight module for adaptive dynamic feature adjustment is proposed in this paper. The module optimizes the global and local information through low-frequency and high-frequency branches, respectively, and combines the dynamic adaptive fusion method with the feedforward network to realize the precise fusion of information and the dynamic adjustment of frequency so as to achieve high-quality image reconstruction.
The main contributions are as follows:
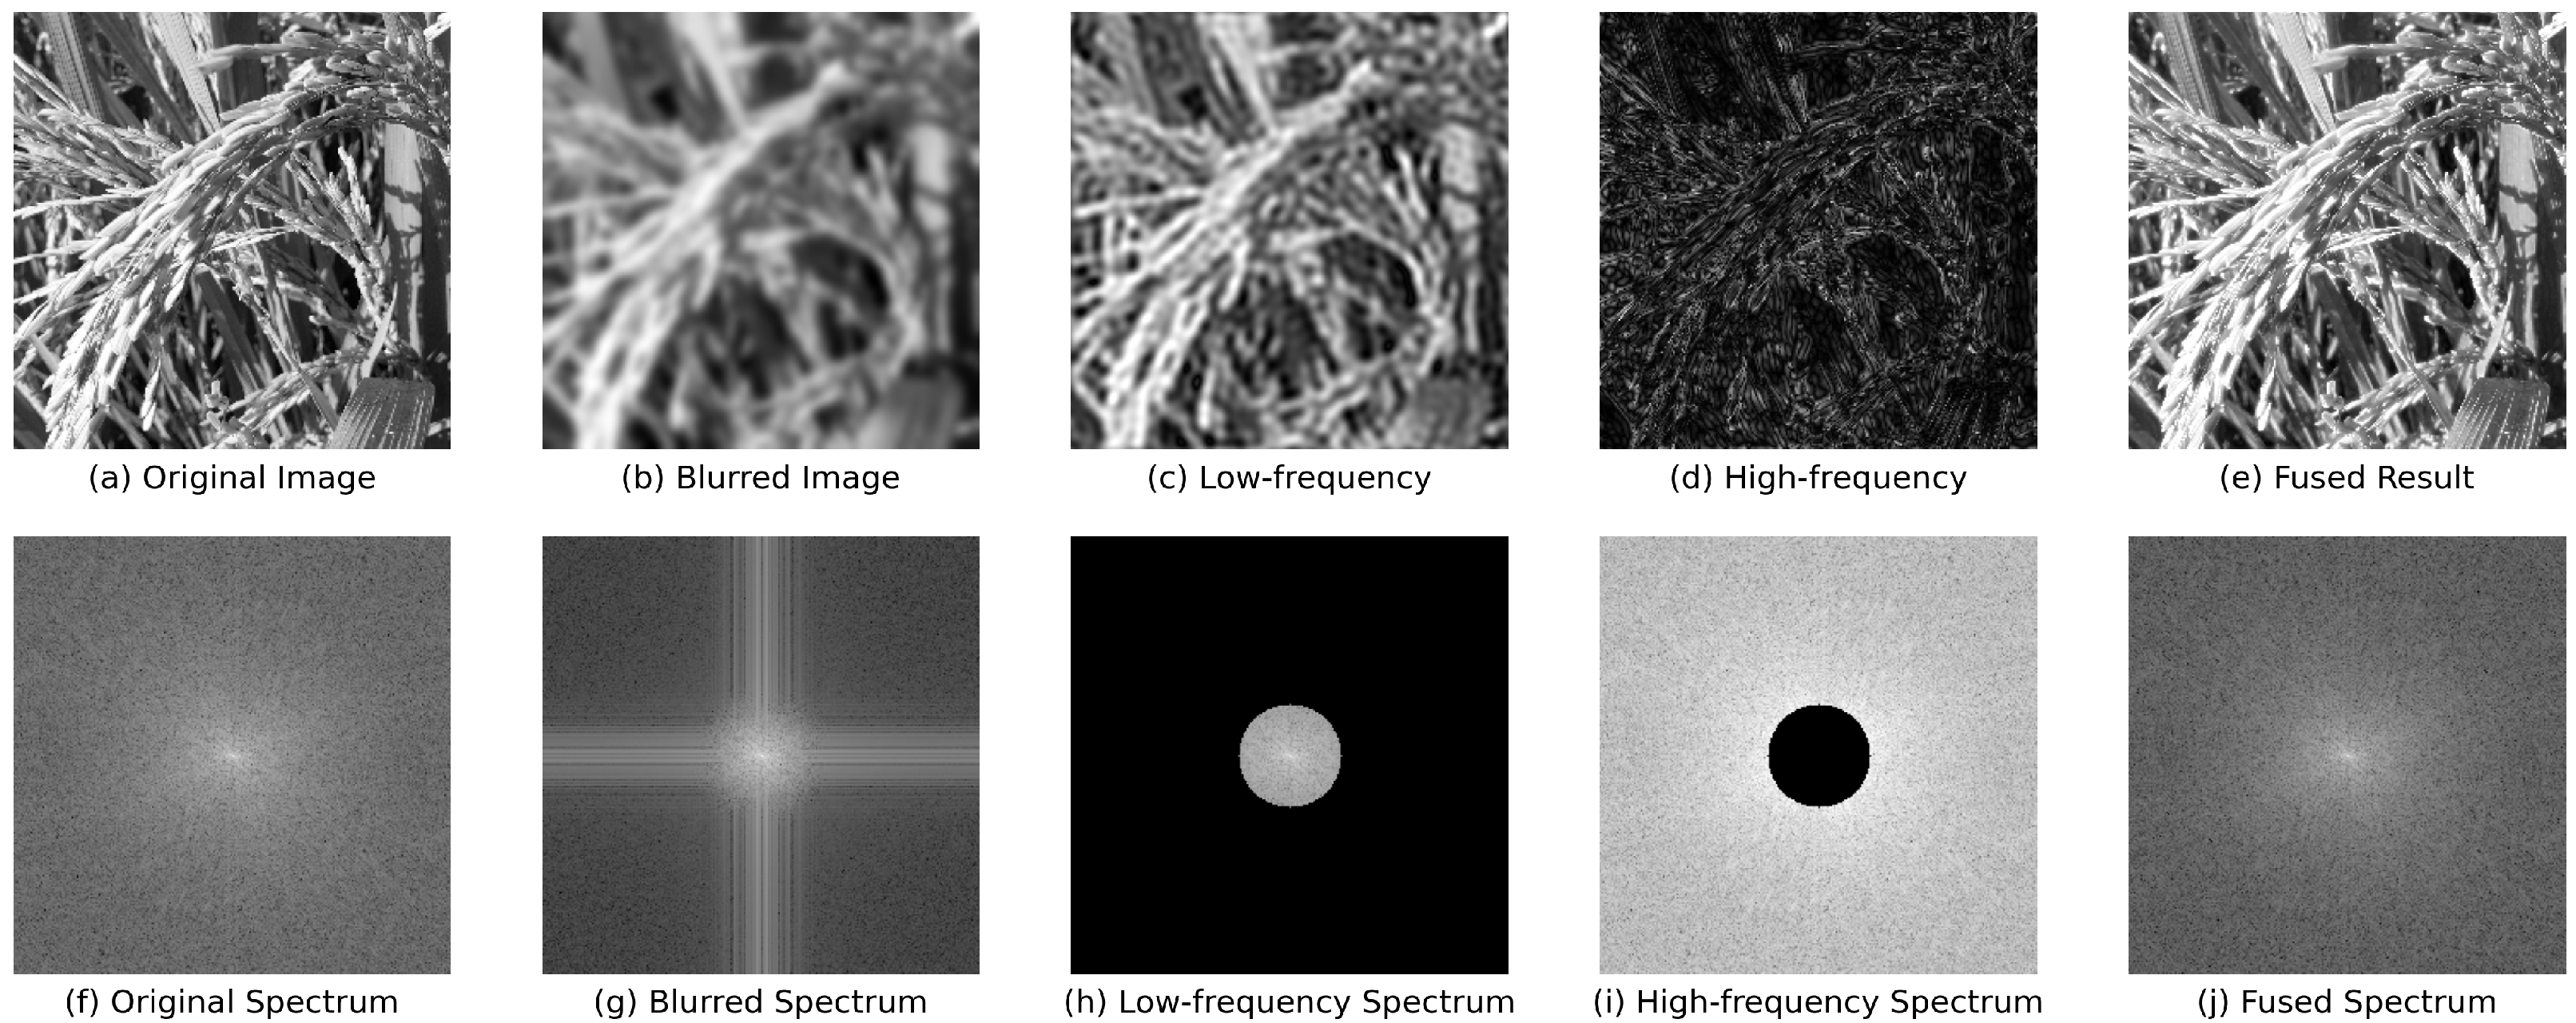
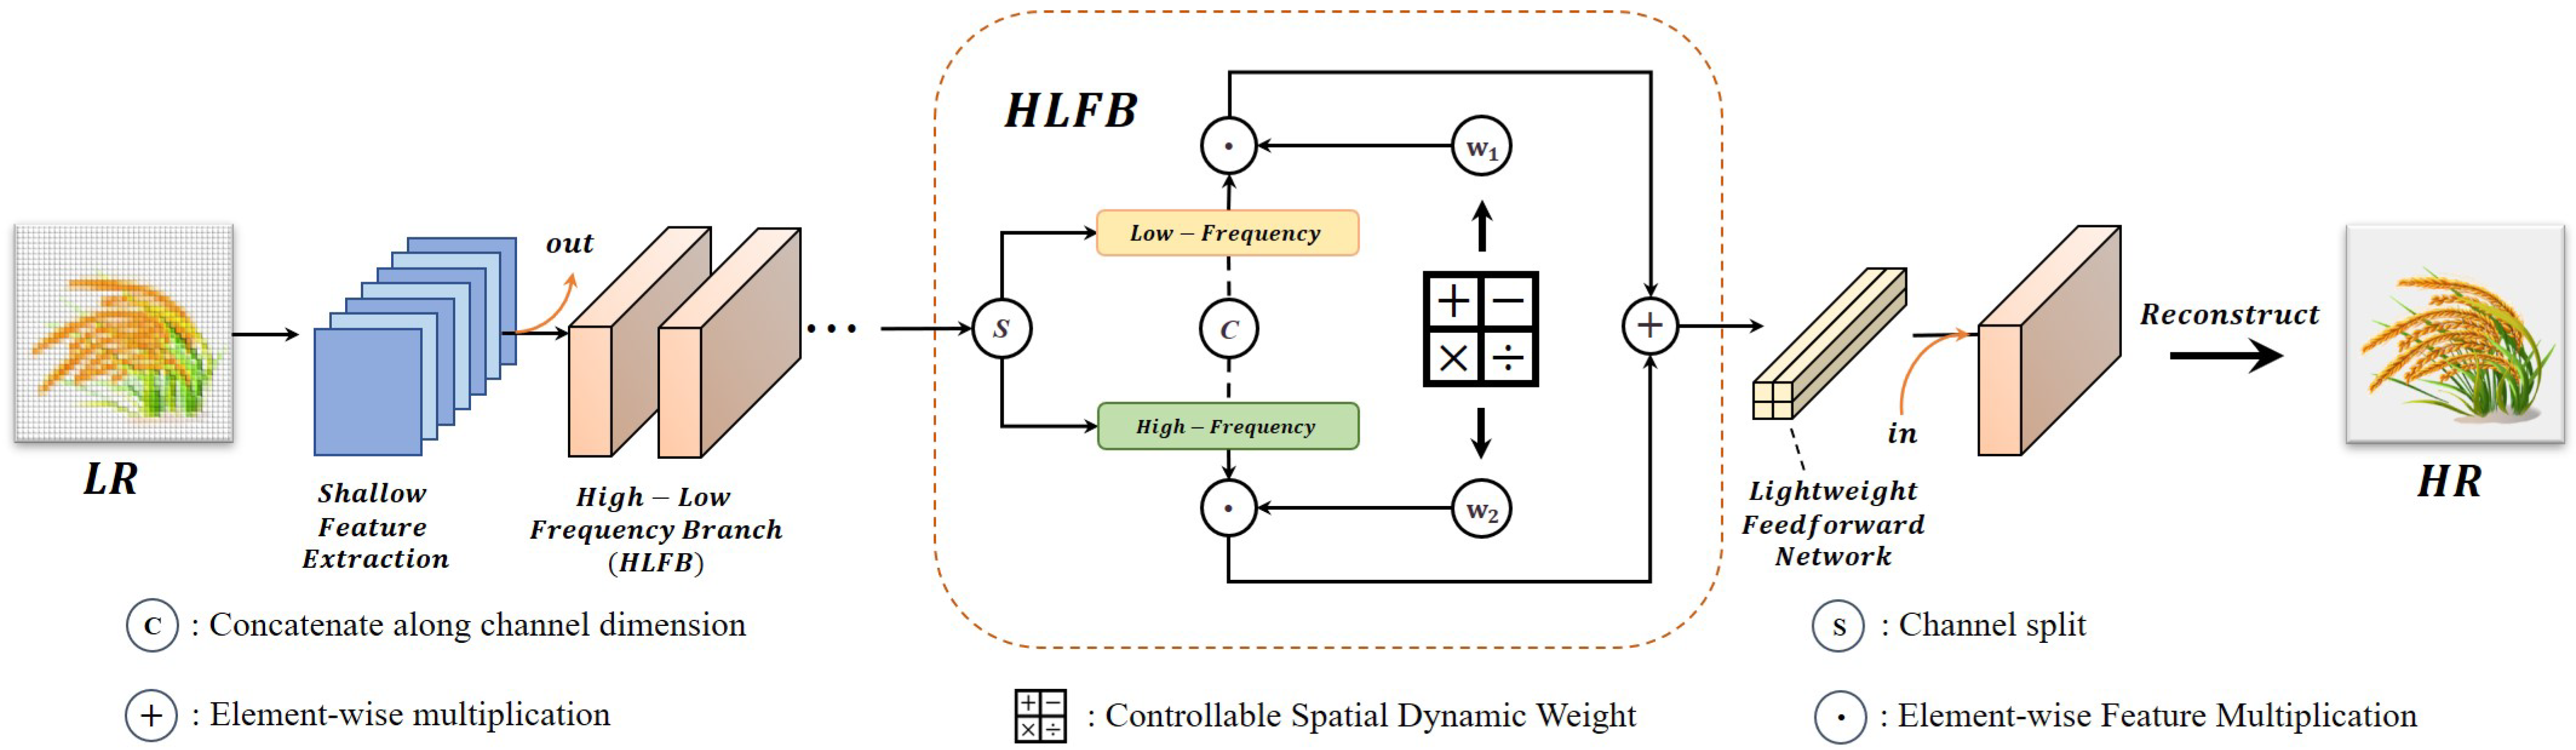
  • We propose an efficient LHFB module that divides the super-resolution processing of an image into two branches: the low-frequency branch is used to capture the overall structural information of the image, while the high-frequency branch focuses on reconstructing the details for more accurate image restoration.
  • We propose the degradation-aware dynamic weight fusion module (CSDW) and lightweight feedforward network (LFFN) to adaptively adjust the high-frequency and low-frequency fusion ratios based on the degradation characteristics.
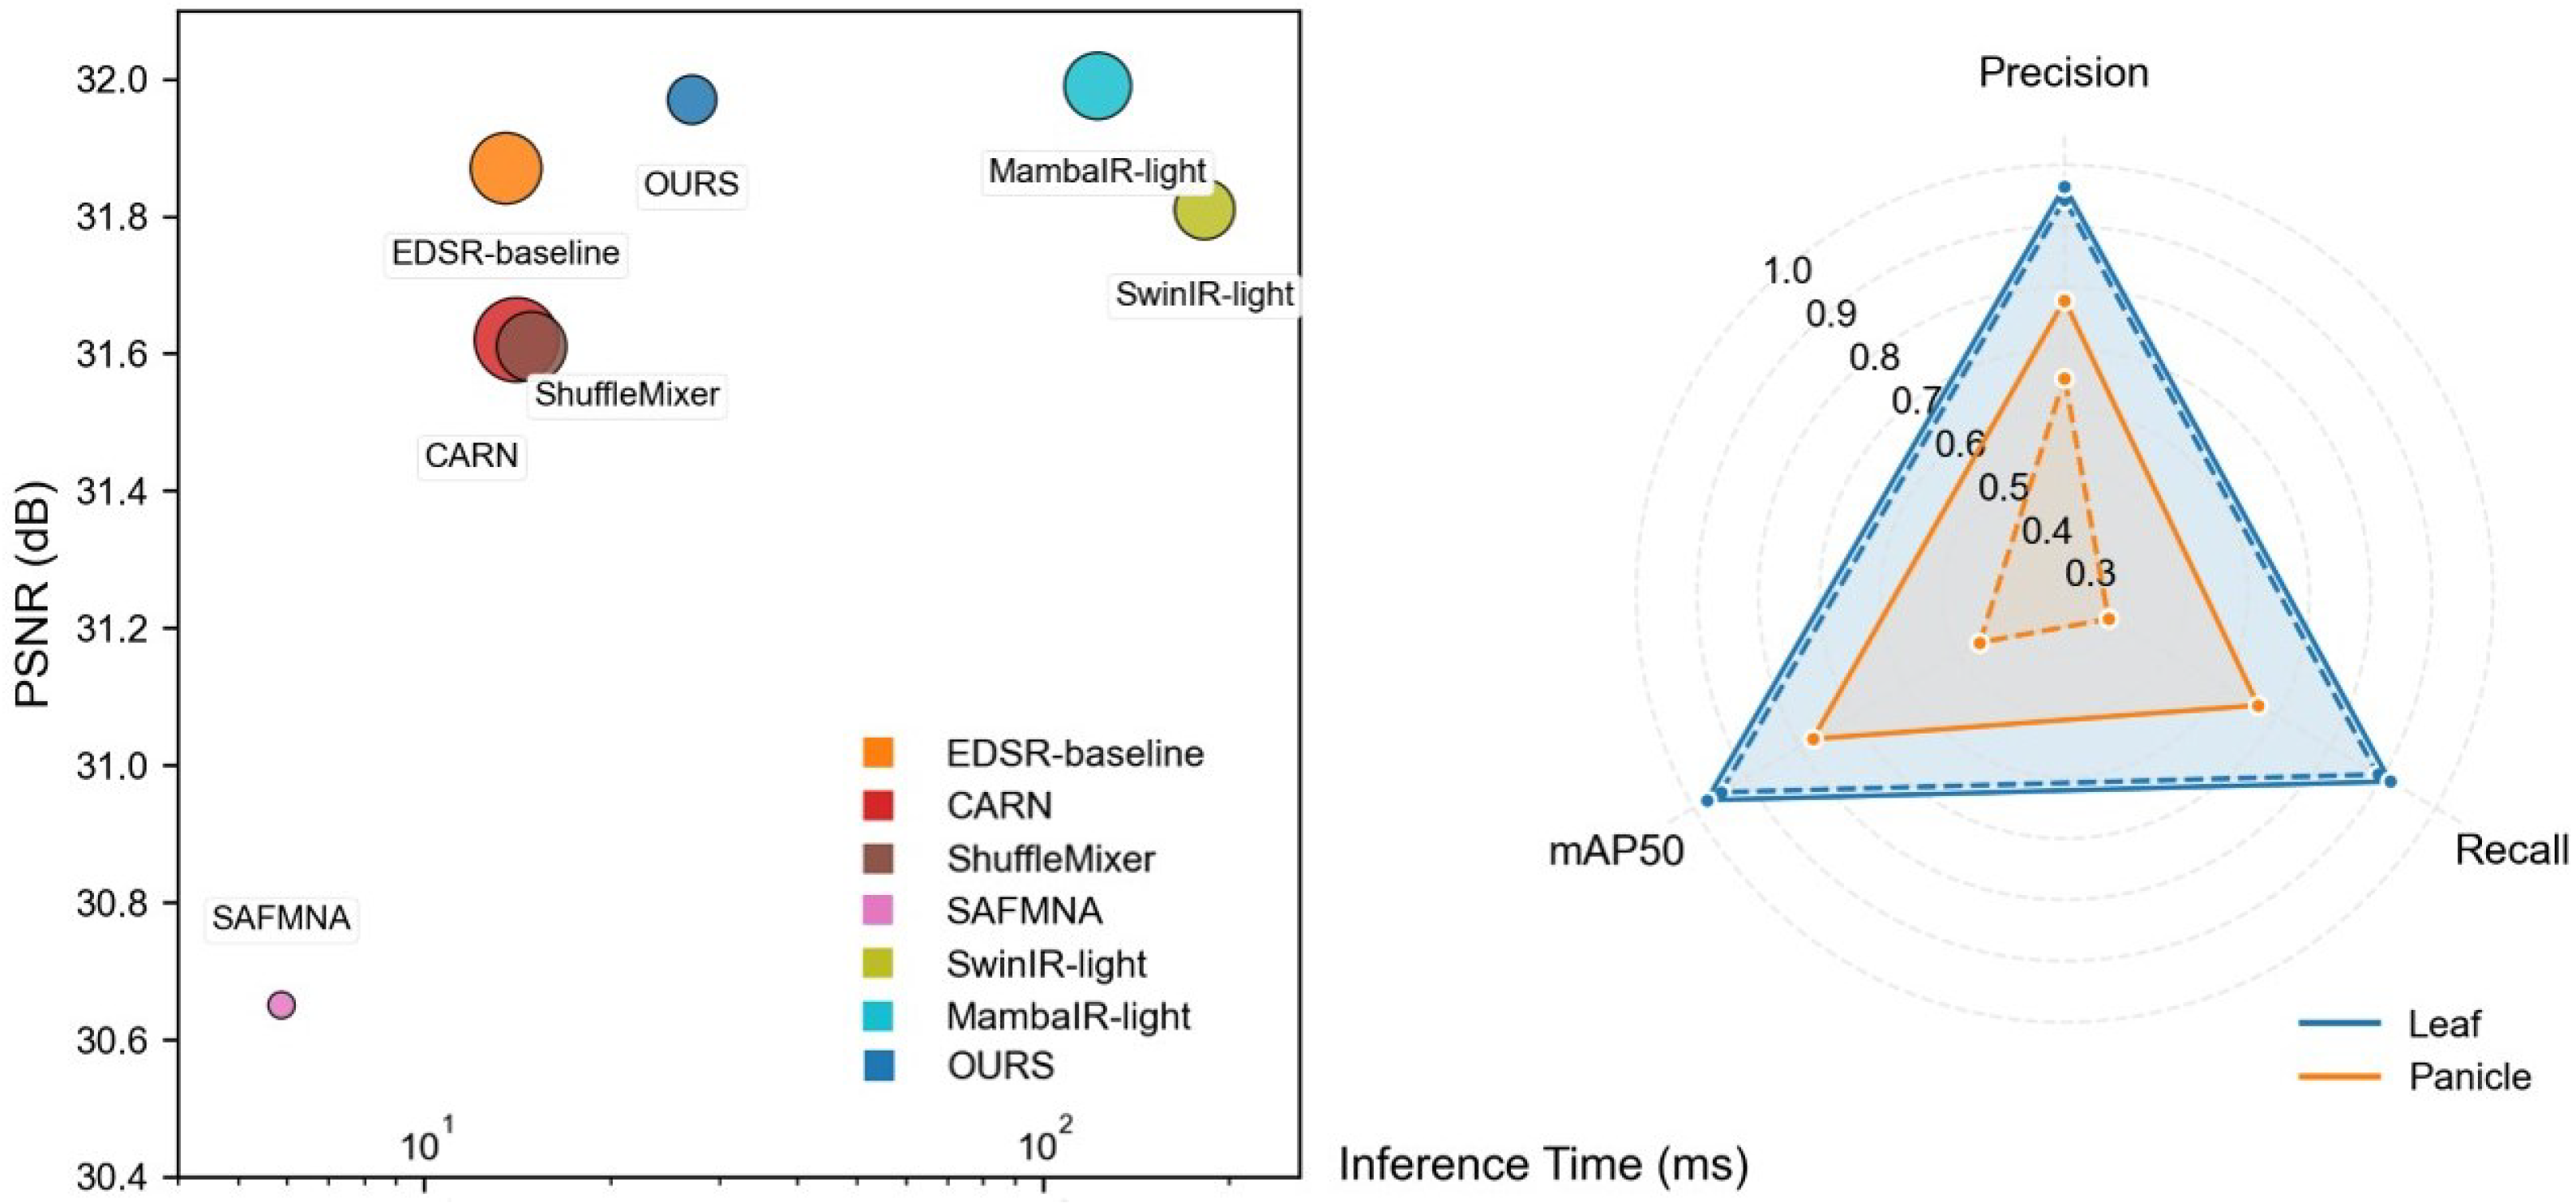
  • We quantitatively and qualitatively evaluate our proposed ADFSR on datasets and show that our approach strikes a good balance between model complexity and reconstruction performance. The good performance in the downstream inspection task can be observed, as shown by Figure 3.

2. Materials and Methods

2.1. Degenerate Modeling Training Set Design

The datasets for this study are obtained from the publicly available Kaggle platform, covering two datasets, Rice Diseases Image Dataset [23] and Rice Plant Dataset [24]. The Rice Diseases Image Dataset contains 3355 images for detecting and categorizing four rice leaf diseases, while the Rice Plant Dataset contains 1000 high-definition rice images, aiming to provide high-quality image resources for research. In the study, we screened 2100 high-definition images from these two datasets as the training and validation datasets after removing blurred and artifacted images based on the characteristics of leaves and rice ears. Meanwhile, in order to comprehensively evaluate the model performance, we further selected 16 rice spike disease images, 40 rice leaf disease images, and 34 images of healthy rice leaves and spikes (Rice_Panicle, Rice_Leaf, and Rice_Healthy), which constitute the test dataset, as shown in Figure 4. The experiment was conducted from August 2024 to March 2025, with the experimental data preparation carried out from August to December 2024.
In this study, the original rice image dataset was carefully selected to ensure that the selected images were clear and of high resolution in order to construct a multi-resolution dataset and a Gaussian noise dataset suitable for super-resolution experiments. During image preprocessing, we screened and enhanced the original dataset. Specifically, we excluded blurry images and images with more clutter to ensure the quality and consistency of the dataset. In addition, during training, enhancement operations such as random cropping, random rotation, and horizontal flipping were performed on the training set images to increase the diversity and robustness of the dataset. The dataset covers the training, validation, and test sets, where the test set is further subdivided to specifically classify the image blurring status, leaf details, and local features of the rice spike in order to comprehensively evaluate the model performance. The preprocessing steps are as follows: first, to ensure that the image size meets the downsampling requirements, when the image size is not divisible by the downsampling multiples (2×, 3×, and 4×), we adopt the mirror expansion method to symmetrically fill the image or symmetrically crop the image so as to ensure the smooth implementation of the subsequent downsampling operations. Next, we downsample the resized image to generate datasets with different resolutions, and the downsampling process adopts the double-triple interpolation method to ensure the image quality. In addition, in order to simulate the image noise in the real scene, we generated samples to add Gaussian noise: the specific operation is to generate the same size as the image noise matrix, the noise obeys the normal distribution with the mean value of 0 and the standard deviation of 15, and then we add the noise matrix with the original image to obtain the noise-added image, which is used to evaluate the performance of the model in the noise environment.

2.2. Downstream Mission Datasets Description

As shown in Figure 5, the two key downstream task datasets used in this study and their super-resolution requirements are as follows: the Rice Disease Detection Dataset [25] contains 6715 training images for accurate identification of rice bacterial leaf spot, brown spot, and leaf mold. Bacterial leaf spot leaves show watery spots, brown spots reduce photosynthetic efficiency, black spots of leaf mold are degraded at multiple scales, low-frequency areas of large-scale spots are degraded with fuzzy edges, and detailed areas of small-scale spots are susceptible to texture loss [26]. The accuracy of this dataset depends on the morphological integrity and color fidelity of the rice spike and is susceptible to frequency-domain aliasing and structural distortion at a low resolution.

3. Proposed Method

As shown in Figure 6, in this study, we propose a lightweight adaptive fusion dynamic frequency super-resolution network for efficient rice image recovery through high-frequency–low-frequency feature decoupling and dynamic fusion strategy. In this section, we first introduce the preliminaries of state space models, followed by an overview of our proposed ADFSR. We then delve into the details of the HLFB module, including its LFB with DMSOP and lightweight attention mechanisms, and HFB with dynamic scaling factor σ . We subsequently discuss the degradation-aware dynamic weight fusion module. Finally, we present the specifics of the multi-level HLFB and feature fusion through cascaded residual connections and the efficient upsampling via subpixel convolution.

3.1. Degeneration-Aware Image Restoration Analysis

Image degradation in an image restoration task refers to the process of degradation from an original clear image Q to a low-quality image Y, which usually manifests itself as blurring, noise, low resolution, or distortion. Its degradation model can usually be expressed as
Y = Q H + N
where Y is the degraded image, H is the fuzzy kernel, ⊛ is the convolution operation, and N is the additive noise.
In the frequency domain, the degradation process of an image can be converted to a frequency-domain expression by Fourier transform:
F Y = F H · F Q + F N
where F · represents the Fourier transform, F ( Y ) and F ( Q ) represent the frequency domain representation of the degraded image and the original image, respectively, F ( H ) represents the representation of the fuzzy kernel in the frequency domain, and F ( N ) represents the representation of the fuzzy kernel in the frequency domain.
As shown in Figure 2, in the frequency domain of an image, the low-frequency components reflect the global structure, while the high-frequency components carry details and textures. During degradation, low frequencies are more stable, and high frequencies are easily lost, which makes it necessary to balance global and local information during recovery. It is important to decouple the low and high frequencies and process them separately: the low-frequency branch reconstructs the structure, and the high-frequency branch recovers the details, thus improving the recovery quality. Given the differences in the degradation degree of different images, a fixed fusion ratio is difficult to meet the demand. The adaptive dynamic fusion mechanism proposed in this paper can flexibly adjust the contribution ratio of high and low-frequency information according to the degradation characteristics so as to adapt to diversified recovery needs. Setting the adaptive weights of the low-frequency and high-frequency branches as W L and W H , the frequency-domain representation of the recovery process is as follows:
The low-frequency global structural enhancement branch is as follows:
Q L i = f L i y i
The high-frequency localized detail enhancement branch is as follows:
Q H i = f H i y i
where f x i denotes the current recovery function of the ith layer, and Q L i and Q H i denote the recovery feature of the current layer and the current input. In order to avoid interfering with shallow feature learning and to control the complexity, dynamic adjustment is introduced only in the last two layers.
The frequency-domain feature adaptive fusion unit is as follows:
f Q i = w L i · f Q L i + W H i · f Q H i

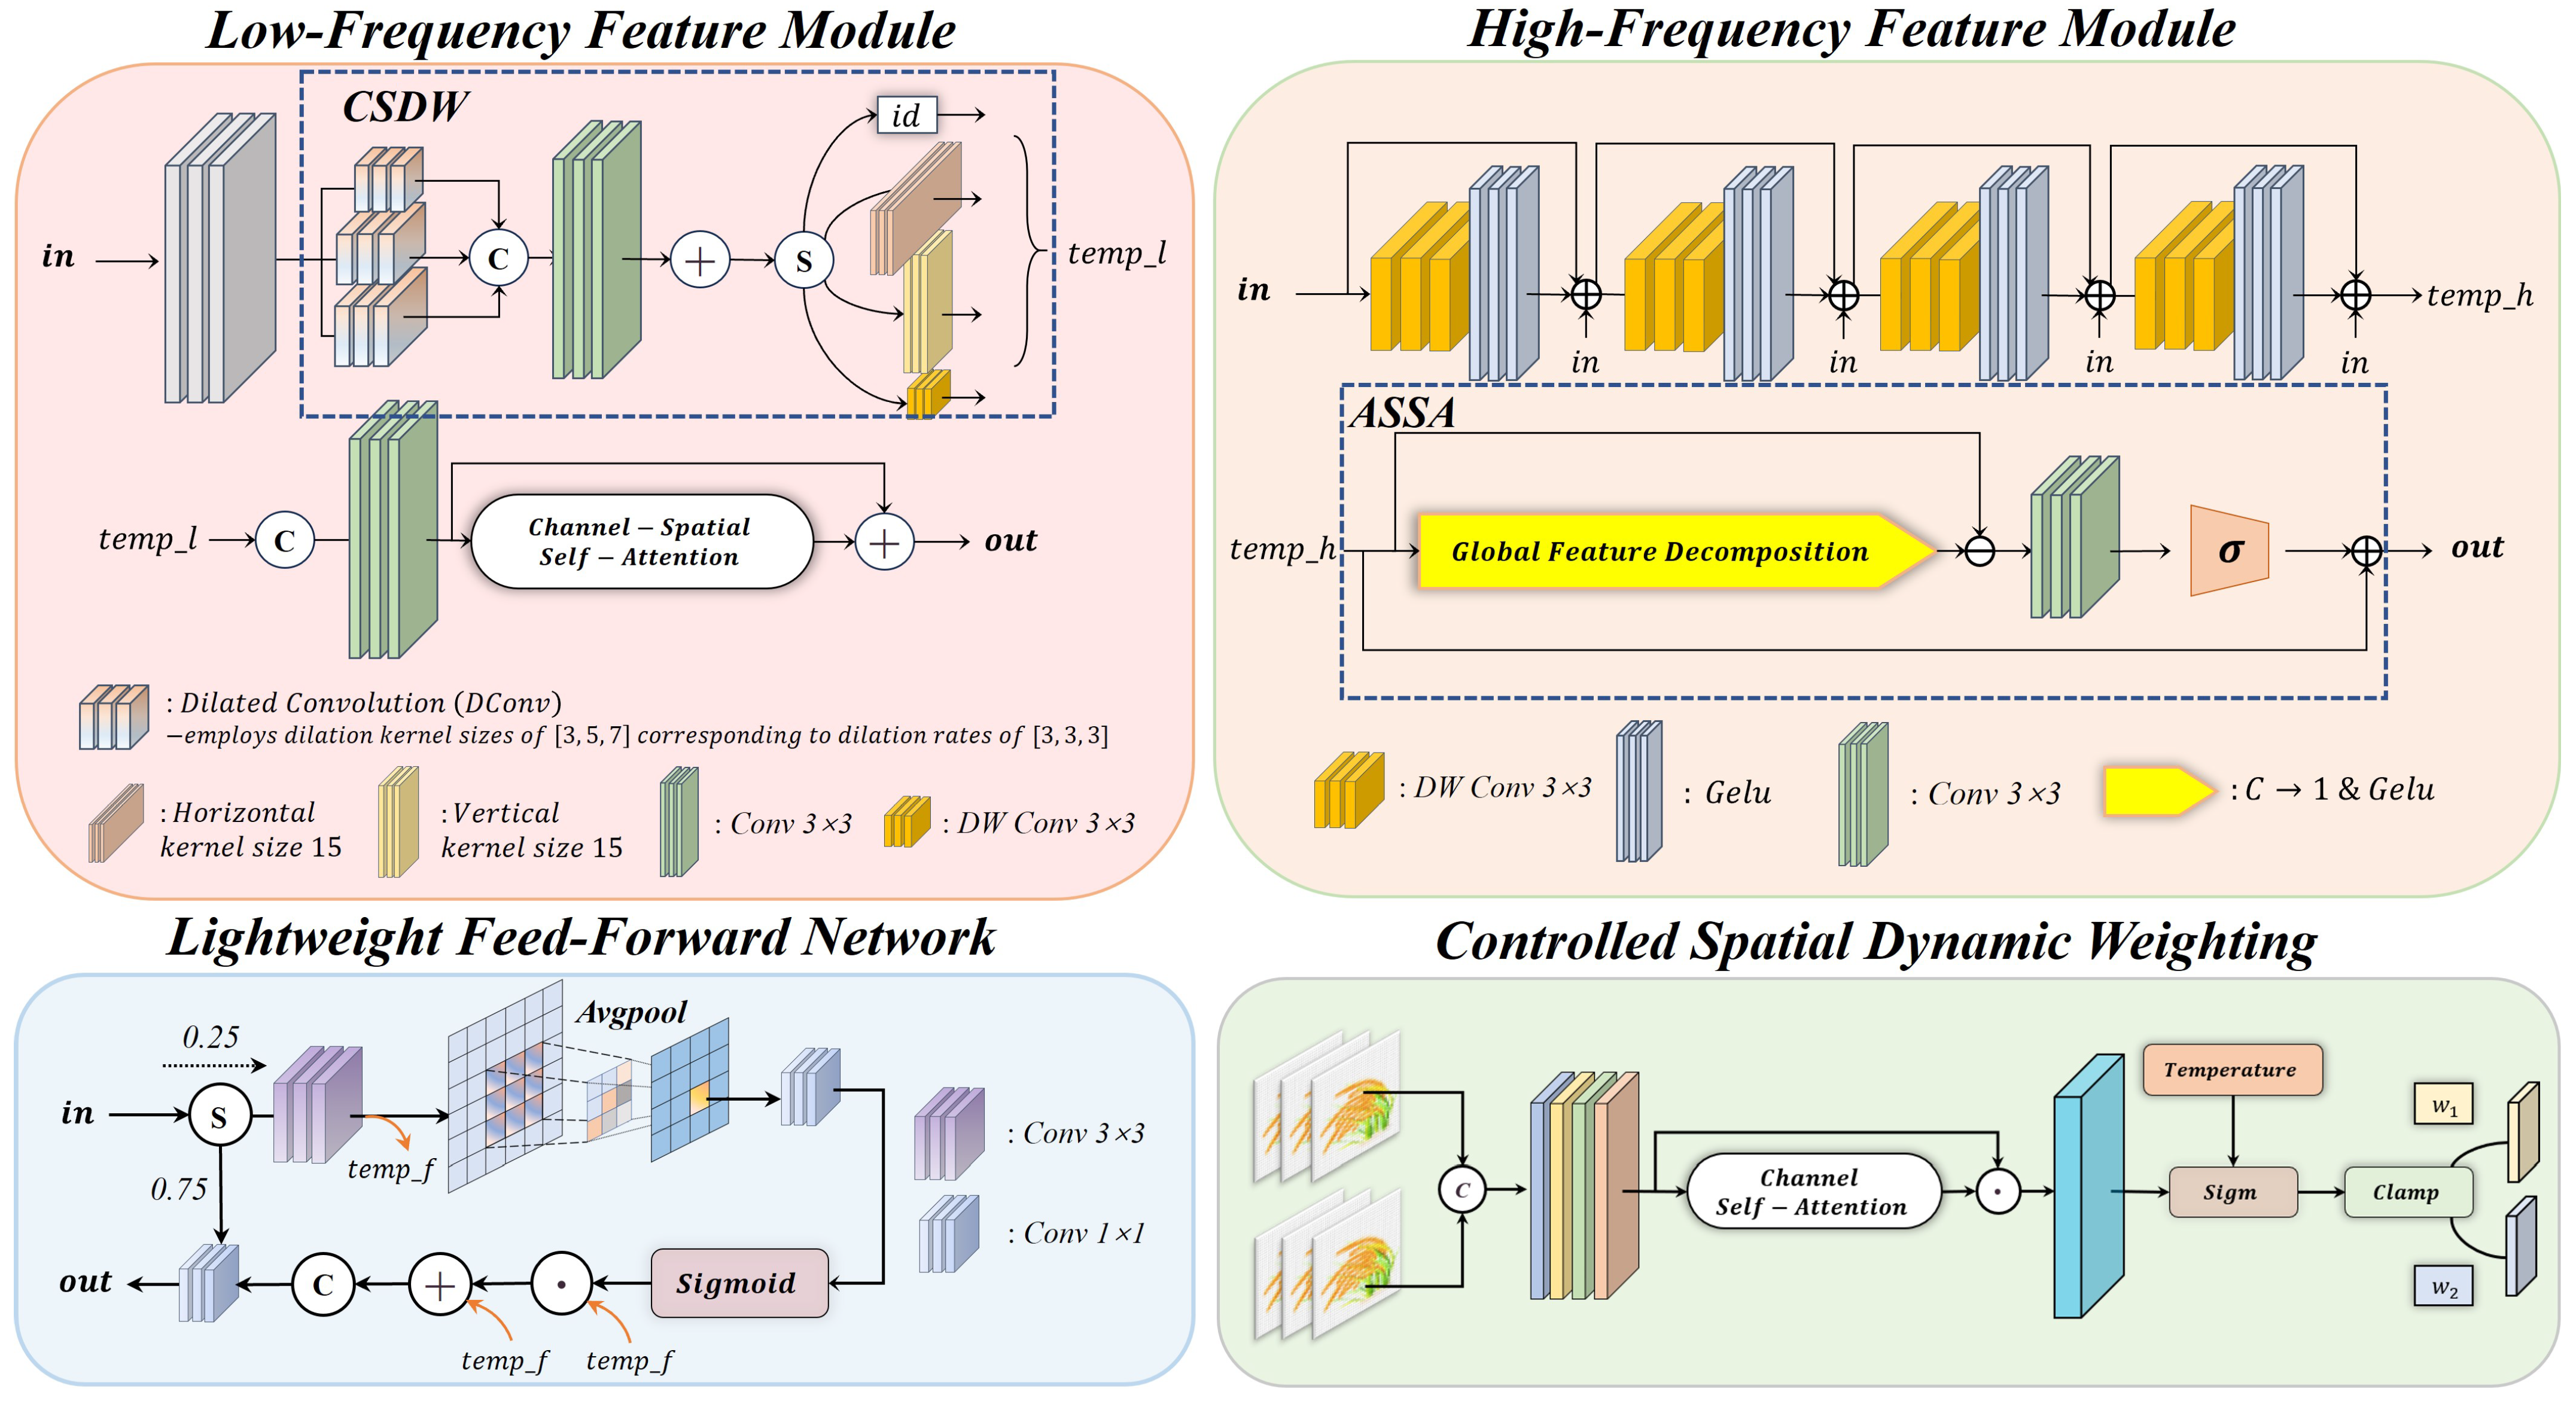
3.2. Low-Frequency Feature Module

The rice spike and rice leaf texture arrangement has obvious vertical horizontal structure, which is critical for global image recovery, and neglecting it will lead to loss of details [27]. As shown in Figure 7, We use depth-separable convolution and stripe convolution to design the DMSOP module, which realizes multi-scale directional feature extraction through parallel branching, effectively enlarges the receptive field, and captures the striped texture while significantly reducing the number of parameters.
F d k = ϕ C o n v 1 × 1 D C o n v I x
where ϕ denotes the GELU() activation function, and the input feature map x is processed through three parallel expansive convolutional branches, each with a different size of convolutional kernel k (3, 5, and 7, respectively) and the same null rate d = 3.
The fused feature maps are segmented according to a predefined channel ratio, where 25% of the channels are processed by depth-separable convolutions designed for square regions, horizontal and vertical directions, respectively, to obtain the orientation-sensitive features F h w , F h , and F w :
F h w , F w , F h = D W c o n v k 1 , k 2 x h w , x w , x h
where D W C o n v denotes the depth separable convolution operation, k is the bar convolution kernel size, and X h w , X w , and X h are the sub-feature maps obtained by pre-partitioning according to the channel scale, respectively. The unallocated part x i d is spliced with the above three directional features in the channel dimension to form the final DMSOP output:
F D M S O P = C o n v c o n c a t X i d ; X H W ; X W ; X H + X
In order to suppress low-frequency noise and strengthen the key structure, the channel-statistical attention module is introduced. The channel attention uses the mean m and standard deviation u to calculate the channel weights and enhance the expression of important features, and the spatial attention uses the global mean pooling and global maximum pooling to extract the significant regions.

3.3. High-Frequency Feature Module

In agricultural image analysis, local details are crucial, such as features like rice spike stratification and leaf color change, which are important for accurate identification of crop health and yield prediction. To this end, as shown in Figure 7, the DMSOP module contains two core components: high-frequency enhancement with detail-scale enhancement and adaptive modulation. This branch contains two core modules: densely connected high-frequency enhancement with detail-scale enhancement and adaptive modulation. Inspired by the literature [28], the high-frequency information of an image mainly contains edge and texture details. In order to accurately focus the local information, a lightweight local feature extraction module is proposed, which combines a small convolutional kernel and dense connections to enhance local details. The process is as follows:
X n = ϕ D W C o n v X n 1 + i = 0 n 1 X n i 1
where ϕ denotes the GELU() activation function. i = 0 n 1 x n i 1 denotes the sum of all outputs from layer n−1 to layer 0, forming a residual join. A dense connection is formed, and there are only four layers in this paper.
Although the densely connected structure can enhance the local high-frequency information, the low-frequency background may still affect the learning of high-frequency features, and for this reason, we design a scale-adaptive modulation (ASSA) with low-frequency suppression. A single-channel global structural information map is generated by a 1 × 1 convolution and the high-frequency components extracted using this attention map.
H = X 4 ϕ C o n v X 4
The enhanced high-frequency residuals are obtained by dynamically adjusting their magnitude through a learnable scaling factor δ . Finally, the enhanced high-frequency residuals are summed with the original multilevel residual features, and feature fusion is performed through a depth-separable convolutional block:
F Q H = X 4 + H ^
where H ^ = δ H.

3.4. Dynamic Weight Generation and Lightweight Feedforward Networks

Dynamically balancing global and local features is crucial when dealing with rice images. This allows better attention to detail loss and global features and solves the fusion imbalance problem. During the feature fusion process, the traditional static weighting approach fails to adapt to the changes of different frequency information. For this reason, we introduce a dynamic weight generation module to adaptively adjust the contributions of high and low-frequency components. The module first splices the features from the high-frequency branch and the low-frequency branch in the channel dimension to form the fusion features of [B, 2C, H, W] and then outputs the base weight map after a series of depth-separable convolutions and point-by-point convolutions, W b a s e R 2 C × H × W , and generates the weights for the low-frequency and the high-frequency channel blocks using the learnable temperature coefficients, τ initialized to 0.5, and the Sigmoid activation function, respectively:
W L = σ W s : c , : , : τ
W H = σ W s c : , : , : τ
where w s is the augmented w b a s e .
We introduce this dynamic weight generator only in the last two layers of the network to avoid interfering with the shallow feature extraction process while finely tuning the fusion of high-frequency and low-frequency information in the deepest layer so as to efficiently recover the image details while maintaining the stability of the global structure.
Feedforward networks play the role of nonlinear transformation and channel mixing in deep networks. However, traditional FFNs have high computational complexity [8,29] and may incur large computational overhead especially in high-resolution tasks. Inspired by [22,30], we propose the grouped lightweight fusion feedforward network (LFFN) to reduce the computational cost and enhance the feature expression through channel grouping and attention mechanism.

4. Experimental Results

Dataset and Evaluation. According to the previous (e.g., [13,22]) work setup, this study evaluates the gain effect of image restoration algorithms and agricultural detection tasks by constructing a multi-source heterogeneous dataset system, and Rice_Panicle, Rice_Leaf, and Rice_Healthy (the test set has no task intersections with the training set) are used as the test set to evaluate the algorithms’ performance in the downstream tasks. We choose rice pest and disease data and rice spike maturity detection, randomly select 200 images from the test dataset for downsampling reasoning to mimic the image degradation problem in natural environments, and use the yolov8 [31] model for training and testing. Subjective comparison plots for the experimental part of the experiment are used, all from the test set.
During the model training, we randomly crop the size to 64 × 64 and randomly horizontally flip and rotate the LR image as the basic training input. The proposed model is trained using the same loss function as SAFMN [13] (L1 pixel loss weight 1.0 + FFT frequency domain loss weight 0.05) and optimized by Adam [32] with β 1 = 0.9 and β 2 = 0.99. We set the initial learning rate to 0.001 and the minimum learning rate to 0.00001, and this training configuration uses a segmented learning rate decay strategy (MultiStepLR scheduler that scales down the learning rate by 50% at 250 K, 450 K, 550 K, and 575 K iterations), and the number of iterations for all experiments is set to 600,000. All experiments are performed on NVIDIA GeForce RTX 4090 GPU using the PyTorch 3.9 framework.

4.1. Assessment of Indicators

4.1.1. Quantitative Comparison with Other Methods

To comprehensively evaluate the performance advantages of this method, we designed rigorous cross-architecture comparison experiments: under the same training set and training strategy conditions, we systematically compared six classes of representative lightweight super-resolution models, including the CNN-based CARN [7] with EDSR [15], the hybrid architectures ShuffleMixer [14] and SAFMN [13], the vision-based Transformer’s SwinIR-light [9], and the latest Mamba architecture improved MmbaIR-light [19]. The comparison framework covers the three core design paradigms of convolution, the self-attention mechanism, and state-space modeling to ensure the comprehensiveness and fairness of the evaluation results.
In this study, we quantitatively evaluated the number of parameters and computational complexity of the super-resolution model at ×2/×3/×4 magnification factors with the profile library at a low-resolution input of 1280 × 720 pixels. As shown in Table 1, in the tests adopted by our method, 4× our proposed method (Ours) with a 575 K number of parameters and 30 G FLOPs of computational cost on the Rice_Panicle, Rice_Healthy and Rice_Leaf datasets reaches 30.31/0.8617, 30.73/0.8432, and 31.97/0.8369 (PSNR/SSIM) metrics, achieving optimal or near-optimal recovery quality while significantly reducing model complexity.

4.1.2. Memory and Runtime Comparison

In this study, the significant advantages of the proposed method in terms of computational efficiency and memory consumption are verified through comparative experiments. When 4× super-resolution processing is performed, the G P U M e m column in the table represents the maximum GPU memory consumption recorded during the inference phase, and the relevant data are obtained by calling the torch. cuda max memory allocate function under the Pytorch framework. The A v g . T i m e column represents the average runtime measured on 500 randomly generated low-resolution (LR) images of size 320 × 180 pixels. Table 2 shows that the proposed method achieves significant reductions in both GPU memory consumption and runtime compared to traditional CNN methods (e.g., EDSR and Kahn) and lightweight methods (SwinIR-light and MambaIR-light) while demonstrating a better performance balance compared to ShuffleMixer.

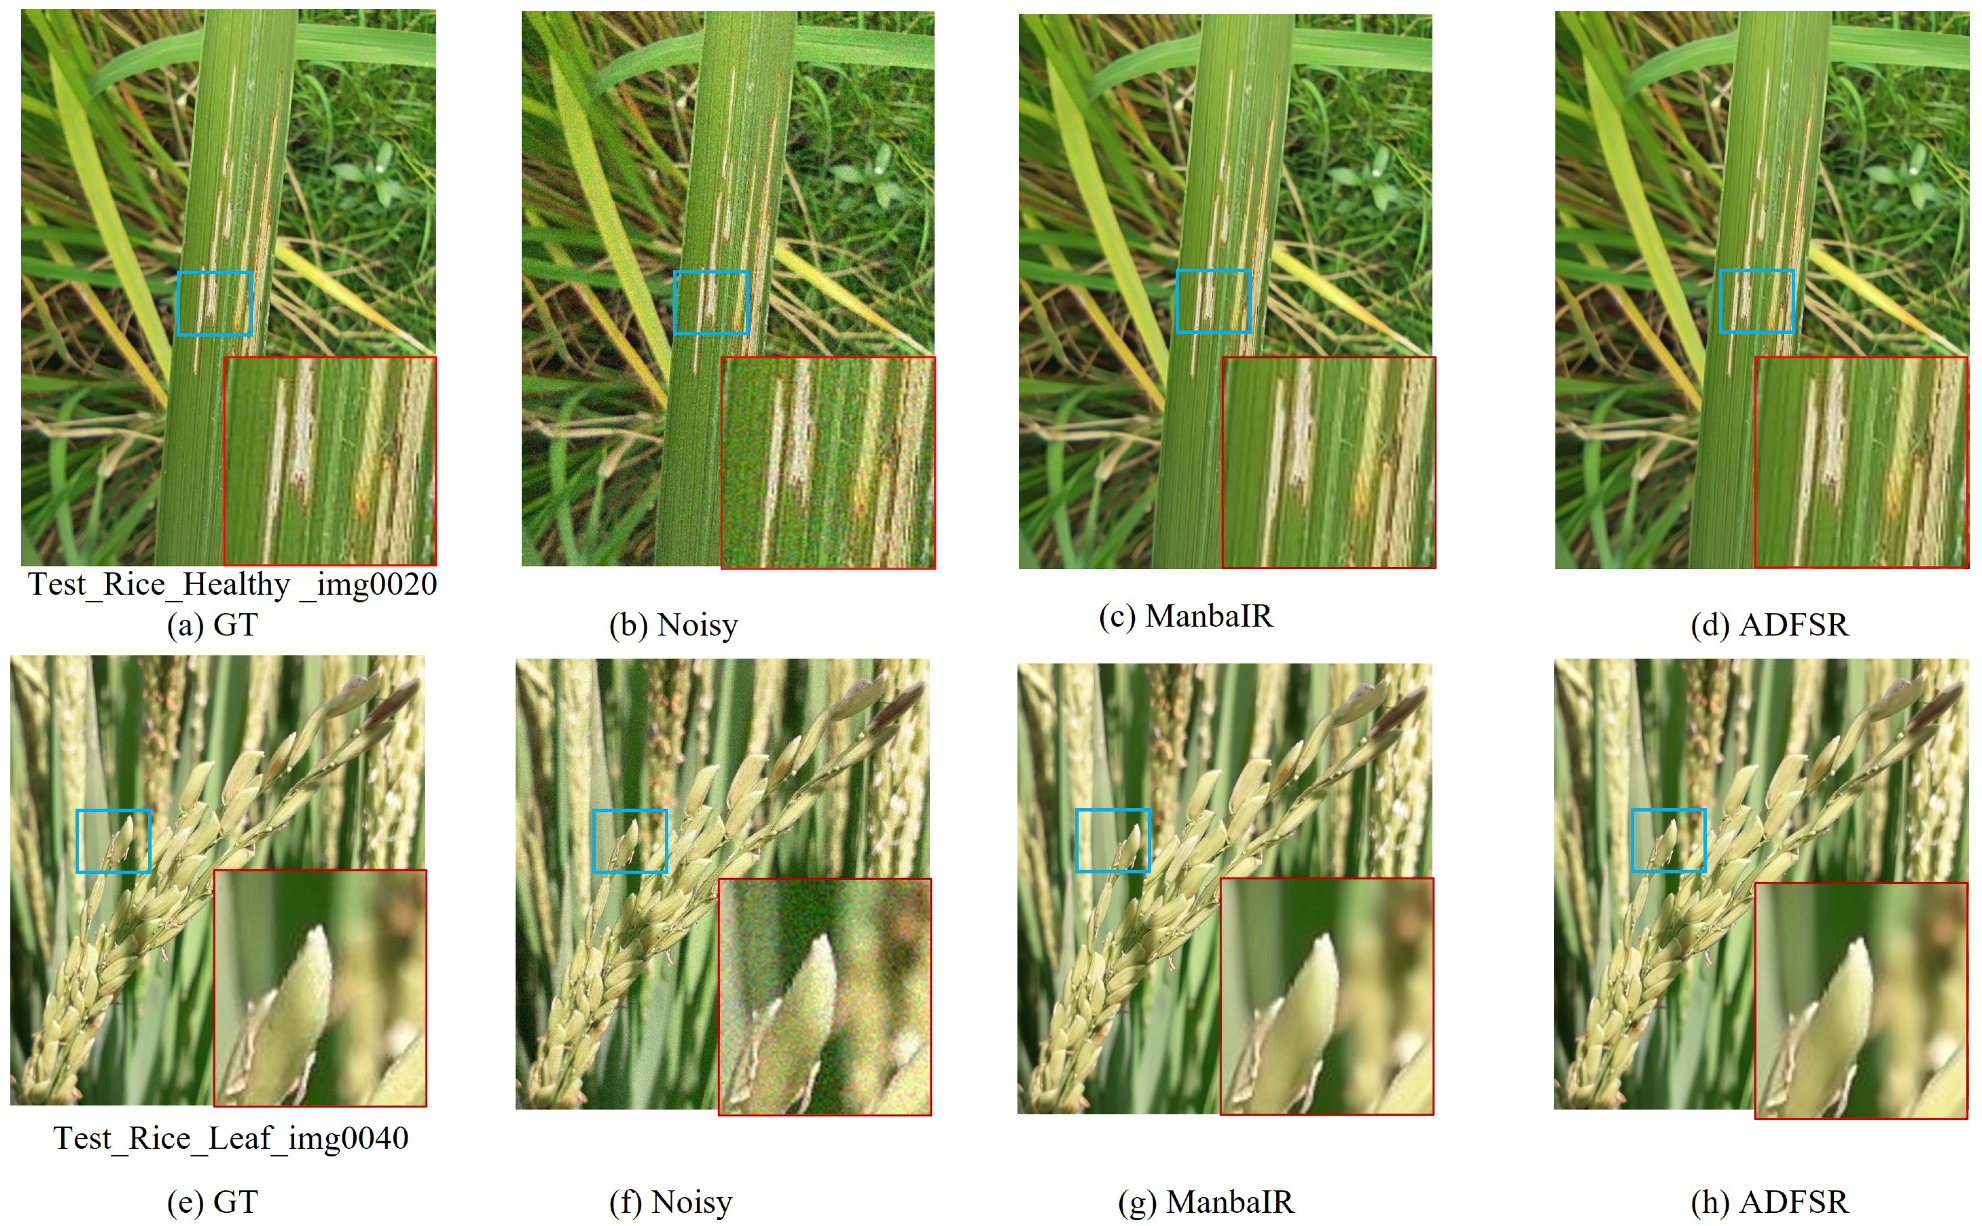
4.1.3. Image Denoising Performance Analysis

To evaluate the performance of our model on denoising performance and to ensure the fairness of the experiments, we adopted the lightweight network architecture of MambaIR-light [19] and performed the same number of rounds of training. During the experiment, we strictly followed the established methodology for each round of processing. As shown in Table 3, we compared the metrics on the Rice_Healthy and Rice_Leaf datasets. The visual comparison in Figure 8 further visualizes the performance of our approach in terms of detail presentation and overall quality. This result is mainly attributed to the dual-frequency processing strategy we employ, as well as the application of the dynamic weight fusion mechanism (CSDW) and the lightweight gating network (LFFN). These techniques enable the model to process the high-frequency information more efficiently during the frequency information fusion process, thus achieving better denoising results.

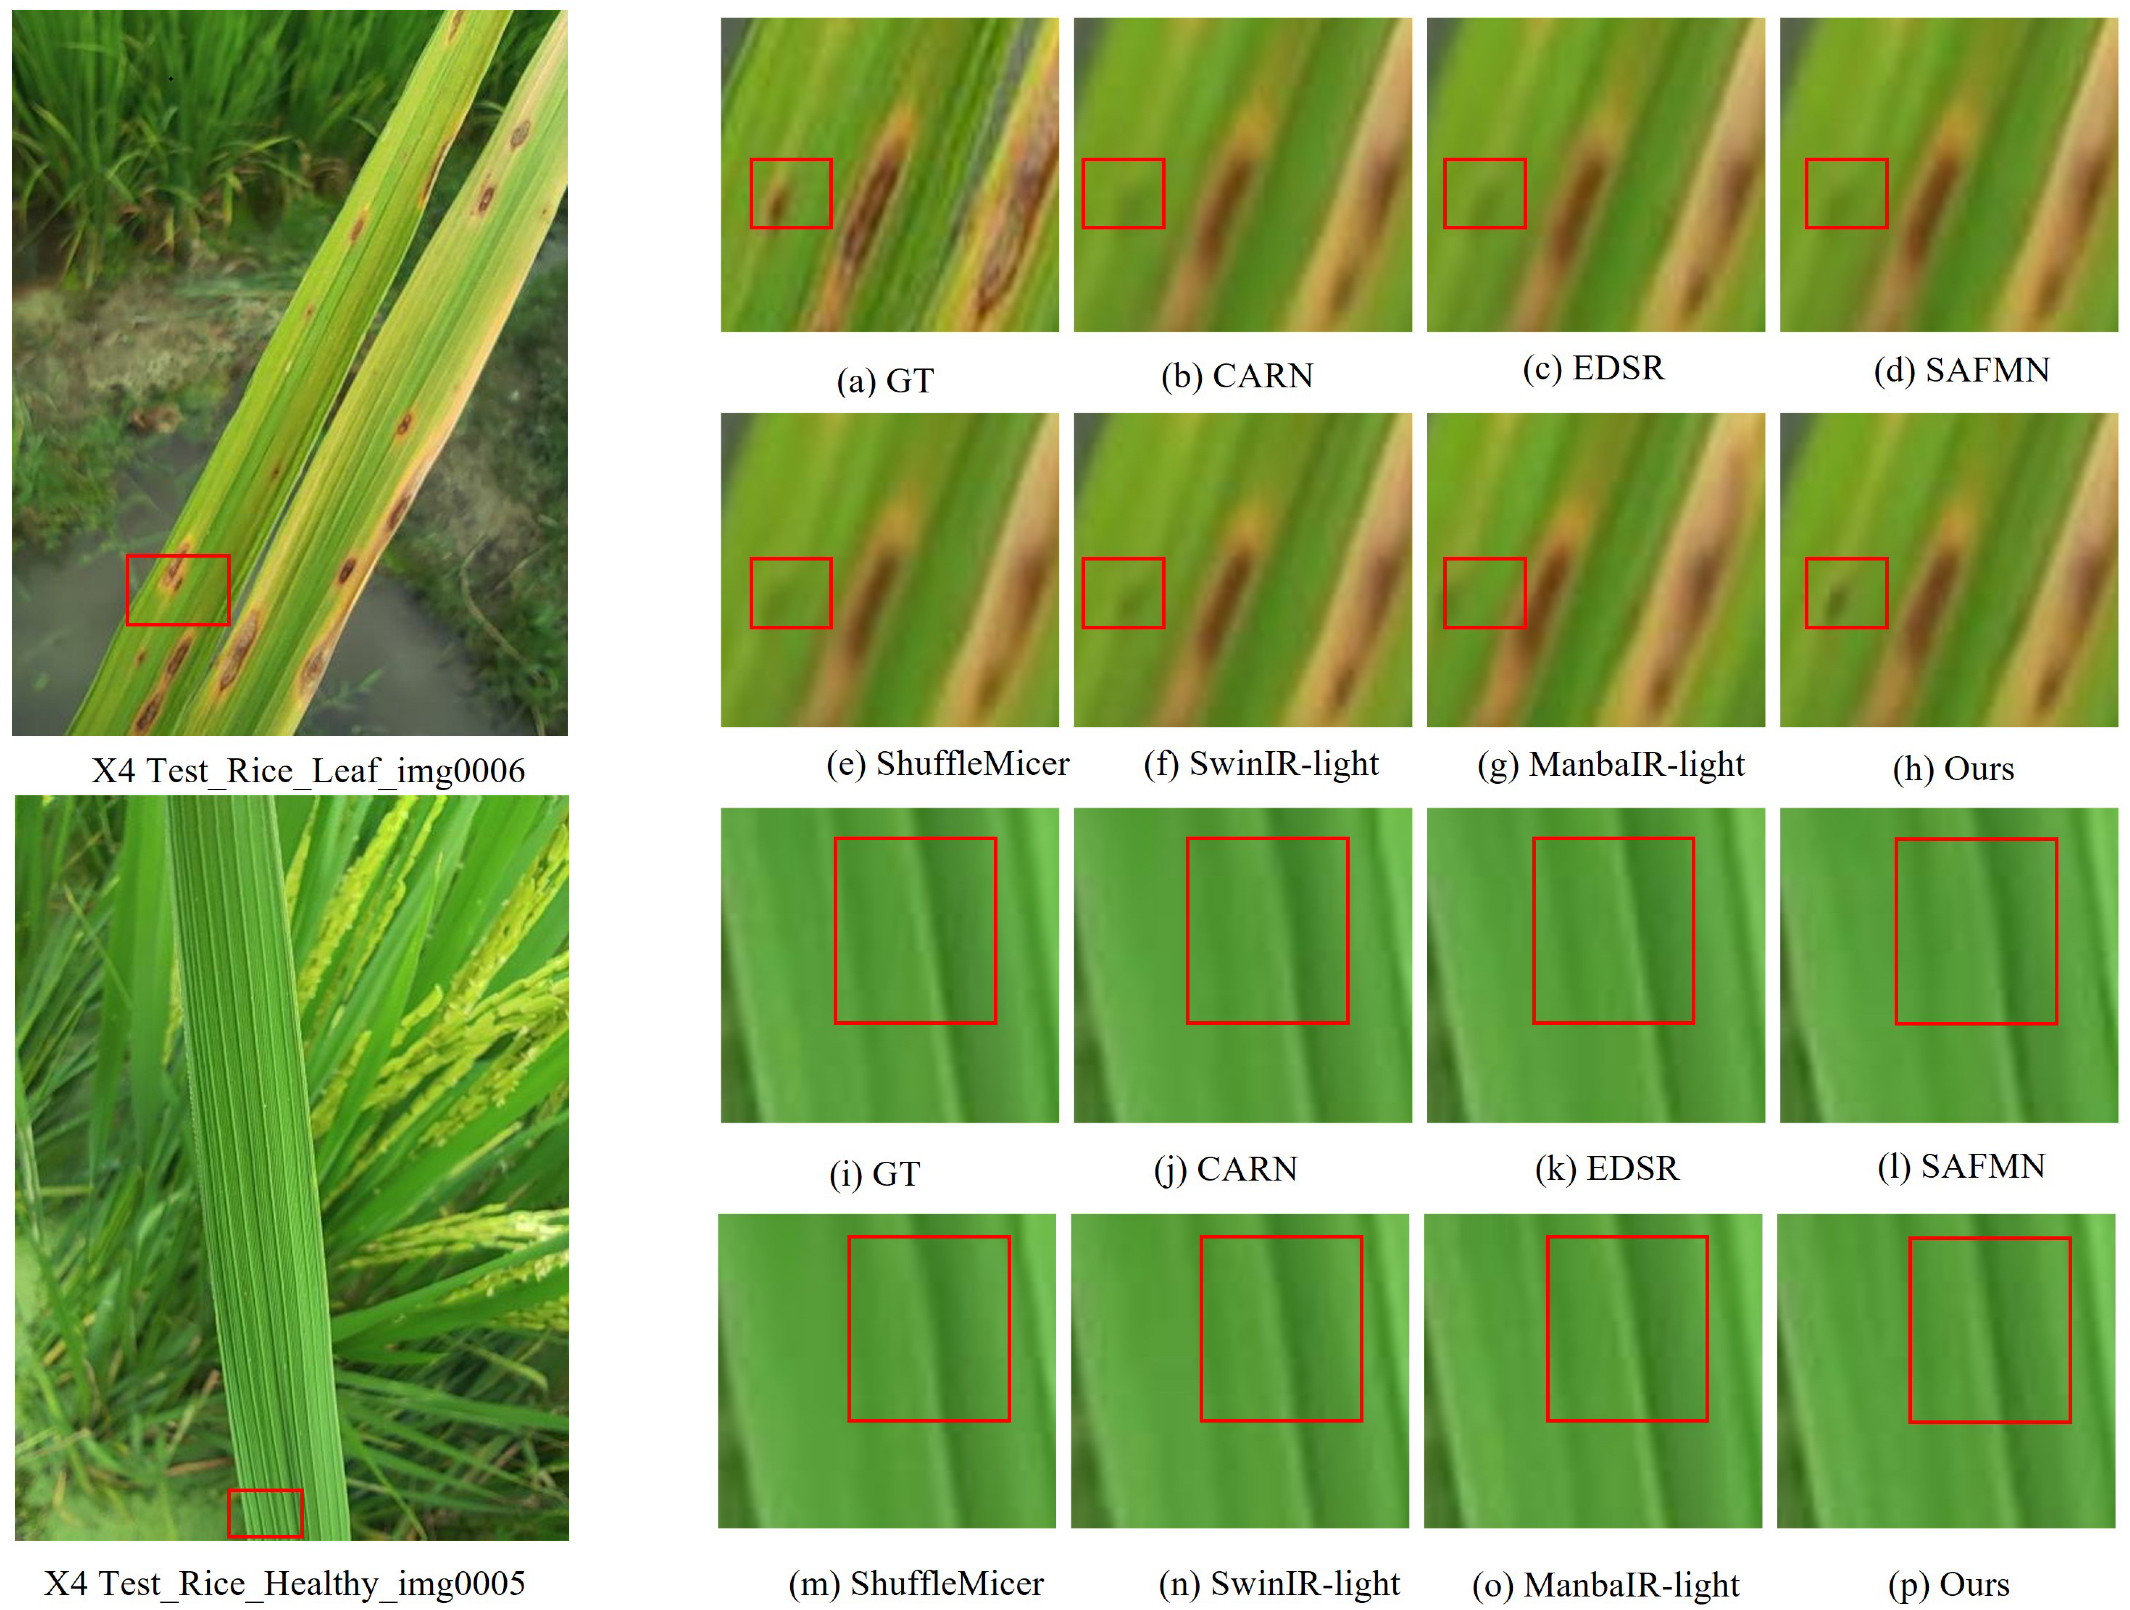
4.1.4. Comparison of Subjective Visual Indicators

In subjective image comparisons (shown in Figure 9), the ADFSR method shows significant advantages in detail preservation and overall visualization. Compared to conventional methods (e.g., CARN and EDSR), hybrid architectures (e.g., ShuffleMixer and SAFMN), visual Transformer-based methods (SwinIR-light), and methods based on improved Mamba architectures (MambaIR-light), ADFSR is able to recover texture details more efficiently while preserving the edge clarity and image naturalness. In complex texture regions, ADFSR retains more high-frequency details, reduces blurring and artifacts, and provides a clearer and more realistic visual effect. For example, in the area of small speckle details of rice leaves, ADFSR shows superior visual effects, while other methods show blurring and diffusion. In the low-frequency region of the leaf blade, other methods are excessively smooth and have distorted details, especially in the stripe performance of the rice leaf blade, and ADFSR is able to highlight the stripe details more, showing stronger robustness and detail recovery.

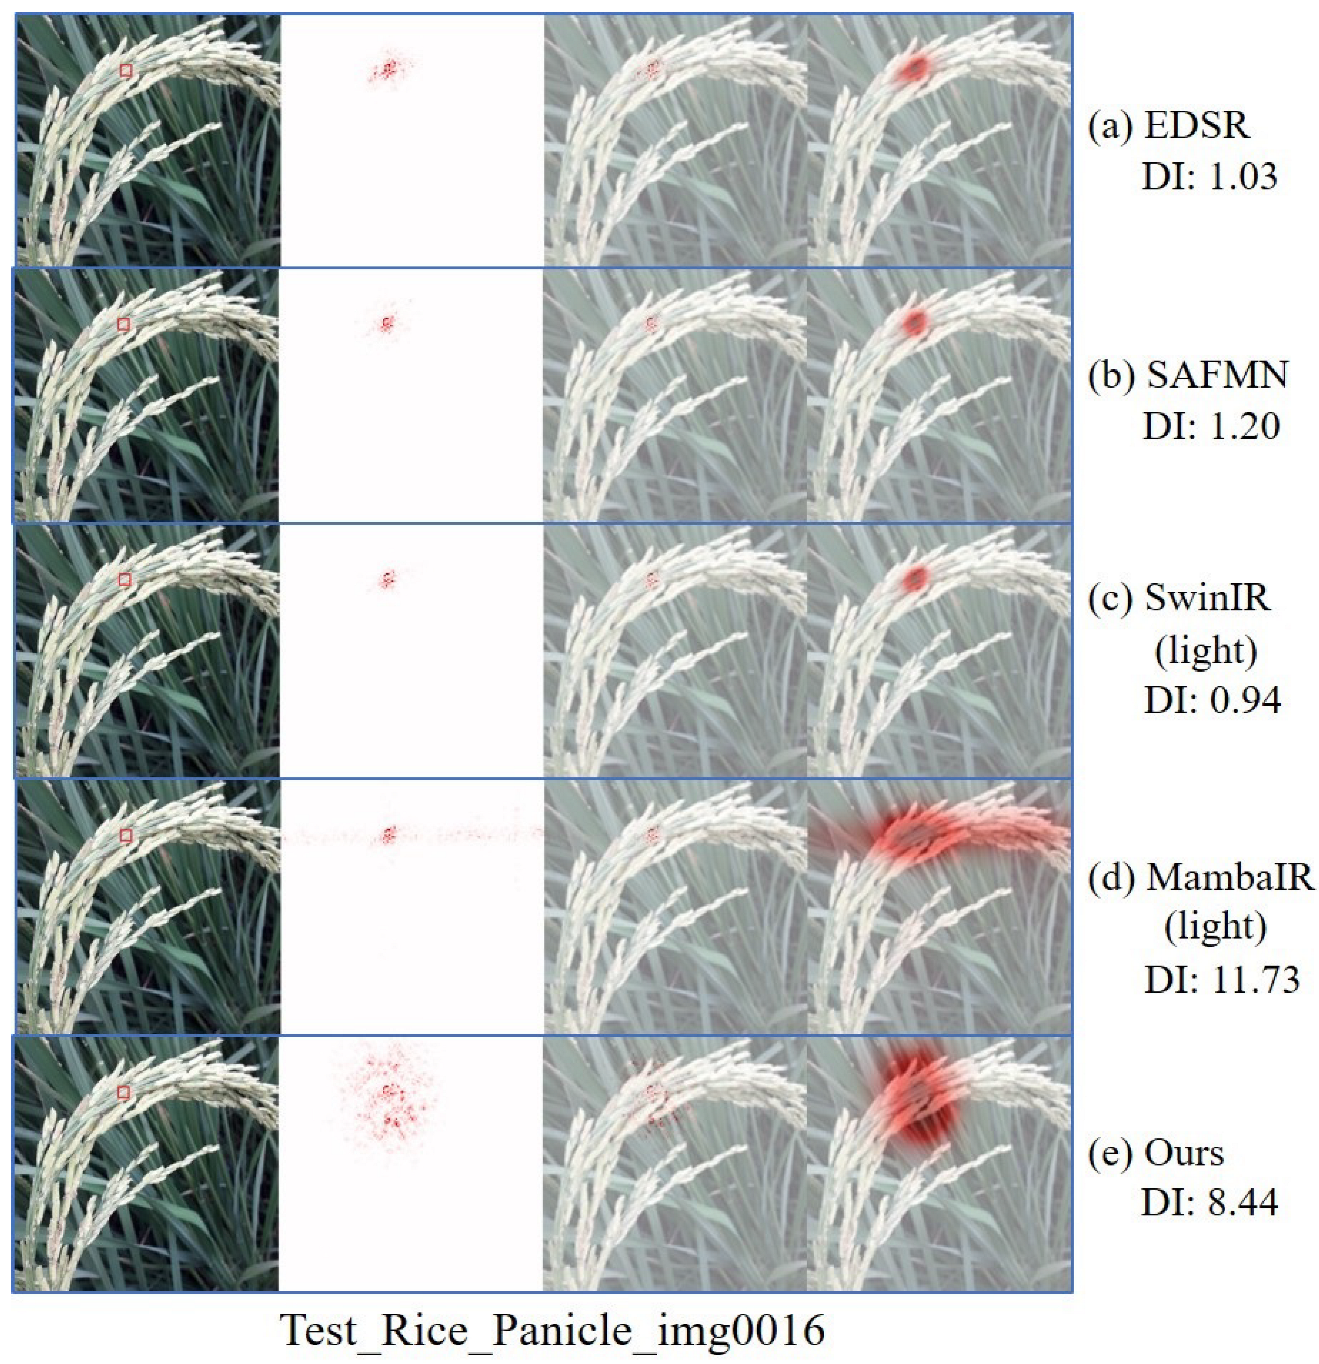
4.1.5. Comparison of Diffusivity

According to the quantitative analysis of the local attribute map (LAM) [33], the results show (as shown in Figure 10) that there is a significant spatial correlation feature between the red pixel region and the rectangular location block. The ADFSR method significantly outperforms existing methods in non-local information capture. Traditional CNN methods are limited by the local perceptual field and have insufficient diffusion ability; Transformer-based methods have a global attention mechanism but have limited ability to recover high-frequency details; MambaIR has a breakthrough in long-sequence modeling but has a too high computational cost; ADFSR breaks through the bottleneck of local perceptualization by dynamically constructing asymmetric diffusion paths and realizes a larger range of pixel-length dependencies. The LAM visualization results show that ADFSR can realize cross-scale feature interaction, which is better than the limited neighborhood association of the comparative methods, is especially suitable for high-frequency detail reconstruction of complex texture regions, and avoids the problem of a high computational cost.

4.1.6. Qualitative Comparison on the DF2K Dataset

In order to systematically verify the generalization ability of this algorithm in non-specific scenarios, on the basis of the significant optimization effect that has been achieved for rice data, the internationally recognized super-resolution benchmark dataset DIV2K + Flickr2K (referred to as DF2K) [34] is used in this study for model training. Five standard test sets, Set5 [35], Set14 [36], B100 [37], Urban100 [38], and Manga109 [39], are selected for the evaluation stage, and the test images are converted to the YCbCr color space, focusing on analyzing the objective metrics of the luminance channel (Y-channel): the Peak Signal-to-Noise Ratio (PSNR) to quantify the pixel-level reconstruction accuracy, the Structural Similarity Index (SSIM) measures the visual structure fidelity, and the two synergistically verify the comprehensive performance of the algorithm at the level of detail recovery and visual perception. As shown in Table 4, our method is trained on the DF2K dataset under the standard 4× super-resolution task, based on the previous work of SMFANet [22], and compared with the state-of-the-art lightweight SR for the method. Among the algorithms, FSRCNN [6], CARN [7], EDSR-baseline [15], IMDN [40], LAPAR-A [41], SMSR [42], ShuffleMixer [14], and SAFMN [13] are selected as a total of eight classical lightweight models among CNN methods, covering local feature extraction, channel attention, cascaded residuals, and other key technical routes; for ViT-based frontier methods, it is with ESRT [43], SwinIR-light [9], ELAN-light [44], NGswin [45], SPIN [46], EFRDN [47], SRFormer-light [48], and MambaIRv2-light [49] that other recent works are compared, covering window attention, hierarchical architecture, sparse activation, split-frequency processing, and other innovative designs.

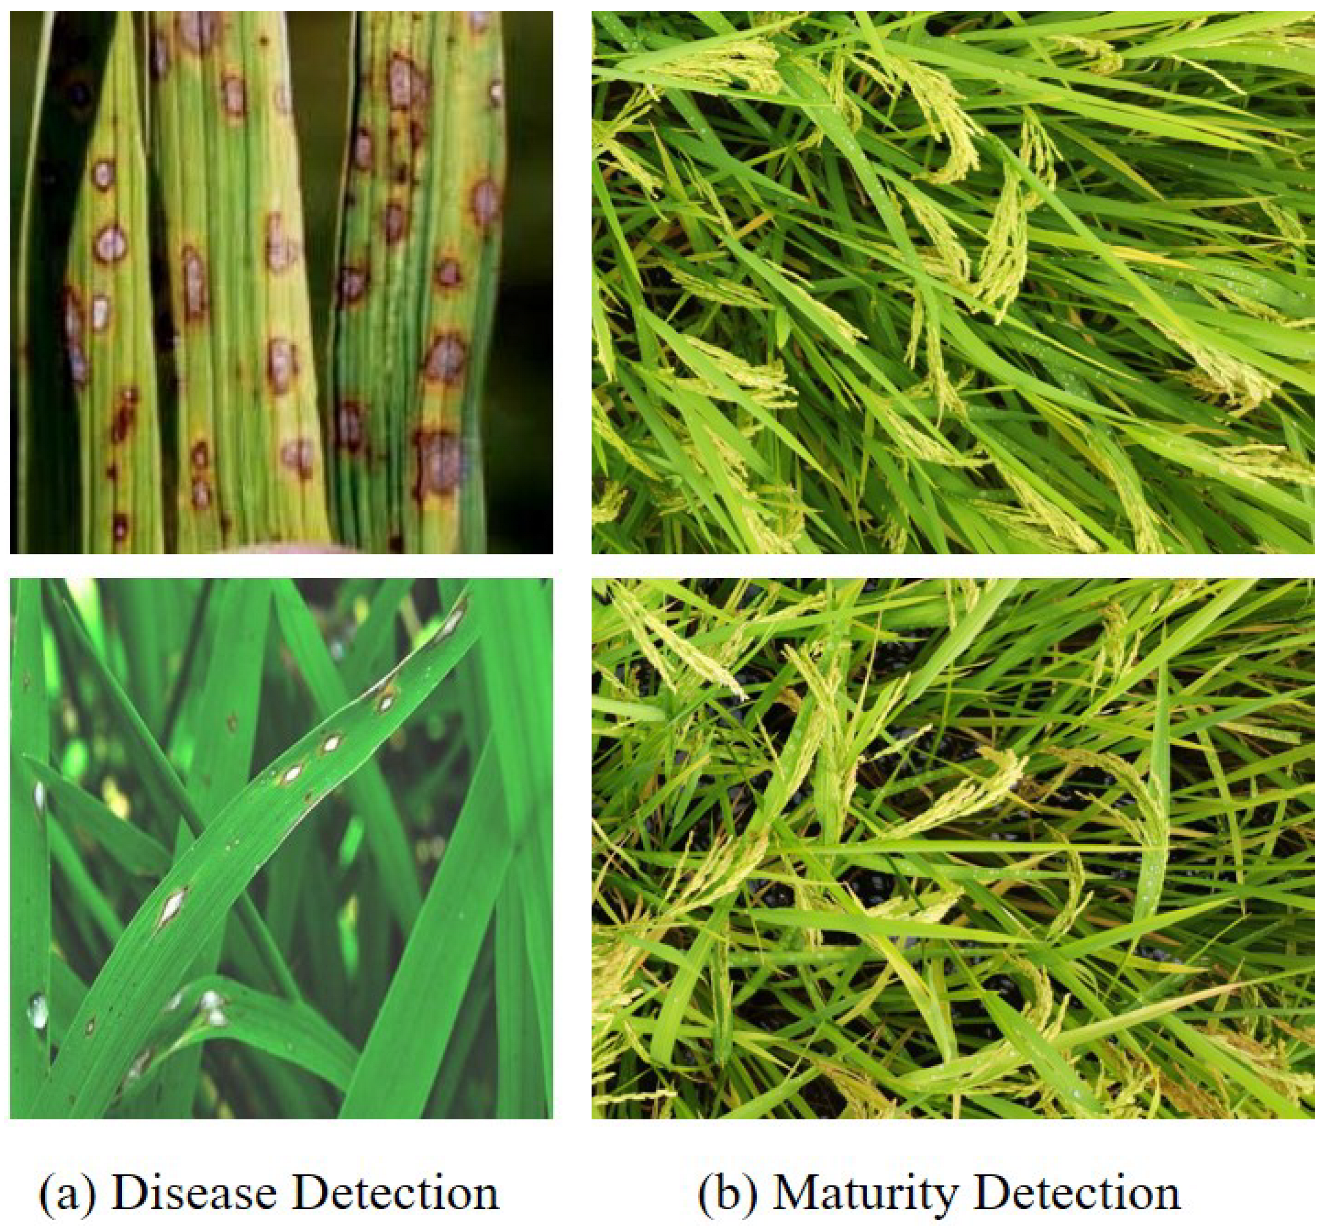
4.2. Downstream Task Analysis

In the tasks of rice spike maturity detection and rice leaf pest detection, the performance difference of the hyperaccounting method on small-scale datasets is not obvious, and its advantages and disadvantages need to be fully realized on large-scale datasets. However, constructing large-scale rice spike maturity and rice leaf pest datasets faces challenges such as high data collection costs and complex labeling. Therefore, in this paper, we only compare the proposed rice over-scoring algorithm with the interpolation method, focusing on demonstrating the key improvements and practical benefits of the algorithm, and avoiding the complexity of interpreting the results brought about by the comparison of multiple algorithms.

4.2.1. Image-Enhancement-Based Ripeness Detection and Analysis of Rice Spikes

Rice spike maturity detection is an important task in agricultural monitoring, and its accuracy relies on the morphological integrity, color fidelity, and inter-spike topological relationships of rice spikes. However, these features are susceptible to frequency-domain aliasing and structural distortion under low-resolution or blurred image conditions, resulting in degraded detection performance [50]. For this reason, we use YOLOv8 [31] to train and detect rice spike detection datasets in the field at different growth stages. From the dataset [26], we selected 2560 images for training and 750 images for validation. In addition, we randomly selected 200 images from outside the training and validation sets for the maturity checking test of the interpolation method and the images recovered by our method to ensure the objectivity and accuracy of the test results. It should be emphasized that there is no intersection between the training set, validation set, and test set, thus ensuring the fairness of the evaluation process and the reliability of the results. As shown in Table 5, we selected 200 images from the original test set as the validation set and compared them with the traditional interpolation method and the 4-fold downsampling image recovery method. The results show that our method significantly outperforms the traditional interpolation method in detection performance at different rice spike maturity stages, and the average performance is significantly improved in precision (P), recall (R), and mAP50 metrics.

4.2.2. Image-Enhancement-Based Detection and Analysis of Rice Leaf Pests and Diseases

In this study, we focus on the accurate identification of bacterial leaf spot, brown spot, and leaf mold for rice disease detection. The experiments are conducted using YOLOv8 [31] for training and detection, and 200 images are selected from the original test set as the validation set. To evaluate the impact of image enhancement techniques on the detection performance, we compare the results by interpolated upsampling and our proposed image recovery method under 4-fold downsampling conditions, respectively.
The experimental results showed that our method improved on all disease types. As shown in Table 6, precision (P) is improved to 0.977, recall (R) to 0.935, and mAP50 to 0.989 in bacterial leaf spot detection; in leaf mold detection, P, R, and mAP50 reached 0.971, 0.966, and 0.991, respectively; and in brown spot detection, P, R, and mAP50 reached 0.948, 0.843, and 0.945, which are 1.9%, 6.3%, and 4.3% higher than before recovery, respectively. This indicates that the recognition accuracy of brown spot disease is greatly affected by the degree of fuzziness, and the improvement of recognition accuracy is more significant, as shown in Figure 11.

4.3. Ablation Experiment

In this section, we conduct an extensive ablation study to analyze and evaluate the effects of each component in the proposed ADFSR. We implemented all ablation experiments based on the ×4 ADFSR model and trained it using the Rdate dataset for a fair comparison. The quantitative ablation results in Table 4 are measured on Rice_Panicle, Rice_Leaf, and Rice_Healthy. The subjective schematics in the following are from the test set. Data from all ablation experiments are shown in Table 7.

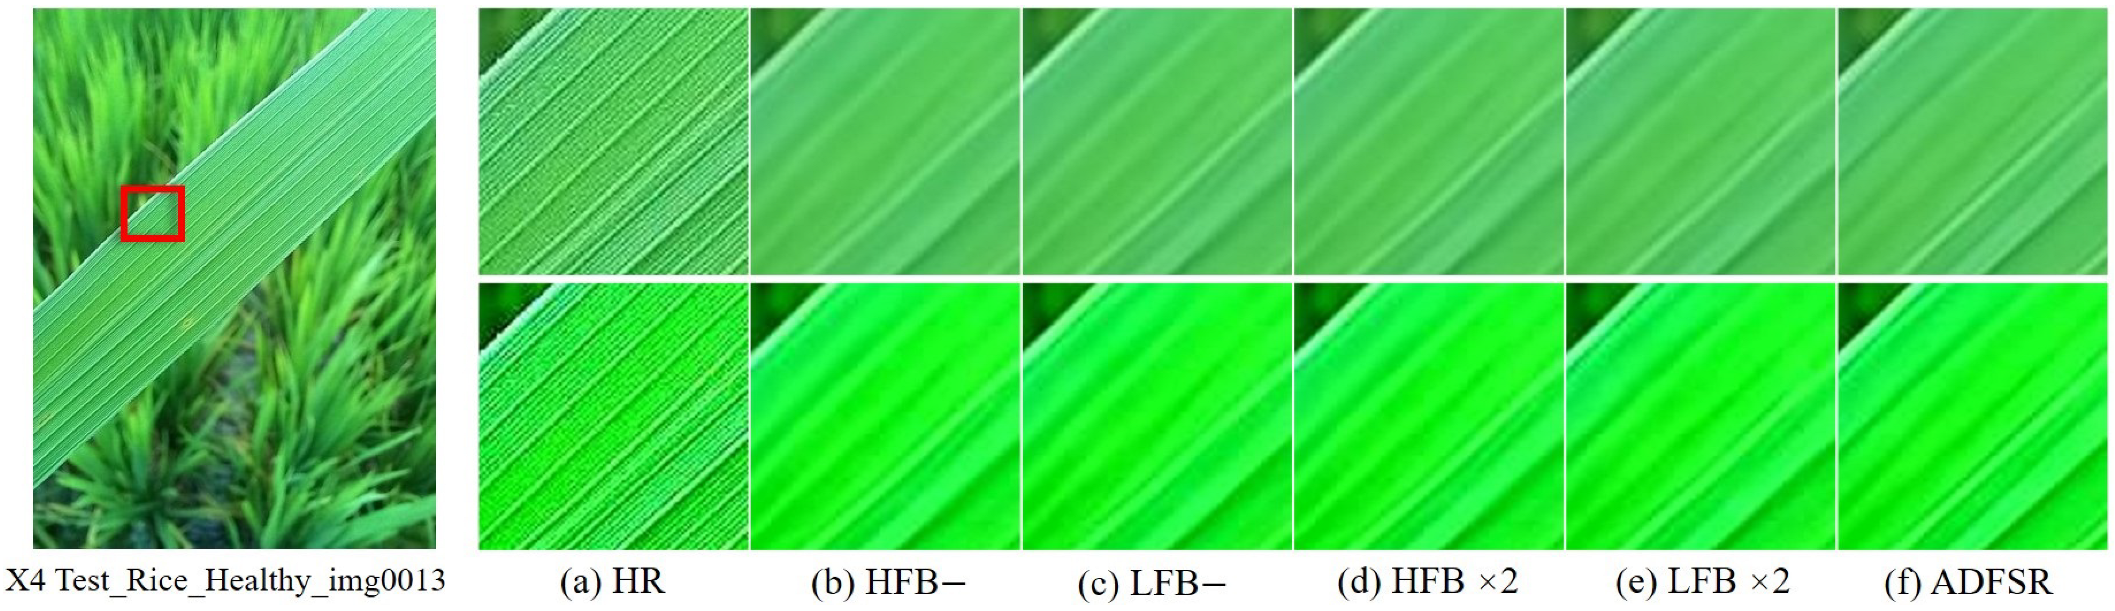
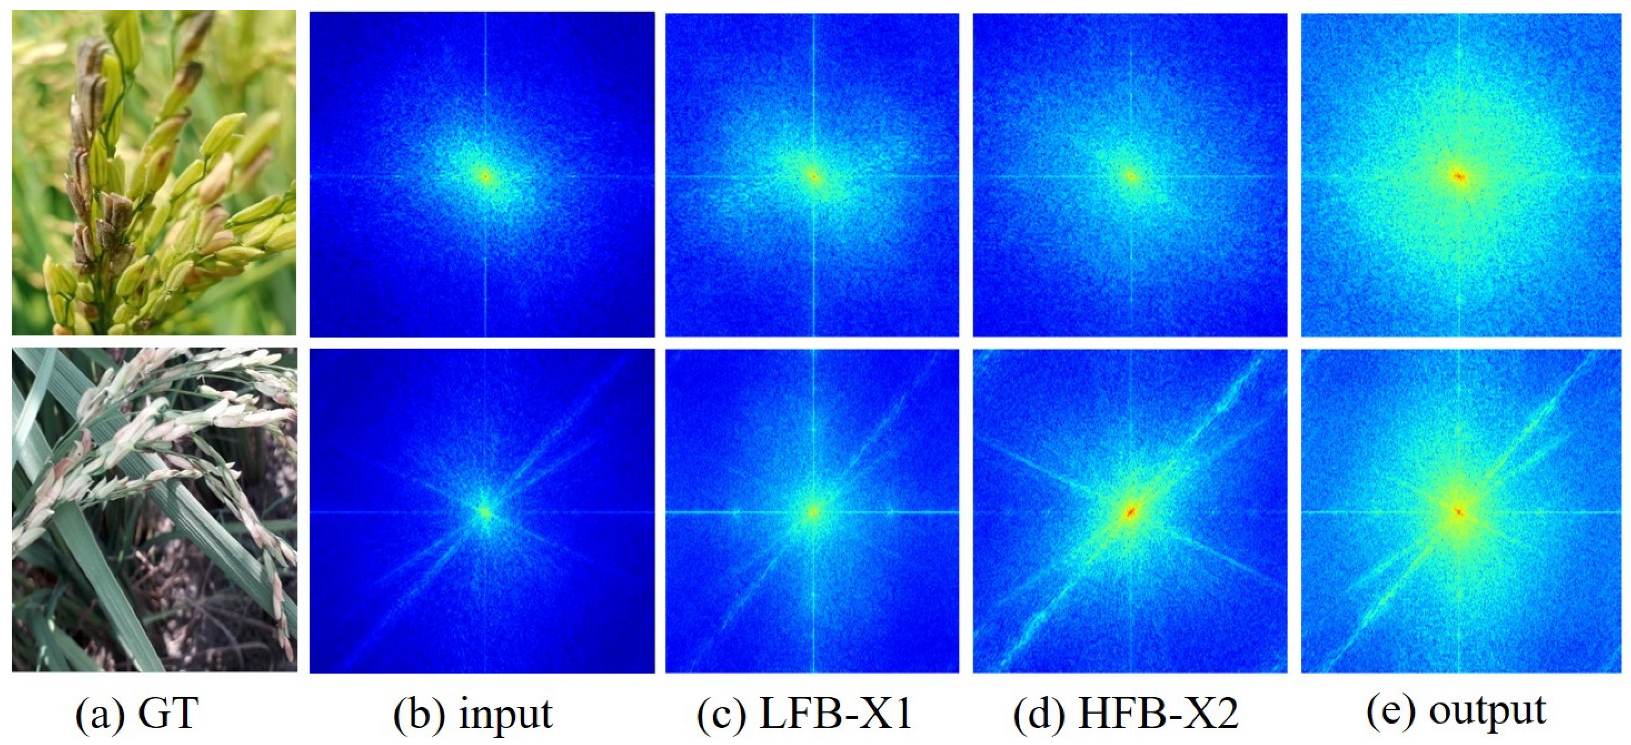
4.3.1. Complementary Effectiveness Analysis of High and Low Frequencies

In order to verify the complementarity of high-frequency detail information and low-frequency global structure information during image degradation, we conducted experiments based on the test model by removing the high-frequency branch (HFB-) or the low-frequency branch (LHB-), as well as replacing the original structure with a double-high-frequency branch (HFB ×2) or a double-low-frequency branch (LFB ×2), and leaving the other model structures unchanged, respectively. The experimental results show that a reasonable combination of high-frequency and low-frequency information can significantly improve the performance of the model in the rice-image-processing task, verifying the effectiveness of the complementary combination of high and low-frequency information. As shown in Figure 12, by comparing the visual effects of different structural adjustments (including removing or doubling the high-frequency/low-frequency branches) with contrast enhancement processing (enhancement factor of 2) to highlight the texture details, the results show that the original two-branch model performs optimally in the recovery of texture details, which further proves the importance of the combination of high and low-frequency information.
As shown in Figure 13, the power spectral density (PSD) visualization of the features indicates that the signals have significant spatial complementarity in the frequency domain: the energy of the low-frequency component (LFB-X1) is concentrated in the center of the spectrum, forming a peak clustering, and the energy of the high-frequency component (LFB-X2) is diffusely distributed at the edges of the spectrum. This center-periphery difference in energy distribution is clearly visible in the input-to-output PSD map, indicating that signal processing activates more valuable pixel regions.

4.3.2. Directional Feature Decoupling and Sensory Field Optimization

In this study, the key role of the directional feature decoupling mechanism in the DMSOP module is deeply analyzed through ablation experiments. The removal of the directional depth separable convolution (DMSOP-) resulted in a significant decrease in model performance. Further ERF visualization (The darker the color, the larger the area seen by that layer. Shallow layers focus on localized details of the image, while deeper layers are able to see a larger area, making it easier to understand the overall structure of the image.) comparisons (Figure 14) reveal that the DMSOP module significantly outperforms the other algorithms in terms of sensory field coverage and continuity. When the directionality module is not enabled, the activation area is discrete patches with limited effective receptive fields and incoherent boundary responses, while the full DMSOP module exhibited a diffuse ERF with a wider continuous activation area and stronger boundary response coherence.

4.3.3. ASSA Dynamic Scaling Mechanism Enhanced High-Frequency Detail Analysis

In the ablation experiments of this study, we verified the effect of the ASSA (Adaptive Sparse Skip Attention) module on the model performance. After removing the ASSA module, the model decreases in both PSNR and SSIM metrics. This indicates that the ASSA module is able to effectively extract the high-frequency residual information through feature decomposition and enhancement operations and dynamically adjusts its magnitude using the learnable scaling factor σ , thus enhancing the expression of high-frequency information.

4.3.4. Impact of LFFN on Algorithm Performance

In the ablation experiments in this paper, we compare the performance of networks that include LFFN modules and those that do not in the image super-resolution task, with LFFN- denoting the removal of LFFN modules. The experimental results show that the PSNR and SSIM metrics of the model decrease when the LFFN module is removed. The effectiveness of the LFFN module in the image super-resolution task is verified by the ablation experiments. The LFFN module significantly improves the feature capture ability and overall performance of the model through the feature growth, feature segmentation, adaptive pooling, and attention mechanisms.

4.3.5. Impact of CSDW on Algorithm Performance

The study validates the key role of the dynamic weight fusion module (CSDW) through ablation experiments. The module adopts a non-competitive weight assignment mechanism (in the range of 0.01–0.09) and realizes the adaptive fusion of frequency band features through dynamic weight generation and nonlinear scaling. The experimental results show that compared with the competitive weighting schemes 1 and 2, the non-competitive strategy can effectively avoid band interference, and the introduction of the dynamic frequency-aware gating module further optimizes the self-adaptive fusion of high and low-frequency features, which confirms the advantages of the non-competitive weight assignment in maintaining the independence of band features.

5. Discussion

Our research focuses on recovering the texture and details of rice images, which is significant for food security and precision agriculture. To this end, we propose a new method based on an adaptive two-branch heterogeneous structure. The low-frequency branch uses directional perception to extend the receptive field to recover global features, such as striped features, while the high-frequency branch sharpens local details through an adaptive enhancement mechanism. Combining the dynamic weight fusion mechanism and lightweight gating network, the method effectively balances the number of parameters, computational cost, memory footprint, and inference speed. In downstream tasks, it can enhance the accuracy and efficiency of rice detection in real-world applications. Although this is our first foray into agricultural image processing, its effectiveness has been validated in downstream tasks. In the future, we plan to combine this method with target detection to build a more efficient unified detection system and promote the development of agricultural image processing technology. In addition, given that images in complex agricultural environments may encounter problems such as strong light, low light, and occlusion, we will analyze the limitations of the model in depth in the discussion section and explore the direction of improvement with the aim of solving more practical problems in real-time agricultural tasks. We plan to optimize the model’s adaptability by collecting more samples and environmental data to improve its usefulness in a wide range of agricultural scenarios. We also discuss the challenges the model may face when replicating across crops and include environmental adaptation as a key direction for future research.

6. Conclusions

The adaptive dynamic frequency modulation super-resolution method proposed in this study achieves a breakthrough in agricultural image reconstruction through a two-branch heterogeneous architecture. The low-frequency branch extends the perceptual domain using lightweight convolution and orientation-aware kernels to accurately model complex agricultural scenes; the high-frequency branch enhances the high-frequency details through dynamic weighting to significantly improve the high-frequency degradation problem. The dynamic fusion module effectively suppresses band interference artifacts. In the super-resolution task, ADFSR shows significant advantages in the ×4 reconstruction task: the number of parameters and the amount of operations are reduced dramatically, and the performance is significantly improved. In agricultural image analysis, ADFSR significantly improves the accuracy of rice spike ripeness detection and leaf pest detection. By optimizing the parameters and the amount of operations, ADFSR provides strong support for precision agricultural disease monitoring.

Author Contributions

Z.Z.: research design, model architecture development, and paper writing. C.P. and J.Z.: experimental design, result analysis, and paper review and revision. X.C. and J.D.: data collection and pre-processing. W.Z.: model training and testing. All authors have read and agreed to the published version of the manuscript.

Funding

This research received no external funding.

Data Availability Statement

The dataset analyzed in this study is publicly available on demand.

Acknowledgments

The authors would like to express their sincere gratitude to Changmeng Peng for his kind guidance and support during the course of this study. The authors also thank their colleagues at Sichuan Agricultural University for their valuable advice and assistance in this study.

Conflicts of Interest

The authors declare that they do not have any financial conflicts of interest or personal relationships that could influence the work in this paper.

References

  1. Wang, J.; Ma, S.; Wang, Z.; Ma, X.; Yang, C.; Chen, G.; Wang, Y. Improved Lightweight YOLOv8 Model for Rice Disease Detection in Multi-Scale Scenarios. Agronomy 2025, 15, 445. [Google Scholar] [CrossRef]
  2. Deng, J.; Yang, C.; Huang, K.; Lei, L.; Ye, J.; Zeng, W.; Zhang, J.; Lan, Y.; Zhang, Y. Deep-Learning-Based Rice Disease and Insect Pest Detection on a Mobile Phone. Agronomy 2023, 13, 2139. [Google Scholar] [CrossRef]
  3. Sun, Y.; Chen, Q.; Xu, W.; Huang, A.; Yan, C.; Zheng, B. Enhanced local distribution learning for real image super-resolution. Comput. Vis. Image Underst. 2024, 247, 104092. [Google Scholar] [CrossRef]
  4. Wu, M.; Yang, X.; Yun, L.; Yang, C.; Chen, Z.; Xia, Y. A General Image Super-Resolution Reconstruction Technique for Walnut Object Detection Model. Agriculture 2024, 14, 1279. [Google Scholar] [CrossRef]
  5. Martínez-Ruedas, C.; Yanes-Luis, S.; Díaz-Cabrera, J.M.; Gutiérrez-Reina, D.; Linares-Burgos, R.; Castillejo-González, I.L. Detection of Planting Systems in Olive Groves Based on Open-Source, High-Resolution Images and Convolutional Neural Networks. Agronomy 2022, 12, 2700. [Google Scholar] [CrossRef]
  6. Dong, C.; Loy, C.C.; Tang, X. Accelerating the super-resolution convolutional neural network. In Computer Vision–ECCV 2016, Proceedings of the 14th European Conference, Amsterdam, The Netherlands, 11–14 October 2016; Proceedings, Part II 14; Springer: Cham, Switzerland, 2016; pp. 391–407. [Google Scholar]
  7. Ahn, N.; Kang, B.; Sohn, K.A. Fast, accurate, and lightweight super-resolution with cascading residual network. In Proceedings of the European Conference on Computer Vision (ECCV), Munich, Germany, 8–14 September 2018; pp. 252–268. [Google Scholar]
  8. Vaswani, A.; Shazeer, N.; Parmar, N.; Uszkoreit, J.; Jones, L.; Gomez, A.N.; Kaiser, Ł.; Polosukhin, I. Attention is all you need. Adv. Neural Inf. Process. Syst. 2017, 5998–6008. [Google Scholar]
  9. Liang, J.; Cao, J.; Sun, G.; Zhang, K.; Van Gool, L.; Timofte, R. Swinir: Image restoration using swin transformer. In Proceedings of the IEEE/CVF International Conference on Computer Vision, Montreal, QC, Canada, 10–17 October 2021; pp. 1833–1844. [Google Scholar]
  10. Ma, Z.; Liu, Z.; Wang, K.; Lian, S. Hybrid attention transformer with re-parameterized large kernel convolution for image super-resolution. Image Vis. Comput. 2024, 149, 105162. [Google Scholar] [CrossRef]
  11. Zhu, X.; Zhang, Y.; Li, J.; Wang, J.; Lai, X. TCSR: Self-attention with time and category for session-based recommendation. Comput. Intell. 2024, 40, e12695. [Google Scholar] [CrossRef]
  12. Frank, J.; Eisenhofer, T.; Schönherr, L.; Fischer, A.; Kolossa, D.; Holz, T. Leveraging frequency analysis for deep fake image recognition. In Proceedings of the International Conference on Machine Learning, PMLR, Virtual, 13–18 July 2020; pp. 3247–3258. [Google Scholar]
  13. Sun, L.; Dong, J.; Tang, J.; Pan, J. Spatially-adaptive feature modulation for efficient image super-resolution. In Proceedings of the IEEE/CVF International Conference on Computer Vision, Paris, France, 1–6 October 2023; pp. 13190–13199. [Google Scholar]
  14. Sun, L.; Pan, J.; Tang, J. Shufflemixer: An efficient convnet for image super-resolution. Adv. Neural Inf. Process. Syst. 2022, 35, 17314–17326. [Google Scholar]
  15. Lim, B.; Son, S.; Kim, H.; Nah, S.; Mu Lee, K. Enhanced deep residual networks for single image super-resolution. In Proceedings of the IEEE Conference on Computer Vision and Pattern Recognition Workshops, Honolulu, HI, USA, 21–26 July 2017; pp. 136–144. [Google Scholar]
  16. Lv, N.; Yuan, M.; Xie, Y.; Zhan, K.; Lu, F. Non-local sparse attention based swin transformer V2 for image super-resolution. Signal Process. 2024, 222, 109542. [Google Scholar] [CrossRef]
  17. Huang, S.; Deng, W.; Li, G.; Yang, Y.; Wang, J. RTEN-SR: A reference-based texture enhancement network for single image super-resolution. Displays 2024, 83, 102684. [Google Scholar] [CrossRef]
  18. Li, D.; Wang, Z.; Yang, J. Video super-resolution with inverse recurrent net and hybrid local fusion. Neurocomputing 2022, 489, 40–51. [Google Scholar] [CrossRef]
  19. Guo, H.; Li, J.; Dai, T.; Ouyang, Z.; Ren, X.; Xia, S.T. Mambair: A simple baseline for image restoration with state-space model. In European Conference on Computer Vision; Springer: Cham, Switzerland, 2024; pp. 222–241. [Google Scholar]
  20. Gu, A.; Dao, T. Mamba: Linear-time sequence modeling with selective state spaces. arXiv 2023, arXiv:2312.00752. [Google Scholar]
  21. Zang, C.; Song, G.; Li, L.; Zhao, G.; Lu, W.; Jiang, G.; Sun, Q. DB-MFENet: A Dual-Branch Multi-Frequency Feature Enhancement Network for Hyperspectral Image Classification. Remote Sens. 2025, 17, 1458. [Google Scholar] [CrossRef]
  22. Zheng, M.; Sun, L.; Dong, J.; Pan, J. SMFANet: A lightweight self-modulation feature aggregation network for efficient image super-resolution. In European Conference on Computer Vision; Springer: Cham, Switzerland, 2024; pp. 359–375. [Google Scholar]
  23. Prajapati, H.B.; Shah, J.P.; Dabh, V.K. Detection and classification of rice plant diseases. Intell. Decis. Technol. 2017, 11, 357–373. [Google Scholar] [CrossRef]
  24. Kumar, R. Rice Plant Dataset. 2020. Available online: https://www.kaggle.com/datasets/rajkumar898/rice-plant-dataset (accessed on 24 April 2025).
  25. Xiao, R.; Wang, L.; Yuan, H. Rice Disease Detection Dataset of 6715 Images. 2024. Available online: https://www.kaggle.com/datasets/hiramscud/rice-disease-detection-dataset-of-6000-images (accessed on 24 April 2025).
  26. Ma, X.; Tan, S.; Lu, H. In-Field Rice Panicles Detection of Different Growth Stages. 2022. Available online: https://data.mendeley.com/datasets/m3pvzxfd7v/1 (accessed on 24 April 2025).
  27. Wijayanto, A.K.; Prasetyo, L.B.; Hudjimartsu, S.A.; Sigit, G.; Hongo, C. Textural features for BLB disease damage assessment in paddy fields using drone data and machine learning: Enhancing disease detection accuracy. Smart Agric. Technol. 2024, 8, 100498. [Google Scholar] [CrossRef]
  28. Chen, G.; Dai, K.; Yang, K.; Hu, T.; Chen, X.; Yang, Y.; Dong, W.; Wu, P.; Zhang, Y.; Yan, Q. Bracketing image restoration and enhancement with high-low frequency decomposition. In Proceedings of the IEEE/CVF Conference on Computer Vision and Pattern Recognition, Seattle, WA, USA, 16–22 June 2024; pp. 6097–6107. [Google Scholar]
  29. Dong, J.; Pan, J.; Yang, Z.; Tang, J. Multi-scale residual low-pass filter network for image deblurring. In Proceedings of the IEEE/CVF International Conference on Computer Vision, Paris, France, 1–6 October 2023; pp. 12345–12354. [Google Scholar]
  30. Chen, J.; Kao, S.; He, H.; Run, D.W. Chasing Higher FLOPS for Faster Neural Networks. In Proceedings of the IEEE/CVF Conference on Computer Vision and Pattern Recognition, Vancouver, BC, Canada, 17–24 June 2023; pp. 12021–12031. [Google Scholar]
  31. Jocher, G. YOLOv8: Real-Time Object Detection. 2023. Available online: https://docs.ultralytics.com/zh/models/yolov8/ (accessed on 24 April 2025).
  32. Kingma, D.P.; Ba, J. Adam: A method for stochastic optimization. arXiv 2014, arXiv:1412.6980. [Google Scholar]
  33. Gu, J.; Dong, C. Interpreting super-resolution networks with local attribution maps. In Proceedings of the IEEE/CVF Conference on Computer Vision and Pattern Recognition, Nashville, TN, USA, 20–25 June 2021; pp. 9199–9208. [Google Scholar]
  34. Timofte, R.; Agustsson, E.; Van Gool, L.; Yang, M.H.; Zhang, L. Ntire 2017 challenge on single image super-resolution: Methods and results. In Proceedings of the IEEE Conference on Computer Vision and Pattern Recognition Workshops, Honolulu, HI, USA, 21–26 July 2017; pp. 114–125. [Google Scholar]
  35. Bevilacqua, M.; Roumy, A.; Guillemot, C.; Alberi-Morel, M.L. Low-complexity single-image super-resolution based on nonnegative neighbor embedding. In Proceedings of the British Machine Vision Conference, Surrey, UK, 3–7 September 2012; BMVA Press: Durham, UK, 2012. [Google Scholar] [CrossRef]
  36. Zeyde, R.; Elad, M.; Protter, M. On single image scale-up using sparse-representations. In International Conference on Curves and Surfaces; Springer: Berlin/Heidelberg, Germany, 2010; pp. 711–730. [Google Scholar]
  37. Arbelaez, P.; Maire, M.; Fowlkes, C.; Malik, J. Contour detection and hierarchical image segmentation. IEEE Trans. Pattern Anal. Mach. Intell. 2010, 33, 898–916. [Google Scholar] [CrossRef] [PubMed]
  38. Huang, J.B.; Singh, A.; Ahuja, N. Single image super-resolution from transformed self-exemplars. In Proceedings of the IEEE Conference on Computer Vision and Pattern Recognition, Boston, MA, USA, 7–12 June 2015; pp. 5197–5206. [Google Scholar]
  39. Matsui, Y.; Ito, K.; Aramaki, Y.; Fujimoto, A.; Ogawa, T.; Yamasaki, T.; Aizawa, K. Sketch-based manga retrieval using manga109 dataset. Multimed. Tools Appl. 2017, 76, 21811–21838. [Google Scholar] [CrossRef]
  40. Hui, Z.; Gao, X.; Yang, Y.; Wang, X. Lightweight image super-resolution with information multi-distillation network. In Proceedings of the 27th ACM International Conference On Multimedia, Nice, France, 21–25 October 2019; pp. 2024–2032. [Google Scholar]
  41. Li, W.; Zhou, K.; Qi, L.; Jiang, N.; Lu, J.; Jia, J. Lapar: Linearly-assembled pixel-adaptive regression network for single image super-resolution and beyond. Adv. Neural Inf. Process. Syst. 2020, 33, 20343–20355. [Google Scholar]
  42. Wang, L.; Dong, X.; Wang, Y.; Ying, X.; Lin, Z.; An, W.; Guo, Y. Exploring sparsity in image super-resolution for efficient inference. In Proceedings of the IEEE/CVF Conference on Computer Vision and Pattern Recognition, Nashville, TN, USA, 20–25 June 2021; pp. 4917–4926. [Google Scholar]
  43. Lu, Z.; Li, J.; Liu, H.; Huang, C.; Zhang, L.; Zeng, T. Transformer for single image super-resolution. In Proceedings of the IEEE/CVF Conference on Computer Vision and Pattern Recognition, New Orleans, LA, USA, 18–24 June 2022; pp. 457–466. [Google Scholar]
  44. Zhang, X.; Zeng, H.; Guo, S.; Zhang, L. Efficient long-range attention network for image super-resolution. In European Conference on Computer Vision; Springer: Cham, Switzerland, 2022; pp. 649–667. [Google Scholar]
  45. Liu, J.; Chen, C.; Tang, J.; Wu, G. From coarse to fine: Hierarchical pixel integration for lightweight image super-resolution. In Proceedings of the AAAI Conference on Artificial Intelligence, Washington, DC, USA, 7–14 February 2023; Volume 37, pp. 1666–1674. [Google Scholar]
  46. Zhang, A.; Ren, W.; Liu, Y.; Cao, X. Lightweight image super-resolution with superpixel token interaction. In Proceedings of the IEEE/CVF International Conference on Computer Vision, Paris, France, 1–6 October 2023; pp. 12728–12737. [Google Scholar]
  47. Liu, C.; Gao, G.; Wu, F.; Guo, Z.; Yu, Y. An efficient feature reuse distillation network for lightweight image super-resolution. Comput. Vis. Image Underst. 2024, 249, 104178. [Google Scholar] [CrossRef]
  48. Zhou, Y.; Li, Z.; Guo, C.L.; Bai, S.; Cheng, M.M.; Hou, Q. Srformer: Permuted self-attention for single image super-resolution. In Proceedings of the IEEE/CVF International Conference on Computer Vision, Paris, France, 1–6 October 2023; pp. 12780–12791. [Google Scholar]
  49. Guo, H.; Guo, Y.; Zha, Y.; Zhang, Y.; Li, W.; Dai, T.; Xia, S.T.; Li, Y. Mambairv2: Attentive state space restoration. In Proceedings of the Computer Vision and Pattern Recognition Conference, Nashville, TN, USA, 10–17 June 2025; pp. 28124–28133. [Google Scholar]
  50. Hu, T.; Liu, Z.; Hu, R.; Zeng, L.; Deng, K.; Dong, H.; Li, M.; Deng, Y.J. Yield prediction method for regenerated rice based on hyperspectral image and attention mechanisms. Smart Agric. Technol. 2025, 10, 100804. [Google Scholar] [CrossRef]
Figure 1. Schematic details of the degradation of the spatial resolution of rice images.
Agronomy 15 01729 g001
Figure 2. Schematic diagram of the frequency domain reconstruction process analysis (from left to right: original image and spectrum → blurred image (high frequencies missing) → low-frequency reconstruction (structure preserved but details lost) → high-frequency reconstruction (details recovered accompanied by noise) → fusion result (high and low frequencies proportionally balanced)). All spectra are processed by a logarithmic transformation to enhance the visualization contrast.
Agronomy 15 01729 g002
Figure 3. In this study, the method performance is verified by a two-dimensional evaluation system: the left figure compares the resource efficiency of the lightweight method under the 4× super-resolution task (the bubble area indicates the GPU memory occupancy, and the horizontal and vertical axes indicate the inference time and PSNR, respectively), and the right figure quantifies the accuracy gain of the super-segmented image for the downstream task, with the blue color corresponding to rice spike ripeness detection and the shape figure corresponding to leaf pest detection, where the solid line indicates the recovered performance boundaries, and the dashed line indicates the original performance boundaries.
Agronomy 15 01729 g003
Figure 4. The figure shows an example of the test set, with the original image at the top and the 2× downsampled image at the bottom.
Agronomy 15 01729 g004
Figure 5. Examples of downstream task datasets are shown, including rice disease identification and rice spike maturity assessment.
Agronomy 15 01729 g005
Figure 6. Diagram of the core architecture of the ADFSR algorithm.
Agronomy 15 01729 g006
Figure 7. The proposed ADFSR network architecture consists of a shallow feature extraction module, a high and low-frequency dual-branch processing module (HLFB), a controlled spatial dynamic weighting module (CSDW), a lightweight feedforward network (LFFN), and a lightweight image reconstruction module. Among them, the HLFB module consists of a high-frequency branch (HFB) and a low-frequency branch (LFB) in which the Adaptive Signal Strength Adjustment (ASSA) module is embedded to dynamically optimize the strength of the detail signals, while the LFB integrates a multi-scale and directional feature extraction module. Directional Multi-Scale Oriented Processing (DMSOP) is integrated in LFB to enhance the detail and texture features of the image.
Agronomy 15 01729 g007
Figure 8. Qualitative comparison on a color image denoising task with noise level s i g m a = 15.
Agronomy 15 01729 g008
Figure 9. Qualitative comparison of our method with other methods on images scaled to ×4.
Agronomy 15 01729 g009
Figure 10. Comparison of local attribute map (LAM) [33] and diffusion index (DI) [33].
Agronomy 15 01729 g010
Figure 11. The comparative results of target detection are shown. After image recovery, the detection accuracy is improved. The red circle identifies the missed detection part of the unrecovered area. The figure originates from the pest and disease dataset (0100.png).
Agronomy 15 01729 g011
Figure 12. The visual contrast effect of different structures is demonstrated, where the lower figure is processed by applying contrast enhancement with Enhancement Factor 2 to emphasize the detail differences and improve the contrast effect.
Agronomy 15 01729 g012
Figure 13. Power spectral density (PSD) visualization of features.
Agronomy 15 01729 g013
Figure 14. (ERF) Effective receptive field comparison. Test images are from the dataset Rice_Healthy.
Agronomy 15 01729 g014
Table 1. Comparison with advanced lightweight SR methods on the test set. All PSNR/SSIM results are calculated on the Y channel. Best and second-best performances are highlighted in red and blue.
MethodScale#Params (K)#FLOPs (G)Rice_Panicle
PSNR/SSIM
Rice_Healthy
PSNR/SSIM
Rice_Leaf
PSNR/SSIM
CARN [7]2159222335.60/0.949934.42/0.936436.15/0.9293
EDSR [15]2137031635.89/0.952935.86/0.940836.46/0.9333
SAFMN [13]22285235.57/0.949235.52/0.936436.16/0.9294
ShuffleMixer [14]23949135.61/0.949535.51/0.936436.14/0.9293
SwinIR-light [9]291024435.86/0.952435.83/0.940436.43/0.9329
MambaIR-light [19]285919835.99/0.953935.99/0.942436.55/0.9347
Ours255811635.99/0.954235.93/0.941536.48/0.9335
CARN [7]3159211932.23/0.901732.44/0.884333.50/0.8784
EDSR [15]3155516032.42/0.906032.68/0.889933.75/0.8840
SAFMN [13]32332332.31/0.903532.54/0.886733.62/0.8812
ShuffleMixer [14]34154332.24/0.901832.45/0.884633.51/0.8789
SwinIR-light [9]391811432.36/0.904432.61/0.888133.67/0.8872
MambaIR-light [19]38678930.56/0.908430.86/0.893933.90/0.8877
Ours35665232.58/0.908932.84/0.893433.87/0.8870
CARN [7]415929129.98/0.851830.33/0.831531.61/0.8270
EDSR [15]4151811430.18/0.858130.58/0.839231.87/0.8344
SAFMN [13]42401430.06/0.854530.45/0.835131.72/0.8301
ShuffleMixer [14]44112830.00/0.852830.37/0.833031.61/0.8274
SwinIR-light [9]49306530.14/0.857130.55/0.838331.81/0.8330
MambaIR-light [19]48795130.27/0.860930.73/0.843731.99/0.8380
Ours45753030.31/0.861730.73/0.843231.97/0.8369
Table 2. ×4 Comparison of memory and runtime on SR.GPU Mem.
Methods#GPU Mem. [M]#Avg. Time [ms]
EDSR48713.56
CARN68414.10
SAFMN655.88
ShuffleMixer46814.91
SwinIR-light345182.53
MambaIR-light430122.65
Ours22727.10
Table 3. Quantitative comparison on Gaussian color image denoising with state-of-the-art methods σ = 15.
MethodRice_Healthy
PSNR/SSIM
Rice_Leaf
PSNR/SSIM
MambaIR36.93/0.960736.97/0.9499
ADFSR37.88/0.962038.10/0.9537
Table 4. The ×4-fold conditions compared to the state-of-the-art method; the best in the table is shown in red, and the second-best is shown in blue.
Methods#Params (K)#FLOPs (G)Set5Set14B100Urban100Manga109
FSRCNN [6] 12530.71/0.865727.59/0.753526.98/0.715024.62/0.728027.90/0.8517
CARN [7] 15929132.13/0.893728.60/0.780627.58/0.734926.07/0.783730.47/0.9084
EDSR-baseline [15] 151811432.09/0.893828.58/0.781327.57/0.735726.04/0.784930.35/0.9067
IMDN [40] 7154132.21/0.894828.58/0.781127.56/0.735326.04/0.783830.45/0.9075
LAPAR-A [41] 6599432.15/0.894428.61/0.781827.61/0.736626.14/0.787130.42/0.9074
SMSR [42] 10064232.12/0.893228.55/0.780827.55/0.735126.11/0.786830.54/0.9085
ShuffleMixer [14] 4112832.21/0.895328.66/0.782727.61/0.736626.08/0.783530.65/0.9093
SAFMN [13] 2401432.18/0.894828.60/0.781327.58/0.735925.97/0.780930.43/0.9063
SMFANet [22] 1971132.25/0.895628.71/0.783327.64/0.737726.18/0.786230.82/0.9104
ESRT [43] 75229832.19/0.894728.69/0.783327.69/0.737926.39/0.796230.75/0.9100
SwinIR-light [9] 9306532.44/0.897628.77/0.785827.69/0.740626.47/0.798030.92/0.9151
ELAN-light [44] 6405432.43/0.897528.78/0.785827.69/0.740626.54/0.798230.92/0.9150
NGswin [45] 10194032.33/0.896328.78/0.785927.66/0.739626.45/0.796330.80/0.9128
SPIN [46] 5554232.48/0.8983 28.80/0.786227.70/0.741526.55/0.799830.980.9156
EFRDN [47] 7673032.33/0.896428.67/0.783327.63/0.738426.37/0.793930.76/0.9113
SRFormer-light [48] 8736332.51/0.8988 28.82/0.7872 27.73/0.742226.67/0.7422 31.17/0.9165
MambaIRv2-light [49] 7907632.51/0.899228.84/0.787827.75/0.742626.82/0.742631.24/0.9182
Ours5753032.44/0.898328.86/0.7867 27.74/0.7407 26.49/0.795931.20/0.9159
Table 5. Comparison of quantitative test results before and after the restoration of rice spike maturity inspection.
MethodStagePRmAP50
Early0.8360.3170.480
BeforeMiddle0.5560.4930.517
RestorationLate0.5640.3390.382
Average0.6520.3830.460
Early0.8650.6630.829
AfterMiddle0.7550.7510.819
RestorationLate0.7160.5810.678
Average0.7790.6650.775
Table 6. Comparison of quantitative test results before and after the recovery of rice leaf pests and diseases.
MethodTypePRmAP50
Leaf_Blight0.9620.9440.971
BeforeBrown_Spot0.9300.7740.896
RestorationLeaf_smut0.9370.9560.979
Average0.9430.8910.949
Leaf_Blight0.9770.9350.989
AfterBrown_Spot0.9480.8430.945
RestorationLeaf_smut0.9710.9660.991
Average0.9650.9140.975
Table 7. Under ×4 for ablation comparison.
AblationVariantRice_Panicle
PSNR/SSIM
Rice_Healthy
PSNR/SSIM
BaselineADFSR30.31/0.861730.73/0.8432
HLFBHFB−30.14/0.856930.53/0.8375
LFB−30.10/0.856930.50/0.8362
HFB × 230.20/0.858530.58/0.8391
LFB × 230.58/0.839130.64/0.8402
Module VariablesDMSOP−30.31/0.861530.72/0.8430
ASSA−30.29/0.861030.70/0.8424
LFFN−30.28/0.860630.68/0.8420
Weight modulationNo weight30.28/0.861230.72/0.8428
Competitive  weight130.30/0.861630.70/0.8426
Competitive  weight230.30/0.861130.72/0.8428
Disclaimer/Publisher’s Note: The statements, opinions and data contained in all publications are solely those of the individual author(s) and contributor(s) and not of MDPI and/or the editor(s). MDPI and/or the editor(s) disclaim responsibility for any injury to people or property resulting from any ideas, methods, instructions or products referred to in the content.

