1. Introduction
Cotton (
Gossypium hirsutum L.) is the most important fiber crop and is commercially grown worldwide, including in China [
1]. According to the National Bureau of Statistics of China (NBSC), China’s cotton acreage reached 2.84 × 10
6 hectares in 2024, with a total output of more than 6 million tons in that year. Transgenic
Bacillus thuringiensis cotton (Bt cotton) is a cotton cultivar with insect-resistant characteristics, obtained by introducing the Bt toxin protein gene from
Bacillus thuringiensis species into cotton [
2]. Bt cotton is grown commercially worldwide due to the insecticidal properties of the entire plant, including the vegetative and reproductive organs [
3,
4]. Its application is conducive to reducing not only the cost of cotton cultivation but also the use of chemical pesticides, thereby enhancing labor safety and reducing environmental pollution [
5,
6,
7].
However, the expression of insect resistance in Bt cotton varies significantly with environmental conditions [
8,
9], and an association has been shown between reduced cotton insect resistance and reduced Bt protein content [
10,
11]. A favorable temperature is crucial for crop growth, and low- or high-temperature stress not only affects the growth of Bt cotton but also the expression of Bt protein. Low-temperature stress at the square stage significantly inhibited the expression of Bt protein in cotton squares and their subtending leaves; this inhibition intensified with a decreasing temperature and more prolonged stress, with a maximum decrease in the Bt protein content of 30% recorded [
7]. Similar findings were obtained when studying the effects of low temperatures on cotton bolls’ Bt protein content [
12]. High temperatures cause a decrease in cotton’s Bt protein content as well. According to Wang, high temperatures below 38 °C resulted in a slight decrease in the Bt protein content in squares, but high temperatures above 38 °C resulted in a significant decrease in Bt protein [
13]. Liu et al. [
14] found that the longer cotton was exposed to high-temperature stress, the longer it took for its Bt protein concentration to return to normal levels. Bt cotton that had suffered water deficits showed reduced Bt protein content in its leaves, flowers and bolls [
15], while a field soil water content below 60% of the field capacity caused a significant reduction in boll shells’ Bt protein content [
16]. The combined stress from drought and high temperatures significantly reduced the Bt protein content in cotton bolls, with drought having a greater effect on the Bt protein concentration and insect resistance in Bt cotton [
17]. Salt stress also significantly decreased Bt cotton’s insecticidal protein content [
18,
19]. It has been reported that this decrease in the Bt protein content under adversity may be related to a decrease in the soluble protein and total nitrogen content and NR, GS, GOT and GPT activities [
20,
21].
In addition to environmental factors, temporal and spatial variations in the Bt protein content in different organs and growth stages also result in changes in the cotton’s insect resistance [
22,
23]. In detail, temporally, it was found that the Bt protein content tended to decrease during the growth process and was lowest at the flowering and boll setting stage [
11,
24]; spatially, the Bt protein content was higher in vegetative than reproductive organs and the highest in leaves [
22,
25].
Therefore, it is essential to improve the stability of the Bt protein in Bt cotton. Several studies have previously been conducted by researchers to explore ways of enhancing the Bt protein content. According to these studies, agronomic measures, including fertilizer application, modulating the planting density, removing early fruit branches and applying plant growth regulators, can regulate the Bt protein content of Bt cotton [
25,
26,
27,
28]. For example, nitrogen application affects the activities of GOT and GPT, reducing the protein synthesis capacity in cotton plants and, in turn, affecting their Bt protein content and insect resistance [
29]. Pettigrew and Adamczyk [
30] concluded that the use of nitrogen fertilizer increased the chlorophyll and Bt protein content in leaves. Guo et al. [
26] reported that moderate nitrogen fertilizer application was beneficial in promoting cotton plant development and Bt insecticidal protein expression.
However, previous studies mainly focused on squares, bolls and their subtending leaves, neglecting to study flowers [
20,
25]. As a reproductive organ, the flower has a very low Bt protein content, which makes it more vulnerable to bollworms, especially as the flower is one of the main targets of bollworms and other insects [
31]. Bollworms can cause serious damage, affecting pollination and boll formation and resulting in boll abscission and ultimately yield reduction [
32]. Thus, this study focused on increasing the Bt protein content in cotton flowers, which were treated with varying levels of nitrogen fertilizer application to explore its effects on the flower Bt protein content and related physiological mechanisms.
2. Materials and Methods
This study was carried out on a farm at Yangzhou University (32°30′ N, 119°25′ E; shown in
Figure 1), China, during the cotton growth seasons in 2021 and 2022 [
14]. We used a 525 m
2 test plot and two Bt cotton (
Gossypium hirsutum L.) cultivars, the conventional cultivar Sikang1 (S1) and the hybrid cultivar Sikang3 (S3). S1 was developed through the hybridization of Siyang 269 × Guokang 22, while S3 was derived from a Siyang 231 × Siyang 8201 cross. Both cultivars carried the introduced
Cry1Ac Bt gene. Furthermore, these were the primary commercial cultivars in China’s Yangtze River Valley cotton region during the early 2000s. The experimental site had sandy loam soil (typical fluvaquents and Entisols (U.S. taxonomy)). Specific indicators of the soil’s physicochemical properties are shown in
Table 1. Seeds were sown in the greenhouse on 13 April 2021 and 15 April 2022, and seedlings were transplanted to the field on 15 May 2021 and 17 May 2022. The planting density was 37,500 plants per hectare for S1 and 27,000 plants per hectare for S3 in both years.
Five levels of nitrogen application were used: 300 (CK, normal level), 375 (N1, 25% increase), 450 (N2, 50% increase), 525 (N3, 75% increase) and 600 (N4, 100% increase) kg·ha−1. The soil was top-dressed with nitrogen (urea) after transplantation, at early flowering and at peak flowering at proportions of 20%, 20% and 60%, respectively. The application of K (375 kg ha−1 provided as KCl) and P (600 kg ha−1 provided as single superphosphate) was kept the same for all treatments, with proportions of 50% used both after transplantation and at early flowering. Intertilling and weeding were carried out twice during the growing period; irrigation was carried out according to the drought conditions.
A split plot design with three replications was used. The main plots were assigned to the two cultivars (S1 and S3), while the five nitrogen application rates (CK, N1, N2, N3 and N4) constituted the subplots.
2.1. Measurements
At the peak flowering stage, the first flowers were collected from the first position of the tenth fruiting branches of plants in the middle two rows of each plot. For each replication, 10 plants were selected, and one flower was collected from each. The samples were stored at −80 °C until later measurements.
The Bt protein content was analyzed using an immunological analysis, ELISA, according to Chen [
33]. The free amino acid concentration was estimated using the ninhydrin assay described by Yemm [
34], while the soluble protein concentration was determined using Bradford’s Coomassie Blue dye-binding assay [
35]. Following the procedure described by Chen [
7], 0.2 g of fresh sample was ground in 1.5 mL of a Tris–HCl buffer (0.05 mol·L
−1) at 4 °C, and the homogenate was centrifuged at 20,000×
g for 20 min. The supernatant was used to determine the glutamic oxaloacetic transaminase (GOT) and glutamic pyruvic transaminase (GPT) activities. We followed the procedure described by Liu [
36] and Liu [
37] to obtain supernatants for the estimation of the glutamine synthetase (GS) and glutamate synthetase (GOGAT) activities: fresh samples (0.2 g) were ground in 1.5 mL of a 0.1 mol·L
−1Tris–HCl buffer (1 mmol·L
−1 of MgCl
2, 1 mmol·L
−1 of LEDTA and 10 mmol·L
−1 of 2-mercaptoethanol) at pH 7.6 and 4 °C, and then the homogenates were centrifuged at 13,000 r·min
−1 for 25 min. To obtain supernatants for protease activity determination using Vance’s method [
38], the samples (0.8 g) were homogenized at 4 °C in 1 mL of a β-mercaptoethanol extraction buffer (a mixture of ethylene glycol, sucrose and phenylmethylsulfonyl fluoride at pH 6.8). Fresh samples (0.5 g) were homogenized in 8 mL of a Tris–HCl buffer (4 mM of DTT, 4 mM of EDTA, 1% PVP, pH 7.5) at 4 °C to measure the peptidase activity [
39].
To verify the actual insecticidal activity in the two Bt cotton cultivars examined, we conducted a feeding experiment using S1 and S3 flowers treated with the CK and N3 in 2022. This experiment was performed on the second instar larvae of bollworms in an artificial climate chamber at the Jiangsu Key Laboratory of Crop Genetics and Physiology. The eggs were purchased from Beijing Bloomnost Biotechnology Co. (Beijing, China). The conditions in the climate chamber were set at 25–28 °C, 80% relative humidity and a photoperiod of 16:8 h (L:D). Three replicates were set up for each treatment, and 48 s instar bollworm larvae were fed for each replicate. Fresh flowers from S1 and S3 treated with the CK and N3 were collected for the experiment, and the feed was replaced every two days. The dead larvae were counted on the third (3 d) and fifth days (5 d) after feeding began to calculate the mortality rate.
2.2. Statistical Analysis
A two-way ANOVA (ANOVA 2) was performed in SAS 9.4. The means were separated using an LSD test at the 5% significance level, and Pearson’s correlation coefficient was used to measure the relationships in the data after normalization. The tables and figures were processed and plotted with Excel 2019 and Origin 2021, while stepwise regression and path analysis were performed using SPSS 26. The experimental units used for data analysis were the plot means. In addition, Q-Q (Quantile–Quantile) plots were used to test the data’s normality, which was shown to be good, with the data points falling roughly around the diagonal of the Q-Q plot. In order to test the variance homogeneity, a Levene test was carried out. The results indicated variance homogeneity (p = 0.134), and, therefore, a standard ANOVA could be performed on the data.
After the data were normalized using Z-score normalization, stepwise regression analysis was performed to establish the optimal linear regression equations. We used the Bt protein content (Y) as the dependent variable and the soluble protein (X1) and free amino acid content (X2) and the GOT (X3), GPT (X4), GS (X5), GOGAT (X6), protease (X7) and peptidase activities (X8) as the independent variables.
Path analysis quantified the causal relationships between key predictors (X) identified via the stepwise regression and the response variable (Y; the Bt protein content). This method simultaneously partitions direct and indirect effects, establishing a robust foundation for inferential statistical decisions in agronomic trait studies. The computational framework followed the work of Liu [
27] and Mahmoud [
40] with adaptations for cotton physiology data.
The formulas used in the path analysis were as follows:
where
Pyi and
Pyij represent the direct and indirect path coefficients, respectively. The diameter coefficient
rij is the correlation coefficient between the independent variable
i and dependent variable
j;
bi is the partial regression coefficient of the dependent variable
y on the independent variable
i; and
si and
sy represent the standard deviations of the independent variable
i and dependent variable
y, respectively.
5. Conclusions
Increased nitrogen fertilizer application significantly increased the flowers’ Bt protein content, which reached a maximum at N3 (a 75% increase), and this change was closely related to nitrogen metabolism. The soluble protein and free amino acid contents increased under increased nitrogen fertilizer application conditions; similarly, the GOT, GPT, GS and GOGAT activities were elevated, but the protease and peptidase activities decreased. Stepwise regression and path analysis indicated that, among all the indicators, the GS and GOT activities were the most essential in determining the Bt protein content. In addition, because the response of the Bt protein content to changes in nitrogen application did not differ significantly between the two varieties examined (the conventional cultivar S1 and the hybrid cultivar S3), it was feasible to increase the Bt protein content in both by enhancing the soil nitrogen fertilizer application. Based on the results of this study, we recommend that smallholders plant conventional cultivars when aiming to improve Bt cotton’s insect resistance through appropriate increases in nitrogen fertilizer application. This is because, in actual production, hybrid cultivar seeds are more expensive than those of conventional varieties, so planting conventional cultivars can not only improve insect resistance but also decrease the production cost, increasing smallholders’ income. To sum up, under specific agronomic conditions, appropriately increasing nitrogen fertilizer application may be a practical way to increase flowers’ Bt protein content and insecticidal efficacy.


 and
and 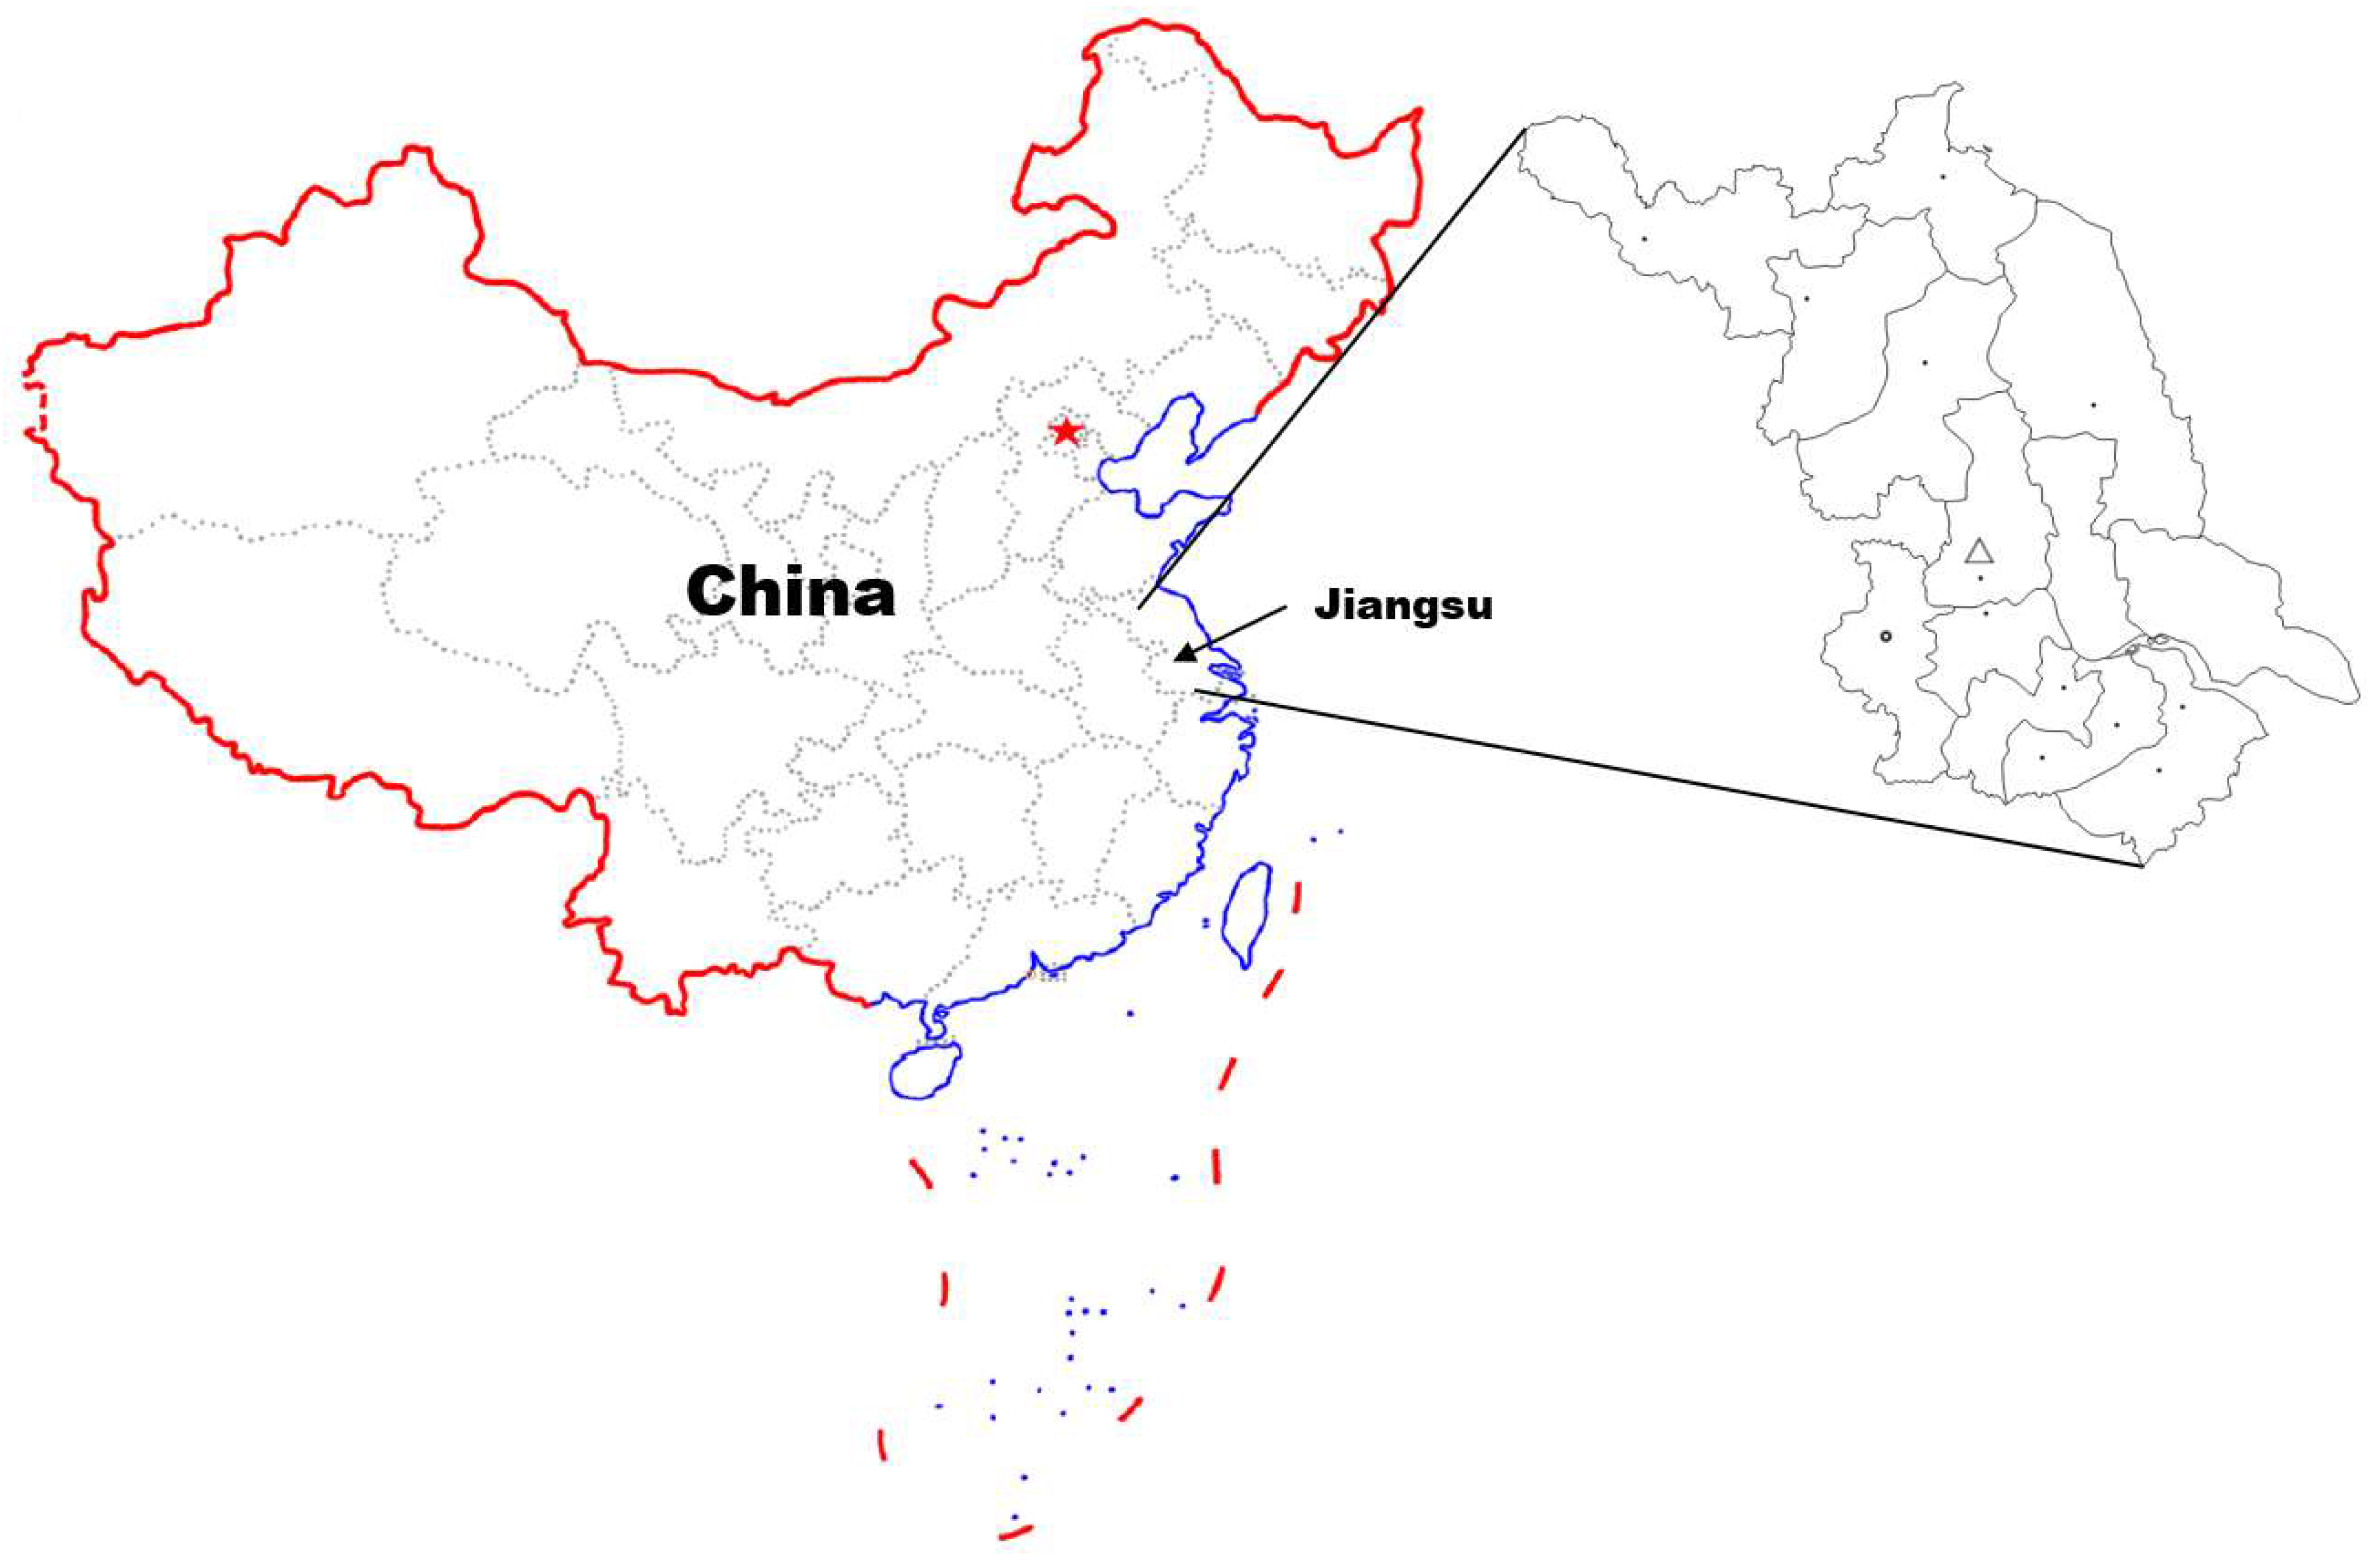


