Article

Optimizing Sunflower Cultivar Selection Under Climate Variability: Evidence from Coupled Meteorological-Growth Modeling in Arid Northwest China

1
College of Agriculture, Tarim University, Alar 843300, China
2
Crop Research Institute of Xinjiang Academy of Agricultural Reclamation Sciences, Shihezi 832000, China
3
Key Laboratory of Genetic Improvement and Efficient Production of Characteristic Crops in Arid Areas of Southern Xinjiang, Xinjiang Production and Construction Corps, Alar 843300, China
4
College of Agriculture/Key Laboratory of Oasis Agricultural Pest Management and Plant Protection Resources Utilization, Xinjiang Uygur Autonomous Region, Shihezi University, Shihezi 832003, China
*
Authors to whom correspondence should be addressed.
These authors contributed equally to this work.
Agronomy 2025, 15(7), 1724; https://doi.org/10.3390/agronomy15071724
Submission received: 20 May 2025 / Revised: 3 July 2025 / Accepted: 9 July 2025 / Published: 17 July 2025
(This article belongs to the Section Agroecology Innovation: Achieving System Resilience)

Abstract

Under the scenario of global climate warming, meteorological risks affecting sunflower cultivation in Xinjiang’s 10th Division were investigated by developing a meteorological-growth coupling model. Field experiments were conducted at three representative stations (A1–A3) during 2023–2024 to assess temperature and precipitation impacts on yield and quality traits among sunflower cultivars with varying maturation periods. The main findings were: (1) Early-maturing cultivar B1 (RH3146) exhibited superior adaptation at low-temperature station A1, achieving 12% higher plant height and an 18% yield increase compared to regional averages. (2) At thermally variable station A2 (daily average temperature fluctuation ± 8 °C, precipitation CV = 25%), the late-maturing cultivar B3 showed enhanced stress resilience, achieving 35.6% grain crude fat content (15% greater than mid-maturing B2) along with 8–10% increases in seed setting rate and 100-grain weight. These improvements were potentially due to optimized photoassimilated allocation and activation of stress-responsive genes. (3) At station A3, characterized by high thermal-humidity variability (CV > 15%) during grain filling, B3 experienced a 15-day delay in maturation and a 3% reduction in ripeness. Two principal mitigation strategies are recommended: preferential selection of early-to-mid maturing cultivars in regions with thermal-humidity CV > 10%, improving yield stability by 23%, and optimization of sowing schedules based on accumulated temperature-precipitation modeling, reducing meteorological losses by 15%. These evidence-based recommendations provide critical insights for climate-resilient cultivar selection and precision agricultural management in meteorologically vulnerable agroecosystems.

1. Introduction

Climate change, driven by both natural variability and human activities, continues to intensify global warming and amplify the frequency of extreme weather events, posing substantial threats to agricultural productivity worldwide. Exceeding a 2 °C global temperature increase is projected to dramatically increase the frequency of extreme heat events, jeopardizing agricultural systems and global food security [1]. Consequently, it has become imperative to re-evaluate and optimize agricultural strategies to mitigate these climate-driven risks effectively [2]. Among strategic crops particularly suited to adapting to climate variability, sunflower (Helianthus annuus L.) emerges as highly advantageous due to its intrinsic drought resistance, salt tolerance, and notable economic value. These traits make it especially valuable in arid and semi-arid regions of China [3]. Sunflowers possess a deep rooting system extending 2–3 m, enabling efficient utilization of limited soil moisture, especially crucial in areas with annual precipitation below 400 mm. This characteristic renders sunflower particularly suitable for reclaiming marginal lands, such as saline-alkali regions and desert environments. In Beitun City, located within Xinjiang’s 10th Division—a critical agricultural region in China—sunflower cultivation faces considerable threats due to frequent and intense climatic variability. Local meteorological data indicate significant yield fluctuations exceeding 15% annually when temperature variability expands to ±8 °C and precipitation variability surpasses a 25% coefficient of variation (CV) [4]. The Food and Agriculture Organization (FAO) further underscores sunflower sensitivity to climatic fluctuations, noting that even minor deviations of 1 °C from optimal temperature ranges can result in yield reductions of approximately 4–7% [4]. Despite this vulnerability, existing cultivar selection practices in Beitun City inadequately integrate climatic variability considerations, resulting in limited resilience against extreme weather events. This gap highlights an urgent need for advanced cultivar selection frameworks explicitly tailored to address meteorological risks [5].
To address these critical challenges, this study introduces an innovative maturity suitability model designed for sunflower cultivars, dynamically quantifying the impacts of meteorological variability on crop physiological traits and yield formation. Distinct from conventional static selection approaches, this model actively incorporates dynamic relationships between climate variability and sunflower physiological processes. It specifically evaluates how variations exceeding defined thresholds (e.g., CV > 15%) activate stress responses at physiological and molecular levels, thus informing practical cultivar selection decisions [6,7]. Several technical terms central to this model warrant simplified explanations. “SWEET17” is a protein transporter responsible for moving fructose into plant cell vacuoles (storage compartments), maintaining sugar stability critical for seed development and lipid production. Heat-induced reductions in SWEET17 expression hinder fructose storage, adversely affecting seed quality. “Dual-pathway blockage” refers to the concurrent disruption of two primary hormone signaling pathways—abscisic acid (ABA) and ethylene—which are crucial for regulating stress responses, including plant senescence (aging) and resource distribution. Climatic stress-induced disruptions in these pathways markedly decrease grain-filling rates by approximately 22–29% and photosynthetic transport efficiency by 34–41%, thereby significantly impairing overall yield [8,9,10,11]. By explicitly integrating these physiological parameters, meteorological thresholds, and cultivar-specific responses, our maturity suitability model fills the critical gap observed in current cultivar selection practices.
Considering the outlined challenges, our study specifically aims to: (1) Develop and validate a coupled meteorological-growth model tailored for sunflower cultivars to quantify their physiological responses to climatic variability; (2) Identify key meteorological thresholds influencing yield and quality traits across sunflower cultivars differing in maturity stages; (3) Propose practical mitigation strategies through optimized cultivar selection and sowing schedules, thereby enhancing yield stability and climatic resilience. Ultimately, this research seeks to foster climate resilience through scientifically informed cultivar selection and precision agricultural management strategies, thereby strengthening regional food security, reducing agricultural vulnerability, and aligning with global sustainability objectives such as Sustainable Development Goals 2 (Zero Hunger) and 13 (Climate Action) [12,13,14,15,16].

2. Materials and Methods

2.1. Experimental Design and Site Characteristics

Field experiments were conducted from 2023 to 2024 at random selection of three test sites (A1: 48° N, 88° E; A2: 46° N, 85° E; A3: 47° N, 87° E) in Beitun City, Xinjiang, China, characterized by a warm temperate arid desert climate. Three sunflower hybrids with distinct maturation periods were selected: early-maturing cultivar B1 (RH3146, early-maturing varieties officially registered <100 days Seed supplier: CHS Company of the United States IGH), mid-maturing cultivar B2 (SH361, mid-maturing varieties officially registered 100–130 days Seed supplier: Sanrui Agricultural Technology Co., Ltd., Nei Monggol Autonomous Region, China), and late-maturing cultivar B3 (X3939, late-maturing varieties officially registered >130 days Seed supplier: Sanrui Agricultural Technology Co., Ltd., Nei Monggol Autonomous Region, China). The area of each test site’s plot was 1 hectare, and a completely randomized block design was adopted. Sunflowers were planted in wide and narrow rows (40 cm + 90 cm) under standardized management practices. Soil fertility conditions for each site were previously reported [16]. Drip irrigation supplied water at 2800–3900 t·ha−1, and planting density ranged from 1800 to 2200 plants·ha−1. Hourly meteorological data (temperature and precipitation) were collected throughout the 2023 and 2024 growing seasons from weather stations at each experimental site and summarized according to phenological stages. Bars indicate the mean ± standard error of the mean (SEM) (n = 30 plants/site-genotype). Different lowercase letters indicate significant differences (Tukey’s HSD, α = 0.05).

2.2. Agronomic Traits and Data Collection

Physiological and agronomic parameters, including phenological progression, yield components (seed setting rate, 100-seed weight), and quality traits (crude fat content via Soxhlet extraction), were systematically assessed. Thermal–hydrological thresholds for stress conditions were quantified: flowering-phase heat stress (>30 °C daily) and grain-filling low-temperature inhibition (<15 °C).

2.3. Site-Specific Hydrothermal Regimes Across Phenological Stages

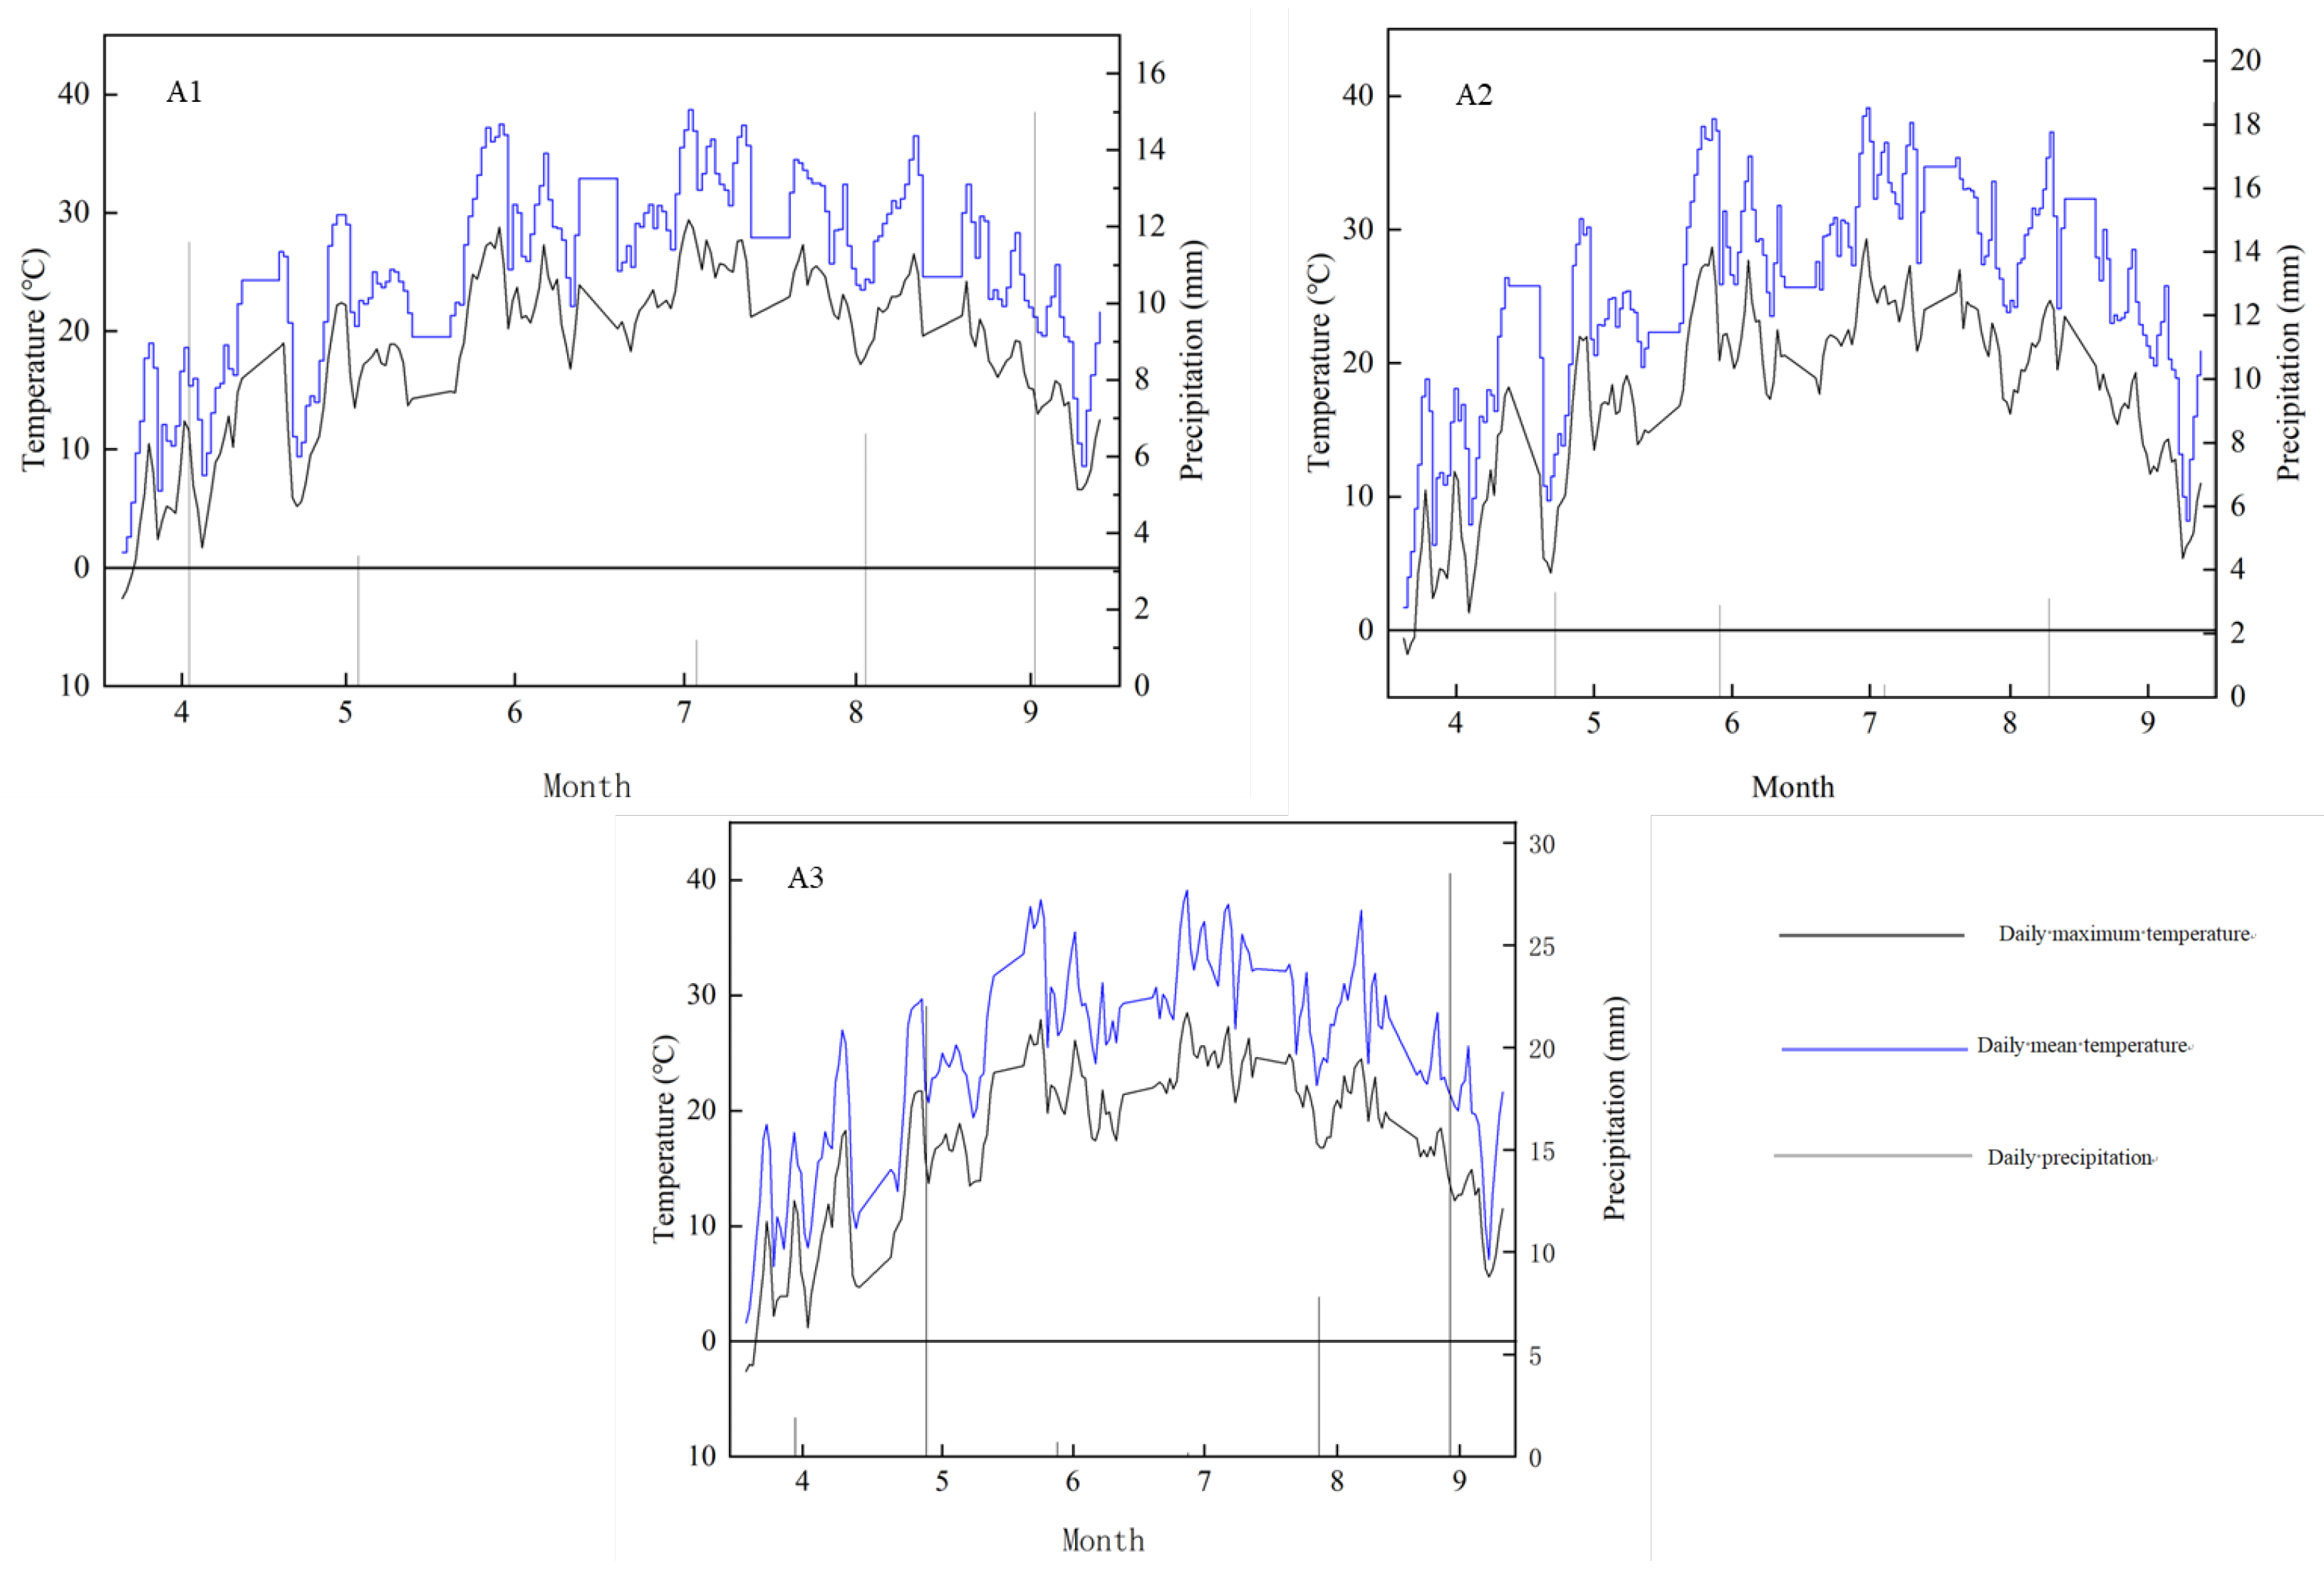
Analysis of site-specific hydrothermal conditions during critical sunflower phenophases revealed three distinct patterns: (1) Hydrological divergence occurred, with 15% higher irrigation at the bud stage at site A3 (230 mm) compared to site A1 (200 mm), while site A2 (Beitun) received peak water supply (300 mm) during flowering; (2) Thermal stratification showed consistently cooler temperatures at site A1 (early growth: 13–25 °C; late growth: 18–29 °C) compared to warmer conditions at site A2 (15–32 °C) and intermediate temperatures at site A3 (13–29 °C); (3) Radiation consistency was evident across sites, with synchronized peak sunshine hours during the flowering-to-maturity period (A1: 380 h; A2: 410 h; A3: 395 h), aligning with regional solar periodicity (Figure 1).

2.4. Seed Morphometric Profiling

Seed dimensional traits were measured using a calibrated phenotyping platform (TPKZ-3-L, Beijing LiGaotai Technology Co., Ltd., Beijing, China). Mature seeds (n = 250 per cultivar-site group) were placed ventral side down on an anti-reflective stage and imaged at 2400 dpi resolution under standardized LED illumination (5000 K ± 5% Cool Net Optoelectronics Technology (Shanghai) Co., Ltd., Shanghai, China). High-resolution images were processed using ImageJ v1.53 (Developed by the National Institutes of Health of the United States), employing a custom algorithm with edge detection (Canny operator, σ = 1.0) and morphological filtering. Length (major axis) and width (minor axis) measurements were extracted from fitted ellipses. System accuracy was validated periodically against geometric calibration standards (certified tolerance ± 0.015 mm). Morphometric outliers exceeding ± 3 standard deviations from cultivar-specific means, primarily attributed to measurement errors, were excluded to ensure data integrity (Table 1).
Fat cont ent ( % )   = m sample + fat m bottle m sample × 100 %
Note: msample represents sample quality; mbottle represents bottle quality.

2.5. Grain Protein and Fat Content

Total nitrogen content was determined using the micro-Kjeldahl method (K9840 analyzer Shanghai Lijing Scientific Instrument Co., Ltd., Shanghai, China). Freeze-dried seed powder (0.100 ± 0.001 g) was digested with 10 mL concentrated sulfuric acid (H2SO4, 98% Changsha Rongqing Chemical Products Co., Ltd.) and 5 g catalyst mixture (K2SO4:CuSO4:SeO2 = 10:1:0.1 Changsha Rongqing Chemical Products Co., Ltd.) at 420 °C for 85 min in a block digestion system. The digested sample was distilled with 40% NaOH (Changsha Rongqing Chemical Products Co., Ltd.), and liberated ammonia was titrated with 0.1 M HCl (Changsha Rongqing Chemical Products Co., Ltd.). Protein content was calculated as nitrogen percentage × 6.25, validated against NIST SRM 3234 (soy flour reference material, recovery rate 98.2–101.5%).
Crude fat content was analyzed using Soxhlet extraction (BUCHI B-811 system Gerhardt). Dehulled seeds were dried at 105 °C for 4 h to constant weight (±0.1 mg) and ground through a 40-mesh sieve. Aliquots (2–5 g ± 0.001 g) were encapsulated in Whatman Grade 1 filter paper. Petroleum (C5H12) ether (boiling range: 40–60 °C Shanghai Shensheng Technology Co., Ltd., Shanghai, China) was refluxed at 6 cycles·h−1 for 8 h. After extraction, the solvent was recovered using rotary evaporation (40 °C, 200 mbar), and residual lipid content was quantified gravimetrically. Method precision was confirmed through triplicate analyses (CV < 1.2%), with blank corrections applied using pre-extracted control samples.

2.6. Data Analysis

Data were organized in Microsoft Excel 2016 (Microsoft Corporation Redmond, Washington, USA) and statistically analyzed using SPSS 26.0 (IBM Lake Michigan, USA). Correlation analyses between meteorological parameters and sunflower traits were conducted in OriginPro 2021 (OriginLab Northampton, Massachusetts, USA)(Correlation Plot module, Pearson method). One-way analysis of variance (ANOVA) with post hoc Least Significant Difference (LSD) testing assessed treatment effects. Statistical significance was set at α = 0.05.

3. Results and Analysis

3.1. Differential Hydrothermal-Radiation Regimes Across Critical Phenophases

3.1.1. Influence of Meteorological Factors on Sunflower Plant Height

Sunflower plant height displayed significant spatial and genotypic variability under distinct meteorological conditions (Figure 2). Late-maturing cultivars (X3939) exhibited 5.73–15.85% greater height (164.83–177.17 cm) compared with early-maturing counterparts (RH3146, SH361) at sites A1 and A2 (p < 0.05, ANOVA with Tukey’s HSD), consistent with their longer vegetative growth period (120–135 days). In contrast, late-maturing varieties at site A3 had 5% reduced mean height (168 cm) compared to early-maturing cultivars at the same site, indicating genotype-environment (G × E) interaction reversal.
Although meteorological conditions caused significant inter-varietal height differences (p < 0.01), specific treatment pairs (A2B2 vs. A1B2; A1B3 vs. A3B2) did not differ significantly (p > 0.05), suggesting threshold-dependent responses. This variability suggests excessive thermal amplitude may disrupt auxin-mediated internodal elongation in late-maturing genotypes, offsetting their inherent advantage in growth duration.
Experimental sites: A1 (Beitun: 48° N, 88° E), A2 (Site 183: 46° N, 85° E), A3 (Site 181: 47° N, 87° E). Genotypes: B1 (RH3146, early-maturing varieties), B2 (SH361, mid-maturing varieties), B3 (X3939, late-maturing varieties).

3.1.2. Meteorological Drivers of Leaf Area Development and Genotypic Responses

Leaf area measurements were obtained using an LI-3100C (China, Beijing, Beijing Lihao Tai Technology Co., Ltd.) desktop leaf area meter, ensuring leaves remained clean and flat for data accuracy. Sunflower leaf area demonstrated clear sensitivity to thermal and hydrological thresholds, with optimal expansion at 20–25 °C (Figure 3). Suboptimal temperatures (<15 °C) suppressed cell division, reducing single-leaf area by 32.7 ± 4.1% (p < 0.01), whereas heat stress (>35 °C) accelerated senescence, increasing leaf area index (LA) decline rates by 48–53% (p < 0.001). Hydrological modulation identified critical thresholds: peak LA (6.2 ± 0.3 m2·m−2) occurred at 60–70% field capacity (FC) during flowering. Drought (<40% FC) reduced total leaf area by 22.4 ± 3.8% due to ABA-mediated cytokinin suppression. Late-maturing genotypes showed greater vulnerability, with site A3–B3 plants exhibiting an 18.0% lower leaf area (499.75 vs. 609.63 cm2) under combined heat (ΔT +3.5 °C) and drought (18-day precipitation deficit).
Observed LAI gradients (A1 [6.8] > A3 [5.1] > A2 [4.3]) reflected cumulative stress exposure, identifying synergistic thresholds: soil moisture <60% FC combined with T > 32 °C resulted in an LAI reduction of 19.3 ± 2.7%. Proactive irrigation at A1 during heatwaves (soil moisture > 75% FC) mitigated LAI loss by 38%, highlighting actionable management strategies. These thresholds, coupled with photoperiod interactions (daylight > 14 h extended vegetative growth by 8 days, increasing leaf area by 16.7% under optimal irrigation), provide quantitative benchmarks for arid-region agriculture, balancing water conservation and photosynthetic efficiency.

3.1.3. Effects of Meteorological Factors on Sunflower Stem Thickness

Stem diameter was measured using Vernier calipers (37-200-23C, 0–100 mm). Results showed no significant intergroup differences in soil fertility (F = 1.97, p = 0.36). Factor A (experimental sites) exhibited highly significant variation (F = 49.01, p < 0.01), while factor B (varieties) showed significant differences (F = 12, p = 0.95). Interaction effects (A × B) were not significant (F = 0.40, p = 0.80) (Table 2).
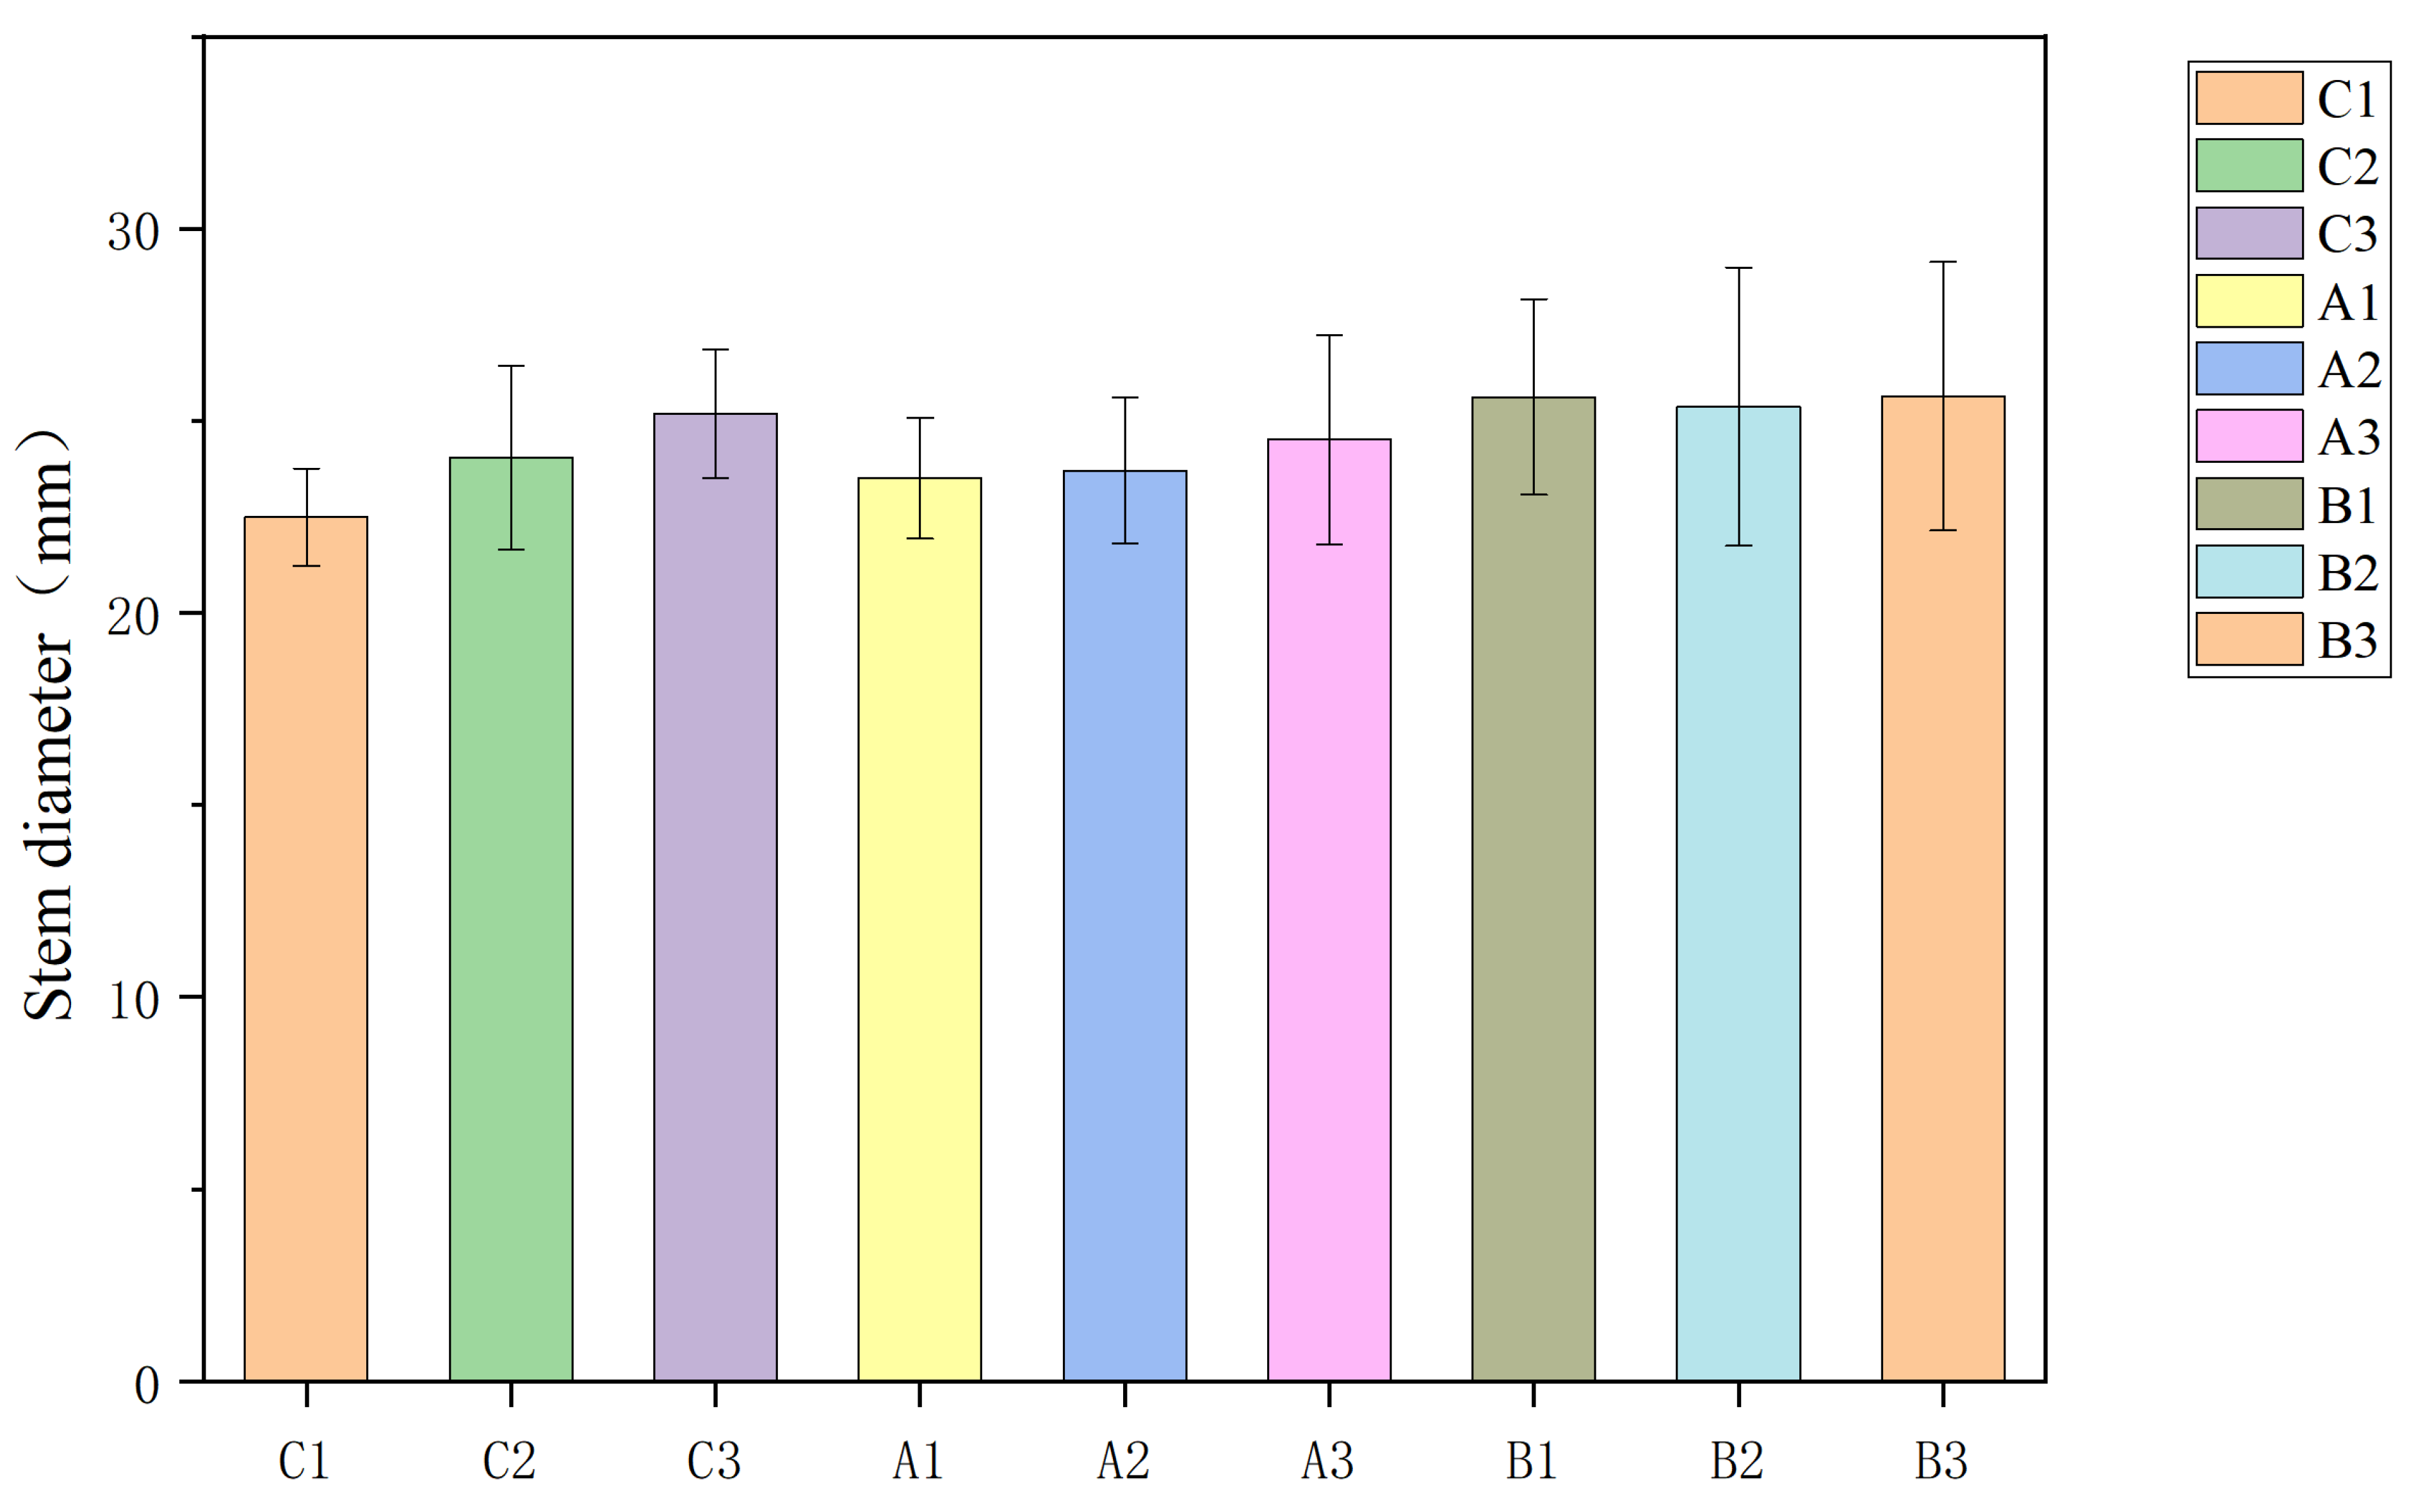
Stem thickness did not significantly differ among growth stages at the three experimental sites. However, a separate temperature-focused ANOVA demonstrated significant correlations between air temperature and stem thickness variation (p < 0.05). Growth-period analysis (Figure 4, A1–A3) indicated daily stem-thickening rates of 0.3–0.5 mm at 25 °C, compared to 0.1–0.2 mm at 15 °C. Plants exposed to diurnal temperature fluctuations (30 °C day/20 °C night, DTR = 10 °C) exhibited 15–20% greater stem thickening compared to constant 25 °C, due to reduced nocturnal respiratory expenditure, promoting biomass allocation to stems.

3.2. Effects of Meteorological Factors on Sunflower Physiology and Biochemistry

3.2.1. Thermal Regulation of Dry Matter Allocation

During grain filling, dry matter allocation showed distinct organ-specific patterns across experimental sites (Figure 5). Reproductive organs (capitula) accumulated 18–23% higher dry mass than stems at all sites, indicating prioritized resource allocation to reproduction. Genotypic differences emerged in dry matter partitioning: the late-maturing cultivar (B3) consistently outperformed B2 and B1 in capitulum dry mass (B3 > B2 > B1), except under the A2B1 treatment, where stem dry mass exceeded capitulum mass by 12.5%. This anomaly correlated with premature senescence in early-maturing varieties, evidenced by 35% lower leaf chlorophyll content (SPAD) during late grain filling.
Temperature significantly influenced dry matter dynamics (Table 3). Strong positive correlations existed between mean temperature and organ-specific dry matter accumulation, with stems showing an r-value of 0.78 (F (1,18) = 6.32, p = 0.008) and capitula an r-value of 0.82 (F (1,18) = 8.15). These relationships indicate that each 1 °C increase in temperature results in an 8.3% increase in stem dry matter and an 11.7% increase in capitulum dry matter. The correlation between capitulum and stem dry matter (r = 0.65, p = 0.02) indicates resource competition thresholds. When stem allocation exceeded 45% of total dry mass, capitulum accumulation decreased by 19.2 ± 3.1% (p < 0.05), indicating sink limitation under thermal stress. A multivariate regression model quantified these dynamics as:
Y = 1.27 (±0.15) Tavg + 0.64 (±0.08) H − 2.89 (±0.42) + ϵ (Radj2 = 0.86, p < 0.001)
where Y is dry matter content (g·plant−1), Tavg represents mean daily temperature (°C), H represents relative humidity (%), and ε is the residual error (σ = 0.23).

3.2.2. Influence of Meteorological Factors on Sunflower Physiological Activity Indicators

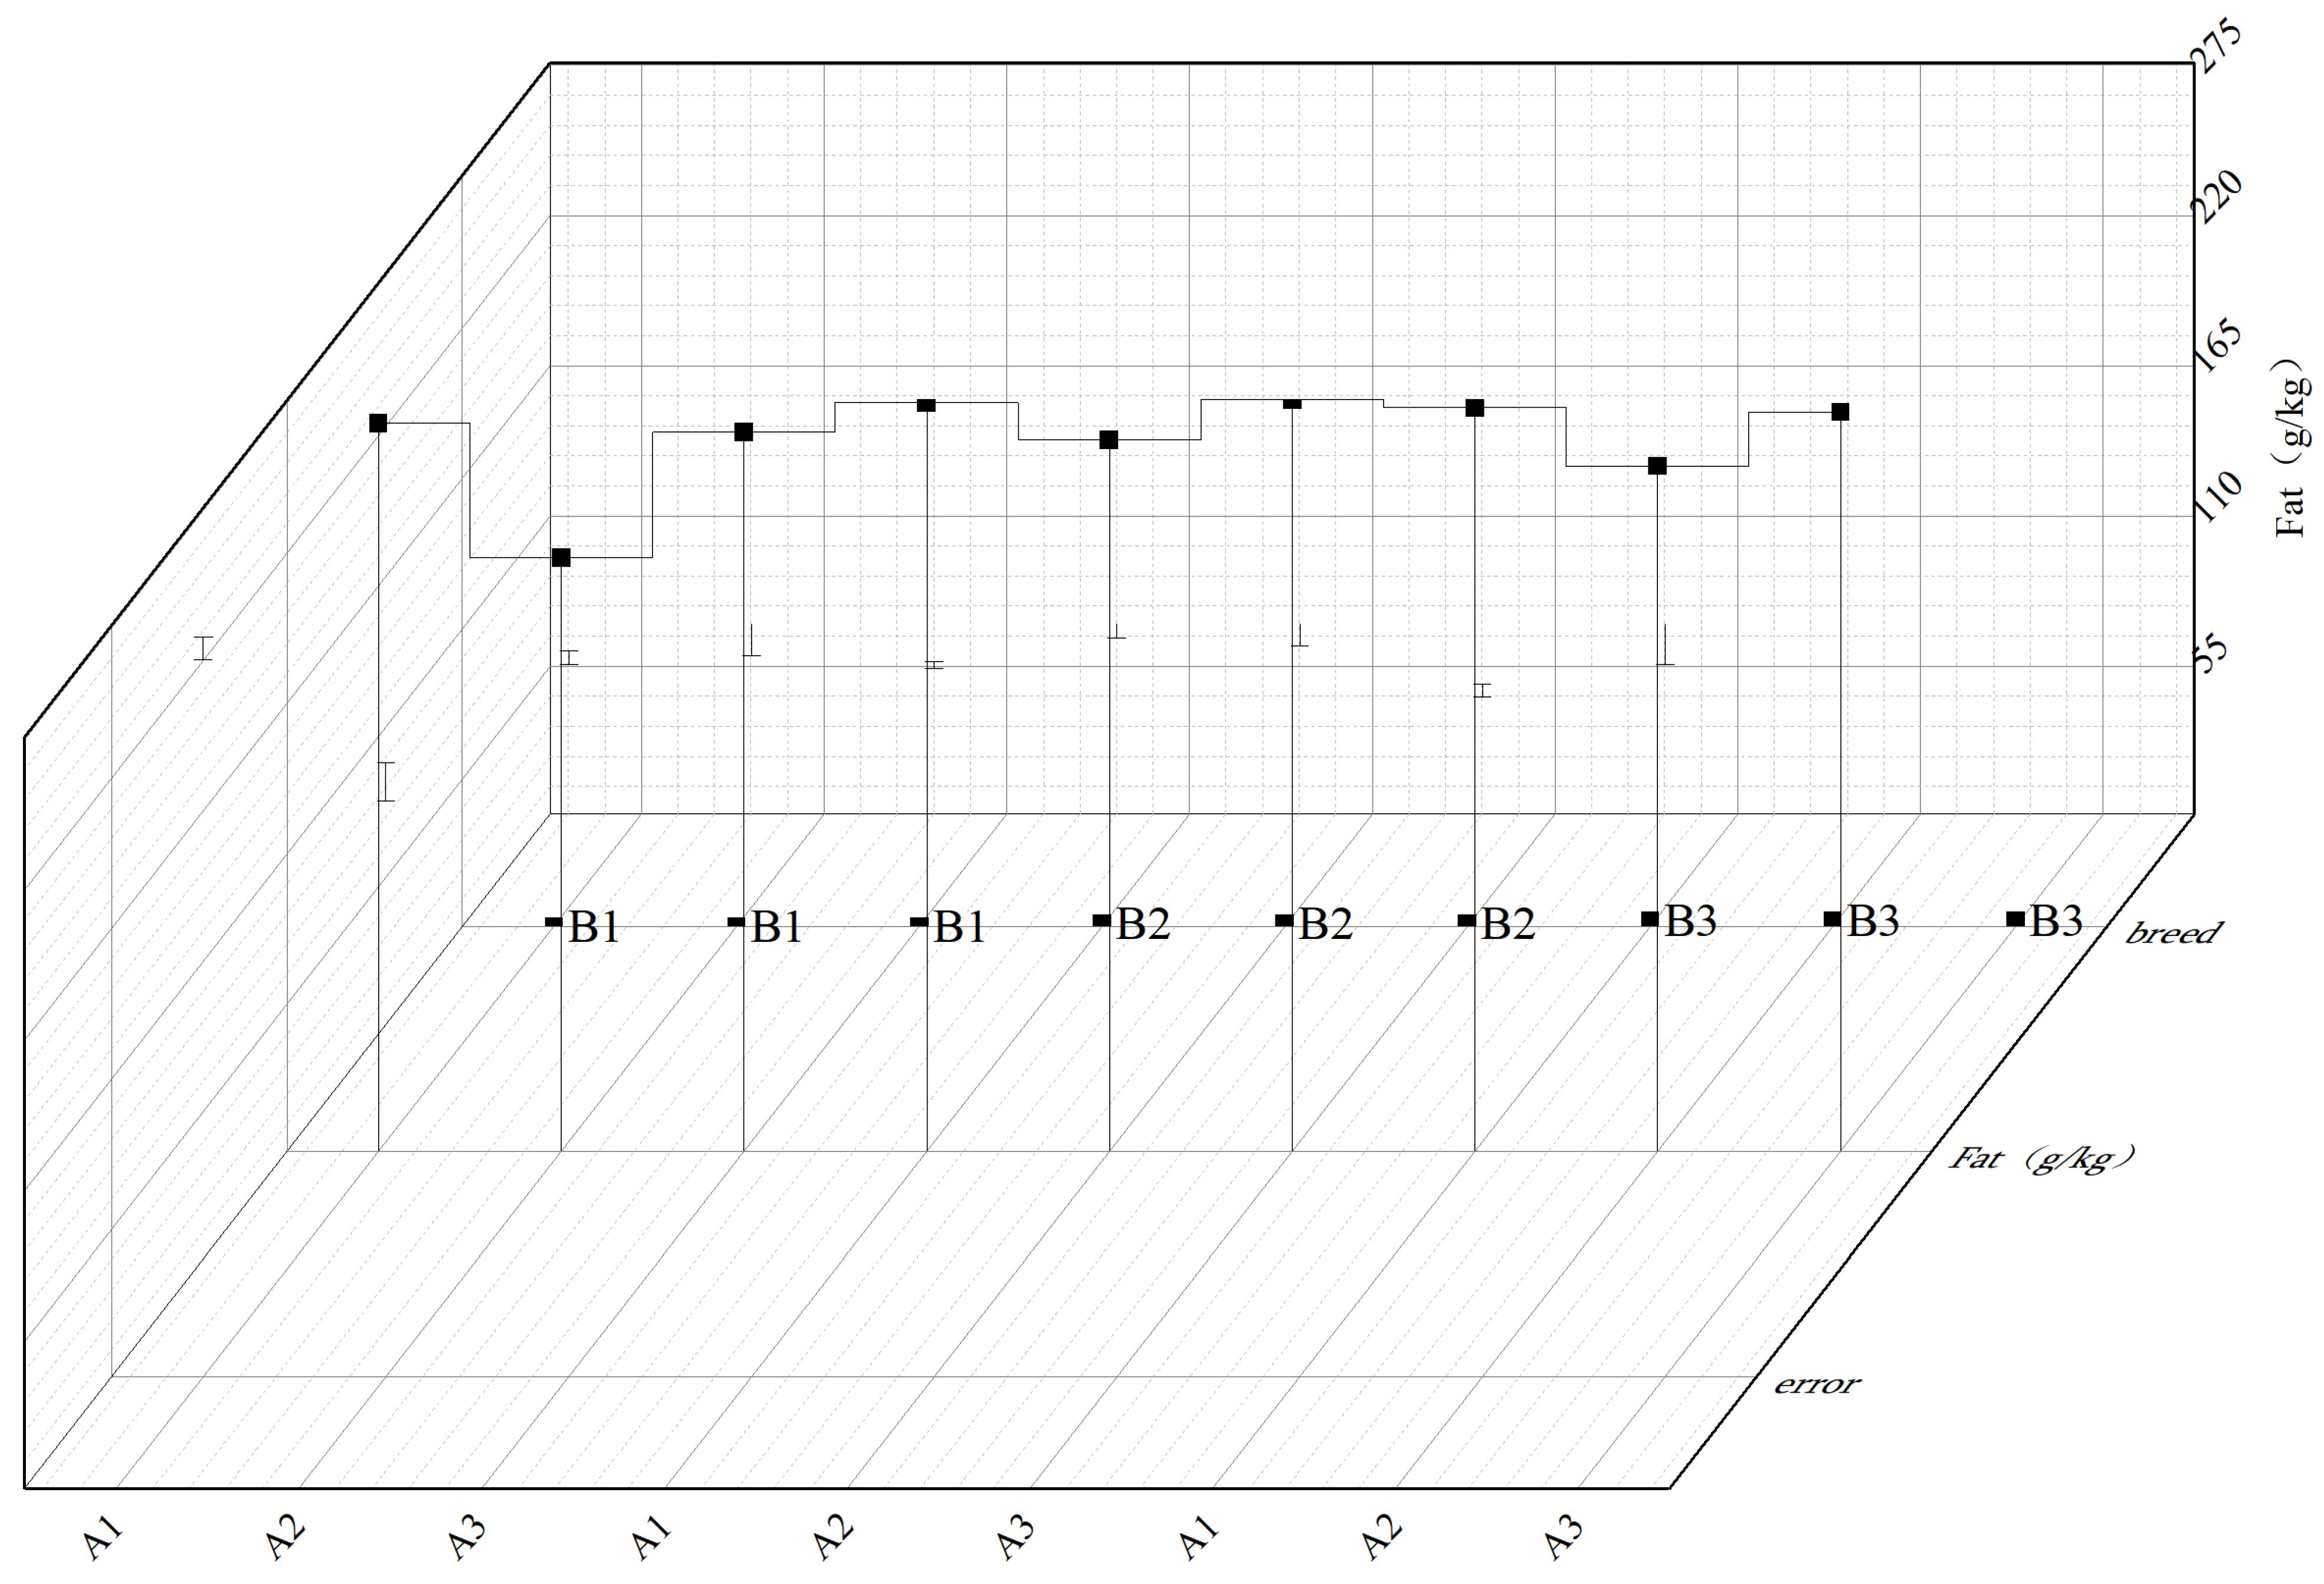
The crude fat content at the A1 test site was significantly negatively correlated with temperature (r = −0.86, p < 0.001). The early-maturing variety B1 reached the peak fat content in this area: 52.3 ± 0.8%, significantly higher than that of other varieties. The proportion of oleic acid in the fatty acid composition was relatively low (about 30%), and the low-temperature environment inhibited the accumulation of oleic acid. At the A2 test site, the trend of crude fat change was that when the temperature increased from 25 °C to 35 °C, the fat content decreased by 10.2 ± 1.3% (global response). At the A3 test site, the crude fat content of the mid-maturing variety B2 was prominent: the fat content reached 47.1 ± 1.0%, 5.2% higher than that of the late-maturing variety B3, indicating strong heat tolerance. The proportion of oleic acid in the fatty acid composition significantly increased to >70% (p < 0.01), and high temperature promoted the synthesis of oleic acid. Indicators A1, A3 crude fat content B1 peak 52.3%, B2 peak 47.1%, oleic acid proportion 30% > 70% significant increase (p < 0.01). Temperature affects seed quality by altering the fat synthesis pathway (such as increasing the conversion rate of oleic acid), and the difference in heat tolerance among varieties provides a key target for climate-adaptive breeding. In the future, it is necessary to integrate omics data and environmental models to achieve precise design (Table 4 and Figure 6).
Soluble protein (SP) in sunflowers enhances drought resistance by increasing cell membrane stability and water retention. SP content frequently serves as a drought-resistance indicator in breeding programs for oil crops. Principal component analysis (PCA) was conducted based on the dynamic response of sunflower SP to meteorological factors, evaluating the variance contribution rates of average temperature, 10 cm ground temperature, and precipitation to identify dominant meteorological factors. Correlation analysis (Table 5) indicated that average temperature, 10 cm ground temperature, and precipitation promoted SP accumulation, though only the 10 cm ground temperature displayed a significant positive correlation.
To identify direct mechanisms of meteorological influence on SP content, PCA was applied to screen driving factors. Results indicated that the explanatory contributions of average temperature and 10 cm ground temperature to SP synthesis were 70.94% and 24.20%, respectively (Table 6). The cumulative contribution of the principal component associated with 10 cm ground temperature reached 95.14% (>80% threshold), and its loading (r = 0.80) significantly exceeded that of other factors. Thus, 10 cm ground temperature emerged as the key environmental regulator of SP biosynthesis through the ground temperature–root metabolism pathway.

3.3. Regional Adaptation of Seed Set Efficiency and Yield Stability

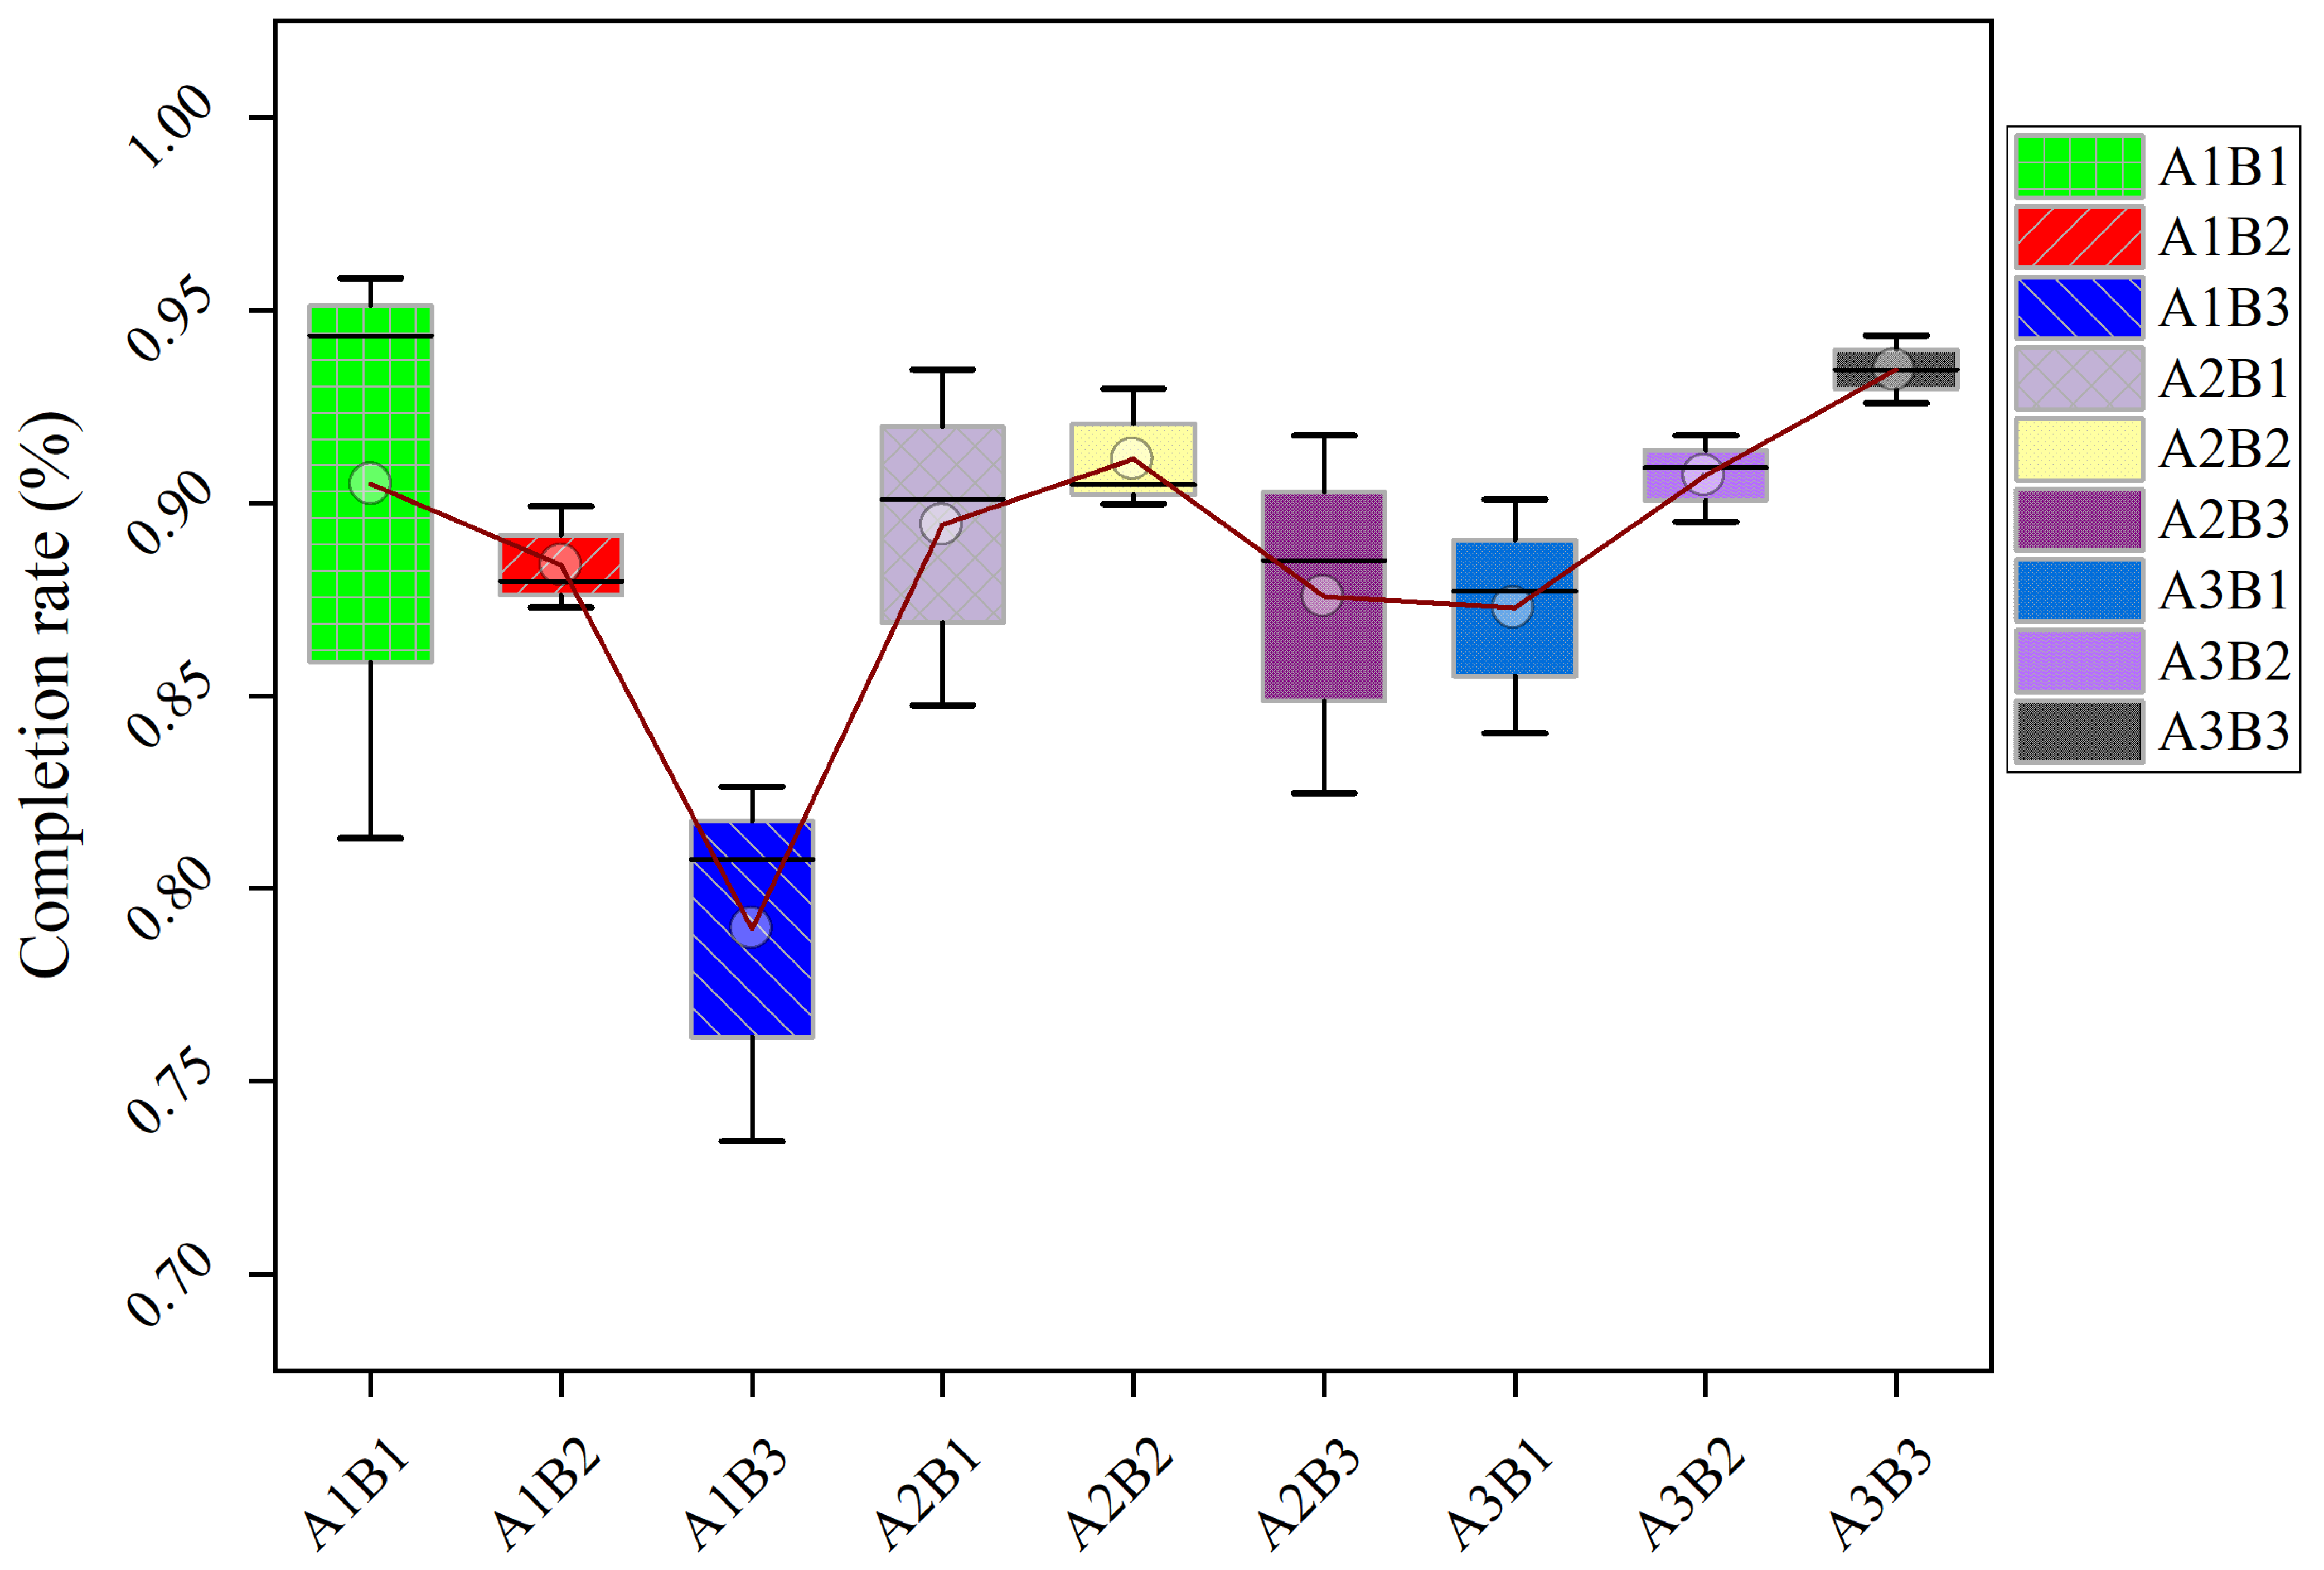
Comparative analysis showed significant spatial variation in sunflower seed set efficiency, a key yield determinant indicating reproductive success under environmental constraints. At the cool region (A1), early-maturing B1 achieved 72.3% seed set, surpassing B1 achieved 72.3% seed set, surpassing B2 (68.1%) and B3 (64.9%) by 5.67% per variety (R2 = 0.93, p < 0.05), indicating a thermal advantage for shorter-season genotypes. Under water-limited conditions (A2), mid-maturing B2 demonstrated exceptional resilience, with 17.1% and 9.9% higher seed set than B1 (76.0 ± 5.0%) and B3 (81.0 ± 4.0%), respectively (p < 0.01). At high-latitude A3, late-maturing B3 reached 82.4% seed set—6.2 and 4.7 percentage points above B1 and B2, driven by a 3% per growth-stage increase (slope p = 0.008). These patterns suggest seed set dynamics reflect: (1) pollen viability modulation by temperature–humidity interactions, (2) pollinator efficiency thresholds, and (3) genotype-specific stress memory. Thus, optimizing seed set through climate-smart variety deployment (e.g., B2 for drought, B3 for long seasons) can enhance oil yield by 11–18%, reduce input costs by 23%, and represents a pivotal strategy for sustainable sunflower intensification (Figure 7).
The 100-grain weight response to precipitation (x) was optimally modeled by a saturation-growth equation where y is the hundred-grain weight (g 100 seeds-1) and x is cumulative precipitation during grain filling (mm):
y = 17.14369 27.8743 x 2 0 . 026281 x 2 : ( F = 6738.6976 ,   R 2 = 0.9998 ,   p < 0.001 ,   Cook's distance = 0.0430 ) .
This model identified a critical physiological threshold at 28.5 mm precipitation, at which growth rate peaked before plateauing, consistent with photosynthetic carbon saturation during grain filling. Validation confirmed exceptional fit for late-maturing genotype B3 at A3, with observed (23.49 g) vs. predicted (23.43 g) values yielding minimal residual (0.059 g, Cook’s distance = 1.1, σ = 1.69 within 2σ limits), indicating genotype-enhanced model stability. Regression diagnostics identified two key deviations: the A1B3 anomaly (residual > 3σ), reflecting experimental error requiring exclusion, and the A3B3 biological gain (leverage = 0.92), suggesting adaptive trait optimization. Future studies should combine robust regression analyses with transcriptomic validation (e.g., DGAT expression analysis) to clarify genotype-precipitation interactions underlying these differences.
Based on the regression equation (R2 = 0.95), the 100-grain weight exhibited a declining trend when precipitation was less than 9.34 mm. Between 9.34 mm and 15.2 mm, the marginal effect was maximized, showing potential for increase. When precipitation exceeded 15.2 mm, the increase in 100-grain weight slowed. Precipitation greater than 20 mm led to a sharp decline in 100-grain weight. At the Y-value of 18.70, the 95% probability interval for 100-grain weight ranged from 0.171–0.202, supporting the reliability of SPSS prediction confidence intervals (Table 7).

4. Discussion

Sunflower (Helianthus annuus L.) yield and quality are determined by complex interactions involving genetic traits, agronomic practices, and environmental factors, especially temperature and moisture regimes [17]. Our findings indicate that differences in maturation stage significantly modulate varietal responses to meteorological stresses, highlighting critical considerations for climate-resilient cultivation.
Late-maturing varieties (B2/B3) exhibited superior thermotolerance, maintaining pollen viability and seed set at 28–30 °C—conditions that reduced seed set in early-maturing B1 by 12–18%. These results align with [18], where optimal higher temperatures enhanced the transport of photoassimilates to reproductive sinks. Notably, B3 showed resilience due to sustained sucrose synthase activity during grain filling [19], resulting in an 8–10% greater 100-seed weight under heat stress. In contrast, precipitation dependence increased with maturity duration; capitulum diameter and yield correlated positively with rainfall in late cultivars. These findings extend previous work [20,21] by quantifying water requirements across developmental stages.
We precisely identified temperature thresholds influencing oil metabolism: at 25–30 °C, each 1 °C increase reduced seed fat content by 0.5–1.2% and 100-seed weight by 2.4–3.6% [22,23]. Observed yield-quality trade-offs under stress reflect metabolic reprogramming [24,25]. High temperatures shifted metabolism from glucose-6-phosphate dehydrogenase to the pentose phosphate pathway [26,27], increasing soluble sugar accumulation by 40% while decreasing oleic acid synthesis [28,29]. Concurrently, osmoprotectants (proline, HSP70) increased 3.5-fold under combined heat–drought stress [30,31], explaining varietal differences in resource allocation. These mechanisms informed our cultivar-site optimization protocol: in cool regions (A1), early-maturing B1 minimizes frost risk; in warmer zones (A2), mid-to-late maturing B2 balances heat tolerance and water efficiency; in hot, arid zones (A3), mid-maturing B3 benefits from enhanced ABA sensitivity.
This study confirms that thermal–hydrological interactions influence sunflower productivity through genotype-specific physiological mechanisms. By quantifying response thresholds (e.g., 1 °C increase = 0.8% fat loss) and connecting them to molecular mechanisms (e.g., DGAT suppression), we enable precision breeding for heat-adapted varieties. Future studies should integrate real-time meteorological forecasting with dynamic sowing windows, utilizing maturity-dependent stress-response curves identified here [32].
In the Sunflower Marker-Assisted Selection (MAS) method, molecular markers such as SNPs and SSRs related to fat content can be developed through QTL mapping, GWAS analysis, etc., and combined with multi-gene aggregation and genome-wide selection to optimize oil quality. For ABA and ethylene, stress response markers can be developed based on genes related to their synthesis and signal transduction (such as NCED, ACS, ACO, etc.), and combined with gene expression regulation markers for stress resistance screening. For the SWEET17 gene, SNP markers near it related to sugar transport and oil synthesis can be located, and after functional verification, they can be used for the selection of high-oil content genotypes. At the same time, multi-trait markers can be integrated to conduct backcross assistance and genome-wide selection to optimize the breeding process, in order to accelerate the cultivation of high-quality and stress-resistant varieties. However, challenges such as complex trait genetic analysis, the universality of markers across populations, and cost control of technologies need to be noted.
The relationship between linoleic acid content and sunflower yield under weather stress is complex, with temperature acting as the primary regulator. Low temperatures increase linoleic acid content but limit yield, whereas high temperatures produce the opposite effect. Coordinated optimization can be achieved through regional strategies (quality-oriented cultivation in cold areas, yield-focused cultivation in warmer areas) and precise management of flowering timing (optimal sowing dates to avoid disasters, bee-assisted pollination) [33]. Future research should integrate molecular resilience modules and dynamic modeling to effectively manage climate-fluctuation risks.
5. Conclusions

This study reveals clear regional adaptability patterns among sunflower cultivars. Early-maturing cultivar B1 (RH3146) is optimal for cooler sites (A1), while late-maturing cultivar B3 (X3939) shows advantages under moderate conditions (A2), including higher crude fat content, seed set rate, and seed weight. However, B3 faces maturity delays at unstable sites (A3) with high temperature–humidity variability. These findings provide practical guidance for selecting appropriate sunflower cultivars and optimizing planting strategies, enhancing agricultural resilience and yield stability under varying climatic conditions. This research method is innovative in the case of sunflowers and has also been explored in corn and cotton.

Author Contributions

Conceptualization, methodology, validation, formal analysis, investigation, data curation, writing—original draft preparation, writing—review and editing, J.M. and J.W.; Validation, formal analysis, data curation, writing—original draft preparation, writing—review and editing, R.M.; Formal analysis; writing—review and editing, Z.L. and H.D.; Conceptualization, writing—review and editing, supervision, Y.L.; Writing—review and editing, supervision, W.D.; Conceptualization, writing—review and editing, supervision, project administration, funding acquisition, S.L.; Supervision; writing—review and editing, project administration, funding acquisition, P.W. and X.Z. All authors have read and agreed to the published version of the manuscript.

Funding

This research was funded by the key scientific research project of Xinjiang Production and Construction Corps (NO. 2021AB011), the innovation talent project (NO. 2023CB007-06), the key regional key scientific research project (NO. 2024AB014), and the science project of the Ninth Division (NO. 2024JS007) of Xinjiang Academy of Agricultural Science and Technology.

Data Availability Statement

Data will be made available on request.

Conflicts of Interest

We declare that we have no financial and personal relationships with other people or organizations that can inappropriately influence our work, there is no professional or other personal interest of any nature or kind in any product, service, and/or company that could be construed as influencing the position presented in, or the review of, the manuscript.

References

  1. Burrows, S.M.; Burrows, S.M.; Dasgupta, A.; Reehl, S.; Bramer, L.; Ma, P.-L.; Rasch, P.J.; Qian, Y. Characterizing the Relative Importance Assigned to Physical Variables by Climate Scientists when Assessing Atmospheric Climate Model Fidelity. Adv. Atmos. Sci. 2018, 35, 1101–1113. [Google Scholar] [CrossRef]
  2. Xue, J.; Wang, Y.; Teng, H.; Wang, N.; Li, D.; Peng, J.; Biswas, A.; Shi, Z. Dynamics of Vegetation Greenness and Its Response to Climate Change in Xinjiang over the Past Two Decades. Remote Sens. 2021, 13, 4063. [Google Scholar] [CrossRef]
  3. Nissen, K.M.; Ulbrich, U. Increasing frequencies and changing characteristics of heavy precipitation events threatening infrastructure in Europe under climate change. Nat. Hazards Earth Syst. Sci. 2017, 17, 1177–1190. [Google Scholar] [CrossRef]
  4. He, R.; Tong, C.; Wang, J.; Zheng, H. Comparison of Water Utilization Patterns of Sunflowers and Maize at Different Fertility Stages along the Yellow River. Water 2024, 16, 198. [Google Scholar] [CrossRef]
  5. Sileshi, G.; Akinnifesi, F.K.; Debusho, L.K.; Beedy, T.; Ajayi, O.C.; Mong’oMba, S. Variation in maize yield gaps with plant nutrient inputs, soil type and climate across sub-Saharan Africa. Field Crops Res. 2010, 116, 1–13. [Google Scholar] [CrossRef]
  6. Aili, A.; Xu, H.; Zhao, X.; Zhang, P.; Yang, R. Dynamics of Vegetation Productivity in Relation to Surface Meteorological Factors in the Altay Mountains in Northwest China. Forests 2022, 13, 1907. [Google Scholar] [CrossRef]
  7. Sharma, R.K.; Kumar, S.; Vatta, K.; Bheemanahalli, R.; Dhillon, J.; Reddy, K.N. Impact of recent climate change on corn, rice, and wheat in southeastern USA. Sci. Rep. 2022, 12, 16928. [Google Scholar] [CrossRef] [PubMed]
  8. Zou, Z.; Cheng, C.; Shen, S. Effects of Meteorological Conditions and Irrigation Levels during Different Growth Stages on Maize Yield in the Jing-Jin-Ji Region. Sustainability 2023, 15, 3485. [Google Scholar] [CrossRef]
  9. Tian, Z.; Xu, H.; Zhong, H.; Sun, L.; Liu, J. Agricultural Adaptation to Climate Change in China. In Adaptation to Climate Change in Agriculture; Iizumi, T., Hirata, R., Matsuda, R., Eds.; Springer: Singapore, 2019. [Google Scholar] [CrossRef]
  10. Li, Z. Grain Production and Food Security in China. In Reform and Development of Agriculture in China; Research Series on the Chinese Dream and China’s Development Path; Springer: Singapore, 2017. [Google Scholar] [CrossRef]
  11. Qu, Z.; Li, Y.-H.; Xu, W.-H.; Chen, W.-J.; Hu, Y.-L.; Wang, Z.-G. Different genotypes regulate the microbial community structure in the soybean rhizosphere. J. Integr. Agric. 2023, 22, 585–597. [Google Scholar] [CrossRef]
  12. Zhang, X.; Wang, S.; Liu, K.; Huang, X.; Shi, J.; Li, X. Projecting Response of Ecological Vulnerability to Future Climate Change and Human Policies in the Yellow River Basin, China. Remote Sens. 2024, 16, 3410. [Google Scholar] [CrossRef]
  13. Li, Y.; Guan, K.; Peng, B.; Franz, T.E.; Wardlow, B.; Pan, M. Quantifying irrigation cooling benefits to maize yield in the US Midwest. Glob. Change Biol. 2020, 26, 3065–3078. [Google Scholar] [CrossRef] [PubMed]
  14. Yang, R.; Harrison, M.T.; Wang, X. Current State and Limiting Factors of Wheat Yield at the Farm Level in Hubei Province. Agronomy 2023, 13, 2043. [Google Scholar] [CrossRef]
  15. Yao, F.; Li, Q.; Zeng, R.; Shi, S. Effects of different agricultural treatments on narrowing winter wheat yield gap and nitrogen use efficiency in China. J. Integr. Agric. 2021, 20, 383–394. [Google Scholar] [CrossRef]
  16. Tomasi, T.C.; Reis, L.C.; Taira, T.L.; Soares, J.S.; Tomiozzo, R.; Uhlmann, L.O.; Streck, N.A.; Sorgato, J.C. Plant Density and Location: Optimization of Growth and Quality of Cut Sunflower in Tropical and Subtropical Environments. Plants 2024, 13, 2810. [Google Scholar] [CrossRef] [PubMed]
  17. Wang, H.; Ren, H.; Zhang, L.; Zhao, Y.; Liu, Y.; He, Q.; Li, G.; Han, K.; Zhang, J.; Zhao, B.; et al. sustainable approach to narrowing the summer maize yield gap experienced by smallholders in the North China Plain. Agric. Syst. 2023, 204, 103541. [Google Scholar] [CrossRef]
  18. Han, S.; Si, J.; Yu, W.; Kong, L.; Zhang, B.; Wang, F.; Zhang, H.; Zhao, X.; Li, H.; Meng, Y. Mechanisms analysis on yield gap and nitrogen use efficiency gap of winter wheat in Shandong Province. Sci. Agric. Sin. 2022, 55, 3110–3122. (In Chinese) [Google Scholar] [CrossRef]
  19. Yan, H.; Harrison, M.T.; Liu, K.; Wang, B.; Feng, P.; Fahad, S.; Meinke, H.; Yang, R.; Liu, D.L.; Archontoulis, S.; et al. Crop traits enabling yield gains under more frequent extreme climatic events. Sci. Total Environ. 2022, 808, 152170. [Google Scholar] [CrossRef] [PubMed]
  20. Li, X.; Wang, Y.; Feng, G.; Xu, Z.; Meng, F.; Gao, Q. Differential fertilizer nitrogen fates in maize cropping system among three soil textures based on N15. Field Crops Res. 2023, 291, 108780. [Google Scholar] [CrossRef]
  21. Yerli, C.; Sahin, U.; Oztas, T. CO2 emission from soil in silage maize irrigated with wastewater under deficit irrigation in direct sowing practice. Agric. Water Manag. 2022, 271, 107791. [Google Scholar] [CrossRef]
  22. Zhao, D.; Arshad, M.; Wang, J.; Triantafilis, J. Soil exchangeable cations estimation using Vis-NIR spectroscopy in different depths: Effects of multiple calibration models and spiking. Comput. Electron. Agric. 2021, 182, 105990. [Google Scholar] [CrossRef]
  23. Lu, X.; Shi, H.; Li, R.; Liang, J.; Xu, Z.; Bu, H. Effect of autumn irrigation after mulching on water-heat-salt and yield of following spring maize. Editor. Off. Trans. Chin. Soc. Agric. Eng. 2017, 33, 148–154. [Google Scholar] [CrossRef]
  24. Guo, X.; Wang, H.; Yu, Q.; Wang, R.; Wang, X.; Li, J. Effects of tillage on soil moisture and yield of wheat-maize rotation field in Weibei upland plateau. Sci. Agric. Sin. 2021, 54, 2977–2990. (In Chinese) [Google Scholar] [CrossRef]
  25. Li, Z.; Shen, Y.; Zhang, W.; Zhang, H.; Liu, L.; Wang, Z.; Gu, J.; Yang, J. Effects of long-term straw returning on rice yield and soil properties and bacterial community in a rice-wheat rotation system. Field Crops Res. 2023, 291, 108800. [Google Scholar] [CrossRef]
  26. Gao, Y.; Zhao, H.; Zhao, C.; Hu, G.; Zhang, H.; Liu, X.; Li, N.; Hou, H.; Li, X. Spatial and temporal variations of maize and wheat yield gaps and their relationships with climate in China. Agric. Water Manag. 2022, 270, 107714. [Google Scholar] [CrossRef]
  27. Innocent, P.; Dada, E.M. Adoption of climate-smart agricultural practices and their influence on the technical efficiency of maize production under extreme weather events. Int. J. Disaster Risk Reduct. 2021, 61, 102322. [Google Scholar] [CrossRef]
  28. Kar, S.; Pramanick, B.; Brahmachari, K.; Saha, G.; Mahapatra, B.; Saha, A.; Kumar, A. Exploring the best tillage option in rice based diversified cropping systems in alluvial soil of eastern India. Soil Tillage Res. 2021, 205, 104761. [Google Scholar] [CrossRef]
  29. Huang, R.; Huang, J. The Impact of Meteorological Conditions on the Growth of Spring Maize in Northeast China. In Proceedings of the 2023 11th International Conference on Agro-Geoinformatics (Agro-Geoinformatics), Wuhan, China, 25–28 July 2023; pp. 1–4. [Google Scholar] [CrossRef]
  30. Ma, R.; Zhou, W.; Ren, J.; Huang, Y.; Wang, H. Multi-scenario simulation and optimization control of ecological security based on GeoSOS-FLUS model in ecological fragile area in northeast Qinghai-Tibet Plateau, China. Ecol. Indic. 2023, 151, 110324. [Google Scholar] [CrossRef]
  31. Falah, A.N.; Ruchjana, B.N.; Abdullah, A.S.; Rejito, J. The Hybrid Modeling of Spatial Autoregressive Exogenous Using Casetti’s Model Approach for the Prediction of Rainfall. Mathematics 2023, 11, 3783. [Google Scholar] [CrossRef]
  32. da Silva, O.B.; de Castro, E.M.; Pereira, M.P.; Borges, A.; Candido, E.L.; de Carvalho, C.G.P.; de Carvalho, L.M. Leaf morphoanatomical and physiological characteristics of sunflower genotypes under water deficit. S. Afr. J. Bot. 2025, 17, 244–256. [Google Scholar] [CrossRef]
  33. Curti, G.L.; Martin, T.N.; Ferronato, M.L.; Benin, G. Girassol ornamental: Caracterização, pos-colheita e escala de senescencia. Rev. Cienc. Agrárias 2022, 35, 241–244. [Google Scholar] [CrossRef]
Figure 1. Site-specific hydrothermal dynamics during sunflower growth cycles. Note: Experimental sites: A1 (Site 181), A2 (Beitun), A3 (Site 183).
Agronomy 15 01724 g001
Figure 2. Genotype × environment interaction effects on plant height across experimental sites. Different lowercase letters indicate significant differences (Tukey’s HSD, α = 0.05).
Agronomy 15 01724 g002
Figure 3. Genotype × environment interaction effects on leaf area across agroclimatic zones. Different lowercase letters indicate significant differences (Tukey’s HSD, α = 0.05).
Agronomy 15 01724 g003
Figure 4. Thermal regulation of sunflower culm diameter across experimental sites. Note: Experimental sites: A1 (Beitun: 48° N, 88° E), A2 (Site 183: 46° N, 85° E), A3 (Site 181: 47° N, 87° E). Genotypes: B1 (RH3146, early-maturing varieties), B2 (SH361, mid-maturing varieties), B3 (X3939, late-maturing varieties).C1 represents the average temperature of the A1 test point, C2 represents the average temperature of the A2 test point, and C3 represents the average temperature of the A3 test point.
Agronomy 15 01724 g004
Figure 5. Genotype × site × phenophase interaction effects on dry matter partitioning. Note: Experimental sites: A1 (Beitun: 48° N, 88° E), A2 (Site 183: 46° N, 85° E), A3 (Site 181: 47° N, 87° E). Genotypes: B1 (RH3146, early-maturing varieties), B2 (SH361, mid-maturing varieties), B3 (X3939, late-maturing varieties). Bars represent mean ± SEM (n = 30 plants/site-genotype). Different lowercase letters indicate significant differences (Tukey’s HSD, α = 0.05).
Agronomy 15 01724 g005
Figure 6. Effects of planting sunflower varieties at different test sites and growth stages on grain fat content. Note: r = −0.76 indicates the slope.
Agronomy 15 01724 g006
Figure 7. Effects of sunflower cultivation at different growth stages and experimental sites on seed-setting rates.
Agronomy 15 01724 g007
Table 1. Dates (mm-dd) of partial growth stages of sunflower at each test site (mm-dd).
Loc.CVSDEEDBDFSGPMD
A1B115 April–24 April25 April–10 June11 June–18 June19 June–26 June27 June–13 July20 July
B215 April–24 April25 April–10 July11 July–16 July17 July–24 July25 July–5 August12 August
B315 April–24 April25 April–14 July15 July–22 July23 July–31 July1 August–16 August24 August
A2B115 April–24 April25 April–7 July8 June–13 June14 June–21 June22 June–07 July14 July
B215 April–24 April25 April–8 June9 June–15 June16 July–23 July24 July–31 July15 August
B315 April–24 April25 April–26 July27 July–3 August4 August–11 August12 August–19 August20 August
A3B115 April–24 April25 April–4 June3 June–10 June11 June–16 June17 June–2 July9 July
B215 April–24 April25 April–7 July8 July–15 July16 July–23 July27 July–11 August18 August
B315 April–24 April25 April–30 July31 July–7 August8 August–15 August16 August–23 August30 August
Note: A2 represents the Beitun experimental site, A3 represents the 183 group experimental site, A1 represents the 181 group experimental site, B1 represents RH3146, B2 represents SH361, and B3 represents X3939. Same below. This notation applies hereafter. LOC indicates location, CV, cultivar, SD, sowing date, EED, emergence period, BD, bud-opening period, FS, flowering stage, GP, grain-filling period, and MD, maturity date.
Table 2. Two-way ANOVA of genotype × environment effects on agronomic traits.
SVSSfMSFNPV
IB9.372.004.691.970.36
Int.A169.262.0084.6349.010.00
Int.B0.402.000.200.120.95
AxB6.914.001.730.400.80
IBE68.6216.004.29
SST254.5526.00
Note: Factor A represents experimental sites; factor B represents experimental varieties. SV indicates the source of variation, SS, the sum of squares, f, the degree of freedom, MS, the mean square, FN, the F value, PV, the p-value, IB, between-group variation, Int.A, variation within Factor A, Int.B, variation within Factor B, AxB, interaction between factors A and B, and IBE, error, SST stands for total variability.
Table 3. Correlation of grain-filling temperature with organ-specific dry matter allocation.
CORRSDMCAVG (°C)FDMC
SDMC1.00 0.38 ** 0.92 *
AVG (°C)0.38 **1.000.02 **
FDMC0.92 *0.02 **1.00
Note: * p < 0.05; ** p < 0.01. CORR indicates the correlation coefficient, SDMC, stem dry matter content, AVG (°C), average temperature, and FDMC, flower disk dry matter content.
Table 4. Correlation between air temperature and fat content in sunflower seeds.
CORRAVG (°C)Fat
AVG (°C)10.92 **
Fat−0.76 *1
Note: Correlation coefficients are presented in the lower left corner, partial correlations in the upper right corner. r0.05 = 0.6664, r0.01 = 0.7977, r = −0.76 indicates the slope. CORR represents the correlation coefficient, AVG (°C), average temperature, and Fat, crude fat content of sunflower seeds. Note: * p < 0.05; ** p < 0.01.
Table 5. Correlation between meteorological factors and sunflower grain SP.
CORRSPAVG (°C)GT10cmPrecip (mm)
SP10.00410.8484 **0.0291
AVG (°C)0.106610.01340.6375
GT10cm0.851 **0.136610.085
Precip (mm)0.13070.64580.17441
Note: Correlation coefficients are presented in the lower left corner, partial correlations in the upper right corner. r0.05 = 0.6664, r0.01 = 0.7977. CORR denotes correlation coefficient, SP, soluble protein content of sunflower, AVG (°C), average temperature, GT10cm, temperature at 10 cm soil depth, and Precip (mm), precipitation amount. Note: ** p < 0.01.
Table 6. Contribution rates of meteorological factors to SP in sunflower seeds.
DVEVCR (%)CCR (%)
AVG (°C)2.8470.9470.94
GT10cm0.9724.2095.14
DV denotes the dependent variable, EV, eigenvalue, CR (%), contribution rate, CCR (%), cumulative contribution rate, AVG (°C), average temperature, and GT10cm, soil temperature at 10 cm depth.
Table 7. Phenophase-specific precipitation effects on 100-seed weight: multisite mixed-effects regression.
PHOVFVeSRCDLR
A1B117.4617.410.04650.96530.0740.241
B222.2622.28−0.0191−0.4090.01690.2879
B315.0015.05−0.0453−1.84563.46990.8029
A2B118.3518.330.01550.32250.00820.2395
B219.4119.43−0.0228−0.46260.01370.204
B320.8720.92−0.0477−0.94670.04590.1701
A3B116.1816.130.05261.11190.11320.2681
B220.0020.04−0.0383−0.7660.03260.1818
B323.4923.430.05861.69341.11190.608
PH indicates processed values, OV, observed values, FV, fitted values, e, residuals, SR, standardized residuals, CD, Cook’s distance, and LR, leverage value.
Disclaimer/Publisher’s Note: The statements, opinions and data contained in all publications are solely those of the individual author(s) and contributor(s) and not of MDPI and/or the editor(s). MDPI and/or the editor(s) disclaim responsibility for any injury to people or property resulting from any ideas, methods, instructions or products referred to in the content.