Article

QTL Mapping of Adult Plant Resistance to Wheat Leaf Rust in the Xinong1163-4×Thatcher RIL Population

1
College of Plant Protection, Hebei Agricultural University, Baoding 071000, China
2
Technological Innovation Center for Biological Control of Crop Disease and Insect Pests of Hebei Province, Baoding 071001, China
*
Author to whom correspondence should be addressed.
Agronomy 2025, 15(7), 1717; https://doi.org/10.3390/agronomy15071717
Submission received: 7 May 2025 / Revised: 7 July 2025 / Accepted: 14 July 2025 / Published: 16 July 2025
(This article belongs to the Section Pest and Disease Management)

Abstract

Wheat leaf rust (Lr), caused by Puccinia triticina Eriks. (Pt), is one of the most important diseases affecting wheat production worldwide. Using resistant wheat cultivars is the most economic and environmentally friendly way to control leaf rust. The Chinese wheat cultivar Xinong1163-4 has shown good resistance to Lr in field trials. To identify the genetic basis of Lr resistance in Xinong1163-4, 195 recombinant inbred lines (RILs) from the Xinong1163-4/Thatcher cross were phenotyped for Lr severity in three environments: the 2017/2018, 2018/2019, and 2019/2020 growing seasons in Baoding, Hebei Province. Bulked segregant analysis and simple sequence repeat markers were then used to identify the quantitative trait loci (QTLs) for Lr adult plant resistance (APR) in the population. As a result, six QTLs were detected, designated as QLr.hbau-1BL.1, QLr.hbau-1BL.2, and QLr.hbau-1BL.3. These QTLs were predicted to be novel. QLr.hbau-4BL, QLr.hbau-4BL.1, and QLr.hbau-3A were identified at similar physical positions to previously reported QTLs. Based on chromosome positions and molecular marker testing, QLr.hbau-1BL.3 shares similar flanking markers with Lr46. Lr46 is a non-race-specific APR gene for leaf rust, stripe rust, and powdery mildew. Similarly, QLr.hebau-4BL showed resistance to multiple diseases, including leaf rust, stripe rust, Fusarium head blight, and powdery mildew. The QTLs identified in this study, as well as their closely linked markers, can potentially be used for marker-assisted selection in wheat breeding.

1. Introduction

Puccinia triticina Eriks, the causal agent of wheat leaf rust, is responsible for significant global yield and economic losses in various regions including North America, South America, Africa, Europe, Asia, and Australia [1,2]. In China, the occurrence of wheat leaf rust is primarily common in the Yangtze River valley, as well as certain parts of wheat fields in the northeast, north, and southwest regions. In typical years, wheat yield losses caused by leaf rust range from 50%, amounting to an annual reduction of approximately 3 million tonnes [3]. Currently, although wheat leaf rust is not a prominent disease in China, it often coexists with wheat stripe rust (Puccinia striiformis) within the same wheat fields, thus hindering the collection of accurate data regarding yield losses [4]. Regardless, severe epidemics of wheat leaf rust were recorded in China during 1969, 1973, 1975, and 1979 [5], and localized outbreaks can still occur. For instance, in 2013, leaf rust was observed in Shandong, Henan, and certain regions of Xinjiang. Moreover, in 2015, Henan suffered from the worst wheat leaf rust outbreak, affecting 1.832 million hectares and resulting in an annual yield loss of 191,000 tonnes [6].
The prevention and control of wheat leaf rust has always been an important issue in agricultural scientific research. Traditional control methods mainly include chemical control [6] and agricultural management measures, but these methods have certain limitations. Chemical control may lead to environmental pollution and the development of pathogen resistance, while agricultural management measures such as manual weeding, cover cropping maintenance, or residue removal requires a large amount of labor and time investment. Therefore, breeding disease-resistant varieties has become a more economical, environmentally friendly, and effective control strategy. Using genetic engineering and molecular breeding technologies, scientists can introduce resistance genes into wheat varieties, thereby enhancing wheat’s resistance to leaf rust. This method not only reduces the use of pesticides but also improves the yield and quality of wheat. In addition, the promotion of disease-resistant varieties also helps to increase farmers’ income and food security.
Resistance to wheat leaf rust can be divided into race-specific resistance (ASR) and non-race-specific resistance (APR). ASR is mediated by single or few major R genes, providing complete immunity to specific pathogen races but being highly vulnerable to rapid breakdown. However, due to its narrow genetic basis, ASR has a limited duration [7,8]. ASR acts effectively at all growth stages and triggers a hypersensitive response [9]. In contrast, APR is controlled by multiple minor APR genes/QTLs [10], offering incomplete yet durable resistance against all races. Non-race-specific APR genes show more stable long-term effectiveness in reducing disease severity. These genes predominantly function in adult plants and slow disease progression by inhibiting fungal growth [11]. The pathogen-specific nature of ASR makes it vulnerable to evolving virulent pathotypes, whereas the polygenic basis of APR ensures broad-spectrum protection with high evolutionary stability. In summary, leaf rust resistance includes race-specific and non-race-specific types, with distinct genetic and functional characteristics. However, as the plants grow and develop into the adult stage, they will ultimately exhibit a lower disease index. This resistance is achieved by delaying the processes of pathogen infection, growth, and reproduction [12].
Currently, in wheat, 83 genes have been officially named, and more than 100 leaf rust resistance genes have been documented [13]. Most of these genes are race-specific resistance genes and have a relatively short duration of action. Studies have identified only eight slow-rusting APR genes that do not target specific races, including Lr34 [14], Lr46 [15], Lr67 [16], Lr68 [17], Lr74 [18,19,20], Lr75 [21], Lr77 [22], and Lr78 [20]. Lr34 and Lr67 are the only two successfully cloned and characterized APR genes [23,24,25]. Significant attention toward the APR genes has facilitated the exploration of novel Lr resistance QTLs, with over 240 being discovered in wheat and dispersed throughout all 21 chromosomes [26]. It is uncommon for an individual QTL to grant sufficient resistance, especially in the presence of elevated disease pressure. Multiple QTLs or genes are necessary to develop a significant level of rust resistance [27].
Currently, several methods are widely used for gene mapping. Single nucleotide polymorphism (SNP) arrays are increasingly utilized to map genes and conduct genome-wide association studies (GWASs). KASP is a cost-effective genotyping technology that precisely detects SNP variants via fluorescent signals, facilitating rapid allele identification [28]. The 55K SNP provides a high-density marker panel specifically designed for gene mapping and breeding in wheat. These methods collectively enhance the accuracy and efficiency of gene mapping in diverse biological research and breeding applications. Thus, simple sequence repeat (SSR) markers are a preferable option for QTL mapping of wheat leaf rust owing to their genome-wide coverage, codominant inheritance, considerable information content, feasible detection, and reproducibility.
The discovery of six QTLs for leaf rust resistance (APR) in adult plants in Xinong1163-4 underscores the polygenic and complex nature of resistance in this cultivar. Three QTLs on chromosome 1BL (QLr.hbau-1BL.1, QLr.hbau-1BL.2, and QLr.hbau-1BL.3) represent potentially novel genetic loci, while the remaining three (QLr.hbau-3A, 4BL, and 4BL.1) align with previously documented resistance regions. The clustering of QTLs on chromosomes 1BL, 3A, and 4BL is consistent with global findings with these chromosomes being hotspots for broad-spectrum disease resistance, suggesting they play a pivotal role in durable APR. The wheat variety Xinong1163-4 can be traced back to 84/79 and Xinong1376. The specific gene(s) responsible for leaf rust resistance in this Chinese wheat cultivar from Shanxi province—highly resistant to leaf rust, stripe rust, and powdery mildew (Blumeria graminis f. sp. tritici) of wheat and possessing good agronomic traits—are not currently understood. To date, there is no report on the genetic patterns of resistance to leaf rust in Xinong1163-4. In the present study, we used the Xinong1163-4×Thatcher RIL population and an SSR marker array genotyping platform to identify the genetic basis of Lr resistance in this cultivar. This study’s findings offer a theoretical and practical framework for examining and using QTLs in cultivating crop varieties resistant to diseases. It is conducive to promoting the development of wheat disease-resistant breeding and provides new germplasm for ensuring wheat yield and quality and reducing disease losses.

2. Materials and Methods

2.1. Plant Materials and Pathogens

The plant materials, including 195 RILs from the cross between Xinong1163-4 and Thatcher, were developed by single-seed descent. Xinong1163-4 is a Chinese cultivar that is sensitive to Pt races at the seedling stage but highly resistant at the adult plant stage. It has excellent agronomic properties and is resistant to leaf rust, stripe rust, powdery mildew, and other diseases. In turn, Thatcher, a cornerstone susceptible parent in wheat genetics, is characterized by the absence of effective resistance genes against major rust pathogens, including leaf rust and stripe rust, and exhibits high susceptibility at all growth stages. This trait makes it an ideal partner for creating genetic populations such as recombinant inbred lines (RILs). By crossing Thatcher with the resistant cultivar Xinong1163-4, the study ensured that any observed resistance phenotypes in the RIL population could be directly attributed to the resistant parent’s alleles. This minimized genetic background noise and facilitated precise and robust mapping of resistance loci.
The sensitive cultivar, Zhengzhou 5389 was used as a susceptible control. Four Pt races (THTT, THTQ, THTS, and PHPS) were used to test the RILs in the fields. The Pt races were from the Biological Control Center for Plant Diseases and Plant Pests of Hebei, Hebei Agricultural University. (These materials are provided by the Wheat Rust Laboratory of Hebei Agricultural University, Baoding, China).

2.2. Field Experiments

The RIL population along with their parental lines was cultivated in Baoding, Hebei Province during the2017/2018, 2018/2019, and 2019/2020 cropping seasons for evaluation of leaf rust response (environments hereinafter referred to as 18BD, 19BD, and 20BD). The field trials were carried out using a randomized complete block design with two replicates. Each plot was a single 1 m row with 50 cm between rows. Approximately 20 seeds were sown in each plot. Every tenth row was followed by rows of the highly susceptible line Zhengzhou 5389 as a control. At the early jointing stage, leaf rust epidemics were initiated by inoculating the spreader rows with a water suspension containing equal amounts of urediniospores from Pt races (THTT, THTQ, THTS, and PHPS) at a concentration of 2–3 mg/mL, supplemented with a few drops of Tween 20 (0.03%). Disease severity was recorded two or three times at weekly intervals with the first scoring at 4 weeks after inoculation. Disease severity data (0 to 100%) was recorded as the percentage of leaf area covered with uredinia or necrotic stripes according to the modified Cobb scale [29], where 0% = immune and 100% = fully susceptible. When the disease severity reaches more than 50% (i.e., the diseased area accounts for more than half of the entire leaf area), the first field severity identification is initiated. Subsequent field assessments are conducted every 7 days until the severity reaches 100% and the population’s disease severity peaks, which generally requires three surveys to achieve the maximum severity. The severity recorded at the last and most severe incidence is defined as the final disease severity (FDS), and the corresponding field phenotypic data at this stage are used for QTL analysis. For bulked segregant analysis (BSA), the top 20% (39 lines) and bottom 20% (39 lines) of RILs with the lowest and highest disease severity scores across all three environments (18BD, 19BD, 20BD) were used to test the RILs in the field. This approach was employed to assist in mapping disease-resistant gene loci. These Pt races were sourced from the Biological Control Center for Plant Diseases and Plant Pests of Hebei Agricultural University, Baoding, China.
In this study on the leaf rust of Xinong 1163-4 and related lines, disease severity was recorded for the flag leaf only, as the flag leaf plays a crucial role in determining yield in the later growth stage of wheat and has relatively uniform physiological conditions, which is beneficial for consistent measurement according to the modified Cobb scale. For statistical analysis, significant differences in phenotype and maximum disease severity among trials (2018BD, 2019BD, and 2022BD) were identified using analysis of variance (ANOVA) in Microsoft Excel 2016.

2.3. Molecular Genotyping

The CTAB method was used to extract genomic DNA from the leaves of each of the 195 RILs and the two parental lines [30]. DNA concentrations were measured using a Thermo Scientific NanoDrop 2000 (Thermo Fisher Scientific Inc., Waltham, MA, USA). We randomly selected 10 recombinant inbred lines (RILs) from 195 RILs for preliminary SNP detection. After locating chromosomes with high polymorphism, SSR markers were used for further analysis. SSR markers were also employed to genotype the entire population. Linkage maps were constructed using the MAP function in IciMapping 4.1 software (developed by the Institute of Crop Science, Chinese Academy of Agricultural Sciences, Beijing, China), with groups ordered by the Kosambi map function algorithm to derive map distances from recombination frequencies. Linkage maps were graphically visualized with MapChart 2.3 (developed by Roel van Ooijen from Wageningen University, Wageningen, The Netherlands).
For KASP genotyping, in addition to SSR markers and the Affymetrix 55K SNP Array, kompetitive allele-specific PCR (KASP) markers were used to validate and fine-map candidate regions identified through BSA and initial QTL analysis. KASP assays were designed for 20 SNPs showing significant allele frequency differences (Δp ≥ 0.3) between the resistant and susceptible bulks. Primer sequences for KASP markers were designed based on the Chinese Spring wheat reference genome (IWGSC RefSeq v1.0) using BatchPrimer3 software (version 3.5.0,developed by the Department of Plant Sciences, University of California, Davis, Davis, CA, USA) [31].
Regarding KASP reaction conditions, each 10 μL reaction contained 5 μL of 2× KASP Master Mix (LGC Biosearch Technologies, Hoddesdon, UK), 0.14 μL of primer mix (forward primer: 12 μM each, reverse primer: 30 μM), and 50 ng of genomic DNA. The thermal cycling program was 94 °C for 15 min; 10 cycles of 94 °C for 20 s, touchdown from 65 °C to 57 °C (0.8 °C per cycle); followed by 26 cycles of 94 °C for 20 s and 57 °C for 1 min. Fluorescence signals were detected using a Roche LightCycler 480 II (Roche Diagnostics GmbH, Mannheim, Germany).

2.4. Construction of Linkage Maps and QTL Analysis

Using the genotyping data from the hybrid mapping population, QTLs associated with MDS were identified using QTL IciMapping 3.2. (developed by the Chinese Academy of Agricultural Sciences, Beijing, China) to make a chain diagram. A logarithm of the odds (LOD) threshold of 2.5 was used to identify significant QTL with 1000 permutations at p < 0.01. Stepwise regressions were used to calculate the phenotypic variance explained (PVE, R2) by each QTL. The effect orientation of each QTL was determined [32], while the gene effect was determined by calculating the DR value (the ratio of the absolute value of the dominant effect and the additive effect). Although in a typical RIL population, dominance effects are expected to be minimized, in our study, due to specific genetic background or experimental conditions, there are still detectable dominance effects. The DR value was calculated as the ratio of the absolute dominant effect (∣d∣) to the absolute additive effect (∣a∣) using QTL IciMapping 3.2, where d and a represent the estimated dominant and additive effects, respectively. The flanking sequences of all SNP and SSR probes were searched against the Chinese Spring wheat reference sequence (IWGSC RefSeq v1.0, https://urgi.versailles.inra.fr/blast_iwgsc/blast.php) (accessed on 15 February 2024) using BLAST 2.10.1 software (NCBI, Bethesda, MD, USA) to identify homologous sequences.
For integration of KASP markers, markers validated by KASP were incorporated into the linkage map to refine QTL intervals. High-confidence QTL regions were defined as those supported by both SNP array data and KASP genotyping results.

2.5. Wheat Primers and PCR Programs

SSR primer pairs were designed via BLAST search from the Chinese Spring wheat genome sequence (International Wheat Genome Sequencing Consortium, URL: https://urgi.versailles.inra.fr/blast_iwgsc/blast.php (accessed on 1 June 2024)). These primers were primarily located near identified quantitative trait loci (QTLs) to facilitate the detection of genetic variations closely associated with target traits. However, based on specific genetic maps or previous studies, some primers were also designed in regions potentially linked to QTLs. Initially, a total of 1062 SSR primer pairs were designed for polymorphism detection between the two parental lines, Xinong 1163-4 and Thatcher. Subsequently, 382 primer pairs were screened for further analysis in resistant and susceptible subpopulations. The SSR primers were designed using Primer Premier 5 software (Premier Biosoft International, Palo Alto, CA, USA). The reaction program for the SSR primers used for PCR amplification was 94 °C for 5 min, 94 °C for 1 min, and annealing at 55 °C to 45 s (depending on the primers, the temperature was adjusted in the range of 50–60 °C, and 55 °C was mostly used for primary screening), 72 °C for 1 min, and 72 °C for 10 min. The denaturation to extension process was 35 cycles, and the amplified samples were stored at 4 °C after the reaction was terminated. For csLV46G22 PCR programs, the sequence of the CAP labelled csLV46G22 was 5′-TCGACTTTGGAATGGGAGTTGC-3′ upstream and 5′-GGCGAAGATGCCATCATCCACCAG-3′ downstream. Its PCR program was the same as that of SSR PCR programs, which was 94 °C for 5 min, 94 °C for 1 min, 55 °C (depending on the primers, the temperature was adjusted in the range of 50–60 °C, and 55 °C was mostly used for primary screening) annealing for 45 s, 72 °C for 1 min, and 72 °C for 10 min. The amplified products were digested by BsPEI under the reaction conditions of 37 °C for 2 h and 80 °C for 30 min, and the digested products were used for electrophoretic detection.

3. Results

3.1. Field Testing

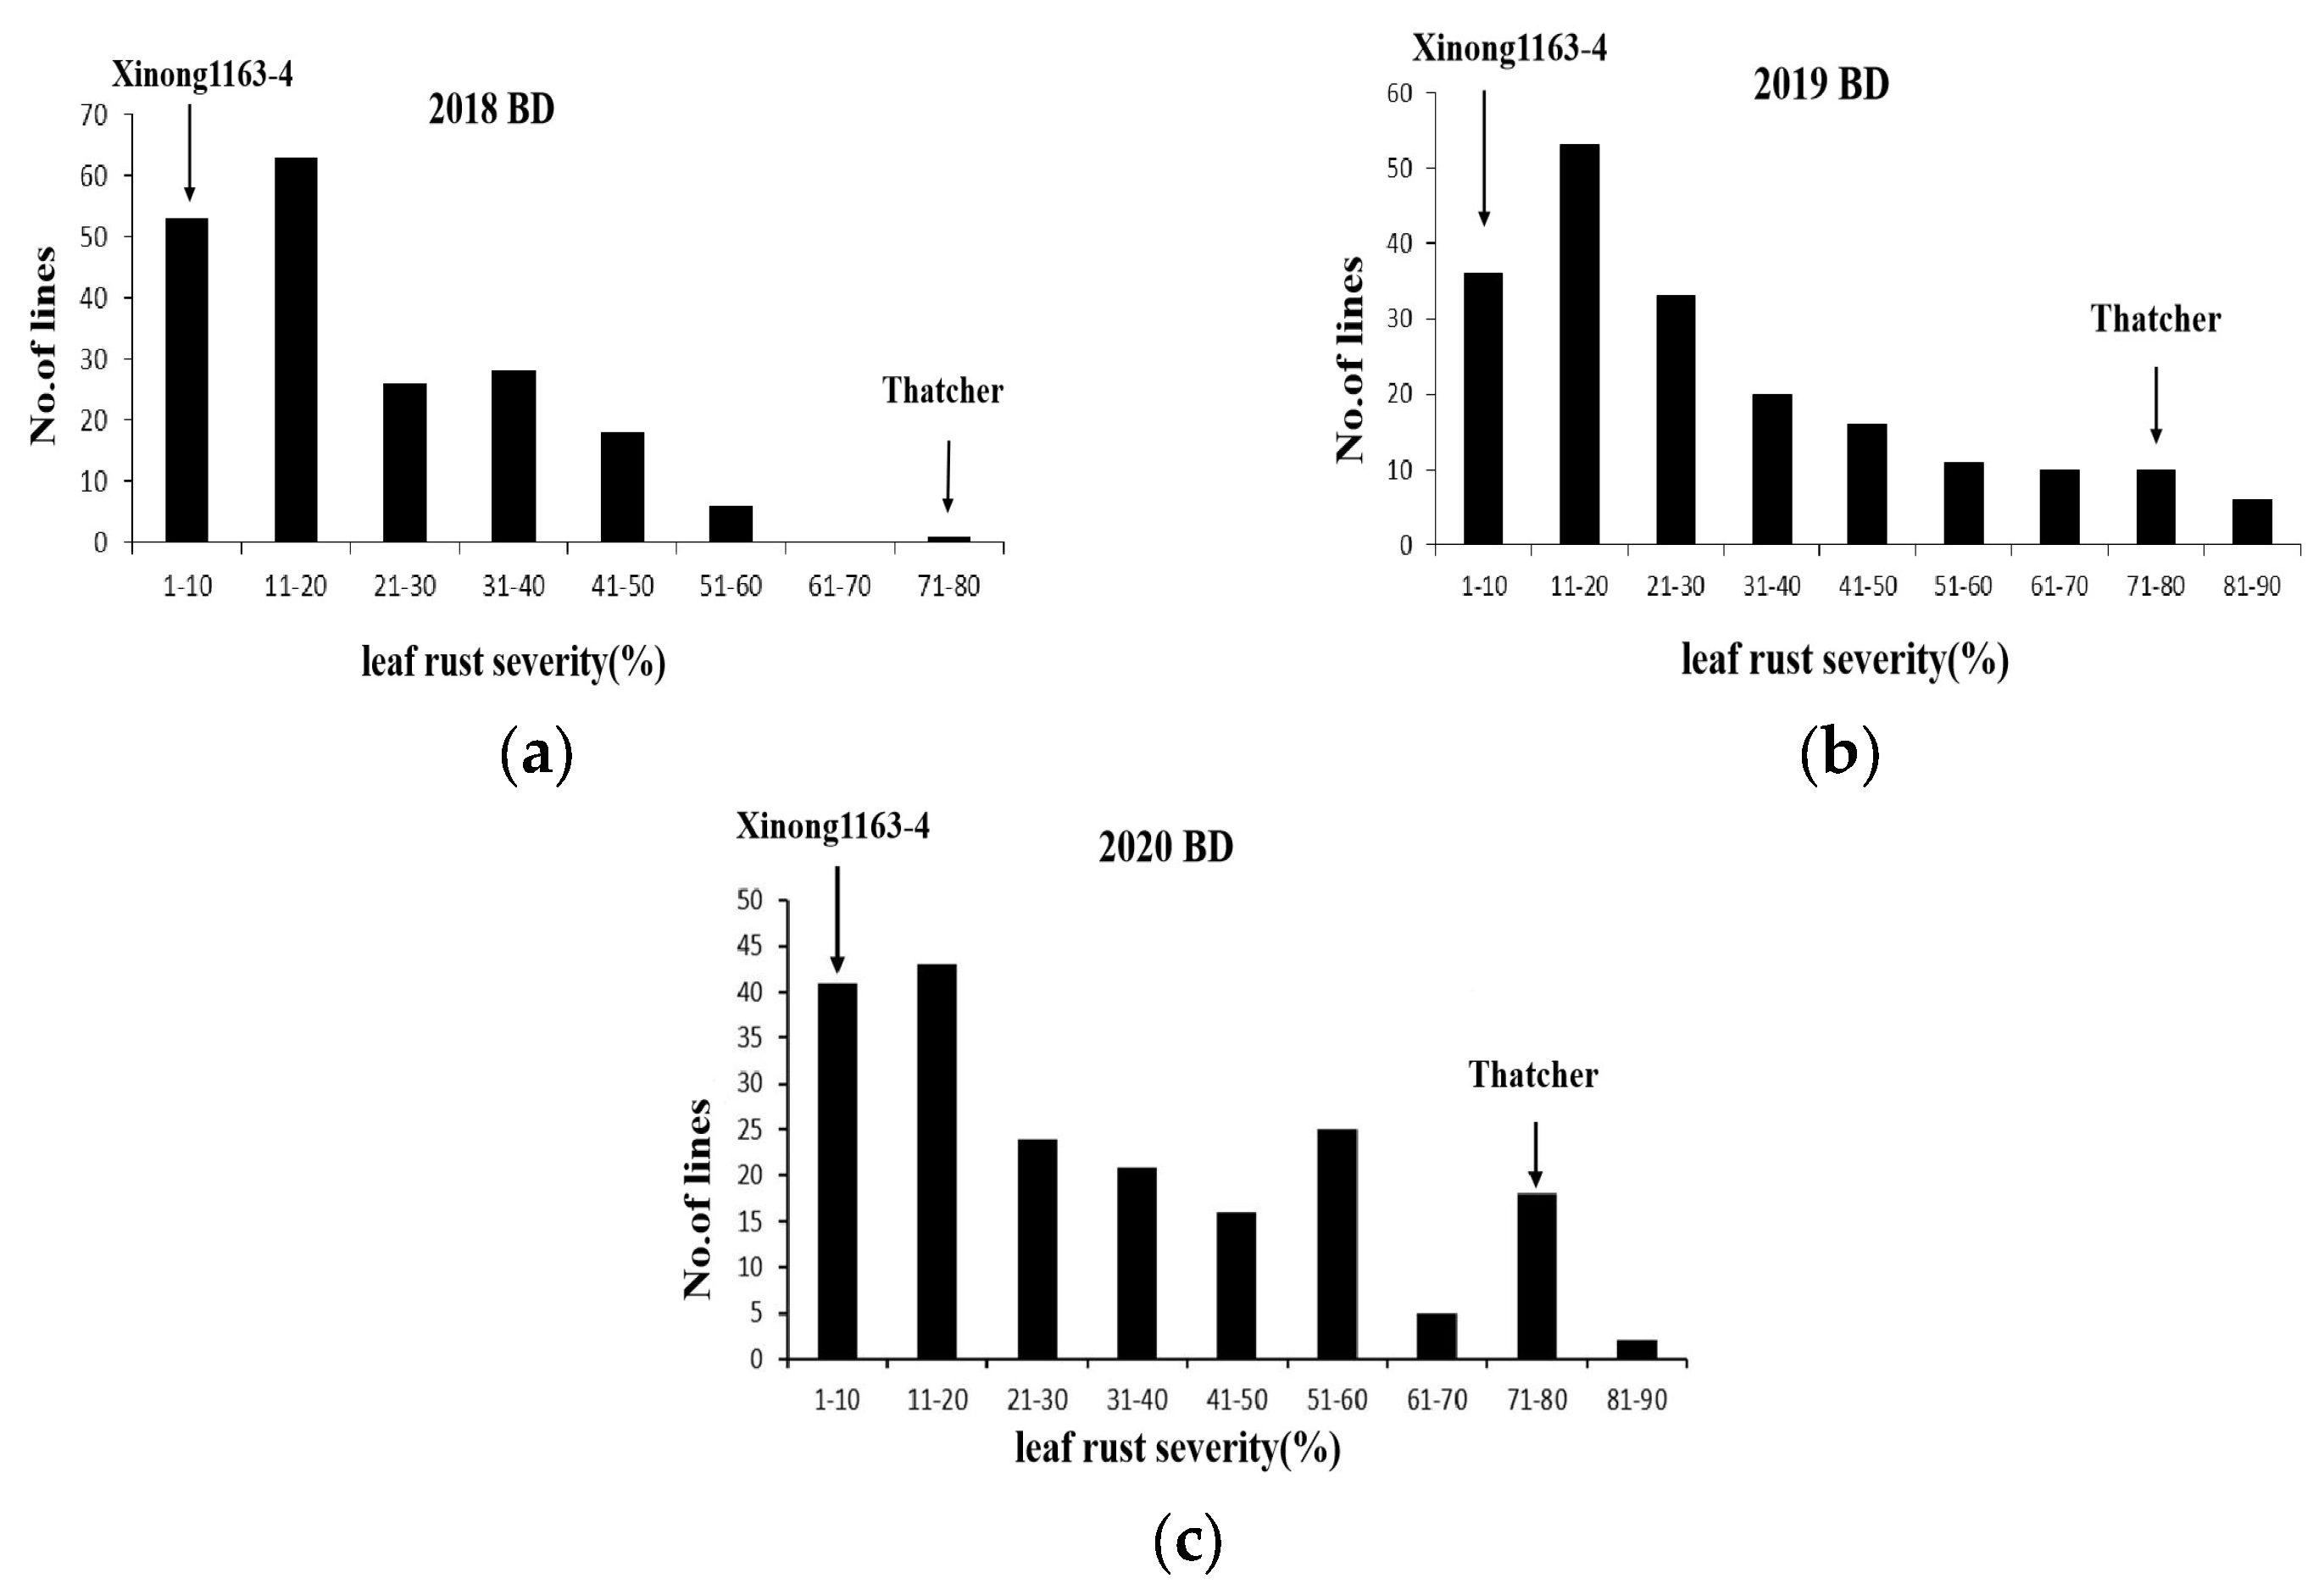
Xinong1163-4 and Thatcher had mean leaf rust MDS scores of 1% and 80%, respectively. Across all environments, the mean leaf rust severity scores for the RILs ranged between 24.23% and 35.19% (Figure 1 and Table 1). The continuous distribution of mean leaf rust MDS frequencies in the population suggested quantitative inheritance. The maximum disease severity scores for leaf rust across the three environments were significantly correlated, with coefficients ranging from 0.50 to 0.63 (p < 0.001) (Table 2). ANOVA confirmed significant variation among the genotypes, environments, and genotype × environment for leaf rust.
The MDS for the 2017/2018, 2018/2019, and 2019/2020 cropping seasons in Baoding, Hebei province are reported. The relatively high variance coefficient values (64.31, 73.43, 68.44) for the MDS in the Xinong1163-4×Thatcher RIL population indicate a large degree of dispersion in the disease severity among different lines. This could be attributed to the diverse genetic backgrounds within the population, as well as environmental fluctuations across the different cropping seasons.

3.2. Genetic Analysis of Markers

A total of 382 SSR markers among 1062 SSR markers in total showed polymorphism between parents and were used to test the resistant and susceptible bulks. We found 68 primers with a recombination frequency of less than 30% in small populations, allowing for genotyping of the entire population [33].

3.3. Genetic Linkage Mapping and QTL Mapping

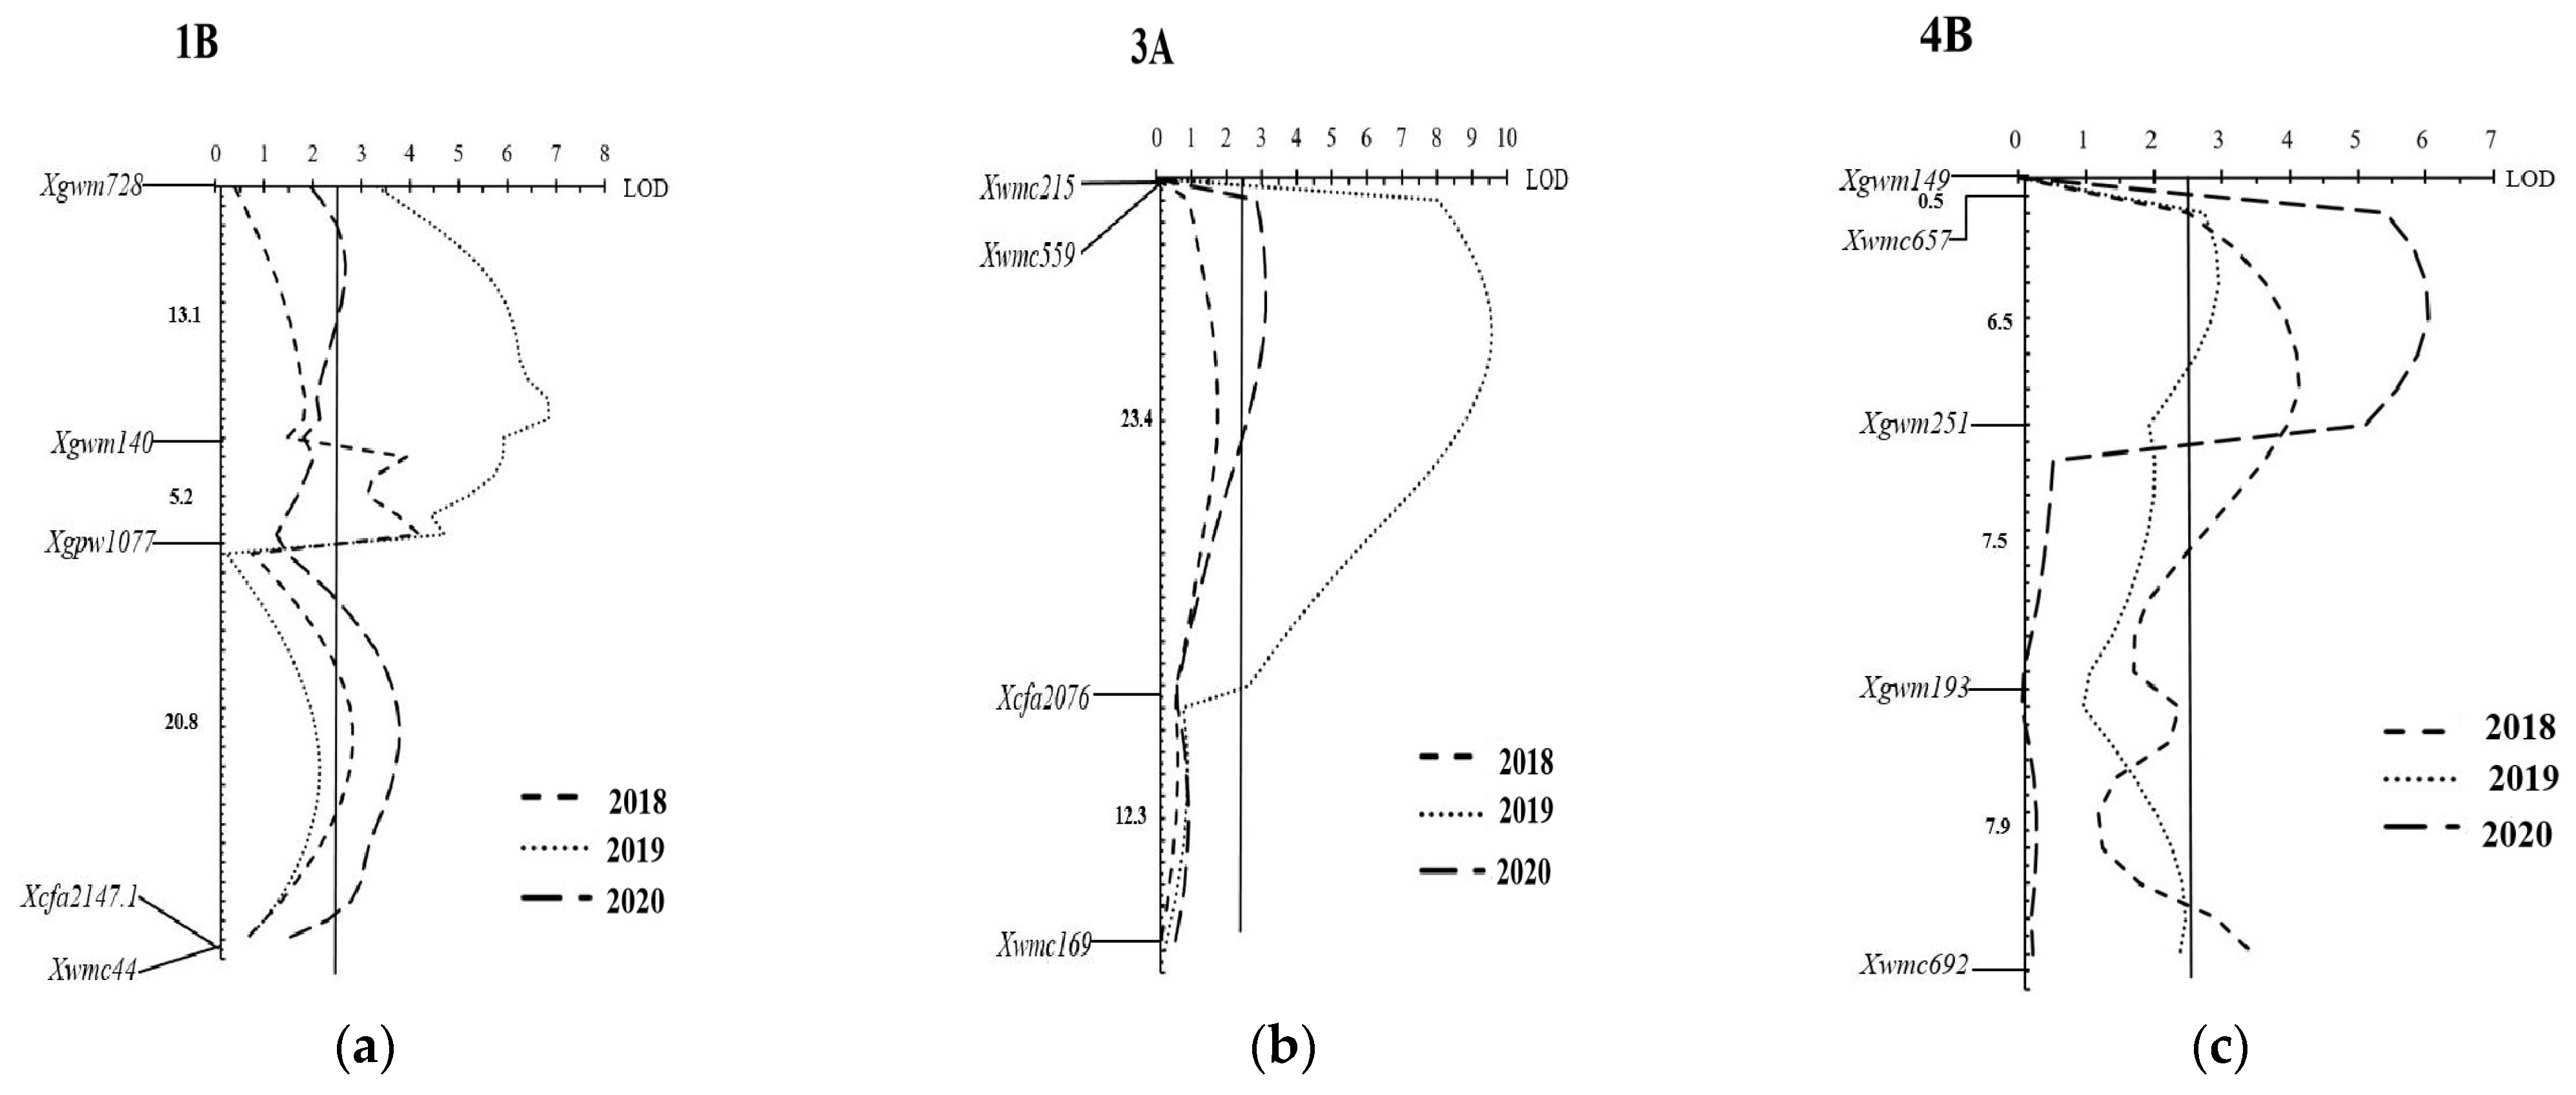
Finally, the genotyping results of 14 markers were used to construct the linkage map for QTL detection using the IciMapping 4.1 software. Six linkage groups were constructed and were distributed on chromosomes 1BL, 3A, and 4BL according to wheat consensus maps. A total of six quantitative trait loci (QTLs) associated with adult plant resistance (APR) to leaf rust were identified on chromosomes 1B, 3A, and 4B (Figure 2, Table 2). QLr.hbau-1BL.1 was detected in the 2018 environment, QLr.hbau-1BL.2 in 2018 and 2020, and QLr.hbau-1BL.3 in 2019 and 2020, explaining 10.66%, 3.37–5.44%, and 21.88–6.16% of the phenotypic variance for leaf rust severity, respectively (Figure 2, Table 3). A major QTL on chromosome 1BL, flanked by markers Xgwm728-Xgwm140, was identified as Lr46, a known leaf rust resistance gene. QLr.hbau-3A, detected in the 2019 and 2020 experiments, explained 6.63–24.95% of the phenotypic variance and was delimited by markers Xwmc215-Xcfa2076. QLr.hbau-4BL, a consistently detected major QTL across all three environments (2018–2020), explained 8.13%, 5.31%, and 12.23% of the phenotypic variance, respectively, and was flanked by markers Xwmc657-Xgwm251. QLr.hbau-4BL.1 was detected in the 2018 environment, explaining 12.18% of the phenotypic variance for leaf rust severity. All resistance alleles of the six QTLs were derived from the parental line Xinong1163-4 (Table 3). Based on the criteria that major QTLs explain ≥10% and minor QTLs explain <10% of phenotypic variance, the major QTLs include QLr.hbau-1BL.1 and QLr.hbau-4BL.1 in the 2018BD environment, QLr.hbau-1BL.3 and QLr.hbau-3A in the 2019BD environment, and QLr.hbau-4BL in the 2020BD environment. The minor QTLs cover QLr.hbau-1BL.2 and QLr.hbau-4BL in the 2018BD environment; QLr.hbau-4BL in the 2019BD environment; and QLr.hbau-1BL.3, QLr.hbau-1BL.2, and QLr.hbau-3A in the 2020BD environment. This classification is helpful for subsequent research on the functions and application values of QTLs.

3.4. csLV46G22 Molecular Marker Identification

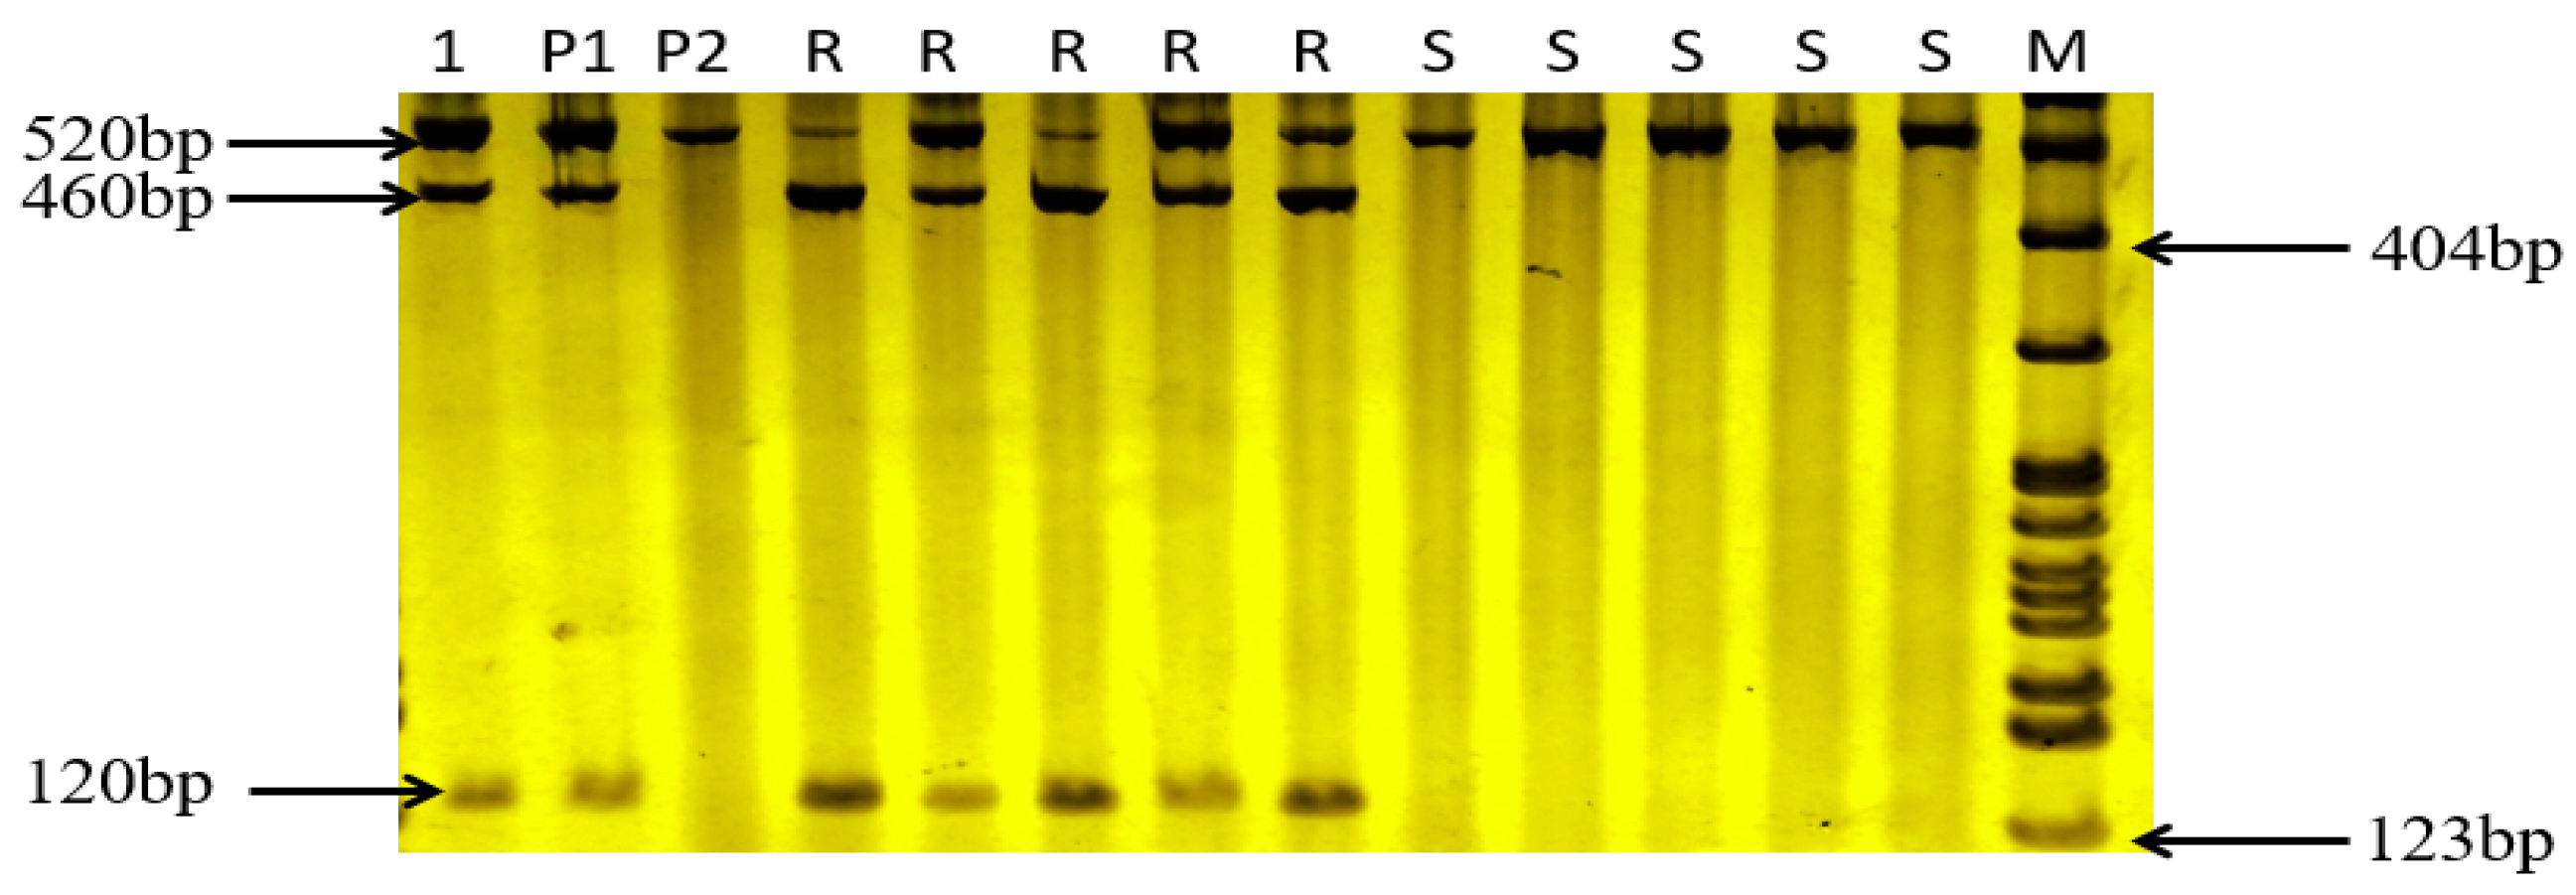
The gene Lr46, which has now been identified at 1BL, was validated against two parents as well as five disease-resistant and five disease-susceptible lines using the CAP marker csLV46G22, which co-segregated with the gene (Figure 3). The near-isogenic lines containing Lr46 produce a 460 bp and a 120 bp DNA fragment, and the cultivars without Lr46 only produce a fragment of about 520 bp. In this test, both disease-resistant parents and disease-resistant subpopulations produce two bands of 460 bp and 120 bp, while disease-susceptible parents and disease-susceptible subpopulations only produce a single band of 520 bp, demonstrating the presence of Lr46.

4. Discussion

The four Pt races included in this study were strategically selected based on their prevalence in China’s major wheat-growing regions, particularly the Huang-Huai River Valley where Xinong1163-4 is cultivated. These races reflect dominant virulence patterns in farmer fields, ensuring that identified QTLs confer resistance to ecologically relevant pathogen strains. Notably, the presence of QTLs like QLr.hebau-1BL (putatively linked to Lr46) suggests broad applicability, as Lr46 confers effective resistance against diverse Pt races globally. Six QTLs for leaf rust resistance were detected in the current study. The total phenotypic variance across environments for leaf rust was 3.37–24.95%, indicating their significant effects in reducing disease severity. The QTLs detected in this study were compared with the known genes or QTLs based on the chromosome position, molecular marker, pedigree, and resistance to rusts.
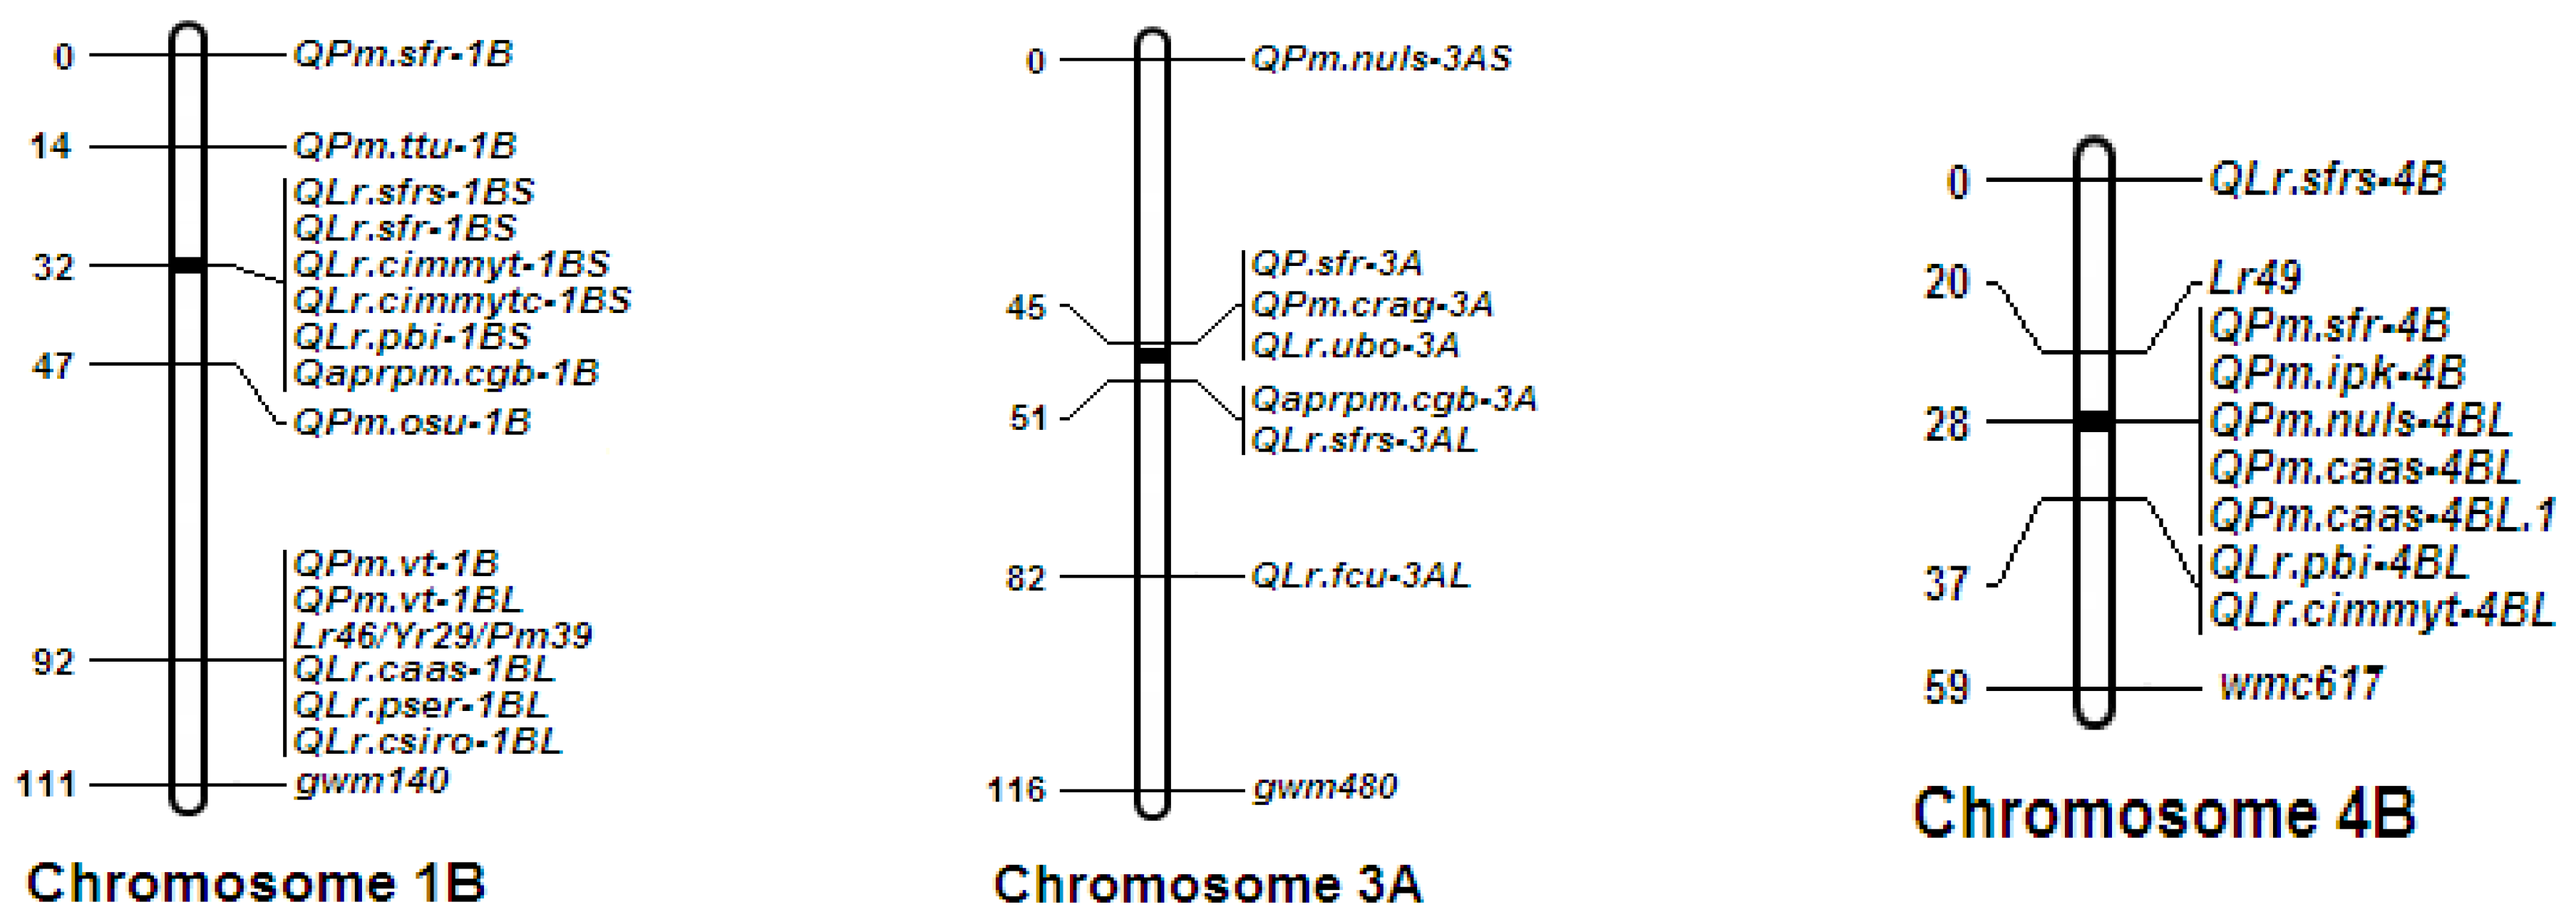
Based on the positions of closely linked markers, QLr.hebau-1BL appeared to be the pleiotropic gene Lr46/Yr29/Pm39/Ltn2. The QTLs identified on chromosome 1BL (QLr.hbau-1BL.1, QLr.hbau-1BL.2, and QLr.hbau-1BL.3) were predicted to correspond to the gene Lr46/Yr29/Pm39/Ltn2.Lr46, a slow rust gene from common wheat that is located at the end of chromosome 1BL and confers resistance to leaf rust in adult plants. Lr46 is widely used in CIMMYT wheat cultivars and has provided stable improvements in disease resistance for more than 30 years [34]. In genetic mapping studies, it was found that the quantitative trait loci (QTL), QLr.hbau-1BL.3, showed significant similarity in flanking markers on chromosomes with the leaf rust resistance gene Lr46. Specifically, the marker intervals of the three are all distributed in similar genetic positions on the wheat 1BL chromosome arm, and some key molecular markers (such as SSR markers or SNP markers) overlap or are tightly linked, suggesting that they may share a similar genetic background or be in a highly linked state on the chromosome. Lr46 was linked to the SSR marker Xwmc44 [35], which was detected in the 1BL linkage map in all three experiments. This suggests that the three QTLs on chromosome 1BL (QLr.hbau-1BL.1, QLr.hbau-1BL.2, and QLr.hbau-1BL.3) are equivalent to Lr46. Interestingly, the Xgpw1077 marker was detected for the first time in the Lr46 marker interval, providing a new marker reference for gene location and an additional option for molecular marker-assisted breeding. Genes associated with powdery mildew, stripe rust, and stem rust resistance were also detected at this location. Therefore, Xinong1163-4 may also be resistant to powdery mildew, stripe rust, and stem rust, although this possibility requires further testing. To date, the APR genes Lr12 [36] and Lr49 [37] and three QTLs, including QLr.cimmyt-4BL, QLr.pbi-4BL, and QLr.zh-4B [22,31,38], have been identified. The 4BL chromosome harbors several important genetic factors for adult plant resistance (APR) to wheat leaf rust, including the characterized APR genes Lr12 (flanked by Xgwm251-Xgwm149) and Lr49 (flanked by Xbarc163-Xwmc349), and multiple QTLs, such as QLr.cimmyt-4BL (Xgwm495-Xgwm368), QLr.pbi-4BL (linked to wPt-1708) [39], QLr.zh-4B(Xwmc692-Xwmc657), and QLr.hbau-4BL(Xwmc657-Xgwm251). Notably, QLr.zh-4B has been shown to coincide with Lr12. While both Lr12 and Lr49 confer APR, they exhibit differences in pathogen specificity.
While standard QTL mapping approaches were employed, several limitations require attention. First, the phenotypic data analysis, despite relying on repeated assessments over three growing seasons, lacked longitudinal modeling, limiting the capture of genotype-by-environment interaction (GEI) effects. Although Table 2 reports moderate phenotypic correlations (r = 0.45–0.68) across years, this oversight means that the absence of formal GEI analysis may have obscured environment-specific QTL effects. Secondly, the use of SSR markers with an average spacing of 10–15 cM restricted genetic map precision; consequently, higher-density genotyping technologies would enable finer QTL interval mapping and distinguish between tightly linked loci or pleiotropic effects. Finally, the study also did not model QTL×QTL interactions or correlate leaf rust resistance with agronomic traits, both of which are critical for breeding well-rounded cultivars.
Future research should prioritize integrating longitudinal and multi-environment data using genomic selection (GS) frameworks to quantify GEI and predict QTL performance across diverse environments. Fine mapping using near-isogenic lines (NILs) or recombinant populations will be essential to narrow down novel QTLs on 1BL and validate their association with Lr46-like resistance mechanisms. Multi-omics integration—combining QTL mapping with transcriptomics, proteomics, and epigenomics—will aid in identifying candidate genes underlying resistance, particularly for the multi-disease resistance QTL on 4BL.

5. Conclusions

Wheat leaf rust, caused by Puccinia triticina, poses a severe threat to global wheat production, making the development of disease-resistant cultivars a core strategy for green control. In this study, the Chinese wheat cultivar Xinong1163-4, which exhibits excellent field resistance, was used as the material. Using phenotypic analysis of leaf rust in 195 Xinong1163-4/Thatcher recombinant inbred lines (RILs) across three growing seasons (2017/2018–2019/2020, Baoding, Hebei), combined with bulked segregant analysis and SSR marker technology, six adult plant resistance (APR)-related quantitative trait loci (QTLs) were successfully mapped.
These QTLs explained 3.37–24.95% of the phenotypic variation in leaf rust across different environments, significantly reducing disease severity. Notably, some of these loci are previously unreported novel resistance loci, filling gaps in existing resistance gene maps. By comparing chromosome positions, molecular markers, pedigrees, and rust resistance with known genes or QTLs, this study not only provides new genetic resources for wheat leaf rust resistance breeding but also lays a theoretical foundation for the precise application of marker-assisted selection (MAS) technology in cultivating disease-resistant varieties.
In the future, pyramiding the QTLs identified in this study with known resistance genes and combining them with molecular marker-based directional selection is expected to accelerate the development of wheat varieties with broad-spectrum and durable rust resistance. This will provide critical technical support for ensuring global wheat yield stability, reducing reliance on chemical pesticides, and maintaining food security.

Author Contributions

Conceptualization, J.Z. and Z.K.; methodology, J.Z.; software, J.Z.; validation, J.Z., X.L. (Xue Li) and L.X.; formal analysis, M.L.; investigation, J.Z.; resources, Z.K.; data curation, X.L. (Xue Li); writing—original draft preparation, J.Z.; writing—review and editing, X.L. (Xing Li) and Z.K.; visualization, L.X.; supervision, X.L. (Xing Li) and Z.K.; project administration, J.Z.; funding acquisition, Z.K. All authors have read and agreed to the published version of the manuscript.

Funding

This research was funded by the National Natural Science Foundation of China (32001890) and the 2023 Scholarship Program for Introducing Overseas Students (C20230107).

Data Availability Statement

No new data were created or analyzed in this study.

Conflicts of Interest

The authors declare no conflict of interest. The funders had no role in the design of the study; in the collection, analyses, or interpretation of data; in the writing of the manuscript; or in the decision to publish the results.

Abbreviations

The following abbreviations are used in this manuscript:
LrWheat leaf rust
PtPuccinia triticina Eriks
RILsRecombinant inbred lines
QTLsQuantitative trait loci
APRAdult plant resistance
ASRAll-stage resistance
SSRSimple sequence repeat
SNPSingle nucleotide polymorphism
GWASGenome-wide association studies
MDSMaximum disease severity
ANOVAAnalysis of variance
LODLogarithm of the odds
PVEPhenotypic variation explained
CIMMYTInternational Maize and Wheat Improvement Center

References

  1. Bolton, M.D.; Kolmer, J.A.; Garvin, D.F. Wheat leaf rust caused by Puccinia triticina. Mol. Plant Pathol. 2008, 9, 563–575. [Google Scholar] [CrossRef] [PubMed]
  2. Huerta-Espino, J.; Singh, R.P.; Germán, S.; McCallum, B.D.; Park, R.F.; Chen, W.Q.; Bhardwaj, S.C.; Goyeau, H. Global status of wheat leaf rust caused by Puccinia triticina. Euphytica 2011, 179, 143–160. [Google Scholar] [CrossRef]
  3. Xu, X.; Duan, Z.; Su, J.; Li, X.; Wu, J.; Yao, Z. QTL mapping of adult-plant resistance to leaf rust based on SSR markers and SNP sequencing of Chinese wheat landrace Xu’ai (Triticum aestivum L.). Genet. Resour. Crop Evol. 2021, 68, 1359–1373. [Google Scholar] [CrossRef]
  4. Zhao, J.; Kang, Z.S. Fighting wheat rusts in China: A look back and into the future. Phytopathol. Res. 2023, 5, 6. [Google Scholar] [CrossRef]
  5. Khan, M.; Bukhari, A.; Dar, Z.; Rizvi, S. Status and strategies in breeding for rust resistance in wheat. Agric. Sci. 2013, 4, 292–301. [Google Scholar] [CrossRef]
  6. Peng, H.; Lv, G.Q.; Wang, J.R. Hénán shěng 2015 nián xiǎomài zhǔyào bìnghài fāshēng tèdiǎn jí yuányīn fēnxī [Occurrence characteristics and causes of major wheat diseases in Henan Province in 2015]. China Plant Prot. Guide 2016, 3, 91–93. [Google Scholar]
  7. Li, M.; Banshali, F.; Brar, G.S.; Rozek, A.; Bakkeren, G. In Vitro and in Planta Fungicide Testing for Management of Wheat Rusts. Methods Mol. Biol. 2025, 2898, 361–377. [Google Scholar] [CrossRef]
  8. Mourad, A.M.I.; Ahmed, A.A.M.; Baenziger, P.S.; Börner, A.; Sallam, A. Broad-spectrum resistance to fungal foliar diseases in wheat: Recent efforts and achievements. Front. Plant Sci. 2024, 13, 1516317. [Google Scholar] [CrossRef]
  9. Yadav, J.K.; Sinha, S.; Shukla, H.; Singh, A.; Sahu, T.K.; Jha, S.K.; Kumari, J.; Verma, M.; Kumar, S.; Singh, R.; et al. Genetic dissection of leaf rust resistance in a diversity panel of tetraploid wheat (Triticum turgidum). BMC Plant Biol. 2025, 25, 406. [Google Scholar] [CrossRef]
  10. Spychała, J.; Noweiska, A.; Tomkowiak, A.; Bobrowska, R.; Szewczyk, K.; Kwiatek, M.T. Unraveling Effects of miRNAs Associated with APR Leaf Rust Resistance Genes in Hybrid Forms of Common Wheat (Triticum aestivum L.). Int. J. Mol. Sci. 2025, 26, 665. [Google Scholar] [CrossRef]
  11. Lin, F.; Chen, X.M. Genetics and molecular mapping of genes for race-specific all-stage resistance and non-race-specific high-temperature adult-plant resistance to stripe rust in spring wheat cultivar Alpowa. Theor. Appl. Genet. 2007, 114, 1277–1287. [Google Scholar] [CrossRef]
  12. Zhang, P.; Lan, C.; Asad, M.A.; Gebrewahid, T.W.; Xia, X.; He, Z.; Li, Z.; Liu, D. QTL mapping of adult-plant resistance to leaf rust in the Chinese landraces Pingyuan 50/Mingxian 169 using the wheat 55K SNP array. Mol. Breed. 2019, 39, 98. [Google Scholar] [CrossRef]
  13. Kolmer, J.A.; Bajgain, P.; Rouse, M.N.; Li, J.; Zhang, P. Mapping and characterization of the recessive leaf rust resistance gene Lr83 on wheat chromosome arm 1DS. Theor. Appl. Genet. 2023, 136, 115. [Google Scholar] [CrossRef] [PubMed]
  14. Mourad, A.M.I.; Draz, I.S.; Omar, G.E.; Börner, A.; Esmail, S.M. Genome-Wide Screening of Broad-Spectrum Resistance to Leaf Rust (Puccinia triticina Eriks) in Spring Wheat (Triticum aestivum L.). Front. Plant Sci. 2022, 13, 921230. [Google Scholar] [CrossRef] [PubMed]
  15. Singh, R.P.; Mujeeb-Kazi, A.; Huerta-Espino, J. Lr46: A gene conferring slow-rusting resistance to leaf rust in wheat. Phytopathology 1998, 88, 890–894. [Google Scholar] [CrossRef]
  16. Herrera-Foessel, S.A.; Singh, R.P.; Lillemo, M.; Huerta-Espino, J.; Bhavani, S.; Singh, S.; Lan, C.; Calvo-Salazar, V.; Lagudah, E.S. Lr67/Yr46 confers adult plant resistance to stem rust and powdery mildew in wheat. Theor. Appl. Genet. 2014, 127, 781–789. [Google Scholar] [CrossRef]
  17. Herrera-Foessel, S.A.; Singh, R.P.; Huerta-Espino, J.; Rosewarne, G.M.; Periyannan, S.K.; Viccars, L.; Calvo-Salazar, V.; Lan, C.; Lagudah, E.S. Lr68: A new gene conferring slow rusting resistance to leaf rust in wheat. Theor. Appl. Genet. 2012, 124, 1475–1486. [Google Scholar] [CrossRef]
  18. Kolmer, J.A.; Chao, S.; Brown-Guedira, G.; Bansal, U.; Bariana, H. Adult plant leaf rust resistance derived from the soft red winter wheat cultivar ‘Caldwell’ maps to chromosome 3BS. Crop Sci. 2018, 58, 152–158. [Google Scholar] [CrossRef]
  19. Kolmer, J.A.; Su, Z.; Bernardo, A.; Bai, G.; Chao, S. Mapping and characterization of the new adult plant leaf rust resistance gene Lr77 derived from Santa Fe winter wheat. Theor. Appl. Genet. 2018, 131, 1553–1560. [Google Scholar] [CrossRef]
  20. Kolmer, J.A.; Bernardo, A.; Bai, G.; Hayden, M.J.; Chao, S. Adult plant leaf rust resistance derived from Toropi wheat is conditioned by Lr78 and three minor QTL. Phytopathology 2018, 108, 246–253. [Google Scholar] [CrossRef]
  21. Singla, J.; Lüthi, L.; Wicker, T.; Bansal, U.; Krattinger, S.G.; Keller, B. Characterization of Lr75: A partial, broad–spectrum leaf rust resistance gene in wheat. Theor. Appl. Genet. 2017, 130, 1–12. [Google Scholar] [CrossRef]
  22. Kolmer, J.A.; Rouse, M.N. Adult plant leaf rust resistance QTL derived from wheat line CI13227 maps to chromosomes 2AL, 4BS, and 7AL. Plant Genome 2022, 15, e20215. [Google Scholar] [CrossRef] [PubMed]
  23. Krattinger, S.G.; Lagudah, E.S.; Spielmeyer, W.; Singh, R.P.; Huerta-Espino, J.; McFadden, H.; Bossolini, E.; Selter, L.L.; Keller, B.A. putative ABC transporter confers durable resistance to multiple fungal pathogens in wheat. Science 2009, 323, 1360–1363. [Google Scholar] [CrossRef] [PubMed]
  24. Moore, J.W.; Herrera-Foessel, S.; Lan, C.; Schnippenkoetter, W.; Ayliffe, M.; Huerta-Espino, J.; Lillemo, M.; Viccars, L.; Milne, R.; Periyannan, S.; et al. A recently evolved hexose transporter variant confers resistance to multiple pathogens in wheat. Nat. Genet. 2015, 47, 1494–1498. [Google Scholar] [CrossRef]
  25. Spychała, J.; Tomkowiak, A.; Noweiska, A.; Bobrowska, R.; Bocianowski, J.; Sobiech, A.; Kwiatek, M.T. Diversity of Expression Patterns of Lr34,Lr67, and Candidate Genes towards Lr46 with Analysis of Associated miRNAs in Common Wheat Hybrids in Response to Puccinia triticina Fungus. Curr. Issues Mol. Biol. 2024, 46, 5511–5529. [Google Scholar] [CrossRef]
  26. Pinto da Silva, G.B.; Zanella, C.M.; Martinelli, J.A.; Chaves, M.S.; Hiebert, C.W.; McCallum, B.D.; Boyd, L.A. Quantitative trait loci conferring leaf rust resistance in hexaploid wheat. Phytopathology 2018, 108, 1344–1354. [Google Scholar] [CrossRef]
  27. Singh, R.; Huerta-Espino, J.; Rajaram, S. Achieving near-immunity to leaf and stripe rusts in wheat by combining slow rusting resistance genes. Acta Phytopathol. Entomol. Hung. 2000, 35, 133–139. [Google Scholar]
  28. Semagn, K.; Babu, R.; Hearne, S.; Olsen, M. Single nucleotide polymorphism genotyping using Kompetitive Allele Specific PCR (KASP): Overview of the technology and its application in crop improvement. Mol. Breed. 2014, 33, 1–14. [Google Scholar] [CrossRef]
  29. Peterson, R.F.; Campbell, A.B.; Hannah, A.E. A diagrammatic scale for estimating rust intensity on leaves and stems of cereals. Can. J. Res. 1948, 26, 496–500. [Google Scholar] [CrossRef]
  30. Sharp, P.J.; Kreis, M.; Shewry, P.R.; Gale, M.D. Location of β-amylase sequences in wheat and its relatives. Theor. Appl. Genet. 1988, 75, 286–290. [Google Scholar] [CrossRef]
  31. Zhang, P.; Yin, G.; Zhou, Y.; Qi, A.; Gao, F.; Xia, X.; He, Z.; Li, Z.; Liu, D. QTL mapping of adult-plant resistance to leaf rust in the wheat cross Zhou 8425B/Chinese spring using high–density SNP Markers. Front. Plant Sci. 2017, 8, 793. [Google Scholar] [CrossRef]
  32. Singh, D.; Simmonds, J.; Park, R.F.; Bariana, H.S.; Snape, J.W. Inheritance and QTL mapping of leaf rust resistance in the European winter wheat cultivar ‘Beaver’. Euphytica 2009, 169, 253–261. [Google Scholar] [CrossRef]
  33. Sun, Z.; Li, H.; Zhang, L.; Wang, J. Estimation of recombination frequency in bi-parental genetic populations. Genet. Res. 2012, 94, 163–177. [Google Scholar] [CrossRef] [PubMed]
  34. Lillemo, M.; Joshi, A.K.; Prasad, R.; Chand, R.; Singh, R.P. QTL for spot blotch resistance in bread wheat line Saar co-locate to the biotrophic disease resistance loci Lr34 and Lr46. Theor. Appl. Genet. 2013, 126, 711–719. [Google Scholar] [CrossRef] [PubMed]
  35. Rosewarne, G.M.; Singh, R.P.; Huerta-Espino, J.; William, H.M.; Bouchet, S.; Cloutier, S.; McFadden, H.; Lagudah, E.S. Leaf tip necrosis, molecular markers and β1-proteasome subunits associated with the slow rusting resistance genes Lr46/Yr29. Theor. Appl. Genet. 2006, 112, 500–508. [Google Scholar] [CrossRef]
  36. Singh, S.; Bowden, R.L. Molecular mapping of adult-plant race-specific leaf rust resistance gene Lr12 in bread wheat. Mol. Breed. 2011, 28, 137–142. [Google Scholar] [CrossRef]
  37. Bansal, U.K.; Hayden, M.J.; Venkata, B.P.; Khanna, R.; Saini, R.G.; Bariana, H.S. Genetic mapping of adult plant leaf rust resistance genes Lr48 and Lr49 in common wheat. Theor. Appl. Genet. 2008, 117, 307–312. [Google Scholar] [CrossRef]
  38. William, H.M.; Singh, R.P.; Huerta-Espino, J.; Palacios, G.; Suenaga, K. Characterization of genetic loci conferring adult plant resistance to leaf rust and stripe rust in spring wheat. Genome 2006, 49, 977–990. [Google Scholar] [CrossRef]
  39. Yu, H.; Zhiying, D.; Xiang, C.; Tian, J. Analysis of diversity and linkage disequilibrium mapping of agronomic traits on B-genome of wheat. J. Genom. 2014, 2, 20–30. [Google Scholar] [CrossRef]
Figure 1. The frequency distribution of leaf rust severity in the RIL lines of Xinong1163–4 × Thatcher. The mean positions of Xinong1163–4 and Thatcher are marked by arrows. (a) In the 2018 BD graph, the number of Xinong1163–4 lines is highest within the 1–10% leaf rust severity range. (b) In the 2019 BD graph, the distribution of line numbers across ranges has shifted, yet Xinong1163–4 lines remain abundant in the 1–10% range. (c) In the 2020 BD graph, Xinong1163–4 lines still predominate in the 1–10% leaf rust severity range.
Agronomy 15 01717 g001
Figure 2. QTL interaction maps of the Xinong1163-4×Thatcher recombinant inbred line (RIL) population are presented, showing logarithm of the odds (LOD) values. The figures display marker names, genetic distances between adjacent markers, and a horizontal line indicating an LOD threshold of 2.5. Small triangles on the x-axis denote markers used for quantitative trait locus (QTL) mapping. (a) Chromosome 1B: The genetic map of chromosome 1B is shown with the telomere of 1BL on the left. Markers include Xgvm728, Xgvm140, etc. (b) Chromosome 3A: The genetic map of chromosome 3A is presented with the telomere of 3AL on the left. Markers include Xwmc215, Xwmc559, etc. (c) Chromosome 4B: The genetic map of chromosome 4B is displayed with the centromere of 4BL on the left. Markers include Xgvm149, Xwmc657, etc. These three figures illustrate the distribution of quantitative trait loci (QTLs) on wheat chromosomes 1B, 3A, and 4B. The vertical axes represent the genetic distances (in centimorgans, cM) along the chromosomes. Each figure lists multiple QTLs associated with various traits. The names of QTLs, such as QPrn.sfr-1B and QP.sfr-3A, contain codes that may denote traits or research institutions, with the final number and letter combination indicating the chromosome location. Additionally, some disease resistance-related gene loci, like Lr46/Yr29/Pm39 and Lr49, are marked, suggesting their roles in disease resistance. These diagrams provide valuable information for researchers to understand the chromosomal locations of different traits, facilitating gene cloning and marker-assisted breeding in the future.
Agronomy 15 01717 g002aAgronomy 15 01717 g002b
Figure 3. Electrophoresis of PCR products amplified for CAP marker csLV46G22 on non-denaturing polyacrylamide gels. M: PBR322/MspI Marker;1: TCLr46; P1: Xinong1163-4; P2: Thatcher; R: Resistant plants; S: Susceptible plants.
Agronomy 15 01717 g003
Table 1. Summary of MDS in the Xinong1163–4 × Thatcher RIL population phenotyped for leaf rust.
Environment aParents
Xinong1163-4ThatcherMean ± SD
2018 BD18024.23 ± 15.58
2019 BD18032.38 ± 23.78
2020 BD18035.14 ± 24.05
Environment a 195 RILs
RangeVariance coefficient (%)SkewnessKurtosis
2018 BD1–8064.310.77−0.04
2019 BD1–9073.430.80−0.29
2020 BD1–9068.440.54−0.92
a: 2018 BD, 2019 BD, and 2020BD: the MDS in 2017/2018, 2018/2019, and 2019/2020 cropping seasons in Baoding, Hebei province, respectively.
Table 2. Pearson correlation coefficients (r) for two-way comparisons of leaf rust severity data from different environments.
EnvironmentR
2017–2018 BD0.495 **
2018–2019 BD0.510 **
2019–2020 BD0.629 **
Here, 18BD, 19BD, and 20BD refer to the MDS for leaf rust in 2017/2018, 2018/2019, and 2019/2020 cropping seasons at Baoding in Hebei Province, respectively. ** p < 0.001.
Table 3. Quantitative trait loci for MDS to leaf rust and two potentially pleiotropic QTLs identified using ICIM in the RIL population from Xinong1163-4×Thatcher.
Environment bChromosomeQTL aMarker Interval cLOD dPVE (%) eAdditive Effect fDominate EffectDR
2018BD1BQLr.hbau-1BL.1Xgwm140-Xgpw10774.2010.66−2.0646.57OD
2018BD1BQLr.hbau-1BL.2Xgpw1077-Xcfa2147.12.823.37−3.63−5.92OD
2018BD4BQLr.hbau-4BLXwmc657-Xgwm2514.138.13−6.235.06D
2018BD4BQLr.hbau-4BL.1Xgwm193-Xwmc6923.4612.18−0.5538.54OD
2019BD1BQLr.hbau-1BL.3Xgwm728-Xgwm1406.8521.88−10.6125.35OD
2019BD3AQLr.hbau-3AXwmc215-Xcfa20769.5724.95−17.15−3.83PD
2019BD4BQLr.hbau-4BLXwmc657-Xgwm2512.955.31−5.60−7.68OD
2020BD1BQLr.hbau-1BL.3Xgwm728-Xgwm1402.686.16−5.79−9.43OD
2020BD1BQLr.hbau-1BL.2Xgpw1077-Xcfa2147.13.795.44−7.68−4.41PD
2020BD3AQLr.hbau-3AXwmc215-Xcfa20763.136.63−7.94−6.62D
2020BD4BQLr.hbau-4BLXwmc657-Xgwm2516.0312.23−10.36−5.94PD
a All of the resistance QTLs in this table were contributed by Xinong1163-4; b 2018 BD, 2019 BD, and 2020 BD refer to the MDS in 2017/2018, 2018/2019 and 2019/2020 cropping seasons in Baoding, Hebei province, respectively. The “1B, 4B, 3A” in the table refer to the numbering and naming of chromosomes. c Peak position in centimorgans from the first linked marker of the relevant linkage; d Logarithm of odds (LOD) score; e Percentage of phenotypic variance explained by QTL; f Negative additive values indicate that relevant alleles were inherited from cultivar Xinong1163-4.
Disclaimer/Publisher’s Note: The statements, opinions and data contained in all publications are solely those of the individual author(s) and contributor(s) and not of MDPI and/or the editor(s). MDPI and/or the editor(s) disclaim responsibility for any injury to people or property resulting from any ideas, methods, instructions or products referred to in the content.