Article

Comparison of Rhizosphere Microbial Diversity in Soybean and Red Kidney Bean Under Continuous Monoculture and Intercropping Systems

1
Center for Agricultural Genetic Resources Research, Shanxi Agricultural University/Institute of Crop Germplasm Resources, Shanxi Academy of Agricultural Sciences, Key Laboratory of Crop Gene Resources and Germplasm Enhancement on Loess Plateau, Ministry of Agriculture, Shanxi Key Laboratory of Genetic Resources and Genetic Improvement of Minor Crops, Taiyuan 030031, China
2
College of Agronomy, Shanxi Agricultural University, Taigu 030801, China
3
Institute of Crop Sciences, Chinese Academy of Agricultural Sciences, Beijing 100081, China
*
Authors to whom correspondence should be addressed.
Agronomy 2025, 15(7), 1705; https://doi.org/10.3390/agronomy15071705
Submission received: 12 June 2025 / Revised: 7 July 2025 / Accepted: 14 July 2025 / Published: 15 July 2025

Abstract

The long-term monocropping of red kidney beans in agricultural fields can lead to the occurrence of soil-borne diseases. Alterations in the composition of the soil microbial community are a primary cause of soil-borne diseases and a key factor in continuous cropping obstacles. Research exploring how different cultivation modes can modify the diversity and composition of the rhizosphere microbial community in red kidney beans, and thus mitigate the effects of continuous cropping obstacles, is ongoing. This study employed three cultivation modes: the continuous monocropping of red kidney beans, continuous monocropping of soybeans, and red kidney bean–soybean intercropping. To elucidate the composition and diversity of rhizosphere microbial communities, we conducted amplicon sequencing targeting the V3-V4 hypervariable regions of the bacterial 16S rRNA gene and the ITS1 region of fungal ribosomal DNA across distinct growth stages. The obtained sequencing data provide a robust basis for estimating soil microbial diversity. We observed that, under the intercropping mode, the composition of both bacteria and fungi more closely resembled that of soybean monocropping. The monocropping of red kidney beans increased the richness of rhizosphere bacteria and fungi and promoted the accumulation of pathogenic microorganisms. In contrast, intercropping cultivation and soybean monocropping favored the accumulation of beneficial bacteria such as Bacillus and Streptomyce, reduced pathogenic fungi including Alternaria and Mortierell, and exhibited less microbial variation across different growth stages. Compared to the monocropping of red kidney beans, these systems demonstrated more stable microbial structure and composition. The findings of this study will inform sustainable agricultural practices and soil management strategies.

1. Introduction

Leguminous plants, such as soybean (Glycine max (L.) Merr.) and red kidney bean (Phaseolus vulgaris L.), play a pivotal role in sustainable agriculture due to their ability to fix atmospheric nitrogen through symbiotic relationships with rhizobia [1]. Nitrogen fixation not only reduces the need for synthetic fertilizers but also enhances soil fertility, making legumes a cornerstone of crop rotation and intercropping systems. However, the continuous monoculture of legumes, particularly red kidney beans, has been associated with a decline in yield and soil health, a phenomenon known as the “continuous cropping obstacle”. This obstacle is often attributed to the accumulation of soil-borne pathogens, the depletion of specific nutrients, and alterations in the structure of the soil microbial community [2]. In contrast, intercropping systems, where two or more crops are grown simultaneously, have been shown to improve resource use efficiency, suppress diseases, enhance microbial diversity, and also increase yield [3]. While the pathogen-blocking efficacy of soybean–red kidney bean intercropping systems lacks prior documentation, the biological compatibility of these two legumes—characterized by analogous growth habits yet distinct pathogen profiles—provides a compelling rationale for implementing this cropping pattern. Understanding the dynamics of rhizosphere microbial communities under different cropping patterns is crucial for optimizing these systems to achieve sustainable agricultural productivity [4].
Colonizing the rhizosphere—the soil zone immediately surrounding plant roots—diverse microbial assemblages profoundly influence plant growth, nutrition, and health, as well as the structure of plant communities [5]. The rhizosphere is shaped by root exudates, which vary with plant species, growth stage, and environmental conditions [6]. These exudates provide carbon sources and nutrients, directly influencing the structure and function of the resident microbial community [7]. In monoculture systems, the repeated cultivation of the same crop often leads to pathogenic fungal dominance and a decline in beneficial microbes. This shift from a bacterial-dominated community to a fungal-dominated community is a key contributor to the continuous cropping problem [8]. In contrast, intercropping systems introduce greater diversity in terms of root exudates, which can promote a more balanced microbial community, enhance nutrient cycling, and suppress soil-borne diseases [9]. However, the specific mechanisms by which intercropping influences the rhizosphere microbiome, particularly in legume–legume systems, remain poorly understood.
Recent advances in high-throughput sequencing technologies have enabled the detailed characterization of soil microbial communities; this has provided insights into the complex interactions between plants, microbes, and soil properties [10]. Various studies have demonstrated that intercropping can increase the diversity and abundance of beneficial microbes, such as nitrogen-fixing bacteria and mycorrhizal fungi, while reducing the prevalence of pathogens [11]. For example, intercropping soybeans with maize or wheat enhances the abundance of Bradyrhizobium and Pseudomonas, which are known for nitrogen fixation and biocontrol, respectively [12]. Similarly, legume–cereal intercropping has been found to increase the diversity of Arbuscular Mycorrhizal fungi (AMF), which improve phosphorus uptake and plant growth [13]. However, the effects of legume–legume intercropping (e.g., soybean–red kidney bean) on the rhizosphere microbiome are not as well understood. Given the potential for synergistic interactions between these two legumes, investigating how their intercropping modulates the structure and function of microbial communities throughout the growing season is essential.
With this study, we aimed to (1) compare the diversity and composition of rhizosphere bacterial and fungal communities across three cropping patterns (soybean monoculture, red kidney bean monoculture, and soybean–red kidney bean intercropping) throughout the entire growth cycle; (2) identify which different microbes are abundant using different cultivation modes; and (3) evaluate the performance of specific microbes, in terms of the abundance of, for instance, beneficial bacteria and pathogenic fungi, across various growth stages within distinct cultivation patterns. By analyzing the rhizosphere microbiome across multiple growth stages, we aimed to elucidate dynamic plant–microbe interactions and provide comprehensive insights into how intercropping can mitigate continuous cropping obstacles in legume production.

2. Materials and Methods

2.1. Experimental Design

A three-year field experiment (2019–2021) was conducted at Dongyang County (37.55° N, 112.66° E), Shanxi Province, China. The site features a temperate continental semi-arid monsoon climate at an elevation of 796.8 m above sea level. The soybean cultivar “Pindou 24” and red kidney bean cultivar “Pinjinyun 4” exhibited moderate disease resistance and were provided by the Center for Agricultural Genetic Resources Research, Shanxi Agricultural University. The experiment employed a randomized complete block design (RCBD) with three cropping systems: soybean monoculture (S), red kidney bean monoculture (R), and soybean–red kidney bean strip intercropping (SR). In 2018, the entire experimental field was uniformly monocropped with buckwheat (Fagopyrum esculentum Moench).
A total of 3 replicated blocks contained all of the treatments, resulting in 63 experimental plots (3 treatments × 3 blocks × 7 plots per treatment–block combination). Each rectangular plot measured 2 m × 5 m (10 m2), separated by 20 cm wide ridges. The monoculture plots maintained uniform 50 cm rows with species-specific plant spacing: 17 cm for soybeans and 37 cm for red kidney beans. The intercropping system used alternating single rows of soybeans and red kidney beans with inter-row spacing of 50 cm. The plant spacing within rows followed the monoculture specifications (37 cm for both species between adjacent plants). At seeding, a basal fertilization of 15 kg·ha−1 NPK compound fertilizer (N-P2O5-K2O) (Stanley Chemical Fertilizer Co., Ltd., Shandong Province, China) was uniformly applied across all experimental plots, with identical fertilization regimes maintained for the three cultivation systems. The experimental soil, collected from a homogeneous plot block, exhibited the following pre-experimental physicochemical characteristics: total nitrogen (TN 0.08%), available phosphorus (AP 19.52 mg/kg), available potassium (AK 107.4 mg/kg), organic matter (OM 14.49 g/kg) and pH 8.70. Following local agronomic practices, synchronized sowing operations took place during the last week of May each year. Field management included standardized fertilization protocols and periodic weed control measures consistent with the regional cultivation practices for leguminous crops.

2.2. Soil Sampling and Rhizosphere Soil Collection

During the 2021 growing season, rhizosphere soil samples were collected from two leguminous species (Glycine max and Phaseolus vulgaris) using three cultivation modes at four growth stages: seedling, flowering, maturation, and post-maturation. We employed a five-point sampling method, positioning the central point at the intersection of field diagonals with four additional points equidistant along the diagonals (Figure S1: cultivation modes and sampling timeline). At each sampling point, surface soil (~10 cm depth) was removed. Roots were carefully excavated using a shovel sterilized with 75% ethanol. Root systems from a soil depth of 5–20 cm were collected. Loosely adhering soil was gently shaken off, and the root samples were immediately placed in pre-labeled sterile bags and sealed. The sealed samples were promptly transported to the laboratory in pre-cooled biological containers (0–4 °C), cooled using ice packs/dry ice, for rhizosphere soil processing. In the laboratory, within a laminar flow hood, bulk soil was removed from the roots by gentle shaking. Soil adhering tightly to the root surface (defined as rhizosphere soil), approximately 1 mm thick, was retained [14]. Root samples were then transferred to sterile 50 mL centrifuge tubes containing 20 mL of sterile 10 mM PBS (phosphate-buffered saline) solution. The tubes were incubated in a constant-temperature shaker at 120 rpm and at room temperature for 20 min. After shaking, the roots were aseptically removed from the tubes using sterile forceps (sterilized by flaming in an alcohol burner and cooled in sterile distilled water). The remaining suspension was centrifuged at a high speed (6000× g, 4 °C) for 20 min to pellet the rhizosphere soil. The collected rhizosphere soil pellets were flash-frozen in liquid nitrogen and stored at −80 °C until DNA extraction was performed [15,16].

2.3. DNA Extraction

Total genomic DNA was extracted from the soil samples using the OMEGA Soil DNA Kit (M5635-02; Omega Bio-Tek, Norcross, GA, USA) following the manufacturer’s protocols. The extracted DNA samples were stored at −20 °C; their concentration and purity were subsequently assessed using a NanoDrop NC2000 spectrophotometer (Thermo Fisher Scientific, Waltham, MA, USA), and their integrity was verified via agarose gel electrophoresis.

2.4. Microbial Amplicon Sequencing Library Preparation

Bacterial 16S rRNA gene V3-V4 regions were amplified using the primers 338F (5′-ACTCCTACGGGAGGCAGCA-3′) and 806R (5′-GGACTACHVGGGTWTCTAAT-3′) [17]. Fungal ITS1 regions were amplified with the primers ITS5F (5′-GGAAGTA AAAGTCGTAACAAGG-3′) and ITS2R (5′-GCTGCGTTCTTCATCGATGC -3′) [18]. PCR amplicons were purified using Vazyme VAHTSTM DNA Clean Beads (Vazyme, Nanjing, China), quantified using the Quant-iT PicoGreen dsDNA Assay Kit (Invitrogen, Carlsbad, CA, USA), and pooled in equimolar ratios. Paired-end sequencing (2 × 250 bp) was performed on the Illumina NovaSeq platform with NovaSeq 6000 SP Reagent Kit, 500 cycles (Shanghai Personal Biotechnology Co., Ltd. Shanghai, China).

2.5. Bioinformatics and Statistical Analysis

Experimental data were analyzed using IBM SPSS Statistics 22.0 (IBM Corp., New York, NY, USA). The significance of the differences was assessed using a one-way ANOVA. Microbial sequence analysis was conducted in QIIME2 (v2020.6) and R (v3.2.0) [19]. Quality filtering, denoising, read merging, and chimera removal were performed using the DADA2 plugin [20]. Non-singleton amplicon sequence variants (ASVs) were aligned with MAFFT [21], and phylogenetic trees were constructed using FastTree2 [22]. Alpha diversity indices (Chao1 richness [23]), observed species, Shannon diversity [24], and Pielou’ s evenness [25] were calculated using the ASV tables in QIIME2, and they were visualized as box plots. To compare the ASV distribution patterns across samples, rank–abundance curves were used. We used beta diversity analysis to assess structural differences using Jaccard dissimilarity [26], visualized through principal coordinates analysis (PCoA) [27]. Principal component analysis (PCA) was performed on genus-level abundance profiles. Using the ape package in R to perform PCoA analysis, output the PCoA coordinates of the sample points, and plot them as a two-dimensional scatter plot.
Taxonomic assignment employed the classify-sklearn naïve Bayes classifier [28] against the SILVA 132 and UNITE 8.0 databases [29]. Shared and unique ASVs were visualized using R 4.3.2 with package “VennDiagram” based on ASV occurrence. Finally, random forest was used to distinguish sample groups using QIIME2 with default parameters [30].

3. Results

3.1. Quality Metrics of Amplicon Sequencing

The number of reads per sample group before and after quality control is shown in Table S1. In total, 2,067,744 high-quality bacterial sequences and 4,337,126 high-quality fungal sequences were recovered after quality control. There are three cultivation groups and four growth stages, with a total of 36 samples. The mean sequencing depth reached 57,437 reads per sample for bacteria and 120,476 reads for fungi. As summarized in Table S2, the average sequence read length for both domains was 418 bp. At a 100% identity threshold, we detected 92,444 distinct bacterial amplicon sequence variants (ASVs) and 4273 fungal ASVs. Notably, bacterial ASV richness (Table S3) substantially exceeded fungal ASV counts (Table S4).

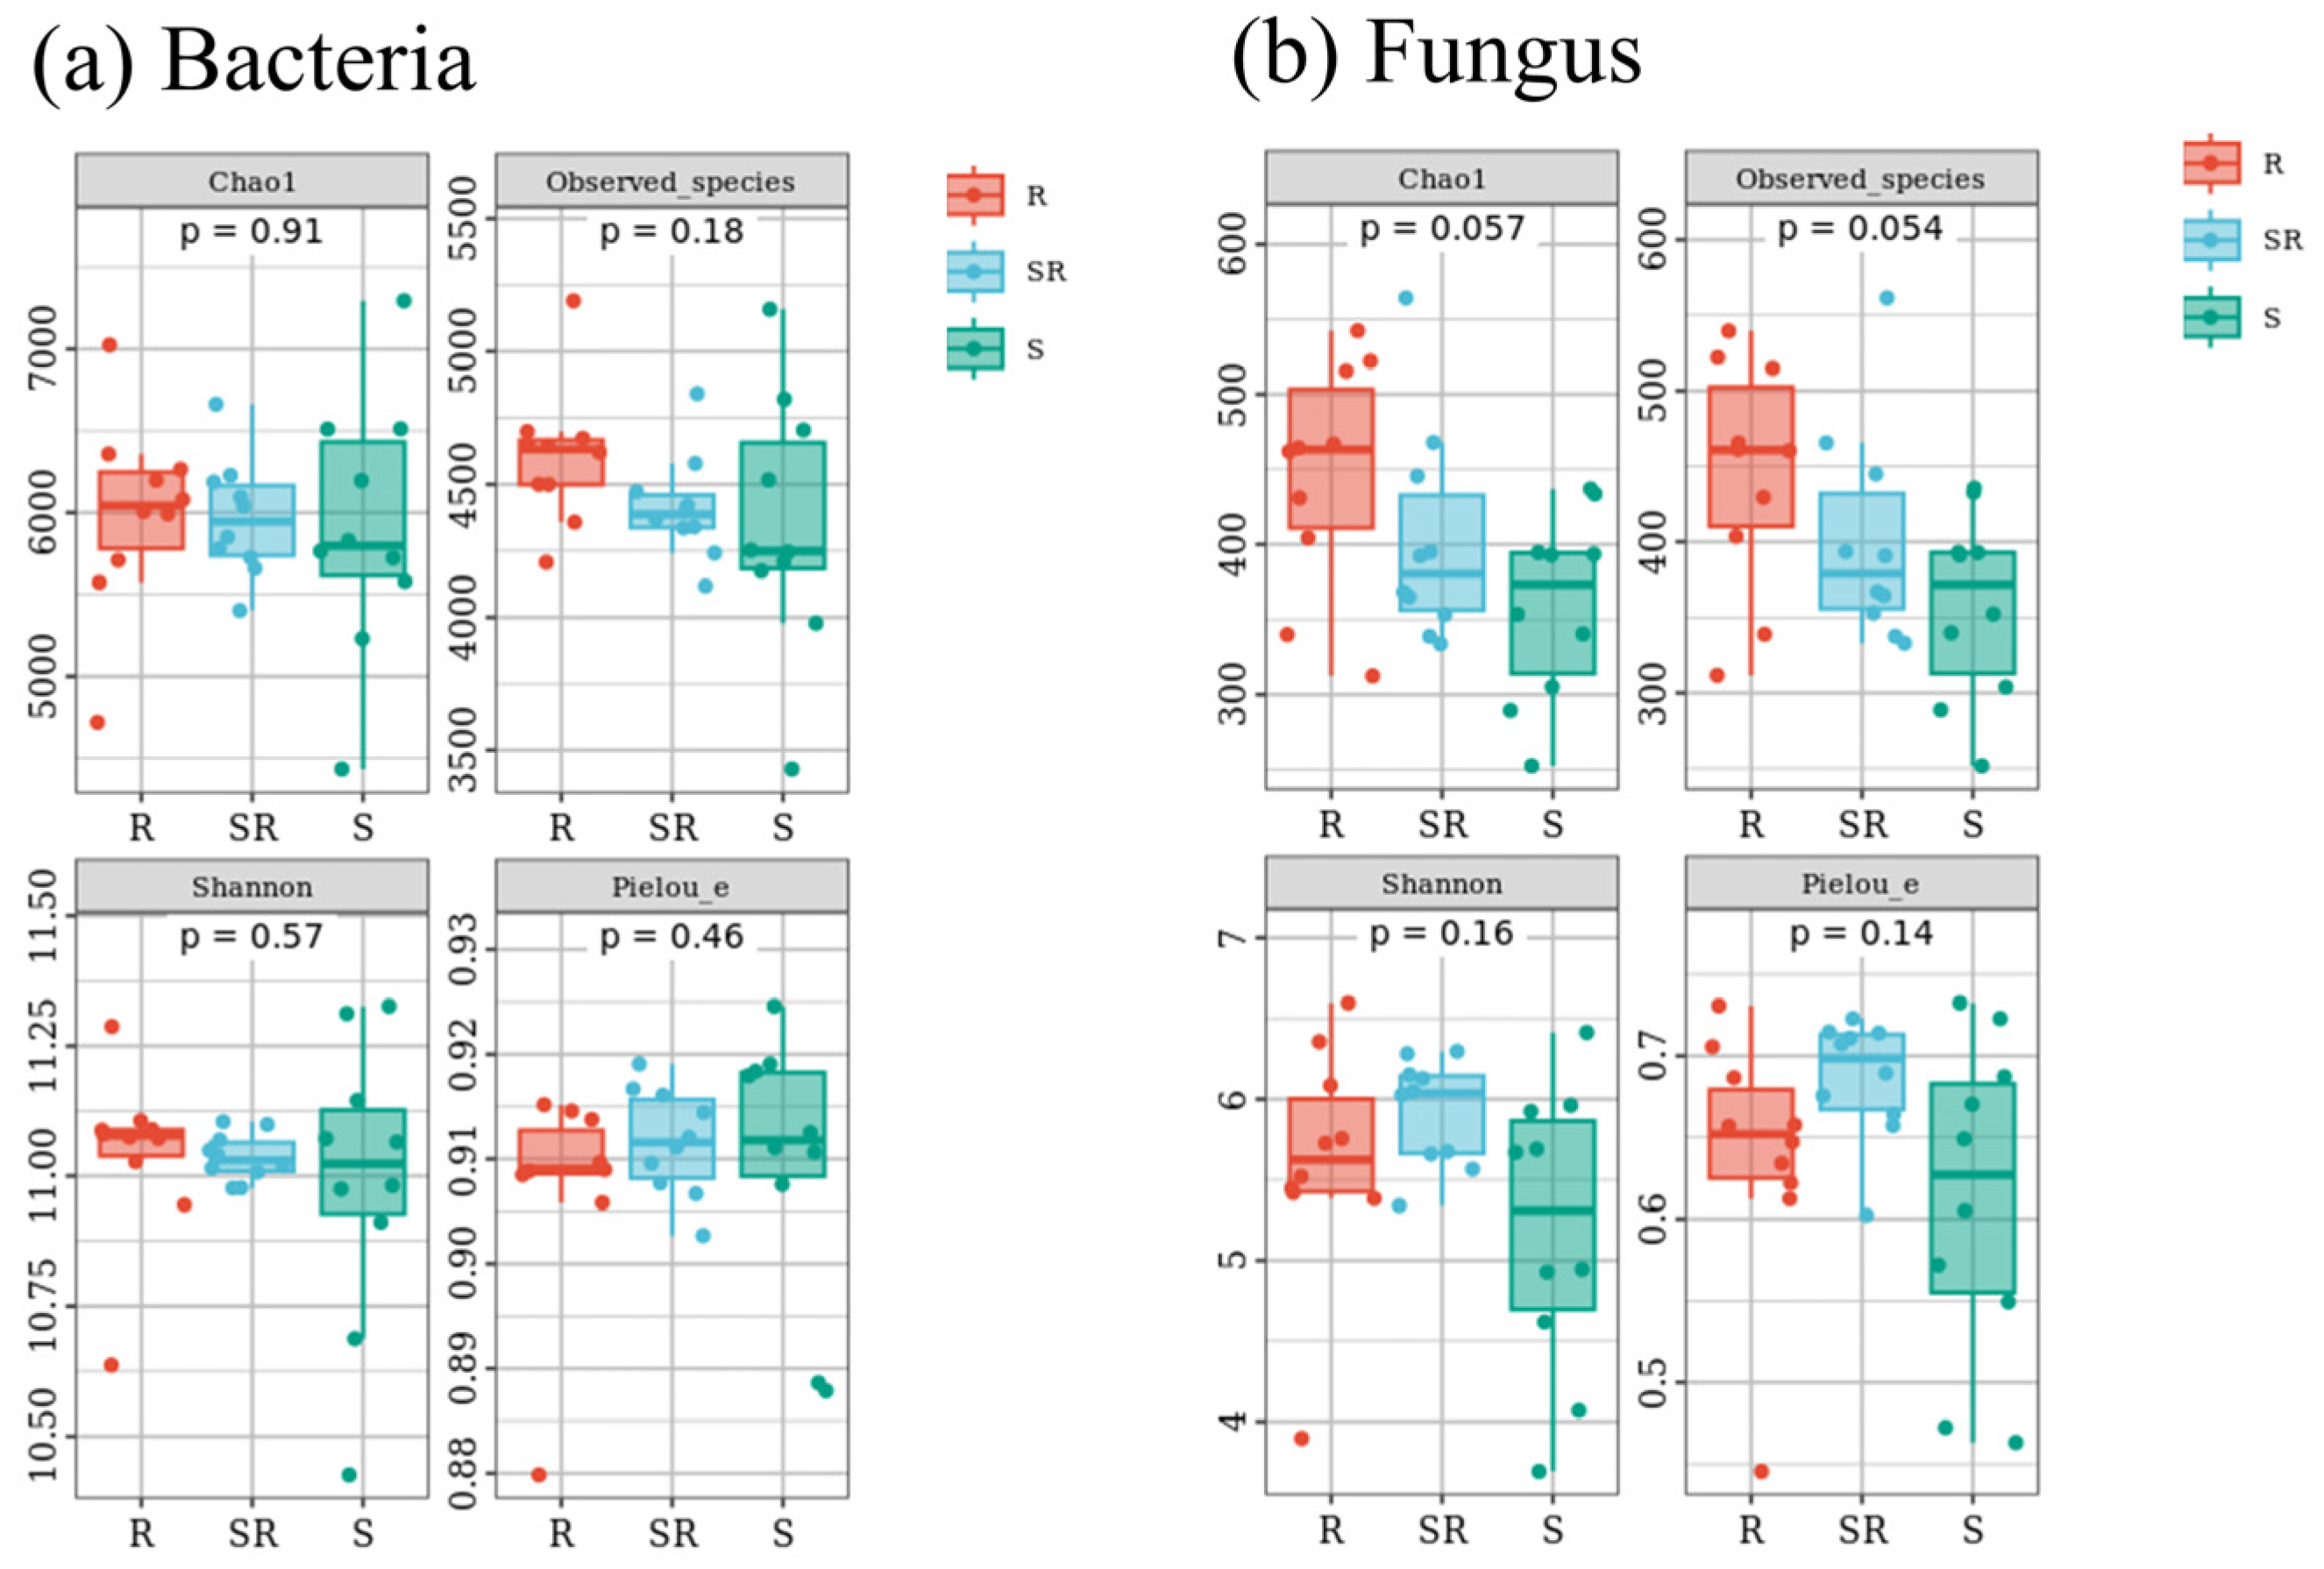
3.2. Alpha Diversity of Bacterial and Fungal Communities

The Chao1 and observed species indices reflect species richness, while the Shannon and Pielou-e indices characterize community evenness. We carried out a comparative analysis of bacterial and fungal α-diversity (Figure 1) across soybean monoculture (S), red kidney bean monoculture (R), and soybean–red kidney bean intercropping (SR) systems. For bacterial communities (Figure 1a), no significant differences in richness (Chao1: p = 0.91; observed species: p = 0.18) or evenness (Shannon: p = 0.57; Pielou-e: p = 0.46) were observed among the three cropping systems. The SR system exhibited intermediate richness and evenness values between the two monocultures, aligning with the absence of statistical significance. Fungal communities (Figure 1b) exhibited distinct patterns. Intercropping (SR) moderately influenced fungal richness (Chao1: p = 0.057; observed species: p = 0.054), while it slightly enhanced community evenness (Shannon: p = 0.16; Pielou-e: p = 0.14). Notably, the SR system achieved the highest fungal evenness among all the treatments, suggesting that intercropping may optimize community structure by suppressing pathogen accumulation in continuous cropping systems. These results indicate that intercropping exerts limited influence on bacterial diversity but potentially improves fungal community diversity and stability, likely through ecological niche complementarity and pathogen suppression mechanisms [9].

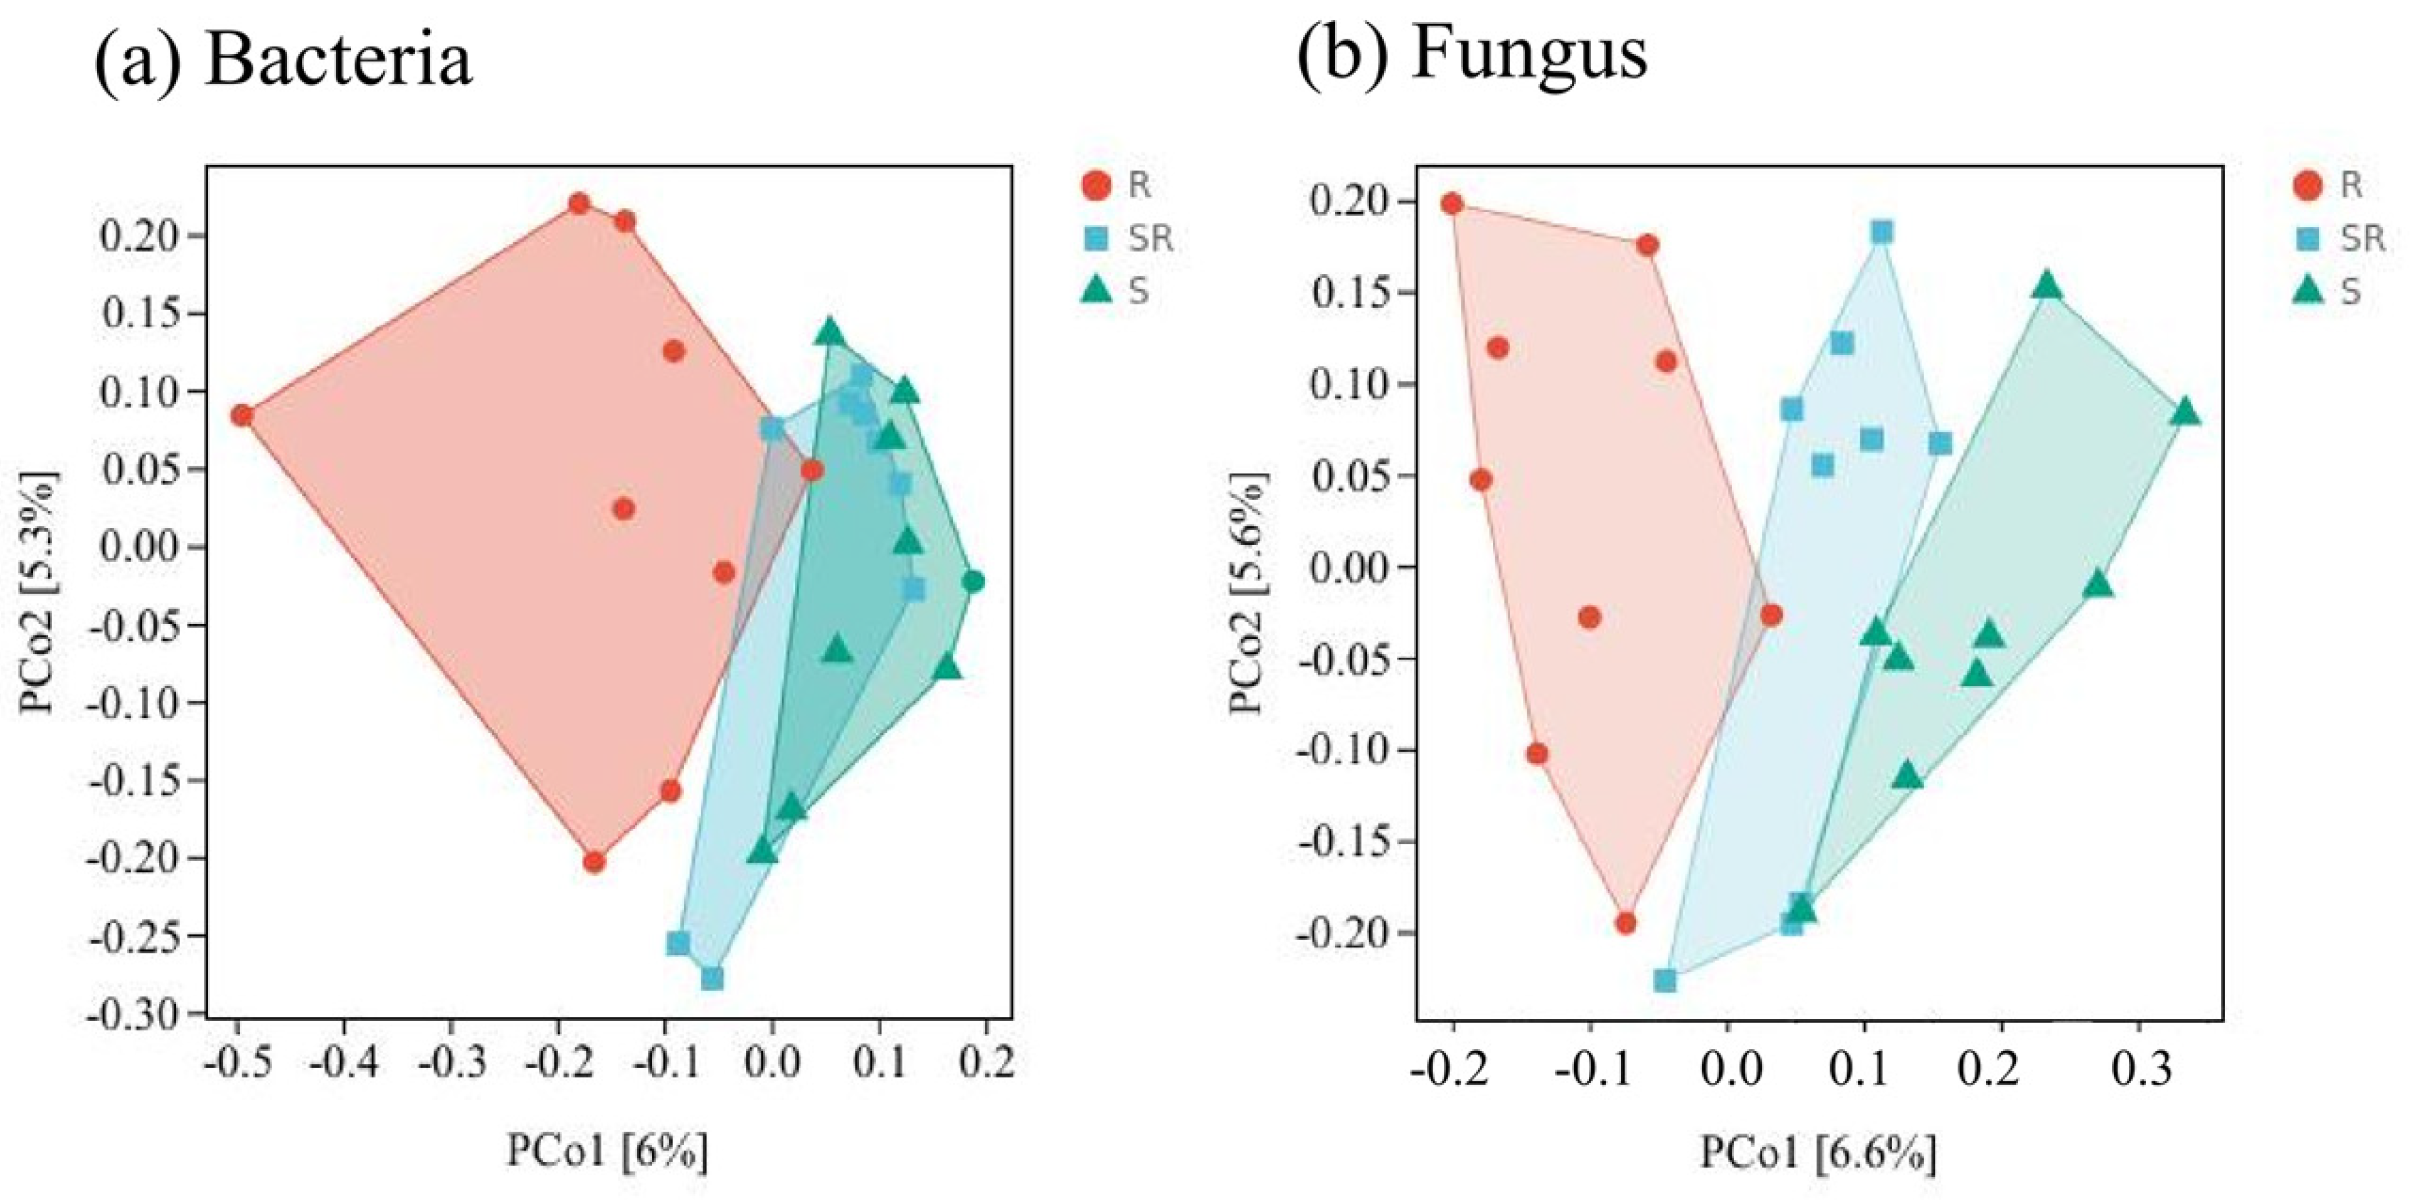
3.3. Beta Diversity Analysis of Bacterial and Fungal Communities Based on Principal Coordinate Analysis (PCoA)

As shown in Figure 2, the PCoA revealed distinct community structures for both bacteria and fungi across cropping systems. For the bacterial communities (Figure 2a), the structure of the red kidney bean continuous monoculture (R) was significantly distinct from that of the soybean–red kidney bean intercropping (SR) system and soybean continuous monoculture (S). However, the SR and S systems exhibited a partial clustering overlap, suggesting shared bacterial components. Conversely, fungal communities (Figure 2b) showed minimal overlap among all three systems, with each treatment forming a distinct cluster. This demonstrates system-specific fungal assembly. The explanation of this variance was comparable to the bacterial analysis (PCo1: 6.0%; PCo2: 6.6%). Collectively, the cropping system used significantly influenced the structures of the microbial communities, with fungal assemblages exhibiting greater system-dependent differentiation than bacterial communities.

3.4. Rhizosphere Microbial Community Assembly Dynamics Across Cropping Systems and Growth Stages

Rhizosphere microbial communities were characterized at the phylum and genus taxonomic ranks for both bacteria and fungi. The analyses spanned three cropping systems, namely red kidney bean continuous monoculture (R), soybean–red kidney bean intercropping system (SR), and soybean continuous monoculture (S), sampled at four growth stages: seedling (R1/SR1/S1), flowering (R2/SR2/S2), maturation (R3/SR3/S3), and post-maturation (R4/SR4/S4).
The bacterial community exhibited distinct compositional and temporal dynamics across cropping systems at the phylum and genus levels (Figure 3a,b; Tables S5 and S6). At the phylum level, all systems were dominated by Actinobacteria (22.0–41.0% relative abundance) and Proteobacteria (23.4–36.8%), with secondary contributions from Acidobacteria (6.9–17.7%), Chloroflexi (4.2–13.2%), Gemmatimonadetes (2.1–5.8%), Bacteroidetes (2.3–5.6%), and Firmicutes (1.1–2.4%). The red kidney bean continuous monoculture (R) showed higher Actinobacteria (mean 35.0%) and Proteobacteria (30.1%) abundance compared to the soybean continuous monoculture (S) (29.9%; 29.2%) and the soybean–red kidney bean intercropping system (SR) (33.9%; 28.6%). Notably, Chloroflexi in R progressively decreased from 13.2% (seedling, R1) to 4.2% (flowering, R2), indicating cultivation-driven depletion. At the genus level, Solirubrobacterales 67–14 (mean 17.1%) were ubiquitous. Nitrosomonadaceae-MND1, a nitrogen-cycling genus, was uniquely enriched in S, which doubled in abundance during S3 (3.25%) compared to other stages (<2%). Conversely, the abundance of Blastococcus was higher in R (mean 2.7%) than SR (2.1%) or S (1.8%), with both Rokubacteriales and Gaiella exhibiting a decreasing trend from R to SR to S. Temporal shifts revealed Blastococcus dominance (1.9–3.9%) at flowering stages (R2/SR2/S2) and Acidobacteria Subgroup_6 prevalence (6.7–8.9%) at flowering stages and maturation (R3/SR2/S3), highlighting growth stage-specific succession. These hierarchical patterns demonstrate that intercropping restructures bacterial communities by favoring nutrient-cycling taxa while suppressing monoculture-dominant groups, with temporal dynamics further shaping niche partitioning.
Fungal communities exhibited significant compositional and functional shifts across the cropping systems and growth stages (Figure 3c,d; Tables S5 and S6). At the phylum level, Ascomycota (47.8–93.3%) and Mortierellomycota (2.2–41.2%) were dominant. The soybean–red kidney bean intercropping system (SR) elevated Ascomycota abundance (mean 75.4%) compared to the red kidney bean continuous monoculture (R) (68.2%) and soybean continuous monoculture (S) (72.3%) and reduced Mortierellomycota predominance (SR: 13.1% vs. R: 15.6%; S: 13.9%), suggesting functional shifts toward symbiotic or decomposer fungi. The genus-level analysis revealed Mortierella (2.1–41%), Fusarium (1.3–9.4%), and Botryotrichum (0.3–17.2%) as the core taxa. SR significantly suppressed Mortierella (mean 13.1% vs. R: 15.6%; S: 13.9%)—a genus containing pathogenic strains—while it did not significantly reduce the abundance of Fusarium (SR: 7.6% vs. R: 6.0%; S: 7.5%). The temporal dynamics showed that Mortierella and Pseudogymnoascus peaked during the flowering stages (R2).
Cropping systems exerted systematic effects, with intercropping enriching nutrient-cycling taxa (e.g., Fusarium, Botryotrichum) [31,32] and suppressing pathogens, while monocultures favored stress-tolerant groups (e.g., Streptomyces in R, Ascomycota in S) [33,34]. The growth stages further drove genus-level successions, as flowering and maturation hosted functionally distinct communities. These findings collectively demonstrate that intercropping synergizes with plant phenology to reconfigure rhizosphere microbiomes, enhancing beneficial taxa while mitigating pathogenic risks, thereby providing a mechanistic basis for optimizing sustainable agricultural practices through the management of microbial communities.

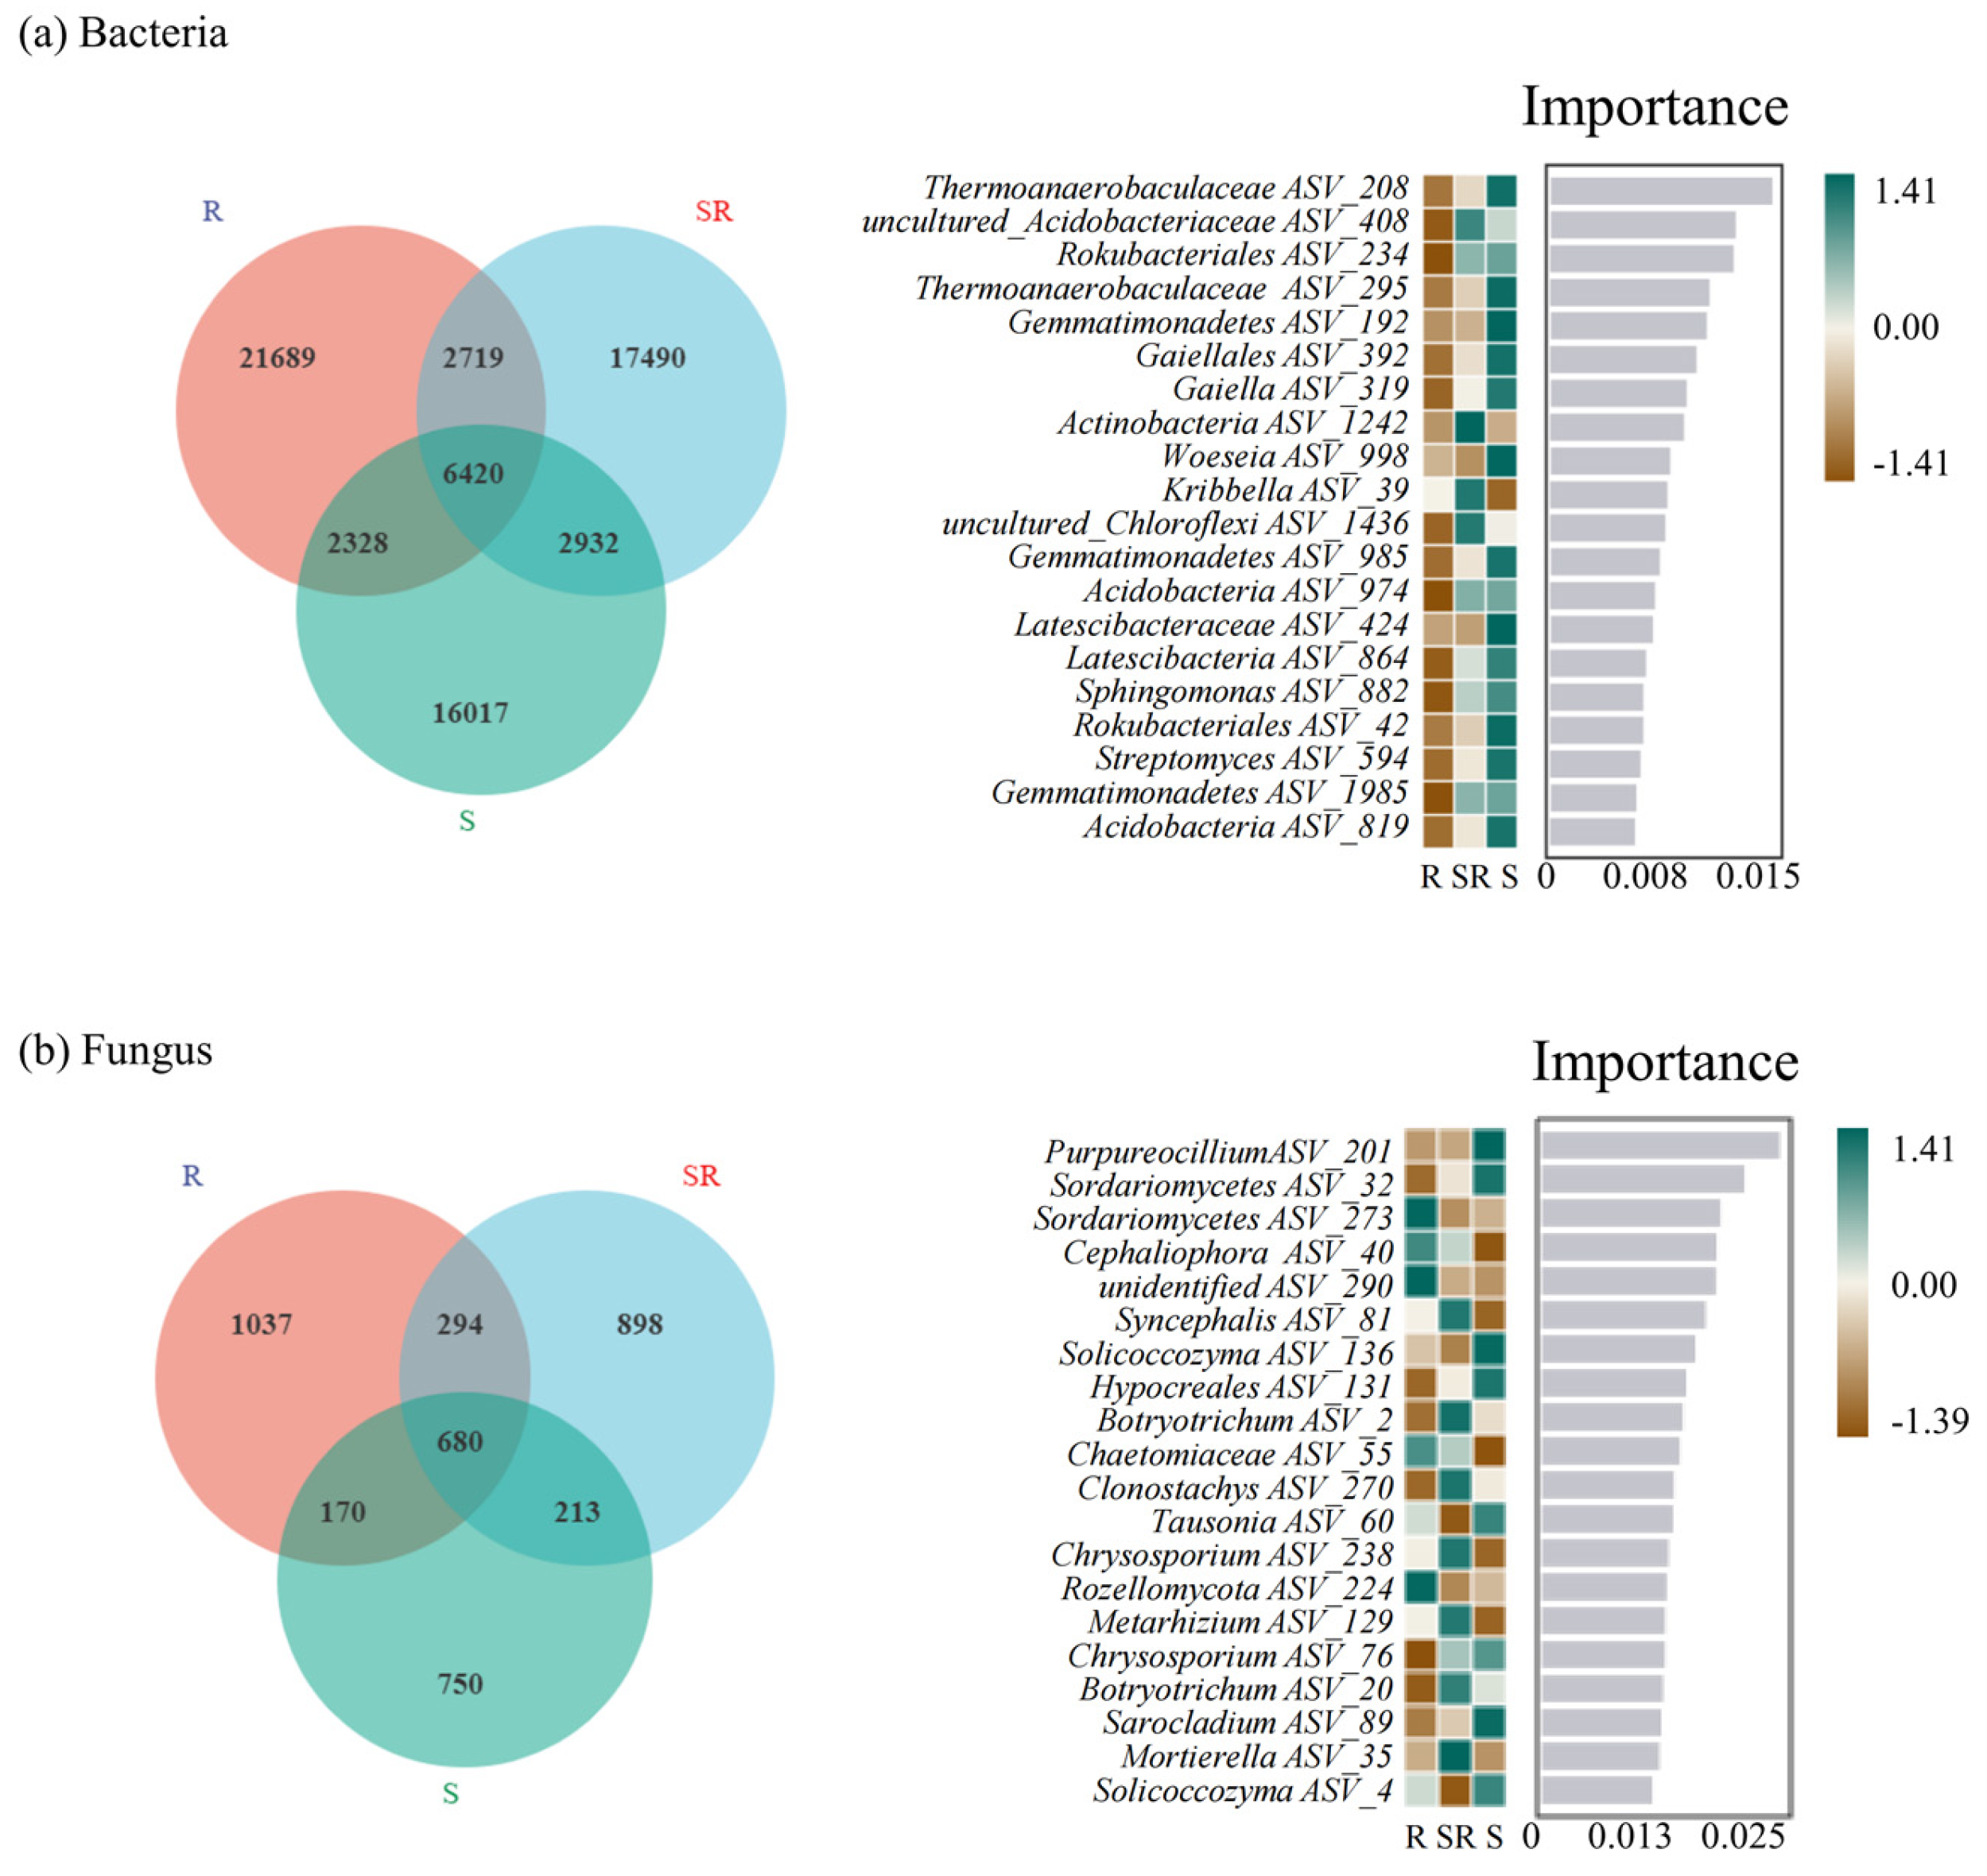
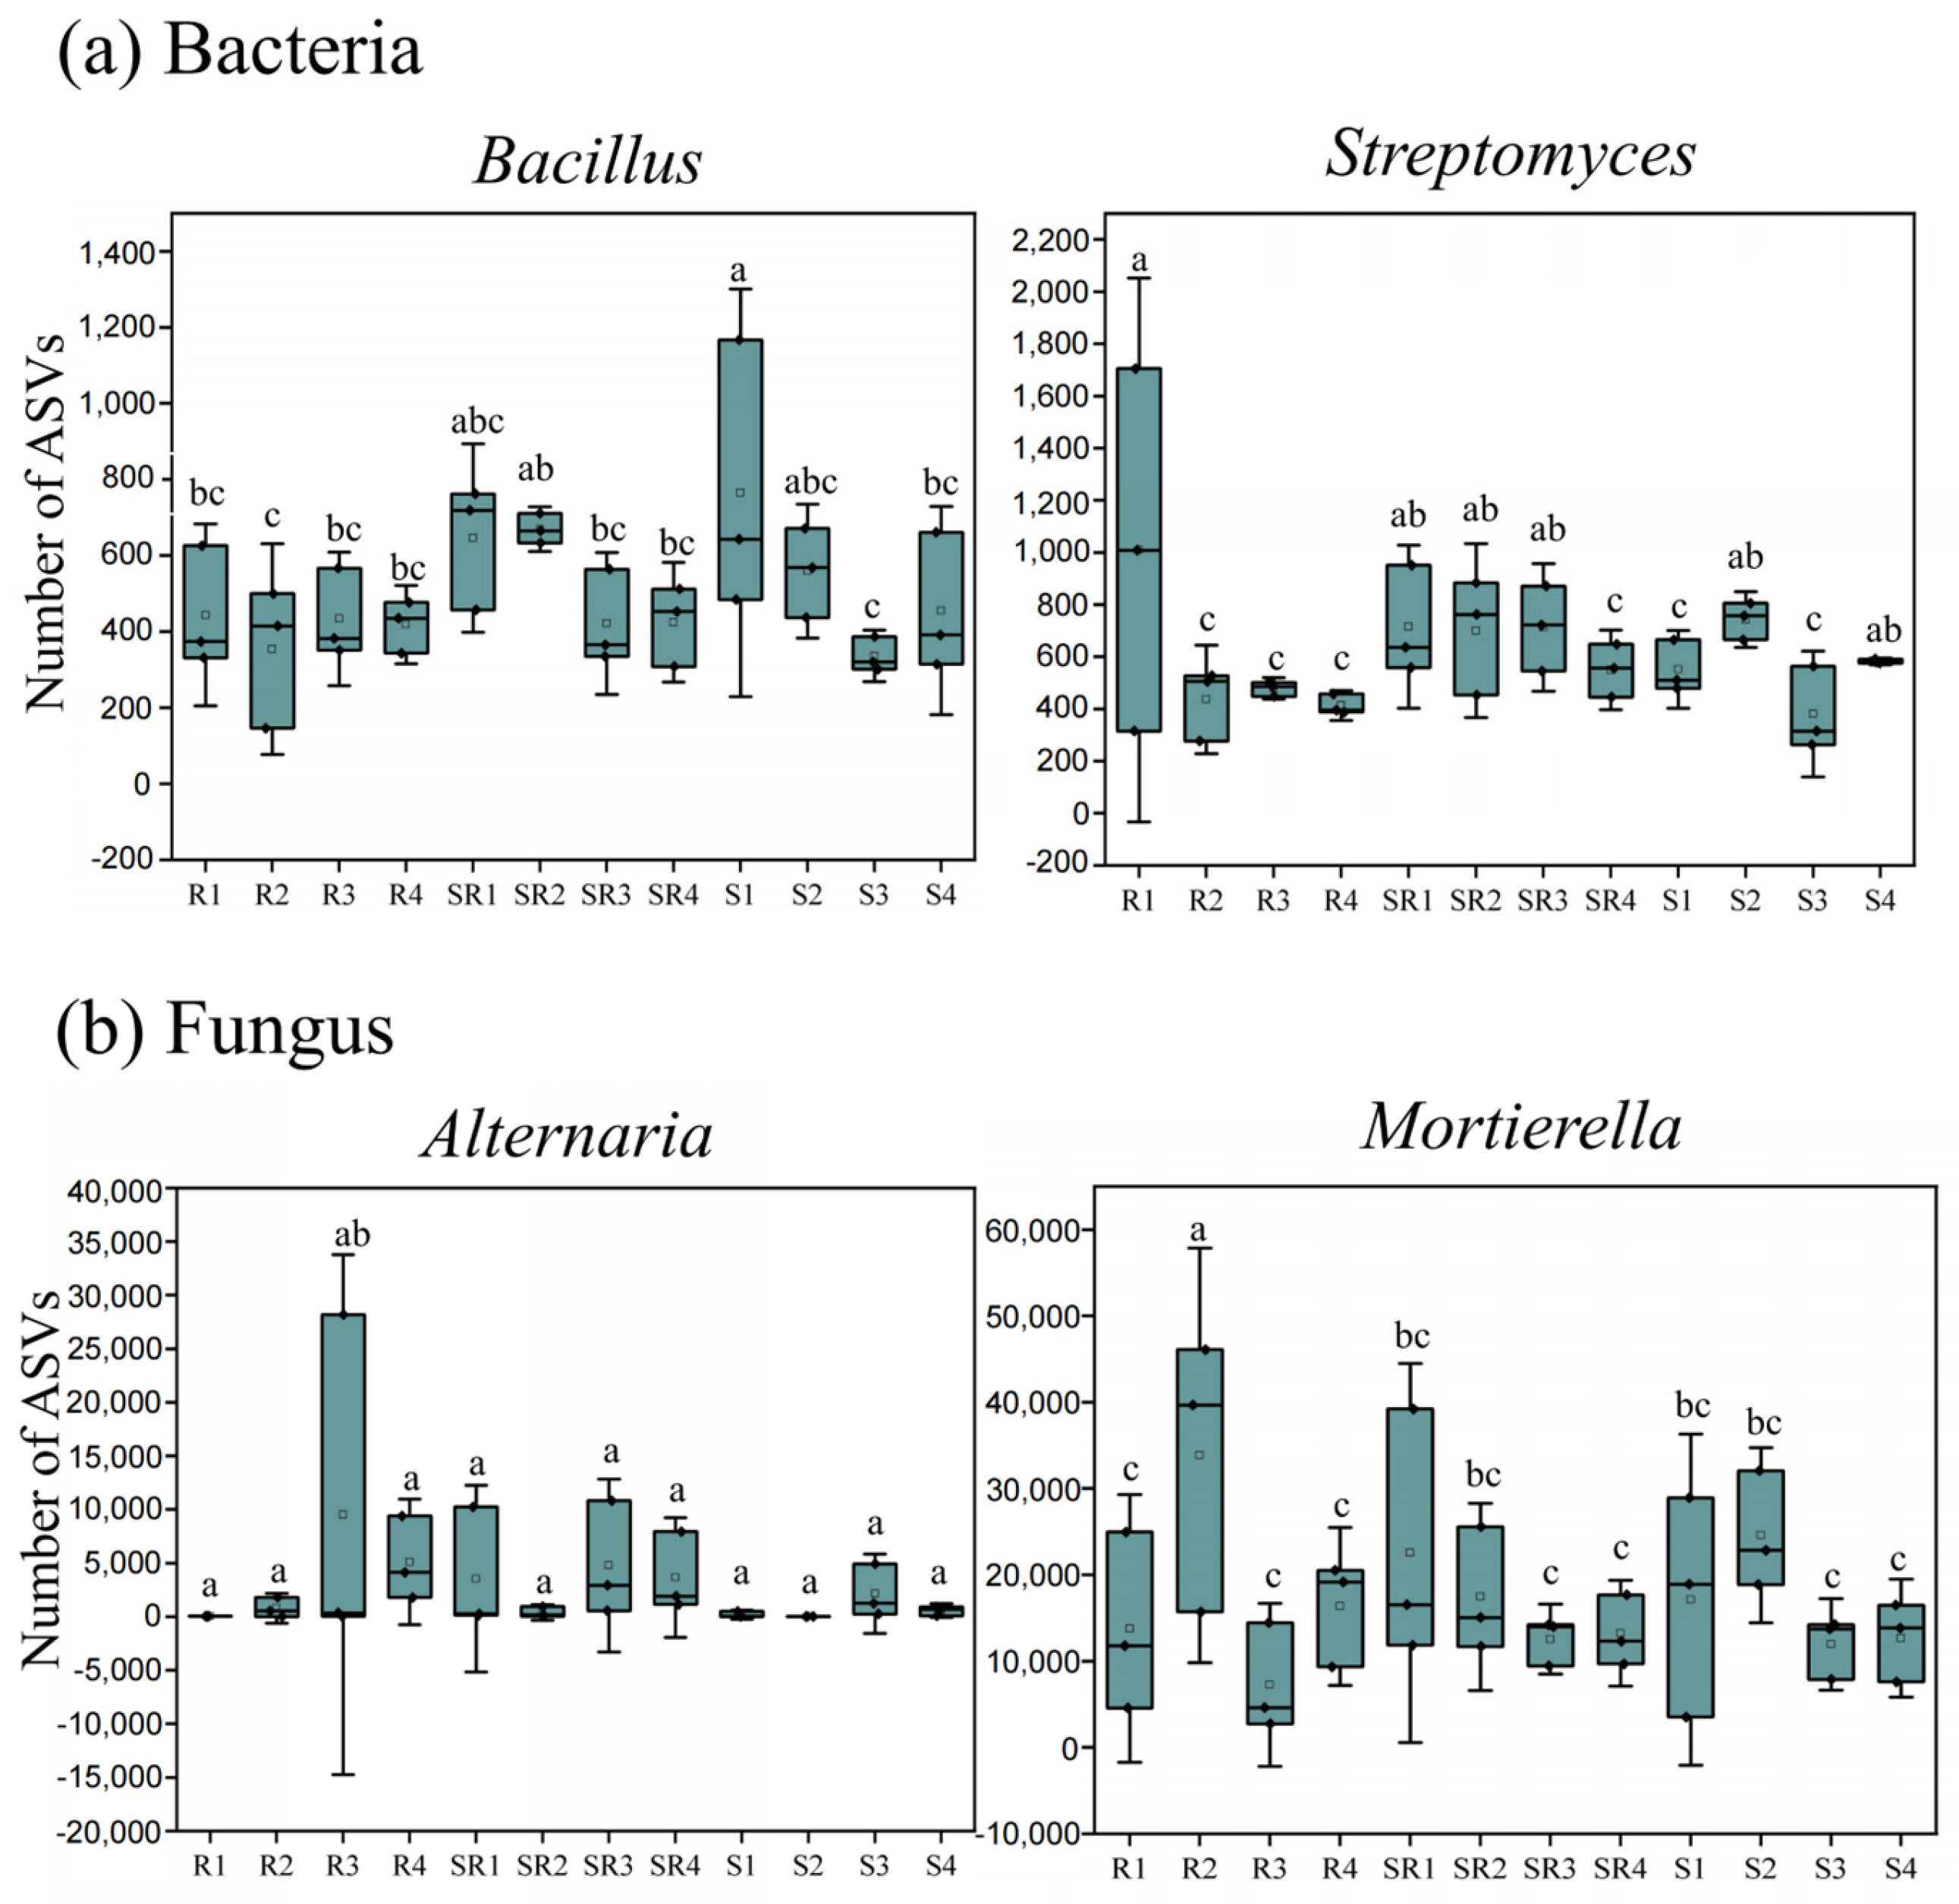
3.5. Effects of Intercropping Infection on the Bacterial Microbiome

To understand the effects of the three-year continuous soybean–red kidney bean intercropping (SR), soybean monoculture (S), and kidney bean monoculture (R) on rhizosphere microbiomes, the differential distribution of species was analyzed through Venn diagrams and random forest analysis. The analysis revealed 6420 shared bacterial and 680 fungal amplicon sequence variants (ASVs) across all systems, representing 9.2% and 16.8% of total ASVs, respectively (Figure 4). Crucially, the R system exhibited substantially higher unique bacterial and fungal ASVs compared to SR and S systems. This indicates that SR and S systems share closer microbial diversity profiles, whereas the unique ASVs exclusively present in R may potentially be related to its increasingly severe field disease incidence over successive years. As observed in Figure S1, the R system demonstrated markedly higher field disease prevalence compared to both SR and S systems.
The random forest analysis demonstrated the significantly reduced abundance of beneficial bacteria (Sphingomonas and Streptomyces) in the R system compared to the SR and S systems. Notably, Sphingomonas degrades diverse natural compounds and environmental contaminants [35], while Streptomyces spp. drive critical organic matter decomposition [36]. Concurrently, red kidney bean monocropping (R) increased the abundance of pathogenic fungi (Sordariomycetes, Cephaliophora, and Chaetomiaceae). Use of the SR intercropping system effectively mitigated these microbial shifts, maintaining fungal profiles comparable to soybean monoculture while reducing pathogenic fungi and enhancing beneficial bacteria. This rebalancing translated to the measurable suppression of field disease manifestation in kidney beans, demonstrating the capacity of intercropping to stabilize soil microbiomes against monoculture-induced dysbiosis.

3.6. Distribution of Specific Microorganisms Across Three Cultivation Systems

Based on field observations, the continuous cultivation of red kidney beans for three consecutive years (R) leads to disease manifestation around the flowering stage, primarily characterized by localized yellowing or darkening of leaves, preliminarily diagnosed as leaf spot disease. As shown in Figure 5b, the abundance of Alternaria, the causal agent of leaf spot, increases during the flowering and maturity stages in red kidney bean monoculture (R). In contrast, Alternaria populations remain stable throughout the growth cycle when using both intercropping (SR) and soybean monoculture systems (S). A similar trend is observed for Mortierella, which proliferates during the flowering phase in sole red kidney bean cultivation but maintains relative stability across growth stages when using the other two cultivation modes. Figure 5a further reveals that beneficial bacteria such as Bacillus and Streptomyces are consistently less abundant throughout red kidney bean development (R) compared to the other two cultivation practices (SR and S). Although both red kidney beans and soybeans are legumes, they host distinct pathogenic communities. The intercropping system (SR) effectively suppresses diseases caused by the continuous monoculture of red kidney beans (R). From a soil microbial perspective, intercropping reduces the abundance of soil-borne pathogenic fungi and enhances the proliferation of beneficial bacteria.

4. Discussion

The findings of this study demonstrate that the intercropping of soybeans and red kidney beans reshapes microbial community structure compared to continuous monoculture. These results align with previous research highlighting intercropping’s positive effects on soil microbial communities and their functional roles in agroecosystems [37]. Below, we discuss the implications of our findings regarding microbial diversity, functional microbial enrichment, and pathogen suppression.
Changes in Microbial Diversity in Intercropping
Our results show that intercropping exerts a limited influence on bacterial diversity, but it does improve the stability of the fungal community. This is consistent with the finding that a cross-migration of bacteria from the roots of one plant to that of another can occur on the roots of the companion plant, even if it was not inoculated [38]. In an intercropping system, the interplay between cereals and legumes, which is strongly driven by the complementarity of root architecture systems and their interactions with the soil microbiome, enhanced the soil microbial community [39]. The changed diversity in intercropping systems can be attributed to the greater variety of root exudates released by the two legume species, which create distinct ecological niches for microbial colonization [40]. This diversity not only improves soil ecosystem resilience but also enhances nutrient cycling efficiency, as diverse microbial communities are better equipped to decompose complex organic compounds and mobilize nutrients [41].
Enrichment of Functional Microbial Groups
Intercropping significantly increased the relative abundance of beneficial microbial groups, such as Bacillus and Streptomyces, that belong to plant-growth-promoting rhizobacteria (PGPR) and are pivotal in enhancing plant defense mechanisms against pathogens [42]. Streptomycetes are sessile bacteria that produce metabolites that impact the behavior of microbial communities [43]. Soil-dwelling Streptomycetes, such as Streptomyces coelicolor, colonize plant roots and provide the associated plant with protection from potential phytopathogens through antibiotic secretion [44]. The symbiosis of Streptomycetes with their plant hosts has been shown to improve plant health and productivity, thereby providing a potential sustainable solution to increase crop yields [45].
Suppression of Pathogenic Fungi
One of the most striking findings of this study is the significant reduction in the relative abundance of pathogenic fungi, such as Alternaria, in intercropping systems. Alternaria comprises many species that infect a broad diversity of important crop plants and cause post-harvest spoilage [46]. Mortierella species are abundant and frequently isolated from soil and plant roots, particularly in soils with pathogenic fungi, and they are associated with the decline in Araucaria araucana trees [47]. Root exudation under maize/soybean intercropping system mediates the arbuscular mycorrhizal fungi diversity and improves the plant growth [48]. Intercropping may enhance plant immune responses through the activation of systemic resistance, as observed in other intercropping systems. These mechanisms collectively contribute to a healthier rhizosphere environment, reducing the incidence of soil-borne diseases.
Limitations and Future Directions
While this study provides valuable insights into the effects of intercropping on rhizosphere microbial communities, some limitations should be acknowledged. First, this research was conducted during the third year of continuous planting, meaning that long-term trials were needed to assess the sustainability of mixed planting effects. Second, further investigation into the mechanisms behind the observed microbial changes, along with pathogens and functional microorganisms during continuous cropping, is warranted. We suggest that future studies employ metabolomic and transcriptomic approaches to elucidate these mechanisms and identify the key signaling molecules involved in plant–microbe interactions.

5. Conclusions

In conclusion, soybean–red kidney bean intercropping significantly restructures the rhizosphere microbiota compared to monoculture, enriching beneficial microbes, suppressing pathogens, and enhancing soil health—highlighting its potential as a sustainable solution for continuous cropping challenges. While these findings demonstrate how optimized plant–microbe interactions can foster resilient agroecosystems supporting global food security, we acknowledge limitations including the lack of functional analyses (e.g., metagenomics/metabolomics). Thus, long-term trials validating productivity metrics (yield stability) and soil parameters (organic carbon accrual) are recommended. Crucially, the field-relevant framework ensures direct applicability to legume production systems, informing sustainable rotations leveraging plant–microbe synergies.

Supplementary Materials

The following supporting information can be downloaded at the following link: https://www.mdpi.com/article/10.3390/agronomy15071705/s1, Figure S1: Photos of the field at maturity stage and sampling schedule for the three cultivation patterns; Table S1: Sequencing statistics table per sample based on 16S rRNA_V3V4 and ITS_V1; Table S2: Sequencing statistics table per sample based on 16S rRNA_V3V4 and ITS_V1; Table S3: ASVs based on 16S rRNA_V3V4; Table S4: ASVs based on ITS_V1; Table S5: Classification table at the phylum level based on 16S rRNA_V3V4; Table S6: Classification table at the genus level based on 16S rRNA_V3V4; Table S7: Classification table at the phylum level based on ITS_V1; Table S8: Classification table at the genus level based on ITS_V1.

Author Contributions

Conceptualization, H.Q. and Z.M.; methodology, A.L.; software, S.Z.; formal analysis, Y.Z.; data curation, C.L.; writing—original draft preparation, H.Q.; writing—review and editing, H.Q.; visualization, H.Z.; supervision, J.W.; funding acquisition, H.Q. All authors have read and agreed to the published version of the manuscript.

Funding

This research was funded by the Fundamental Research Program of Shanxi Province (No. 202103021224158) and the National Crop Germplasm Resources Center (No. NCGRC-2025-026).

Data Availability Statement

The raw sequence data reported in this paper have been deposited (PRJCA039025) in the Genome Sequence Archive in the BIG Data Center, Chinese Academy of Sciences, under accession codes subPRO057464 for bacterial 16S rRNA gene V3-V4 regions and fungal ITS1 regions sequencing data, publicly accessible at http://bigd.big.ac.cn/gsa (accessed on 19 April 2025).

Conflicts of Interest

The authors declare no conflicts of interest.

References

  1. Xiao, X.; Chen, W.; Zong, L.; Yang, J.; Jiao, S.; Lin, Y.; Wang, E.; Wei, G. Two cultivated legume plants reveal the enrichment process of the microbiome in the rhizocompartments. Mol. Ecol. 2017, 26, 1641–1651. [Google Scholar] [CrossRef]
  2. Ma, L.; Ma, S.Y.; Chen, G.P.; Lu, X.; Chai, Q.; Li, S. Mechanisms and Mitigation Strategies for the Occurrence of Continuous Cropping Obstacles of Legumes in China. Agronomy 2024, 14, 104. [Google Scholar] [CrossRef]
  3. Duchene, O.; Vian, J.F.; Celette, F. Intercropping with legume for agroecological cropping systems: Complementarity and facilitation processes and the importance of soil microorganisms. A review. AGR Ecosyst. Environ. 2017, 240, 148–161. [Google Scholar] [CrossRef]
  4. Solanki, M.K.; Wang, Z.; Wang, F.Y.; Li, C.N.; Gupta, C.L.; Singh, R.K.; Malviya, M.K.; Singh, P.; Yang, L.T.; Li, Y.R. Assessment of Diazotrophic Proteobacteria in Sugarcane Rhizosphere When Intercropped with Legumes (Peanut and Soybean) in the Field. Front. Microbiol. 2020, 11, 1814. [Google Scholar] [CrossRef] [PubMed]
  5. Xiao, X.; Fan, M.; Wang, E.; Chen, W.; Wei, G. Interactions of plant growth-promoting rhizobacteria and soil factors in two leguminous plants. Appl. Microbiol. Biotechnol. 2017, 101, 8485–8497. [Google Scholar] [CrossRef]
  6. Yin, C.; Vargas, J.C.; Schlatter, D.C.; Hagerty, C.; Hulbert, S.H.; Paulitz, T.C. Rhizosphere community selection reveals bacteria associated with reduced root disease. Microbiome 2021, 9, 86. [Google Scholar] [CrossRef]
  7. Yu, P.; He, X.M.; Baer, M.; Beirinckx, S.; Tian, T.; Moya, Y.A.T.; Zhang, X.C.; Deichmann, M.; Frey, F.P.; Bresgen, V.; et al. Plant flavones enrich rhizosphere Oxalo bacteraceae to improve maize performance under nitrogen deprivation. Nat. Plants 2021, 7, 481–499. [Google Scholar] [CrossRef]
  8. Silva, F.D.; Vieira, V.D.; da Silva, R.C.; Pinheiro, D.G.; Soares, M.A. Introduction of Trichoderma spp. biocontrol strains against Sclerotinia sclerotiorum (Lib.) de Bary change soil microbial community composition in common bean (Phaseolus vulgaris L.) cultivation. Biol. Control 2021, 163, 104755. [Google Scholar] [CrossRef]
  9. Lai, H.; Gao, F.; Su, H.; Zheng, P.; Li, Y.; Yao, H. Nitrogen Distribution and Soil Microbial Community Characteristics in a Legume–Cereal Intercropping System: A Review. Agronomy 2022, 12, 1900. [Google Scholar] [CrossRef]
  10. Sun, X.; Zhang, C.; Bei, S.; Wang, G.; Geisen, S.; Bedoussac, L.; Christie, P.; Zhang, J. High bacterial diversity and siderophore-producing bacteria collectively suppress Fusarium oxysporum in maize/faba bean intercropping. Front. Microbiol. 2022, 13, 972587. [Google Scholar] [CrossRef]
  11. Zhao, Y.; Yan, C.; Hu, F.; Luo, Z.; Zhang, S.; Xiao, M.; Chen, Z.; Fan, H. Intercropping Pinto Peanut in Litchi Orchard Effectively Improved Soil Available Potassium Content, Optimized Soil Bacterial Community Structure, and Advanced Bacterial Community Diversity. Front. Microbiol. 2022, 13, 868312. [Google Scholar] [CrossRef]
  12. Punyalue, A.; Jamjod, S.; Rerkasem, B. Intercropping Maize With Legumes for Sustainable Highland Maize Production. Mt. Res. Dev. 2018, 38, 35–44. [Google Scholar] [CrossRef]
  13. Klichowska, E.; Nobis, M.; Piszczek, P.; Blaszkowski, J.; Zubek, S. Soil properties rather than topography, climatic conditions, and vegetation type shape AMF-feathergrass relationship in semi-natural European grasslands. Appl. Soil. Ecol. 2019, 144, 22–30. [Google Scholar] [CrossRef]
  14. Edwards, J.; Johnson, C.; Santos-Medellin, L.E.; Podishetty, N.K.; Bhatnagar, S.; Eisen, J.A.; Sundaresan, V. Structure, variation, and assembly of the root-associated microbiomes of rice. Proc. Natl. Acad. Sci. USA 2015, 112, E911–E920. [Google Scholar] [CrossRef] [PubMed]
  15. Beckers, B.; De Beeck, M.O.; Weyens, N.; Van Acker, R.; Van Montagu Boerjan, W.; Vangronsveld, J. Lignin engineering in field-grown poplar trees affects the endospherebacterial microbiome. Proc. Natl. Acad. Sci. USA 2016, 113, 2312–2317. [Google Scholar] [CrossRef]
  16. Beckers, B.; De Beeck, M.O.; Weyens, N.; Boerjan, W.; Vangronsveld, J. Structural variability and niche differentiation in the rhizosphere and endosphere bacterialmicrobiome of feld-grown poplar trees. Microbiome 2017, 5, 25. [Google Scholar] [CrossRef]
  17. Mori, H.; Maruyama, F.; Kato, H.; Toyoda, A.; Dozono, A.; Ohtsubo, Y.; Nagata, Y.; Fujiyama, A.; Tsuda, M.; Kurokawa, K. Design and experimental application of a novel non-degenerate universal primer set that amplifies prokaryotic 16S rRNA genes with a low possibility to amplify eukaryotic rRNA genes. DNA Res. 2014, 21, 217–227. [Google Scholar] [CrossRef]
  18. Bellemain, E.; Carlsen, T.; Brochmann, C.; Coissac, E.; Taberlet, P.; Kauserud, H. ITS as an environmental DNA barcode for fungi: An in silico approach reveals potential PCR biases. BMC Microbiol. 2010, 10, 189. [Google Scholar] [CrossRef]
  19. Bolyen, E.; Rideout, J.R.; Dillon, M.R.; Bokulich, N.A.; Abnet GAAl-Ghalith, J.; Caporaso, G. QIIME 2: Reproducible, interactive, scalable, and extensible microbiome data science. PeerJ Prepr. 2018, 6, e27295v2. [Google Scholar] [CrossRef]
  20. Callahan, B.J.; Mcmurdie, P.J.; Rosen, M.J.; Han, A.W.; Johnson, A.J.; Holmes, S.P. Dada2: High-resolution sample inference from illumina amplicon data. Nat. Methods 2016, 13, 581–583. [Google Scholar] [CrossRef]
  21. Katoh, K. Mafft: A novel method for rapid multiple sequence alignment based on fast fourier transform. NAR 2002, 30, 3059–3066. [Google Scholar] [CrossRef]
  22. Price, M.N.; Dehal, P.S.; Arkin, A.P. FastTree: Computing large minimum evolution trees with profiles instead of a distance matrix. Mol. Biol. Evol. 2009, 26, 1641–1650. [Google Scholar] [CrossRef]
  23. Chao, A. Nonparametric Estimation of the Number of Classes in a Population. Scand. J. Stat. 1984, 11, 265–270. [Google Scholar]
  24. Shannon, C.E. A mathematical theory of communication. Bell Syst. Tech. J. 1948, 27, 379–423. [Google Scholar] [CrossRef]
  25. Pielou, E.C. The measurement of diversity in different types of biological collections. J. Theor. Biol. 1966, 13, 131–144. [Google Scholar] [CrossRef]
  26. Jaccard, P. Nouvelles recherches sur la distribution florale. Bull. Soc. Vaudoise Sci. Nat. 1908, 44, 223–270. [Google Scholar]
  27. Ramette, A. Multivariate analyses in microbial ecology. FEMS Microbiol. Ecol. 2007, 62, 142–160. [Google Scholar] [CrossRef]
  28. Bokulich, N.A.; Subramanian, S.; Faith, J.J.; Gevers, D.; Gordon, J.I.; Knight, R.; Mills, D.A.; Caporaso, J.G. Quality-filtering vastly improves diversity estimates from Illumina amplicon sequencing. Nat. Methods. 2013, 10, 57–59. [Google Scholar] [CrossRef]
  29. Koljalg, U.; Nilsson, R.H.; Abarenkov, K.; Tedersoo, L.; Taylor, A.F.S.; Bahram, M.; Bates, S.T.; Bruns, T.D.; Bengtsson-Palme, J.; Callaghan, T.M. Towards a unified paradigm for sequence-based identification of fungi. Mol. Ecol. 2013, 22, 5271–5277. [Google Scholar] [CrossRef]
  30. Liaw, A.; Wiener, M. Classification and regression by randomForest. R News 2002, 2, 18–22. [Google Scholar]
  31. Sun, C.; Qiu, M.; Lu, X.; Wang, Y.W. Core microbiota play important roles in maintaining soil multi-nutrient cycling in lakeshore wetland of plateau lake Caohai. Land Degrad. Dev. 2024, 35, 1308–1319. [Google Scholar]
  32. Lim, S.K.; Ten, L.N.; Avalos-Ruiz, D.; Ryu, J.J.; Kang, I.K.; Lee, S.Y.; Jung, H.Y. Isolation and Identification of Two Unreported Sordariomycetes Fungi in Korea: Pestalotiopsis clavata and Botryotrichum iranicum. Kor. J. Mycol. 2022, 50, 183–194. [Google Scholar]
  33. Abbasi, S.; Sadeghi, A.; Safaie, N. Streptomyces alleviate drought stress in tomato plants and modulate the expression of transcription factors ERF1 and WRKY70 genes. Sci. Hortic. 2020, 265, 109206. [Google Scholar] [CrossRef]
  34. Meteyer, C.U.; Boyles, J.G. Fungal chimera: A lethal mammalian fungus with invasion strategies of plant pathogens. Virulence 2025, 16, 2439497. [Google Scholar] [CrossRef]
  35. Shin, S.C.; Kim, S.J.; Ahn, D.H.; Lee, J.K.; Park, H. Draft genome sequence of Sphingomonas echinoides ATCC 14820. J. Bacteriol. 2012, 194, 1843. [Google Scholar] [CrossRef]
  36. Rafii, F.; Crawford, D.L.; Bleakley, B.H.; Wang, Z. Assessing the risks of releasing recombinant Streptomyces in soil. Microbiol. Sci. 1988, 5, 358–362. [Google Scholar]
  37. Marcheva, M.; Petkova, M.; Slavova, V.; Popov, V. Positive Effect of Camelina Intercropping with Legumes on Soil Microbial Diversity by Applying NGS Analysis and Mobile Fluorescence Spectroscopy. Appl. Sci. 2024, 14, 9046. [Google Scholar] [CrossRef]
  38. Vora, S.M.; Joshi, P.; Belwalkar, M.; Archana, G. Root exudates influence chemotaxis and colonization of diverse plant growth promoting rhizobacteria in the pigeon pea-maize intercropping system. Rhizophere 2021, 18, 100331. [Google Scholar] [CrossRef]
  39. Lanzavecchia, G.; Frascarelli, G.; Rocchetti, L.; Bellucci, E.; Bitocchi, E.; Di Vittori, V.; Sillo, F.; Ferraris, I.; Carta, G.; Delledonne, M.; et al. Genotype Combinations Drive Variability in the Microbiome Configuration of the Rhizosphere of Maize/Bean Intercropping System. Int. J. Mol. Sci. 2024, 25, 1288. [Google Scholar] [CrossRef]
  40. Chamkhi, I.; Cheto, S.; Geistlinger, J.; Zeroual, Y.; Kouisni, L.; Bargaz, A.; Ghoulam, C. Legume-based intercropping systems promote beneficial rhizobacterial community and crop yield under stressing conditions. Ind. Crop. Prod. 2022, 183, 114958. [Google Scholar] [CrossRef]
  41. Blessing, D.J.; Gu, Y.; Cao, M.; Cui, Y.; Wang, X.; Asante-Badu, B. Overview of the advantages and limitations of maize-soybean intercropping in sustainable agriculture and future prospects: A review. Chil. J. Agric. Res. 2022, 82, 177–188. [Google Scholar] [CrossRef]
  42. Yang, Q.; Niu, A.; Li, S.; Liu, J.; Zhou, G. Unveiling Metabolic Crosstalk: Bacillus-Mediated Defense Priming in Pine Needles Against Pathogen Infection. Metabolites 2024, 14, 646. [Google Scholar] [CrossRef]
  43. Muok, A.R.; Claessen, D.; Briegel, A. Microbial hitchhiking: How Streptomyces spores are transported by motile soil bacteria. ISME J. 2021, 15, 2591–2600. [Google Scholar] [CrossRef]
  44. Van der Meij, A.; Worsley, S.F.; Hutchings, M.I.; van Wezel, G.P. Chemical ecology of antibiotic production by actinomycetes. FEMS Microbiol. Rev. 2017, 41, 392–416. [Google Scholar] [CrossRef] [PubMed]
  45. Worsley, S.F.; Newitt, J.; Rassbach, J.; Batey, S.F.D.; Holmes, N.A.; Murrell, J.C.; Wilkinson, B.; Hutchings, M. Streptomyces Endophytes Promote Host Health and Enhance Growth across Plant Species. Appl. Environ. Microb. 2020, 86, e01053-20. [Google Scholar] [CrossRef] [PubMed]
  46. Witte, T.E.; Villenueve, N.; Shields, S.W.; Sproule, A.; Eggertson, Q.; Kim, N.E.; Boddy, C.N.; Dettman, J.R.; Overy, D.P. Untargeted metabolomics screening reveals unique secondary metabolite production from Alternaria section Alternaria. Front. Mol. Biosci. 2022, 9, 1038299. [Google Scholar] [CrossRef] [PubMed]
  47. Vélez, M.L.; Marfetán, J.A.; Salgado Salomón, M.E.; Taccari, L.E.; Santini, A. Mortierella species from declining Araucaria araucana trees in Patagonia, Argentina. For. Pathol. 2020, 50, e12591. [Google Scholar] [CrossRef]
  48. Zhang, S.; Li, S.M.; Meng, L.B.; Liu, X.D.; Zhang, Y.H.; Zhao, S.C.; Zhao, H.B. Root exudation under maize/soybean intercropping system mediates the arbuscular mycorrhizal fungi diversity and improves the plant growth. Front. Plant Sci. 2024, 15, 1375194. [Google Scholar] [CrossRef]
Figure 1. Alpha diversity of rhizosphere microorganisms under different cropping systems. (a) Alpha diversity analysis of rhizosphere bacterial community. (b) Alpha diversity analysis of rhizosphere fungal community. R: red kidney bean continuous monoculture; SR: soybean–red kidney bean intercropping system; S: soybean continuous monoculture.
Agronomy 15 01705 g001
Figure 2. Principal coordinates analysis (PCoA) of rhizosphere microorganisms under different cropping systems. The PCoA plot is based on the Jaccard distance. (a) Rhizosphere bacterial communities. (b) Rhizosphere fungal communities. R: red kidney bean continuous monoculture; SR: soybean–red kidney bean intercropping system; S: soybean continuous monoculture.
Agronomy 15 01705 g002
Figure 3. Relative abundance of microbial communities in the rhizosphere under different cropping systems and growth stages. (a) Bacterial community composition at the phylum level; (b) bacterial community composition at the genus level; (c) fungal community composition at the phylum level; and (d) fungal community composition at the genus level. R: red kidney bean continuous monoculture; SR: soybean–red kidney bean intercropping system; S: soybean continuous monoculture. R1/R2/R3/R4, SR1/SR2/SR3/SR4, and S1/S2/S3/S4 denote the seedling, flowering, maturation, and post-maturation stages for each cropping system, respectively.
Agronomy 15 01705 g003
Figure 4. Venn diagrams and random forest analysis. (a) Bacterial Venn diagrams (left) and random forest analysis (right) across the R, SR, and S systems; (b) fungal Venn diagrams (left) and random forest analysis (right) across the R, SR, and S systems.
Agronomy 15 01705 g004
Figure 5. Distribution of specific microorganisms in three cultivation systems. R: red kidney bean continuous monoculture; SR: soybean–red kidney bean intercropping system; S: soybean continuous monoculture. R1/R2/R3/R4, SR1/SR2/SR3/SR4, and S1/S2/S3/S4 denote the seedling, flowering, maturation, and post-maturation stages for each cropping system, respectively. Bars represent means ± standard errors (n = 3). Different letters indicate significant differences among the five treatments at the p < 0.05 level (one-way ANOVA, test with post-hoc comparisons conducted using LSD and Duncan methods).
Agronomy 15 01705 g005
Disclaimer/Publisher’s Note: The statements, opinions and data contained in all publications are solely those of the individual author(s) and contributor(s) and not of MDPI and/or the editor(s). MDPI and/or the editor(s) disclaim responsibility for any injury to people or property resulting from any ideas, methods, instructions or products referred to in the content.

