Article

Bioactive Profiling of Cowpea Pods via Optimized Extraction and Experimental–Computational Approaches

by
María Victoria Traffano-Schiffo
1,
Margarita M. Vallejos
1,2,*,
Andrea G. Gómez
1,
Beatriz I. Avalos
1,
Belén A. Acevedo
1,2 and
María Victoria Avanza
1,2
1
Instituto de Química Básica y Aplicada del Nordeste Argentino (IQUIBA-NEA), Consejo Nacional de Investigaciones Científicas y Técnicas (CONICET)-Universidad Nacional del Nordeste (UNNE), Avenida Libertad 5460, Corrientes 3400, Argentina
2
Facultad de Ciencias Exactas y Naturales y Agrimensura, Universidad Nacional del Nordeste (FaCENA-UNNE), Avenida Libertad 5460, Corrientes 3400, Argentina
*
Author to whom correspondence should be addressed.
Agronomy 2025, 15(7), 1681; https://doi.org/10.3390/agronomy15071681
Submission received: 30 May 2025 / Revised: 7 July 2025 / Accepted: 8 July 2025 / Published: 11 July 2025

Abstract

Cowpea (Vigna unguiculata L.) pods are an underexploited by-product of legume production with significant antioxidant potential. Their recovery and characterization support sustainable waste valorization in agri-food systems. This study aimed to optimize the extraction of phenolic compounds (PCs) with antioxidant capacity (AOC) from cowpea pods and identify key bioactives through experimental and theoretical approaches. First, high-intensity ultrasound extraction was optimized using response surface methodology with ethanol–water mixtures. Under optimal conditions (20% amplitude, 15 min, 50% ethanol), the ethanolic extract (Eo) showed higher total phenolic content (TPC) and AOC than the aqueous extract (Wo). Subsequently, fractionation by Sephadex LH-20 chromatography yielded fractions E2 and W2 with enhanced TPC and AOC. Phytochemical profiling showed that E2 was enriched in caftaric acid, p-coumaric acid, and morin, while W2 had higher levels of caftaric, p-coumaric, and caffeic acids. Finally, density functional theory was used to assess thermodynamic parameters linked to antioxidant mechanisms (HAT, SET-PT, SPLET), revealing morin as the most effective radical scavenger, followed by caffeic and caftaric acids. These findings show that AOC depends not only on phenolic concentration but also on molecular structure and solvent interactions. Thus, cowpea pod extracts and fractions hold promise for antioxidant-rich formulations in food, nutraceutical, or cosmetic applications.

1. Introduction

Cowpea (Vigna unguiculata (L.) Walp.), a legume of the Fabaceae family, is globally recognized for its high nutritional value and diverse applications in both culinary and industrial contexts [1,2]. In addition, cowpea contains various phytochemicals, including phenolic acids, flavonoids, alkaloids, and terpenoids, which have been linked to anti-inflammatory, anticancer, and antimicrobial properties [3]. This crop is extensively cultivated across sub-Saharan Africa, Asia, Central and South America, the Mediterranean region, and the southern United States [4,5]. Despite its economic and nutritional significance, the processing of cowpea seeds, often for flour or other food applications, generates a substantial amount of agricultural waste, particularly in the form of pods, which are frequently discarded or remain underutilized [6]. The valorization of these underutilized by-products not only contributes to the sustainable management of agricultural residues but also aligns with global efforts to develop innovative, natural ingredients for use in the food and pharmaceutical industries [7].
Cowpea pods, classified as lignocellulosic biomass, are rich in structural polysaccharides (cellulose and hemicellulose) and phenolic compounds (PCs) with recognized health benefits [8,9]. Driven by growing interest in natural antioxidants for food and cosmetic applications [7,10,11], ultrasound-assisted extraction (UAE) has emerged as an efficient technique that enhances the release of target compounds by disrupting plant cell walls through acoustic cavitation [12]. In particular, high-intensity ultrasound (HIU) has proven to be a clean and rapid method for recovering PCs from plant matrices [13,14]. In this way, optimized HIU conditions (36% amplitude for 10 min in aqueous suspension) were applied to yield cowpea pod extracts with high antioxidant capacity (AOC) [15]. Notably, the AOC was maintained when the extracts were incorporated into Ca(II)-alginate hydrogels, and their bioaccessibility after in vitro digestion and colonic fermentation were demonstrated, indicating potential benefits at both the intestinal and microbial levels [16].
In these studies, Response Surface Methodology (RSM), a statistical tool that allows for the simultaneous evaluation of multiple variables, was employed to optimize extraction conditions for maximizing the yield of antioxidant compounds. Solvent polarity proved to be a key factor, as the solubility of PCs varies with their chemical structure and the polarity of the medium [17,18]. Thus, the careful selection of solvent, ultrasound intensity, and extraction time is critical for improving yield, selectivity, and the overall AOC of the extracts.
However, beyond extraction, further separation of the resulting mixtures is essential to better understand their bioactivity. Plant-based extracts are complex mixtures of compounds with diverse chemical structures and properties that collectively influence their biological activity. Identifying the specific contribution of individual compounds to the overall AOC remains challenging. In this regard, column chromatography, particularly with Sephadex LH-20, has proven to be an effective method for selectively separating molecules from plant-based extracts based on their molecular size, yielding fractions abundant in specific compounds, thereby facilitating the detection and characterization of those most responsible for the AOC [19,20].
To complement the experimental characterization of the compounds responsible for AOC, theoretical studies have emerged as valuable tools. In particular, theoretical studies on the radical scavenging mechanisms of PCs are pivotal to understanding the relationship between molecular structure and AOC [21]. Density Functional Theory (DFT) has become a cornerstone in this area due to its strong predictive capacity and ability to elucidate molecular interactions and electronic properties relevant to antioxidant behavior [22].
This study aimed to identify the key compounds responsible for the AOC of cowpea pod extracts by combining experimental and theoretical approaches. PCs were extracted using HIU with ethanol–water mixtures, and the extraction conditions were optimized by RSM. The resulting extracts were fractionated using Sephadex LH-20 chromatography, and the most active fractions were analyzed by liquid chromatography with diode-array and fluorescence detectors (DAD and FLD) to determine their phenolic profiles. DFT calculations and Quantum Theory of Atoms in Molecules (QTAIM) analysis were performed to evaluate the radical-scavenging activity of the main identified compounds. To the best of our knowledge, this is the first study to integrate extract fractionation with DFT and QTAIM to investigate the structure–activity relationship of PCs in cowpea pods. This combined strategy offers a more comprehensive understanding of the molecular basis of AOC and highlights the potential of cowpea pod fractions as sources of high-value bioactives. The findings are expected to enhance understanding of their health benefits and support applications in the food and pharmaceutical fields.

2. Materials and Methods

2.1. Raw Material

The experiments were conducted between June and December 2024. Cowpea pods (Vigna unguiculata L. Walp. var.) Colorado variety harvest 2024 was obtained from Estación Experimental El Sombrero, Corrientes (Instituto Nacional de Tecnología Agropecuaria-INTA), Argentina. Cowpea cultivar is registered with the number 1981-01-13 at Registro Nacional de Cultivares (RNC) from the Instituto Nacional de Semillas de Argentina Registration (INASE), Argentina. Pods were sun-dried, cleaned, selected free of any contamination, milled at high speed (HC-1000Y, Arcano, Nanjing, China), and sifted using a 60-mesh sieve (250 μm). Pod flour was stored in airtight containers at 4 °C until determination.

2.2. Extracts: Obtention and Optimization

2.2.1. Aqueous Cowpea Pod Extract (Wo) Obtention

Wo, rich in PCs, was obtained by applying HIU, according to the protocol optimized and validated by Traffano-Schiffo et al. [15]. Briefly, a relation of 1:15 (g pod flour/mL distilled water) was homogenized under stirring during 10 min and then, HIU (VCX500, Sonics, Newtown, CT, USA) at 36% of amplitude for 10 min, with pulses of 2 s ON and 4 s OFF was applied using a 13 mm diameter probe (220-B, CV334 model, Sonics, USA) with temperature control (≤40 °C) at 20 kHz and a maximum power of 500 W. Then, samples were centrifuged at 4830× g for 15 min, vacuum filtered (using Buchner and filter paper), freeze-dried at −60 °C and 0.03 mbar for 32 h in a Christ Alpha 1–4 LO freeze-dryer (Martin Christ, Osterode am Harz, Germany), and finally stored in darkness at 4 °C until use.

2.2.2. Ethanolic Cowpea Pod Extract (Eo) Optimization

RSM was used to optimize the conditions of HIU and extraction solvent (ethanol/water) on the bioactive power (total phenolic content and antioxidant capacity) of cowpea pod extract. A Box-Behnken design was applied by Design Expert® software version 13 (Design Expert, Stat-Ease Inc., Minneapolis, MN, USA) analyzing the effect of three independent variables: concentration of the organic extraction solvent (X1, 0–50% ethanol:distilled water); ultrasound extraction power (X2, 0–80% amplitude), and HIU total treatment time (X3, 0–20 min); being the response variables of the total phenolic content (TPC) by Folin-Ciocalteu and the antioxidant capacity (AOC) by ABTS*+ radical scattering assay (see Section “Dependent Variables”). A solution 1:15 pod flour/distilled water was prepared in a 100 mL beaker and mixed for 10 min using a magnetic stirrer prior to the application of HIU using a probe suitable for organic solvents (219-B, CV334 model, Sonics, USA) with 13 mm diameter, and a thermocouple K-type set at 40 °C for temperature control, both connected to the ultrasonic processor mentioned above (see Section 2.2.1). The probe was submerged in the solution, leaving 1 cm to the bottom of the beaker, which was placed on an ice bath to avoid temperature rise [15]. The optimization was carried out prioritizing the maximum AOC and the maximum TPC (5 levels for each variable). Table S1 shows the coded and actual values used for the RSM, where a second-order polynomial model was used to estimate the predicted responses (Equation (1)).
Y = β o + i = 1 k β i X i + i = 1 k β i i X i 2 + i = 1 k β i j X i X j + ɛ
where Y is the response value (dependent variable), β o is the offset term, and β i , β i i , and β i j are the linear, squared, and interaction regression coefficients. X i and X j are the independent variables, k is the number of tested variables, and ɛ, the error of the model. The significance of each dependent variable was determined through the p-value and the regression coefficient (R2) obtained from the analysis of variance (ANOVA) with a 95% of confidence level. The desirability function (D) was used to decide the combination of the independent variables that allows the achievement of the maximum of the response variables. Once the optimum extract was obtained, three samples were subjected to these conditions, and the responses were measured and compared to the predicted values obtained by the model by the coefficient of variation (CV%) [2].
The obtained extracts were centrifuged at 8586× g for 15 min at 25 °C, vacuum filtered, and the supernatants were subjected to a distillation evaporation process using a rotary evaporator (RE100-Pro, DragonLab, Beijing, China) until complete removal of the organic solvent, confirmed by the absence of residual ethanol odor. Finally, they were freeze-dried (model Christ Alpha 1–4 LO, Martin Christ, Osterode am Harz, Germany), and the obtained powders were named as Eo and stored at 4 °C until use.
Dependent Variables
To determine TPC and AOC, 2 mg/mL of each extract was diluted in distilled water and vigorously shaken and centrifuged at 2500× g for 5 min. TPC was determined following the method proposed by Singleton et al. [23], which is detailed in Section 2.4.1. AOC against ABTS*+ radical (TEACABTS) assay was performed according to Re et al. [24]. ABTS*+ radical was obtained by reacting 7 mM ABTS with 2.45 mM potassium persulfate at 25 °C and in the dark for at least 16 h before its use. To prepare the daily working solution, ABTS*+ was diluted with phosphate buffer 5 mM (pH 7.4) until obtaining an absorbance of 0.7 (±0.2) at 734 nm and 30 °C. Then, 10 μL of each sample was mixed with 1 mL of the daily ABTS*+ solution in Eppendorf tubes and left to react for 45 min at room temperature in the dark. Finally, 300 μL of each sample in triplicate was transferred into a 96-well microplate and measured in a microplate reader (Multiskan GO, Thermo Scientific™, Vantaa, Finland) at 734 nm. The calibration curve was performed with Trolox (0–2 mM), and the results were expressed as mmol of Trolox equivalent (TE)/g extract.

2.3. Fractionation Using Sephadex LH-20

Sephadex LH-20 column chromatography (GE Health Bio-Sciences AB, Danderyd, Sweden) was employed to fractionate the optimized ethanolic (Eo) and aqueous (Wo) extracts, as previously described [25,26]. Two hundred mg of dried optimized extracts were dissolved in 4 mL of 50% ethanol. The remaining solution was filtered using a 0.45 μm syringe filter and then loaded onto the column (3.2 mL). The Sephadex gel column, pre-equilibrated with absolute ethanol, measured 18.5 cm in length and had a total volume of 120 mL. Fractionation was performed using a stepwise gradient of ethanol and water (100–50%). Eluents were collected in 8 mL fractions at a flow rate of 1 mL/min. Between samples, the column was regenerated by washing it with five column volumes of absolute ethanol.
The TPC of each collected tube was determined using the Folin-Ciocalteu reagent (see Section “Dependent Variables”). Fractions with detectable TPC absorbance values were plotted to generate a graph.
Tubes exhibiting similar peaks in the TPC profile were pooled into a single fraction, concentrated by rotary evaporation at 40 °C, freeze-dried, weighed, and stored at −20 °C for further analysis.

2.4. Analysis of Phenolic Compounds (PCs)

2.4.1. Total Phenolic Content (TPC)

To determine TPC, 10 μL of each sample was mixed with 60 μL of bidistilled water and 50 μL of Folin-Ciocalteu reagent. After 1 min of reaction, 150 μL of Na2CO3 20% (w/v) and 190 μL of bidistilled water were added, leading to a reaction for 2 h at room temperature and in darkness [23]. Finally, the absorbance was measured at 760 nm in triplicate in a 96-well microplate and measured in a microplate reader (Multiskan GO, Thermo Scientific™, Vantaa, Finland). The calibration curve was prepared using gallic acid (0.031 to 2 mg/mL). Results were expressed as mg of gallic acid equivalent (GAE)/g extract or fraction.

2.4.2. Total Ortho-Diphenol Content (TODC)

TODC was determined according to the method described by Granato et al. [27]. An aliquot (50 μL of the sample) (1 mg/mL for extract, and 2–5 mg/mL for fractions) was mixed with 200 μL of the reagent (5% w/v sodium molybdate solution in 50% v/v ethanol). The mixture was allowed to react for 25 min at room temperature. Subsequently, the absorbance was measured at 370 nm using a microplate reader (Multiskan GO, Thermo Scientific, Finland). A calibration curve was constructed using caffeic acid as the standard. The results were expressed as mg of caffeic acid equivalent (CAE)/g extract or fraction.

2.4.3. Total Flavonoids Content (TFC)

TFC was determined following the method proposed by Granato et al. [27]. In a 96-well microplate, 100 μL of distilled water, 10 μL of 5% (w/v) NaNO2 solution, and 25 μL of extract (0.5–1 mg/mL) were added. After 5 min, 25 μL of 10% (w/v) AlCl3·6H2O solution was added and allowed to react for another 5 min. Then, 50 μL of 1 M NaOH was added to each well, and the mixture was incubated for 5 min under continuous agitation. The absorbance was measured at 510 nm using a microplate reader (Multiskan GO, Thermo Scientific, Finland). A calibration curve was constructed using quercetin as a standard (0.75 mg/mL). TFC was expressed as mg of quercetin equivalent (QE)/g extract or fraction.

2.4.4. Antioxidant Capacity (AOC) Assays

DPPH Radical Scavenging
DPPH radical scavenging method was performed according to Brand-Williams et al. [28]. DPPH solution was prepared by dissolving 20 mg of DPPH in 100 mL of 80% (v/v) methanol. A working solution was then prepared by diluting the original solution (1:5) with 80% (v/v) methanol. A mixture of 20 µL of extract (5 mg/mL for extract, and 5–10 mg/mL for fractions) and 280 µL of DPPH solution was prepared in a 96-well microplate and kept in the dark. After 60 min of reaction, absorbance at 517 nm was measured using a microplate reader (Multiskan GO, Thermo Scientific, Finland). A calibration curve was generated using a standard solution of 2 mg of Trolox dissolved in 10 mL of 80% methanol. The results were expressed as mmol of Trolox equivalent (TE)/g extract or fraction.
Ferric Reducing Antioxidant Power (FRAP)
FRAP assay was carried out according to the protocol proposed by Benzie et al. [29] and modified by Traffano-Schiffo et al. [16]. The ferric reduction capacity was determined when 20 μL of each sample (5 mg/mL for extract, and 5–10 mg/mL for fractions) was added in triplicate to a 96-well microplate, reacting with 280 μL of FRAP reagent (recently prepared). The FRAP reagent contained 2.5 mL of 10 mM 2,4,6-tripyridyl-s-triazine (TPTZ) solution in 40 mM HCl with 2.5 mL of 40 mM FeCl3·6H2O and 25 mL of 0.3 M acetate buffer (pH 3.6). After 30 min of reaction, the absorbance was measured by a microplate reader (Multiskan GO, Thermo Scientific™, Vantaa, Finland) at 593 nm at 37 °C. The calibration curve was carried out with Trolox (0.01–0.1 mg/mL). Results were expressed as mmol of Trolox equivalent (TE)/g extract or fraction.

2.5. Analysis of Phenolic Compounds by LC-DAD-FLD

A liquid chromatography (LC) method coupling diode-array (DAD) and fluorescence detectors (FLD) developed by Ferreyra et al. [30] was used. An HPLC-DAD-FLD (Dionex Ultimate 3000 system, Dionex Softron GmbH, Thermo Fisher Scientific Inc., Germering, Germany) and a reversed-phase Kinetex C18 column (3.0 mm × 100 mm, 2.6 μm; Phenomenex, Torrance, CA, USA) were used. The mobile phases were an aqueous solution of 0.1% formic acid (FA) (eluent A) and acetonitrile (MeCN) (eluent B). The following gradient was used: 0–1.7 min, 5% B; 1.7–10 min, 30% B; 10–13.5 min, 95% B; 13.5–15 min, 95% B; 15–16 min, 5% B; 16–19, 5% B. The total flow rate was set at 0.8 mL/min, and the column temperature at 35 °C. Samples (5 μL) were filtered and degassed prior to injection. The conditions for DAD and FLD detectors were as follows: the analytical flow cell for DAD was set to scan from 200 nm to 400 nm, and different wavelengths (254, 280, 320, and 370 nm) were used according to the maximum absorbance of analytes. For FLD, an excitation wavelength of 290 nm and a monitored emission response of 315, 360, and 400 nm were used depending on the targeted analytes. The retention times of compounds in samples with those of standards were the way of identification of each compound, and quantification was done by an external calibration with pure standards. All the samples were analyzed in triplicate (three replicate injections).

2.6. Statistical Analyses

An analysis of variance was performed, and the least significant difference test was used to compare the means (CI = 95%). The statistical analysis was performed using Infostat software, version 2017 [31]. The experimental conditions for the RSM were evaluated using Design-Expert® software, version 13 (Stat-Ease Inc., Minneapolis, MN, USA).

2.7. Computational Methods

The geometries of the selected compounds were optimized using the B3LYP/6-311++G(d,p) level of theory and confirmed as stationary points through frequency calculations. Solvent effects were incorporated by performing full optimizations within the SMD continuum solvation model. Closed-shell and open-shell systems were treated using restricted and unrestricted calculation methods, respectively.
The radical scavenging activities of the selected PCs were assessed by evaluating the AOC through three mechanisms: hydrogen atom transfer (HAT), electron transfer-proton transfer (SET-PT), and sequential proton loss-electron transfer (SPLET). To explore these mechanisms, thermodynamic parameters such as bond dissociation enthalpy (BDE), adiabatic ionization potential (IP), proton dissociation enthalpy (PDE), proton affinity (PA), and electron transfer enthalpy (ETE) were calculated [32]. All calculations were carried out using the Gaussian 16 program. Additionally, topological QTAIM analysis, including atomic spin density population [33], was performed using the AIMALL program. Further theoretical details and computational methods are available in the Supporting Information.

3. Results and Discussion

3.1. Extraction Optimization Using HIU and Ethanol/H2O by RSM

As was optimized in a previous work using water as solvent [15], the present research was focused on the evaluation of the effect of organic solvent (ethanol) in the recovery of bioactive compounds from agricultural waste (cowpea pods).
Fifteen runs were carried out according to Box-Behnken design of three factors and the results obtained ranged between 30.8 and 56.7 mg GAE/g and 0.5 and 1.3 mmol TE/g for TPC and AOC by ABTS*+, respectively (see Table S1). These results are presented in the 3D surface plots (Figure 1) and two-dimensional contour plots (Figure S1). Figure 1 and Figure S1 showed the high robustness in the extraction, since a wide area of possible solutions with a maximum desirability was obtained (D = 1.000), being able to use in a wide range of HIU amplitude (0–60%) and a range ethanol:water concentration from 40 to 50%.
As shown in Figure 1a, the highest TPC was obtained at an ethanol concentration of 50%. This result is attributed to the favorable polarity of the hydroalcoholic mixture, which improves both solubility and mass transfer of phenolic compounds from cowpea pods by facilitating solvent–solute interactions and increasing cell wall permeability. Additionally, the use of low HIU amplitude and moderate extraction time proved essential, as it ensures efficient cavitation while minimizing compounds degradation. A similar trend was observed for the AOC, with the same combination of variables (50% ethanol, low HIU amplitude, and moderate time) producing the most active extracts. This outcome reflects the ability of the selected conditions to extract a broader spectrum of phenolics with high antioxidant potential.
To analyze the significance and the suitability of the Box-Behnken model, two-dimensional contour plots (Figure S1) and the ANOVA (Table 1) were performed. Regarding the TPC, the statistical results obtained were F-value = 19.31; p-value = 0.0002; R2 = 0.9354 and CV(%) = 7.48 adjusted to a reduced quadratic model, where variable X 1 , the interactions X 1 X 2 and X 2 X 3 and the quadratic term X 1 2 significantly modify the response variables (p < 0.05). On the other hand, for AOC response, the ANOVA showed F-value = 11.45; p-value = 0.0011; R2 = 0.8642 and CV(%) = 10.33 adjusted to a reduced 2FI model, being variable X 1 and the interactions X 1 X 2 and X 2 X 3 significant for the model (p < 0.05). The validations of the models were also confirmed with the lack of fit analyses, whereas for both models, they were not significant (p > 0.05). It should be noted that the F-value compares the mean square with the residual mean; and p-values are useful to evaluate the significance of each coefficient, indicating the interaction between the variables. These results indicate a very high significance of the model and the precision degree, with a high reliability of the experimental values. Regression equations for each response can be seen in Table S2.
The optimum studied and validated condition which showed a high desirability (D = 1.00) was X 1   = 50%, X 2   = 20%, and X 3   = 15 min. Table 2 shows the predicted and experimental values obtained for the optimum condition, which exhibits low errors (%) for both response variables, demonstrating the high fit of the Box-Behnken model.
In alignment with the optimum obtained, Zhou et al. [34] found that the extraction of antioxidant compounds from seed coats of red sword bean (Canavalia gladiate (Jacq.) DC) was mainly affected by ethanol concentration and significantly higher differences were obtained applying HIU-treatment compared to traditional extraction methods (maceration and Soxhlet) in TPC and AOC (TEABTS*+), being the optimal HIU extraction conditions 60.2% ethanol, 18.4 min, 50 °C, and an ultrasound power of 400 W. Yang et al. [35] studied the effect of HIU on the extraction of PCs from common bean (Phaseolus vulgaris L.) reaching an extraction of 75.2 µmolFe(II)/gDW and 50.0 μmolTE/gDW for AOC by FRAP and DPPH under the optimal condition of 68 min, 30 °C, 480 W, a ratio 36:1 liquid:solid, and using 55% of organic solvent (acetone). Regarding cowpea, Avanza et al. [9] investigated the extraction of PCs with AOC from pods and seeds of Colorado and Cuaretón varieties, applying pressurized liquid extraction (PLE) as green technology. The study evaluated the influence of different solvents, including ethanol, water, formic acid, and acetone, on extraction efficiency. They found higher concentrations of TPC in extract from pods of the Colorado variety, using ethanol as solvent, at 170 °C, and three cycles of PLE, yielding 117 mg GAE/g and 2.3 mmol TE/g of AOC by ABTS*+.
Despite these advances, few studies have addressed the use of HIU for extracting PCs from cowpea, including their identification, quantification, and the influence of organic solvents from a chemical perspective. In this context, the present study compares an ethanol-based optimized extract (Eo) with a previously optimized aqueous extract (Wo) developed by the research group [15] to evaluate the impact of solvent polarity on extraction outcomes.

3.2. Fractionation of the Extracts

Eo and Wo were fractionated using Sephadex LH-20 column chromatography. Sephadex LH-20 is a hydroxypropylated dextran material that separates compounds not only by molecular weight but also by polarity and hydrophobic interaction with the stationary phase [36]. Since plant extracts are complex mixtures containing a wide variety of phytochemicals, increasing the polarity of the mobile phase may be used for achieving high-quality separations. A mixture of ethanol–water–acetone was initially tested as eluent, based on previous reports [19]. However, subsequent analysis indicated that a water–ethanol mixture provided improved separation. This selection was particularly suitable given that our matrix primarily contains phenolic acids and flavonoids [9], which were effectively separated by such a binary solvent system using Sephadex LH-20 columns [36,37]. Therefore, the fractionation of both extracts was carried out using a water–ethanol gradient.
Based on the TPC absorbance values, the collected tube fractions were pooled into four fractions for each extract type (E1–E4 and W1–W4 for ethanolic and aqueous extracts, respectively) (see Figure S2a,b in Supporting Information). Overall, the fractionations of both extracts were reproducible, and results across triplicate samples were consistent.

3.3. Characterization of Extracts and Their Corresponding Fractions

3.3.1. Yield Evaluation of Extracts and Their Fractions

The extraction yields of Eo and Wo were not significantly different (p > 0.05) (Table 3). The extraction yields obtained were slightly higher than those achieved by maceration for 24 h with shaking using ethanol, water, water-formic acid (2% and 5% (v/v)), and acetone-formic acid (1% (v/v)) for cowpea pods [9]. However, the extraction yields using PLE demonstrated superior extraction efficiency (25%) compared to UAE.
Regarding fractions, E1 and W1 showed the highest yields, followed by E3 and W3, with lower yields observed in E2 and W2. The final fractions, E4 and W4, yielded the smallest amounts.

3.3.2. Phenolic Compound Content

Total Phenolic Content
The TPC values demonstrated the higher extraction efficiency of ethanol-water mixture over water, as Eo exhibited significantly higher TPC (127 ± 5 mg GAE/g) than Wo (87 ± 3 mg GAE/g). This efficiency aligns with previous studies showing hydroethanolic mixtures outperform pure solvents in extracting PCs from plants such as Alpinia officinarum [38] and artichoke residues [39]. The enhanced extraction is attributed to improved solubility and diffusion of PCs in aqueous ethanol, which facilitates non-covalent interactions and better matrix penetration [40]. Moreover, the TPC value for Eo was greater than those reported for cowpea pod extractions using maceration (16–44 mg GAE/g) and pressurized liquid extraction (PLE, 104.53 mg GAE/g) [9]. Thus, HIU extraction using an ethanol–water mixture provides enhanced efficiency for the recovery of PC from cowpea pods.
Among the ethanol-based fractions, E2 exhibited the highest TPC (165.9 mg GAE/g), surpassing the value of the Eo extract. In the aqueous system, W2 also showed the highest TPC (130 mg GAE/g), which was significantly higher (p < 0.05) than that of Wo. In both solvent systems, the fourth fractions (E4 and W4) showed the lowest TPC values, indicating a lower concentration of PCs in these fractions.
Total Ortho-Diphenol Content
Ortho-diphenols, known for their ability to stabilize free radicals via intramolecular hydrogen bonding [41], were found to constitute a substantial portion of the TCP. No significant differences in TODC were observed between Eo and Wo, which represented 77% and 60% of their respective TPCs. These proportions are in line with previous findings for Mucuna pruriens and Cajanus cajan pod extracts [42], indicating that ortho-diphenols are abundant contributors to the total phenolic pool in legume by-products.
TODC trends mirrored those of TPC, particularly in E2 and W2, which showed the highest values (107 and 73.6 mg CAE/g, corresponding to 61% and 57% of its TCP, respectively). Fractions E1, E3, W1, and W3 showed lower TODC values than their corresponding optimized extracts. Interestingly, although fractions E4 and W4 had low TPC values, the TODC accounted for nearly 100% of their TPCs.
Total Flavonoid Content
There were no significant differences (p > 0.05) in TFC between the Eo (16.25 mg QE/g) and Wo extracts (14.41 mg QE/g), indicating that both solvents were similarly effective in extracting flavonoids.
The highest TFC values were observed in fractions E3 and W3, with no significant differences compared to the corresponding optimized extracts. Conversely, earlier fractions (E1, E2, W1, and W2) had significantly lower TFC values, suggesting the presence of other phenolic subclasses. Flavonoids were not detected in E4 and W4, confirming the compositional selectivity of the fractionation process.
Thus, the ethanol–water binary solvent proved more effective for the extraction of PCs. While this enhancement was clear in the TPC values, it was less marked for TODC and TFC, possibly due to the similar solubility profiles of these compound classes in both solvent systems.

3.3.3. Antioxidant Capacity

The AOC of the extracts and their corresponding fractions was evaluated using two complementary assays, DPPH and FRAP. The DPPH assay estimates the ability of antioxidant compounds to neutralize free radicals via hydrogen atom donation, while the FRAP assay reflects the reducing potential of the sample by measuring its capacity to reduce ferric to ferrous ions. The results obtained from both assays are summarized in Table 3.
Overall, the extracts and fractions with higher AOC, as evaluated by the DPPH and FRAP assays, exhibited higher TPC. This relationship was assessed through a Pearson correlation test, and the corresponding r-values are presented in Table S3 of the Supporting Information. In line with these findings, the Eo showed higher AOC in both assays (DPPH: 56 mmol TE/g; FRAP: 1.79 mmol TE/g) compared to the Wo, which had lower values (DPPH: 27 mmol TE/g; FRAP: 1.27 mmol TE/g), consistent with its greater TPC. This underscores the superior efficiency of ethanol–water mixtures in extracting bioactive antioxidant compounds.
Among the Eo fractions, E2 displayed the highest DPPH (68 mmol TE/g) and FRAP (2.06 mmol TE/g) values, correlating with its elevated TPC and TODC values. A similar trend was observed for the aqueous fractions, with W2 displaying the highest activity (DPPH: 47.9 mmol TE/g; FRAP: 1.52 mmol TE/g), also corresponding to its higher TCP. In contrast, the remaining fractions (E1, E3, E4, W1, W3, and W4) exhibited lower AOC than their corresponding optimized extracts, with E4 and W4 being the least active in both assays.
Therefore, since fractions E2 and W2 exhibited higher antioxidant capacity than their respective crude extracts (Eo and Wo), it can be inferred that the Sephadex LH-20 column chromatography effectively enriched and separated the antioxidant compounds into these fractions.

3.4. Quantitative RP-HPLC Analysis

The AOCs of Eo and Wo, as well as their most active fractions (E2 and W2, respectively), were thoroughly examined through PC profiling, as detailed in Table 4. The aim of fractionation using LH-20 column chromatography was to isolate and concentrate specific PCs that might contribute to the increased AOC observed in fractions E2 and W2 compared to the optimized extracts.
Through phenolic profiling analysis of the extracts and their fractions, 23 phenolic acids and flavonoids were tentatively identified based on HPLC-DAD-FLD data and previously reported findings [30]. Significant differences in phenolic composition and concentrations were observed between Eo and Wo, as well as in comparison to their most active fractions.
In Eo, caffeic and caftaric acids were the most abundant hydroxycinnamic acids detected. Additionally, cinnamic acid and the flavonols morin and kaempferol-3-glucoside were found at high concentrations, particularly the former. Wo exhibited high concentrations of hydroxycinnamic acids, including p-coumaric acid and caftaric acid. This extract also contained notable amounts of (-)-gallocatechin gallate, a flavan-3-ol. Other compounds detected in the Wo were present at lower concentrations and showed no statistically significant differences (p < 0.05).
Cinnamic acid, ellagic acid, morin, kaempferol-3-glucoside, myricetin, and genistein were significantly more abundant in the Eo compared to the Wo, where these compounds were either undetectable or present at substantially lower levels. Notably, cinnamic acid was exclusively found in the Eo, likely due to its higher solubility in organic solvents and limited solubility in water [43]. In contrast, ferulic acid, another hydroxycinnamic acid, was detected only in the Wo, albeit at low concentrations, highlighting the differing solubility profiles of these compounds.
The total sum of phenolic acids, flavonoids, and overall PCs was higher in the Eo. This can be attributed to the superior extraction efficiency of the ethanol-water mixture for PCs. Hydroxycinnamic acids predominantly contributed to the phenolic acid content in both extracts. These compounds, which are commonly found in plant-based foods such as fruits, vegetables, and seeds, are well-known for their antioxidant activity [44]. Rutin and naringin, flavonoid glycosides, also exhibited higher extraction efficiency in the Eo. Conversely, quercetin and its derivatives, particularly quercetin-3-glucoside, were prominent in the Wo and were found at moderate concentrations in the Eo. These results are consistent with the higher AOC observed in the Eo compared to the Wo, reflecting the well-established antioxidant properties of the PCs identified [45].
Furthermore, some compounds tentatively identified via UHPLC-ESI-qTOF-MS/MS have been reported previously for extracts obtained using PLE technology from cowpea pods of two varieties (Colorado and Cuarentón). In PLE extracts of cowpea pods, p-coumaric acid and various di- and tri-hydroxybenzoic acids were identified as major phenolic compounds [9]. Notable differences were observed between the two varieties: Cuarentón pods contained higher levels of quercetin and its glycosides (e.g., diglucoside and rutinoside derivatives) as well as kaempferol diglucoside, while Colorado pods were richer in hydroxylated and methoxylated benzoic and cinnamic acids, as well as tetrahydroxylated flavones and flavonols. In this study, compounds such as tyrosol and proanthocyanidins B1 and B2 were tentatively detected for the first time in cowpea pod extracts, albeit at low concentrations. These findings expand the current understanding of the phenolic composition of this plant matrix, contributing to the broader knowledge of its phytochemical profile.
In the fractions with the highest AOC, distinct patterns of PC concentrations were observed. In E2, the most abundant compounds were caftaric acid, p-coumaric acid, and morin, with concentrations increasing by 3.6, 30.0, and 1.3 times, respectively, compared to the Eo. Significant levels of caffeic acid were also detected, although its concentration was markedly reduced relative to the Eo.
In W2, the predominant compounds were also hydroxycinnamic acids, specifically caftaric acid and p-coumaric acid, with approximately twice the concentration found in the Wo. Also, a high concentration of caffeic acid was observed in W2, even exceeding that found in the Wo. Proanthocyanidin B2, renowned for its potent antioxidant properties, exhibited a significant increase in concentration in both E2 and W2, reaching levels 5.5 and 10 times higher, respectively, than those observed in their corresponding crude extracts. Interestingly, compounds such as tyrosol, proanthocyanidin B1, and astilbin were detected in both E2 and W2, albeit in small amounts. Additionally, myricetin was identified in W2. These compounds were absent in the optimized extracts, suggesting that the column not only separates but also concentrates certain PCs to detectable levels.
Several PCs detected in the optimized extracts, including rutin, quercetin-3-glucoside, genistin, (-)-gallocatechin gallate, and naringin, were absent in the fractions E2 and W2. Similarly, ellagic acid and cinnamic acids, which were found in the Eo in high concentration, were not detected in E2. Kaempferol-3-glucoside, syringic acid, quercetin, and genistein, which were present in moderate to low concentrations in the Wo, were also absent in W2. This highlights the column’s capacity to separate PCs effectively into distinct fractions.
An intriguing observation is that, while E2 exhibited the highest AOC, its total phenolic and phenolic acid concentrations were approximately half those of W2. The higher phenolic acid content in W2 was primarily attributed to the elevated concentrations of caftaric acid and p-coumaric acid. Conversely, E2 contained significantly higher levels of flavonoids, particularly morin, which may contribute to its greater antioxidant potential. These findings underscore the differential contributions of phenolic acids and flavonoids to the AOC of these fractions and demonstrate the impact of the column separation process on PC distribution.
Studies have also shown that the TPC detected by HPLC-DAD-FLD does not always directly correlate with the AOC measured using the Folin–Ciocalteu assay [46,47]. AOC can depend on various factors, including the specific structure and reactivity of PCs, the presence of synergistic or antagonistic interactions between compounds, and the assay method used. Additionally, other non-phenolic compounds may contribute to the overall AOC, such as proteins or peptides [2,48].

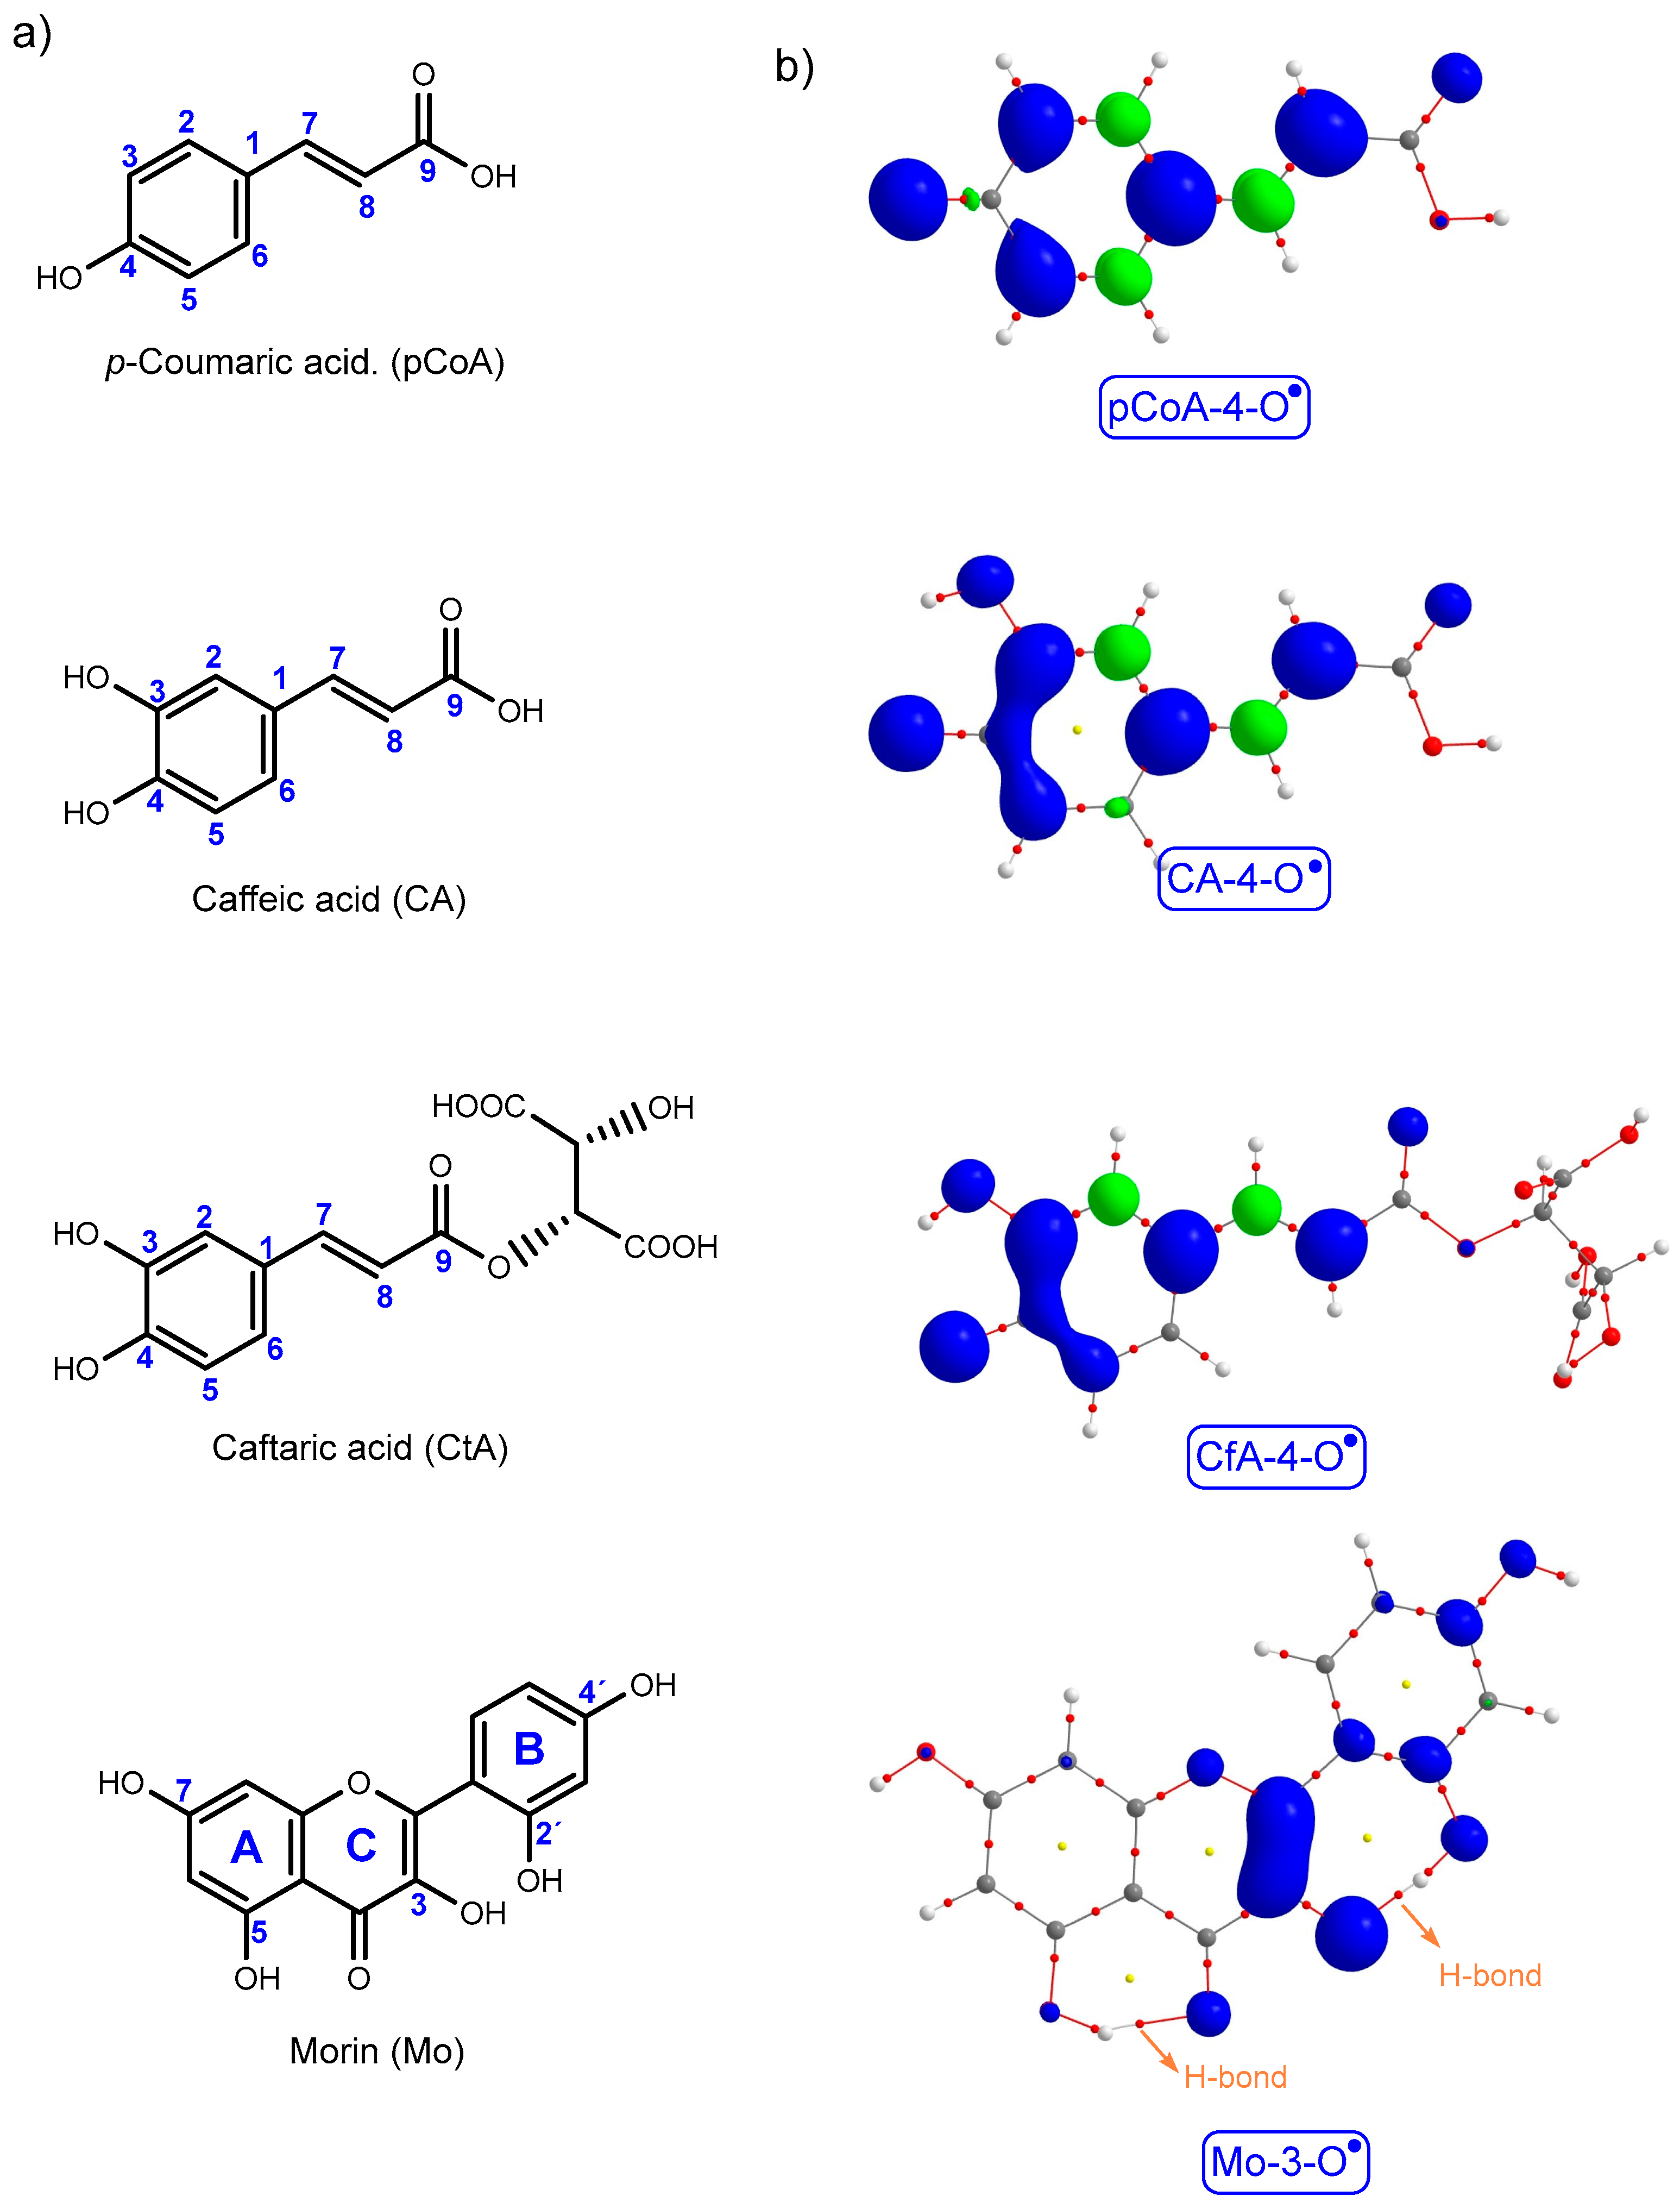
3.5. Computational Chemistry Calculation

To evaluate the AOC of the most abundant PCs identified by HPLC-DAD-FLD in the E2 and W2 fractions (Table 4), a theoretical study was carried out focusing on their radical-scavenging mechanisms using thermodynamic indicators. The molecular structures, spin density distributions, and molecular graphs of the most stable phenoxyl radicals of p-coumaric acid (pCoA), caffeic acid (CA), caftaric acid (CfA), and morin (Mo) are shown in Figure 2 (additional data are provided in the Supporting Information). Thermodynamic parameters related to the HAT, SPLET, and SET-PT mechanisms for these compounds are summarized in Table 5. As the preferred radical-scavenging mechanism depends on the solvent environment, calculations were performed in the gas phase, ethanol, and water.

3.5.1. BDE: HAT Pathway Indicator

Theoretical results revealed that the most stable radical species were the 4-O• radicals in p-coumaric acid (pCoA), caffeic acid (CA), and caftaric acid (CfA), and the 3-O• radical in morin (Mo) (Supporting Information). Based on BDE values, Mo displayed the highest AOC via the HAT mechanism in polar solvents, followed by CA and CfA, which exhibited comparable activity. pCoA was the least effective, and solvent polarity had minimal influence on BDE values.
Spin density distribution (SDD) is an indicator of antioxidant stability following hydrogen atom abstraction, as well as the rate of radical-scavenging reactions. Greater delocalization of spin density enhances radical formation and accelerates scavenging reactions. Among the studied compounds, the superior stability of the Mo-3-O• radical may be attributed to its planar structure, resonance interaction with the carbonyl group, and the presence of intramolecular hydrogen bonds. These H-bonds, confirmed by bond critical points (BCPs) O5-H···O=C and O2′-H···O3•, facilitate p-orbital overlap and electron delocalization, thereby enhancing the stability of the radical species [49].
The similar BDE values of CA-4-O• and CfA-4-O• suggest that the tartaric acid moiety in CfA (2-caffeoyl-L-tartaric acid) has a negligible impact on its radical-scavenging capacity [50]. In both radicals, spin density remains concentrated on the catechol and acrylic groups, further supporting their similar behavior [42]. In contrast, pCoA lacks a 3-OH group, resulting in localized spin density on C3 and C4 and reduced radical stability compared to CA and CfA.

3.5.2. IP and PDE: SET-PT Pathway Indicators

Ionization energy (IP), which reflects the ability of a molecule to donate an electron, also served as an indicator of AOC via the SET-PT mechanism. The calculated IP values followed the same trend as the BDE values, pCoA > CA > CfA > Mo. The subsequent step in the SET-PT mechanism, the proton dissociation from the cationic radical, was assessed through the proton dissociation enthalpy (PDE), which ranged from 2.4 to 9.4 kcal/mol in solution, indicating a generally favorable proton release.
However, the notably higher IP values compared to the BDEs suggested that electron transfer is less favorable, making the SET-PT pathway less significant. As expected, IP values in ethanol and water were lower than those in the gas phase, likely due to the stabilization of the charged species by polar solvents [51].
In the gas phase, PDE is a critical parameter for the SET-PT mechanism, as this step could be a rate-limiting step. However, in polar solvents, PDE was significantly reduced due to the stabilization of charged species, such as protons and cationic radicals, facilitating proton dissociation. This reduction facilitates proton dissociation, consistent with the enhanced delocalization and conjugation of π-electrons in the resulting species.

3.5.3. PA and ETE: SPLET Pathway Indicators

The proton affinity (PA) values calculated in solution for the four compounds were significantly lower than their BDE and IP, indicating that the SPLET pathway is likely the preferred mechanism. The PA in solution followed the trend: Mo < CfA ≈ CA < pCoA. The ETE was higher than the PA, suggesting that this step could be the rate-determining process. Furthermore, ETE values exceeded those of the HAT mechanism, implying that while HAT remains a plausible pathway, SPLET cannot be ruled out.
Solvent effects played a significant role. In polar media, IP, PDE, and PA values markedly decreased compared to the gas phase, due to the high proton solvation enthalpy that stabilizes charged species. This supports previous findings that polar solvents promote deprotonation by enhancing ionic stabilization [52].
Among the analyzed compounds, Mo emerged as the most effective antioxidant, showing strong activity via HAT, SET-PT, and SPLET mechanisms. CA and CfA displayed comparable antioxidant potential, whereas pCoA was the least active. Although the W2 fraction contained a higher concentration of PCs, the greater concentration of Mo in the E2 fraction likely explains its superior antioxidant capacity (Table 5).
Overall, despite the complex nature of antioxidant activity in plant extracts, where multiple compounds and synergistic interactions are involved, this theoretical evaluation offers valuable insights into the contribution of key phenolic constituents.

4. Conclusions

This study demonstrated that HIU extraction, optimized via RSM using ethanol–water mixtures, is an effective and sustainable approach to maximize the recovery of PCs with AOC from cowpea pod by-products. The optimal extraction conditions (20% amplitude, 15 min, 50% ethanol) yielded an ethanolic extract (Eo) with significantly higher TPC and AOC compared to aqueous extract (Wo).
Subsequent fractionation of both extracts produced fractions (E2 and W2) exhibiting the highest TPC and AOC, as measured by DPPH and FRAP assays, with the ethanolic fraction (E2) showing superior antioxidant performance. Phytochemical profiling by HPLC-DAD-FLD identified hydroxycinnamic acids as the predominant PCs, alongside flavonoids such as morin and kaempferol-3-glucoside in Eo, and p-coumaric acid, caftaric acid, and gallocatechin gallate in Wo. In the most active fractions, these compounds were concentrated: E2 showed increased levels of caftaric acid, p-coumaric acid, and morin compared to Eo, while caffeic acid was present at reduced levels. In W2, significant increases in caftaric acid, p-coumaric acid, and caffeic acid were observed compared to Wo.
Theoretical investigations on the most abundant compounds in the active fractions (p-coumaric acid, caftaric acid, caffeic acid, and morin) revealed that morin exhibits the strongest radical-scavenging efficiency across multiple mechanisms (HAT, SET-PT, and SPLET), followed by caffeic and caftaric acids. These findings emphasize that antioxidant activity is influenced not only by compound concentration but also by molecular structure and solvent interactions.
By bridging experimental results with theoretical insights, this work provides a solid foundation to consider cowpea pods as a sustainable source of bioactive compounds for the development of functional foods or nutraceuticals. Moreover, it offers an interesting strategy for the valorization of agro-industrial waste, promoting circular economy principles through waste reduction and efficient resource utilization.

Supplementary Materials

The following supporting information can be downloaded at: https://www.mdpi.com/article/10.3390/agronomy15071681/s1, Table S1: Coded and real values and response variables for extraction optimization of phenolic compounds and antioxidant capacity of cowpea pods assisted by HIU and using ethanol solvent; Table S2: Regression equations of the evaluated response variables’ total phenolic content and antioxidant capacity by ABTS*+; Figure S1: Desirability, total phenolic content, and antioxidant capacity contour plots as a function of ethanol concentration (%), time (min), and high-intensity ultrasound amplitude (%); Figure S2: The fraction profile of (a) ethanolic and (b) aqueous extracts by Sephadex LH-20 column chromatography. Tubes 1–25 were eluted with 100% ethanol and tubes 26–50 were eluted with 50% ethanol-water solution; Theoretical Background and computational details, Thermodynamic parameters related to antioxidative mechanisms, An overview of the quantum theory of atoms in molecules; Table S3: Bond dissociation enthalpies (BDE) for hydrogen atom of phenolic molecules in kcal/mol; Figure S3. Molecular graph of the radicals stems of CA, CGA, and QE, overlaid with their respective spin density distribution; Table S4: Ionization potential (IP) and proton dissociation enthalpy (PDE). PDE values are provided for each site. Values are given in kcal/mol; Table S5: Proton affinity (PA) and electron transfer enthalpy (ETE) provided for each site. Table S6. Proton affinity (PA) and electron transfer enthalpy (ETE) provided for each site.

Author Contributions

Conceptualization, M.V.T.-S. and M.M.V.; methodology, M.V.T.-S. and M.M.V.; formal analysis, M.V.T.-S., M.M.V., A.G.G., B.I.A. and B.A.A.; investigation, M.V.T.-S., M.M.V., A.G.G. and B.I.A.; writing—original draft preparation, M.V.T.-S., M.M.V. and B.A.A.; writing—review and editing, M.V.T.-S., M.M.V., B.A.A. and M.V.A.; project administration, M.V.T.-S. and M.V.A.; funding acquisition, M.V.T.-S., M.M.V. and M.V.A. All authors have read and agreed to the published version of the manuscript.

Funding

This research was funded by the financial support of Agencia de Investigación, Desarrollo e Innovación de Argentina (PICT-2020-01944), Consejo Nacional de Investigaciones Científicas y Técnicas (PIP 11220200102900CO and PIBAA 28720210100948CO), and Secretaría General de Ciencia y Técnica of UNNE (PI: 23V001 and PI: 22V001).

Data Availability Statement

Data are contained within the article.

Conflicts of Interest

The authors declare no conflicts of interest.

References

  1. Abebe, B.K.; Alemayehu, M.T. A Review of the Nutritional Use of Cowpea (Vigna unguiculata L. Walp) for Human and Animal Diets. J. Agric. Food Chem. 2022, 10, 100383. [Google Scholar] [CrossRef]
  2. Dietz, R.M.; Traffano-Schiffo, M.V.; Maiocchi, M.G.; León, A.E.; Avanza, M.V. Effect of High-Intensity Ultrasound on Cowpea Flours Optimized by Response Surface Methodology and the Impact on Their Techno-Functional Properties. Food Biosci. 2025, 68, 106469. [Google Scholar] [CrossRef]
  3. Moyo, A.A.; Luanda, A.; Ripanda, A.; Nyigo, V.A.; Marealle, A.I. Recent Trend on Phytochemistry, Nutraceutical and Therapeutic Potential of Underutilized Vegetable Cowpea (Vigna unguiculata L.) (Walp) in Healthcare Domains. Pharmacol. Res. Nat. Prod. 2024, 5, 100109. [Google Scholar] [CrossRef]
  4. Lazaridi, E.; Ntatsi, G.; Fernández, J.A.; Karapanos, I.; Carnide, V.; Savvas, D.; Bebeli, P.J. Phenotypic Diversity and Evaluation of Fresh Pods of Cowpea Landraces from Southern Europe. J. Sci. Food Agric. 2017, 97, 4326–4333. [Google Scholar] [CrossRef] [PubMed]
  5. Avanza, M.V.; Chaves, M.G.; Acevedo, B.A.; Añón, M.C. Functional Properties and Microstructure of Cowpea Cultivated in North-East Argentina. LWT 2012, 49, 123–130. [Google Scholar] [CrossRef]
  6. Karapanos, I.; Papandreou, A.; Skouloudi, M.; Makrogianni, D.; Fernández, J.A.; Rosa, E.; Ntatsi, G.; Bebeli, P.J.; Savvas, D. Cowpea Fresh Pods—A New Legume for the Market: Assessment of Their Quality and Dietary Characteristics of 37 Cowpea Accessions Grown in Southern Europe. J. Sci. Food Agric. 2017, 97, 4343–4352. [Google Scholar] [CrossRef]
  7. Gil-Martín, E.; Forbes-Hernández, T.; Romero, A.; Cianciosi, D.; Giampieri, F.; Battino, M. Influence of the Extraction Method on the Recovery of Bioactive Phenolic Compounds from Food Industry by-Products. Food Chem. 2022, 378, 131918. [Google Scholar] [CrossRef]
  8. Onyelucheya, C.M.; Nwabanne, T.J.; Onyelucheya, O.E.; Onuoha, O.E. Dilute Acid Hydrolysis of Cowpea Hulls: A Kinetic Study. Int. J. Adv. Sci. Eng. Inf. Technol. 2016, 6, 451–455. [Google Scholar] [CrossRef]
  9. Avanza, M.V.; Álvarez-Rivera, G.; Cifuentes, A.; Mendiola, J.A.; Ibáñez, E. Phytochemical and Functional Characterization of Phenolic Compounds from Cowpea (Vigna unguiculata (L.) Walp.) Obtained by Green Extraction Technologies. Agronomy 2021, 11, 162. [Google Scholar] [CrossRef]
  10. Shi, L.; Zhao, W.; Yang, Z.; Subbiah, V.; Suleria, H.A.R. Extraction and Characterization of Phenolic Compounds and Their Potential Antioxidant Activities. Environ. Sci. Pollut. Res. 2022, 29, 81112–81129. [Google Scholar] [CrossRef]
  11. Sarma, L.; Patra, F.; Borah, P.K.; Meena, S.; Duary, R.K. Comparative Modeling of Microwave and Ultrasound Assisted Extraction of Phenolics and Berberine from Coptis Teeta Wall. Rhizomes. Sustain. Food Technol. 2025, 3, 570–581. [Google Scholar] [CrossRef]
  12. Bui, A.H.; Cozzolino, D.; Zisu, B.; Chandrapala, J. Effects of High and Low Frequency Ultrasound on the Production of Volatile Compounds in Milk and Milk Products—A Review. J. Dairy Res. 2020, 87, 501–512. [Google Scholar] [CrossRef]
  13. Zhang, S.; Xie, H.; Huang, J.; Chen, Q.; Li, X.; Chen, X.; Liang, J.; Wang, L. Ultrasound-Assisted Extraction of Polyphenols from Pine Needles (Pinus elliottii): Comprehensive Insights from RSM Optimization, Antioxidant Activity, UHPLC-Q-Exactive Orbitrap MS/MS Analysis and Kinetic Model. Ultrason. Sonochem. 2024, 102, 106742. [Google Scholar] [CrossRef] [PubMed]
  14. Xiang, Y.; Liu, Z.; Liu, Y.; Dong, B.; Yang, C.; Li, H. Ultrasound-Assisted Extraction, Optimization, and Purification of Total Flavonoids from Daphnegenkwa and Analysis of Their Antioxidant, Anti-Inflammatory, and Analgesic Activities. Ultrason. Sonochem. 2024, 111, 107079. [Google Scholar] [CrossRef] [PubMed]
  15. Traffano-Schiffo, M.V.; Aguirre Calvo, T.R.; Avanza, M.V.; Santagapita, P.R. High-Intensity Ultrasound-Assisted Extraction of Phenolic Compounds from Cowpea Pods and Its Encapsulation in Hydrogels. Heliyon 2020, 6, e04410. [Google Scholar] [CrossRef]
  16. Traffano-Schiffo, M.V.; Aguirre-Calvo, T.R.; Navajas-Porras, B.; Avanza, M.V.; Rufián-Henares, J.Á.; Santagapita, P.R. In Vitro Digestion and Fermentation of Cowpea Pod Extracts and Proteins Loaded in Ca(Ii)-Alginate Hydrogels. Foods 2024, 13, 3071. [Google Scholar] [CrossRef]
  17. Palaiogiannis, D.; Chatzimitakos, T.; Athanasiadis, V.; Bozinou, E.; Makris, D.P.; Lalas, S.I. Successive Solvent Extraction of Polyphenols and Flavonoids from Cistus Creticus L. Leaves. Oxygen 2023, 3, 274–286. [Google Scholar] [CrossRef]
  18. Zampar, G.G.; Zampar, I.C.; Beserra da Silva de Souza, S.; da Silva, C.; Bolanho Barros, B.C. Effect of Solvent Mixtures on the Ultrasound-Assisted Extraction of Compounds from Pineapple by-Product. Food Biosci. 2022, 50, 102098. [Google Scholar] [CrossRef]
  19. Hwong, C.S.; Leong, K.H.; Aziz, A.A.; Kong, K.W. Separation of Antioxidant-Rich Alternanthera Sessilis Red Extracts by Sephadex LH-20 and Identification of Polyphenols Using HPLC-QToF-MS/MS. Chem. Biodivers. 2023, 20, e202300215. [Google Scholar] [CrossRef]
  20. Vilkickyte, G.; Raudone, L.; Petrikaite, V. Phenolic Fractions from Vaccinium Vitis-Idaea L. And Their Antioxidant and Anticancer Activities Assessment. Antioxidants 2020, 9, 1261. [Google Scholar] [CrossRef]
  21. Wang, Y.; Li, C.; Li, Z.; Moalin, M.; Hartog, G.J.M.d.; Zhang, M. Computational Chemistry Strategies to Investigate the Antioxidant Activity of Flavonoids—An Overview. Molecules 2024, 29, 2627. [Google Scholar] [CrossRef] [PubMed]
  22. Lu, X.-Q.; Qin, S.; Li, J. Radical Scavenging Capability and Mechanism of Three Isoflavonoids Extracted from Radix Astragali: A Theoretical Study. Molecules 2023, 28, 5039. [Google Scholar] [CrossRef] [PubMed]
  23. Singleton, V.L.; Orthofer, R.; Lamuela-Raventós, R.M. Analysis of Total Phenols and Other Oxidation Substrates and Antioxidants by Means of Folin-Ciocalteu Reagent. Methods Enzymol. 1999, 299, 152–178. [Google Scholar] [CrossRef]
  24. Re, R.; Pellegrini, N.; Proteggente, A.; Pannala, A.; Yang, M.; Rice-Evans, C. Antioxidant Activity Applying an Improved Abts Radical Cation Decolorization Assay. Free Radic. Biol. Med. 1999, 26, 1231–1237. [Google Scholar] [CrossRef] [PubMed]
  25. Cao, X.; Wang, C.; Pei, H.; Sun, B. Separation and Identification of Polyphenols in Apple Pomace by High-Speed Counter-Current Chromatography and High-Performance Liquid Chromatography Coupled with Mass Spectrometry. J. Chromatogr. A. 2009, 1216, 4268–4274. [Google Scholar] [CrossRef]
  26. Gan, R.-Y.; Kong, K.-W.; Li, H.-B.; Wu, K.; Ge, Y.-Y.; Chan, C.-L.; Shi, X.-M.; Corke, H. Separation, Identification, and Bioactivities of the Main Gallotannins of Red Sword Bean (Canavalia gladiata) Coats. Front. Chem. 2018, 6, 39. [Google Scholar] [CrossRef]
  27. Granato, D.; Santos, J.S.; Maciel, L.G.; Nunes, D.S. Chemical Perspective and Criticism on Selected Analytical Methods Used to Estimate the Total Content of Phenolic Compounds in Food Matrices. TrAC Trends Anal. Chem. 2016, 80, 266–279. [Google Scholar] [CrossRef]
  28. Brand-Williams, W.; Cuvelier, M.E.; Berset, C. Use of a Free Radical Method to Evaluate Antioxidant Activity. LWT-Food Sci. Technol. 1995, 28, 25–30. [Google Scholar] [CrossRef]
  29. Benzie, I.F.F.; Strain, J.J. The Ferric Reducing Ability of Plasma (Frap) as a Measure of “Antioxidant Power”: The Frap Assay. Anal. Biochem. 1996, 239, 70–76. [Google Scholar] [CrossRef]
  30. Ferreyra, S.; Bottini, R.; Fontana, A. Tandem Absorbance and Fluorescence Detection Following Liquid Chromatography for the Profiling of Multiclass Phenolic Compounds in Different Winemaking Products. Food Chem. 2021, 338, 128030. [Google Scholar] [CrossRef]
  31. Di Rienzo, J.A.; Casanoves, F.; Balzarini, M.G.; Gonzalez, L.; Tablada, M.; Robledo, C.W. (2016). InfoStat versión 2017. (Grupo InfoStat, FCA, Universidad Nacional de Córdoba, Argentina, 2017). Available online: http://www.infostat.com.ar (accessed on 10 June 2024).
  32. Leopoldini, M.; Russo, N.; Toscano, M. The Molecular Basis of Working Mechanism of Natural Polyphenolic Antioxidants. Food Chem. 2011, 125, 288–306. [Google Scholar] [CrossRef]
  33. Bader, R.F.W. Atoms in Molecules. A Quantum Theory; London Oxford Science Publications; Clarendon Press: Oxford, UK, 1990. [Google Scholar]
  34. Zhou, Y.; Xu, X.-Y.; Gan, R.-Y.; Zheng, J.; Li, Y.; Zhang, J.-J.; Xu, D.-P.; Li, H.-B. Optimization of Ultrasound-Assisted Extraction of Antioxidant Polyphenols from the Seed Coats of Red Sword Bean (Canavalia gladiate (Jacq.) DC.). Antioxidants 2019, 8, 200. [Google Scholar] [CrossRef]
  35. Yang, Q.-Q.; Gan, R.-Y.; Ge, Y.-Y.; Zhang, D.; Corke, H. Ultrasonic Treatment Increases Extraction Rate of Common Bean (Phaseolus vulgaris L.) Antioxidants. Antioxidants 2019, 8, 83. [Google Scholar] [CrossRef] [PubMed]
  36. Rosero, J.C.; Cruz, S.; Osorio, C.; Hurtado, N. Analysis of Phenolic Composition of Byproducts (Seeds and Peels) of Avocado (Persea americana Mill.) Cultivated in Colombia. Molecules 2019, 24, 3209. [Google Scholar] [CrossRef] [PubMed]
  37. Tian, Y.; Liimatainen, J.; Puganen, A.; Alakomi, H.-L.; Sinkkonen, J.; Yang, B. Sephadex LH-20 Fractionation and Bioactivities of Phenolic Compounds from Extracts of Finnish Berry Plants. Food Res. Int. 2018, 113, 115–130. [Google Scholar] [CrossRef]
  38. Ozdemir, M.; Gungor, V.; Melikoglu, M.; Aydiner, C. Solvent Selection and Effect of Extraction Conditions on Ultrasound-Assisted Extraction of Phenolic Compounds from Galangal (Alpinia officinarum). J. Appl. Res. Med. Aromat. Plants 2024, 38, 100525. [Google Scholar] [CrossRef]
  39. Rabelo, R.S.; Machado, M.T.C.; Martínez, J.; Hubinger, M.D. Ultrasound Assisted Extraction and Nanofiltration of Phenolic Compounds from Artichoke Solid Wastes. J. Food Eng. 2016, 178, 170–180. [Google Scholar] [CrossRef]
  40. Singh, L.; Singh, B.; Kewlani, P.; Belwal, T.; Bhatt, I.D.; Nandi, S.K.; Bisht, A.K. Process Optimization and Bioactive Compounds Quantification from Dactylorhiza hatagirea Tuber for Alleviating Glycemic and Oxidative Stress. Appl. Res. Med. Aromat. Plants 2022, 26, 100352. [Google Scholar] [CrossRef]
  41. Vella, F.M.; Cautela, D.; Laratta, B. Characterization of Polyphenolic Compounds in Cantaloupe Melon by-Products. Foods 2019, 8, 196. [Google Scholar] [CrossRef]
  42. Avalos, B.I.; Ojeda, G.A.; Spinnenhirn, E.D.; Acevedo, B.A.; Vallejos, M.M. Evaluation of Phenolic Compounds and Antioxidant Capacity in Mucuna Pruriens and Cajanus Cajan Pods Extracts. Food Chem. Adv. 2023, 3, 100503. [Google Scholar] [CrossRef]
  43. Mota, F.L.; Queimada, A.J.; Pinho, S.P.; Macedo, E.A. Aqueous Solubility of Some Natural Phenolic Compounds. Ind. Eng. Chem. Res. 2008, 47, 5182–5189. [Google Scholar] [CrossRef]
  44. Sova, M.; Saso, L. Natural Sources, Pharmacokinetics, Biological Activities and Health Benefits of Hydroxycinnamic Acids and Their Metabolites. Nutrients 2020, 12, 2190. [Google Scholar] [CrossRef] [PubMed]
  45. Li, W.; Chen, H.; Xu, B.; Wang, Y.; Zhang, C.; Cao, Y.; Xing, X. Research Progress on Classification, Sources and Functions of Dietary Polyphenols for Prevention and Treatment of Chronic Diseases. J. Future Foods 2023, 3, 289–305. [Google Scholar] [CrossRef]
  46. Cipollone, M.A.; Abraham, A.G.; Fontana, A.; Tironi, V.A. Autochthonous Fermentation as a Means to Improve the Bioaccessibility and Antioxidant Activity of Proteins and Phenolic Compounds of Yellow Pea Flour. Foods 2024, 13, 659. [Google Scholar] [CrossRef] [PubMed]
  47. Ferreyra, S.; Torres-Palazzolo, C.; Bottini, R.; Camargo, A.; Fontana, A. Assessment of in-Vitro Bioaccessibility and Antioxidant Capacity of Phenolic Compounds Extracts Recovered from Grapevine Bunch Stem and Cane by-Products. Food Chem. 2021, 348, 129063. [Google Scholar] [CrossRef] [PubMed]
  48. Gómez, A.; Gay, C.; Tironi, V.; Avanza, M.V. Structural and Antioxidant Properties of Cowpea Protein Hydrolysates. Food Biosci. 2021, 41, 101074. [Google Scholar] [CrossRef]
  49. Zheng, Y.-Z.; Deng, G.; Chen, D.-F.; Guo, R.; Lai, R.-C. The Influence of C2=C3 Double Bond on the Antiradical Activity of Flavonoid: Different Mechanisms Analysis. Phytochemistry 2019, 157, 1–7. [Google Scholar] [CrossRef]
  50. Świderski, G.; Gołębiewska, E.; Kalinowska, M.; Świsłocka, R.; Kowalczyk, N.; Jabłońska-Trypuć, A.; Lewandowski, W. Comparison of Physicochemical, Antioxidant, and Cytotoxic Properties of Caffeic Acid Conjugates. Materials 2024, 17, 2575. [Google Scholar] [CrossRef]
  51. Farrokhnia, M. Density Functional Theory Studies on the Antioxidant Mechanism and Electronic Properties of Some Bioactive Marine Meroterpenoids: Sargahydroquionic Acid and Sargachromanol. ACS Omega 2020, 5, 20382–20390. [Google Scholar] [CrossRef]
  52. Shang, Y.; Li, X.; Li, Z.; Zhou, J.; Qu, L.; Chen, K. Theoretical Study on the Radical Scavenging Activity and Mechanism of Four Kinds of Gnetin Molecule. Food Chem. 2022, 378, 131975. [Google Scholar] [CrossRef]
Figure 1. 3D surface plots for the responses (a) total phenolic content and (b) antioxidant capacity (ABTS*+) as a function of ethanol concentration (%), time (min), and high-intensity ultrasound amplitude (%).
Agronomy 15 01681 g001
Figure 2. (a) Structural formula of PCs with atom labeling. (b) Molecular graph of the most stable radical species of pCoA, CA, CfA, and Mo, overlaid with their respective spin density distribution.
Agronomy 15 01681 g002
Table 1. Analysis of variance for the fitted model for the optimization of total phenolic content and antioxidant capacity from cowpea pods (p < 0.05).
Sum of Squaresdf *Mean SquareF-Valuep-Value
Total Phenolic Content (mg GAE/g)
(R2 = 0.9354)
Model1107.216184.5319.310.0002significant
X 1 —Ethanol Concentration636.071636.0766.56<0.0001
X 2 —HIU amplitude 0.222710.22270.02330.8825
X 3 —Treatment time0.075410.07540.00790.9314
X 1 X 2 63.25163.256.620.0330
X 2 X 3 237.661237.6624.870.0011
X 1 2 169.931169.9317.780.0029
Residual76.4589.56
Lack of Fit70.16611.693.710.2273not significant
Pure Error6.3023.15
Antioxidant Capacity ABTS*+ (mmol TE/g)
(R2 = 0.8642)
Model0.612650.122511.450.0011significant
X 1 —Ethanol Concentration0.439610.439641.090.0001
X 2 —HIU amplitude 0.002510.00250.23790.6374
X 3 —Treatment time0.019510.01951.830.2096
X 1 X 2 0.062410.06245.830.0390
X 2 X 3 0.088610.08868.280.0183
Residual0.096390.0107
Lack of Fit0.067870.00970.67900.7075not significant
Pure Error0.028520.0143
* df, degree of freedom.
Table 2. Processing conditions for the optimum extraction and validation of the Box-Behnken model.
RunFactorsTotal Phenolic Content
(mg GAE/g)
Antioxidant Capacity ABTS*+ (mmol TE/g)
Ethanol   Concentration   ( X 1 ) (%) HIU   Amplitude   ( X 2 ) (%) HIU   Treatment   Time   ( X 3 ) (min) TPC (mg GAE/g) ModelTPC (mg GAE/g) ExperimentalTPC Error %AOC (mmol TE/g)
Model
AOC (mmol TE/g)
Experimental
AOC Error %
15020155758.8241.341.219
Table 3. Yield, total phenolic (TPC), ortho-diphenols (TODC), flavonoids (TFC) contents, and antioxidant capacity (DPPH and FRAP assays) of Eo and Wo and their fractions obtained by Sephadex LH-20 column chromatography.
SamplesYield
(%)
TPC
(mg GAE/g)
TODC
(mg CAE/g)
TFC
(mg QE/g)
DPPH (mmol TE/g)FRAP
(mmol TE/g)
Eo6.5 ± 0.5 A127 ± 5 Ab75 ± 8 Ab16 ± 1 Aab56 ± 1 Ab1.79 ± 0.07 Ab
E147.8078 ± 3 d48 ± 4 c9.1 ± 0.1 c30 ± 1 d1.35 ± 0.06 c
E211.11165.9 ± 0.5 a107 ± 3 a12.6 ± 0.5 bc68 ± 2 a2.06 ± 0.06 a
E324.29106 ± 5 c78 ± 3 b18 ± 3 a43 ± 2 c1.52 ± 0.01 b
E42.0929 ± 2 e28.7 ± 0.1 dnd22 ± 1 d0.91 ± 0.01 d
85.29 (14.71)
Wo6.1 ± 0.4 A87 ± 3 Bb67 ± 6 Aa14.41 ± 0.09 Aa27 ± 1 Bb1.27 ± 0.05 Bb
W159.0385 ± 7 b37 ± 2 bc7 ± 2 bc24 ± 1 c0.83 ± 0.05 c
W27.19130 ± 5 a74 ± 8 a10 ± 1 b47.9 ± 0.3 a1.52 ± 0.03 a
W317.1856.2 ± 0.6 c43.54 ± 0.07 b13 ± 1 ba19 ± 1 c1.54 ± 0.07 Ab
W43.5213 ± 2 d12.4 ± 0.2 cnd12.6 ± 0.6 d0.68 ± 0.06 c
86.92 (13.08)
Data are the mean ± standard deviation. Fraction yields were calculated based on 450 mg of the corresponding input extract (Eo or Wo). Values with the same letter within a column are not significantly different at p > 0.05. nd: not detected.
Table 4. Individual phenolic composition of Eo and Wo, and their most active fractions (E2 and W2, respectively) (µg compound/g).
AnalyteEoE2WoW2
TyrosolND2.9 ± 0.3 fND10 ± 1 b
Phenolic acids
Cinnamic acid3139 ± 51 bNDNDND
Caftaric acid1243 ± 8 d4425 ± 260 a3912 ± 155 b7630 ± 1108 a
Caffeic acid6841 ± 297 a518 ± 16 d 55 ± 13 d669 ± 95 b
p-coumaric acid110 ± 13 f,g3379 ± 105 b4229 ± 1 a8006 ± 925 a
Ferulic acidNDND67 ± 2ND
Ellagic acid166 ± 3 f,gNDNDND
Syringic acidNDND71 ± 4 dND
Flavonoids
Quercetin109 ± 12 f,g13.6 ± 0.8 f111 ± 11 dND
Myricetin148 ± 9 f,g26.2 ± 0.8 fND22 ± 1 b
Morin2250 ± 95 c2910 ± 80 c72.5 ± 0.4 d108 ± 9 b
IsorhamnetinND32 ± 1fND2.8 ± 0.4 b
Rutin157.4 ± 0.1 f,gND50.7 ± 3 dND
Quercetin-3-glucoside26 ± 10 gND66 ± 6 dND
Kaempferol-3-glucoside793 ± 14 e68.5 ± 1 f54 ± 2 dND
AstilbinND190 ± 6 e,fND111 ± 23 b
(+)-catechin64 ± 3 g73 ± 2 f23 ± 3 d79 ± 12 b
(-)-gallocatechin gallate323.8 ± 0.9 fND264 ± 27 cND
Naringin198 ± 3 f,gND75 ± 1 dND
Genistin17 ± 1 gND12.5 ± 0.2 dND
Genistein221 ± 7 f,g57 ± 1 f8 ± 2 dND
Procyanidin B1ND11.45 ± 0.07 fND7.7 ± 0.6 b
Procyanidin B266 ± 2 g362 ± 2 d,e42 ± 2 d424 ± 67 b
Sum Phenolic acids11499 ± 3728322 ± 3828334 ± 17516305 ± 2128
Sum Flavonoids4374 ± 1593743 ± 95779 ± 58 756 ± 114
Total sum15873 ± 53112067 ± 4779113 ± 23417070 ± 2244
Data are the mean ± standard deviation (n = 3). Values with a letter in common in the same column are not significantly different (p > 0.05). ND: not detected.
Table 5. Relative enthalpy energies (BDE, IP, PDE, PA, and ETE) in kcal/mol of antioxidative mechanisms for the most stable radical species of p-coumaric acid (pCoA), caffeic acid (CA), caftaric acid (CfA), and morin (Mo) in the gas phase (gas), ethanol, and water solvent.
CompoundMediumPosition of RadicalHATSET-PTSPLET
BDEIPPDEPAETE
pCoAGas4-OH81.2185.1212.1326.570.6
Ethanol 83.0117.45.830.389.9
Water 83.3111.09.433.087.4
CAGas4-OH73.0182.7206.4318.670.3
Ethanol 76.5114.02.528.787.9
Water 77.4108.16.529.385.2
CfAGas4-OH72.6179.3209.2317.271.3
Ethanol 76.4113.73.129.687.2
Water 76.9107.36.829.584.5
MoGas3-OH75.5171.3220.1320.471.1
Ethanol 73.7111.62.426.088.0
Water 74.5106.15.526.185.6
Disclaimer/Publisher’s Note: The statements, opinions and data contained in all publications are solely those of the individual author(s) and contributor(s) and not of MDPI and/or the editor(s). MDPI and/or the editor(s) disclaim responsibility for any injury to people or property resulting from any ideas, methods, instructions or products referred to in the content.

