Article

Soil–Plant Biochemical Interactions Under Agricultural Byproduct Amendments and Potassium Humate: Enhancing Soil Function and Bioactive Compounds in Sunflower Sprouts

by
Thidarat Rupngam
1,2,
Patchimaporn Udomkun
1,2,*,
Thirasant Boonupara
3 and
Puangrat Kaewlom
1,*
1
Department of Environmental Engineering, Faculty of Engineering, Chiang Mai University, Chiang Mai 50200, Thailand
2
Office of Research Administration, Chiang Mai University, Chiang Mai 50200, Thailand
3
Living Soil Co., Ltd., Chiang Mai 50100, Thailand
*
Authors to whom correspondence should be addressed.
Agronomy 2025, 15(7), 1651; https://doi.org/10.3390/agronomy15071651
Submission received: 15 May 2025 / Revised: 4 July 2025 / Accepted: 5 July 2025 / Published: 7 July 2025
(This article belongs to the Section Agricultural Biosystem and Biological Engineering)

Abstract

This study presents an integrated approach to sustainable soil and crop management by evaluating the individual and combined effects of cow manure (CM), rice husk biochar (RHB), and potassium humate (KH)—three underutilized, low-cost organic amendments derived from agricultural byproducts. Uniquely, it investigates how these amendments simultaneously affect soil physical and chemical properties, plant growth, and the accumulation of bioactive compounds in sunflower sprouts, thereby linking soil health to crop nutritional quality. The application of 2% w/w KH alone resulted in the greatest increases in macroaggregation (+0.51), soil pH (from 6.8 to 8.6), and electrical conductivity (+298%). The combination of 1% w/w CM and 2% KH led to the highest increases in soil organic carbon (OC, +62.9%) and soil respiration (+56.4%). Nitrate and available phosphorus (P) peaked with 3% w/w RHB + 2% KH (+120%) and 1% w/w CM + 0.5% KH (+35.5%), respectively. For plant traits, 0.5% w/w KH increased the total leaf area by 61.9%, while 1% w/w CM enhanced shoot and root biomass by 60.8% and 79.0%, respectively. In contrast, 2% w/w KH reduced chlorophyll content (−43.6%). Regarding bioactive compounds, the highest total phenolic content (TPC) was observed with 1% w/w KH (+21.9%), while the strongest DPPH antioxidant activity was found under 1% w/w CM + 1% w/w KH (+72.6%). A correlation analysis revealed that biomass production and secondary metabolite accumulation are shaped by trade-offs arising from resource allocation under stress or nutrient limitations. Potassium, P, soil microbial respiration, and OC emerged as key integrators connecting soil structure, fertility, and plant metabolic responses. Overall, the combination of 1% w/w CM with 0.5–1% w/w KH proved to be the most effective strategy under the tested conditions.

1. Introduction

The sustainability of agroecosystems is increasingly at risk due to widespread soil degradation, nutrient imbalances, and the intensifying impacts of climate change. Conventional agricultural practices—particularly the intensive use of synthetic fertilizers—have contributed to the rapid depletion of soil organic matter (SOM), reduced nutrient-use efficiency, disrupted soil microbial communities, and increased environmental pollution [1]. Collectively, these factors compromise soil fertility, agricultural productivity, and ecosystem resilience, highlighting the urgent need for more sustainable soil management strategies.
Organic soil amendments derived from agricultural residues—such as compost, manure, and biochar—have emerged as promising alternatives to improve soil health while promoting circular economy principles. Among these, cow manure (CM) is widely applied due to its richness in organic carbon (OC), macro- and micro-nutrients, and labile OM. CM has been shown to enhance soil aggregation, stimulate microbial biomass, increase enzymatic activities, and improve nutrient cycling, contributing to better soil structure and fertility [2,3]. Additionally, its application can improve soil porosity and water-holding capacity, supporting plant growth, particularly under moisture-limited conditions.
Meanwhile, rice husk biochar (RHB), produced through the pyrolysis of rice residues, is another widely studied amendment known for its stable carbon structure and high surface area. RHB contributes to improved cation exchange capacity, nutrient retention, water availability, and pH buffering capacity [4]. It also enhances soil carbon sequestration and reduces nutrient leaching, making it valuable in low-fertility and degraded soils [5]. Moreover, biochar has been associated with enhanced microbial activity, reduced greenhouse gas emissions, and improved soil aeration [6].
Complementing these inputs, potassium humate (KH)—a soluble derivative of humic substances—functions both as a soil conditioner and a plant biostimulant. KH improves soil structure by promoting aggregate formation, increases nutrient availability through chelation mechanisms, and supports microbial activity in the rhizosphere [7,8]. In plants, KH has been shown to enhance root development, chlorophyll synthesis, and photosynthetic efficiency [9]. Furthermore, KH can enhance phosphorus (P) and potassium (K) uptake and stimulate antioxidant enzyme activity, contributing to improved plant vigor [10]. When used in combination with organic amendments, KH may synergistically stimulate microbial processes and accelerate the mineralization of OM [11]. However, excessive application can lead to phytotoxicity, increased salinity, or imbalance in soil structure [7], emphasizing the need for optimized dosages.
Although the individual benefits of CM, RHB, and KH are well documented across various soil types and crop species, their combined effects on soil quality and plant physiological responses remain poorly understood—particularly in short-cycle cultivation systems, which are becoming increasingly important in urban, vertical, and high-turnover agriculture. Most existing studies have focused on long-duration crops [12], with limited attention given to rapidly growing species that can serve as early indicators of soil amendment efficacy. Moreover, while yield responses are commonly evaluated, little is known about how these amendments influence plant biochemical traits, including the accumulation of antioxidants and phenolic compounds—factors that are critical in functional food production and health-oriented agriculture. To address this gap, sunflower sprouts were selected as a model crop due to their short growth cycle, high nutritional value, and strong sensitivity to soil conditions, allowing for the rapid assessment of soil–plant interactions under controlled conditions [13].
To address these gaps, this present study investigates the individual and combined effects of CM, RHB, and KH on key soil health indicators—such as aggregation, microbial respiration, soil organic carbon (SOC), and nutrient availability—as well as on plant physiological and biochemical traits, including biomass, chlorophyll content, total phenolic content (TPC), and antioxidant activity.
Based on this rationale, the following hypotheses are proposed: (i) the integrated application of CM, RHB, and KH will improve soil physical structure and biological activity, particularly through enhanced aggregation and microbial respiration; (ii) nutrient availability will increase, while adverse effects associated with overapplication will be minimized; and (iii) biomass production and the accumulation of bioactive compounds in sunflower sprouts will be enhanced. This study offers a novel contribution by linking soil health improvements with plant quality outcomes in a short-cycle cultivation model, providing a practical foundation for optimizing organic amendment strategies in sustainable agriculture.

2. Materials and Methods

2.1. Site Characteristics and Amendments Preparation

Soil samples were collected from the top 0–15 cm layer of a field in San Pa Tong District, Chiang Mai, Thailand (18°38′21.5″ N, 98°50′09.6″ E). The soil, classified as Typic Haplustalfs (Sanpatong series), was sandy loam (74.2% sand, 16.7% silt, 9.1% clay). Samples were air-dried for 2–3 days, sieved through a 2 mm mesh, and stored at room temperature (RT) before use.
The CM used in this experiment was unprocessed (non-composted) and freshly collected from local livestock farms, where it is regularly produced through standard animal husbandry practices. It was air-dried in the shade for five days, then crushed and sieved through a 2 mm mesh prior to application. Laboratory analysis showed a carbon-to-nitrogen (C/N) ratio of 21.3. Rice husks were obtained from a farmer-operated rice mill in the study area and selected due to their status as low-value agricultural byproducts with limited on-farm reuse. Before pyrolysis, the husks were oven-dried at 65 °C for 8 h. RHB was produced under controlled conditions using an automated biomass furnace with a heating rate of 10 °C/min and a peak temperature of 500 °C maintained for 1 h, ensuring uniform thermal treatment and effective carbon stabilization. KH was commercially sourced in flake form (Thongkwao Humic Potassium Humate Fulvic, Phitsanulok, Thailand) and applied without further modification. Baseline physicochemical properties of the soil and amendments were analyzed prior to application and are presented in Table 1.

2.2. Treatments and Growth Conditions

This study was designed to evaluate the functional outcomes of organic amendments on soil–plant interactions under controlled pot conditions. While the design allowed for detailed monitoring of plant growth, soil properties, and physiological traits, it was not intended to uncover biochemical or molecular mechanisms. Rather, it served as a performance-based screening trial to guide future hypothesis-driven mechanistic studies.
The experiment included 12 distinct treatments arranged into five groups:
  • Group 1: Control without any amendments (baseline).
  • Group 2: 1% w/w CM alone.
  • Group 3: 3% w/w RHB alone.
  • Group 4: KH alone at 0.5%, 1%, and 2% w/w to assess dose-dependent effects.
  • Group 5: Combination treatments pairing 1% CM or 3% RHB with each KH level.
The selected amendment rates were based on prior studies [14] and aimed to reflect agronomically relevant applications without inducing phytotoxicity. Assuming incorporation into the top 15 cm of soil (bulk density = 1.3 g/cm3), the 0.5%, 1%, 2%, and 3% w/w rates equate to approximately 9.8, 19.5, 39, and 58.5 t/ha, respectively.
Approximately 400 g of soil was placed in square plastic containers (10.5 × 16.3 × 5.6 cm), and the corresponding amendments were thoroughly mixed into each unit. Soils were equilibrated for 24 h at room temperature prior to planting to minimize osmotic stress. Moisture was adjusted to 60 ± 10% water-filled pore space (WFPS) using deionized (DI) water. WFPS was calculated as:
W F P S = S W C 1 B D P D × 100
where WFPS is the percentage of water-filled pore space, SWC represents the volumetric soil water content (%v), BD is the bulk density of the soil (g/cm), and PD refers to the particle density, assumed to be 2.65 g/cm [15].
Sunflower sprout seeds (Chia Tai Produce Co., Ltd., Bangkok, Thailand) were sterilized with 2% v/v sodium hypochlorite, soaked for 24 h, and pre-germinated. Uniformly sprouted seeds (45 per pot) were sown at a depth of 1.5 cm and gently covered with the amended soil. Pots were labeled by treatment and replicate. The container design mirrored locally used planting trays but downsized for growth chamber compatibility—allowing for better control over environmental variables and enabling reproducible monitoring of treatment effects on short-cycle crops.
The experiment was conducted in a growth chamber (i250, Entech Associate Co., Ltd., Bangkok, Thailand) maintained at 25 °C with uniform lighting (LED Slim Set T5 Plant Grow 9W, Lamptan, Thailand; spectrum: 400–780 nm; 08:00–17:00 daily). Soil moisture was monitored gravimetrically and corrected with DI water via syringe when it dropped by more than 10%, avoiding over-saturation.
No additional fertilizers were applied to isolate the effects of the amendments. Seedlings germinated within 10 days. Soil and plant materials were harvested shortly thereafter for analysis of physical, chemical, and biochemical parameters. This controlled setup allowed for early detection of treatment-induced shifts in seed germination, soil respiration, and plant secondary metabolism, providing insights into short-term functional responses, though not underlying molecular mechanisms. All treatments were performed in triplicate.

2.3. Soil Quality Analysis

After harvesting the sunflower sprouts, soil from each treatment unit was divided into two subsamples. One portion was air-dried for seven days, passed through a 2 mm mesh sieve, and stored at room temperature in sealed Ziplock bags for physicochemical analysis. The second portion was immediately wet-sieved using a 2 mm mesh and stored at 4 °C to preserve biological integrity for soil respiration analysis. This dual-processing approach ensured that samples were appropriately prepared for their respective analytical procedures. All analyses were performed in triplicate to ensure data reliability.

2.3.1. Soil Texture

Soil texture was determined using a modified pipette method, as described by Kroetsch and Wang [16]. Ten grams of soil was treated with 10 mL of hydrogen peroxide and heated at 90 °C for 45 min to remove OM. To eliminate soluble salts, the sample was washed repeatedly, shaken with 20 mL of deionized water, and centrifuged at 4000 rpm for 5 min (Varispin 4, Novapro Co., Ltd., Seoul, Republic of Korea), and the supernatant was discarded—this was repeated five times. The treated soil was then dispersed with 10 mL of sodium metaphosphate and 50 mL of DI water and agitated overnight at 200 rpm. The suspension was passed through a 50 µm sieve into a 1000 mL graduated cylinder to collect the sand fraction, which was then dried at 105 °C for 24 h and weighed.
To determine the clay and silt fractions, the remaining suspension was diluted to a final volume of 1000 mL, stirred for 30 s, and left to settle for 5 h. A 25 mL aliquot was extracted at a specific depth based on temperature-dependent settling rates. The clay fraction was dried at 105 °C for 24 h and weighed. The proportions of sand, silt, and clay were calculated from the weights obtained, and the soil was classified accordingly.

2.3.2. pH and Electrical Conductivity

Soil pH and electrical conductivity (EC) were measured using a 1:2 soil-to-DI water ratio, following the method of Hendershot et al. [17]. A multifunction meter (model EX-9909, Chachoengsao, Thailand) was used to measure pH, EC, salinity, and total dissolved solids.

2.3.3. Organic Matter and Organic Carbon

OM content was determined using the loss-on-ignition (LOI) method, which also provides an estimate of OC, assuming that OM contains approximately 58% OC [18]. Two grams of air-dried soil (<2 mm) (W2) were weighed into a pre-weighed porcelain crucible (W1), combusted at 550 °C for 4 h in a muffle furnace (LT 3/11/B170, Nabertherm, Lilienthal/Bremen, Germany), cooled in a desiccator, and then reweighed (W3). The OM and OC contents were calculated using the following equations:
O r g a n i c   m a t t e r O M , % = W 2 ( W 3 W 1 ) W 2
O r g a n i c   c a r b o n O C , % = O M ( % ) × 0.58

2.3.4. Water-Stable Aggregates

Water-stable aggregate (WSA) stability was assessed using a modified wet-sieving method adapted from Smallholder Agriculture [19]. Fifty grams of air-dried soil was placed on a 2 mm sieve submerged in DI water and pre-soaked for 5 min. The sieve was manually agitated—lifted and lowered 50 times over 2 min—to simulate water-induced breakdown. The aggregates retained on the 2 mm sieve (>2 mm, macroaggregates, MaA) were collected, dried at 50 °C, and weighed.
The soil that passed through was transferred to a 250 μm sieve and processed using the same method to isolate mesoaggregates (250 μm–2 mm, MeA). The remaining fraction was dried to quantify microaggregates (<250 μm, MiA). The proportion of WSA for each class was calculated follows:
W S A i = W a W 0
where WSAi is the percentage of water-stable aggregates for each size class, Wa is the weight of aggregates remaining after sieving, and W0 is the initial dry weight of soil used for sieving.

2.3.5. Soil Respiration

Soil respiration was assessed using a modified method adapted from Page [20]. Frozen samples (−20 °C) were thawed for one hour prior to analysis. Approximately 25 g of soil was placed in aluminum cups inside airtight containers, along with a glass vial containing 20 mL of 1 N NaOH to absorb CO2. The containers were incubated at 25 °C for 24 h in a shaded area. A blank control containing only NaOH was also included.
Following incubation, NaOH vials were sealed and transported to the lab. CO2 absorbed in the NaOH was precipitated as BaCO3 using 8 mL of 3 N BaCl2. After 10 min, phenolphthalein was added, and the remaining NaOH was titrated with standard HCl. Microbial respiration was calculated from the difference in titration volume between control and treatment. CO2 evolution (mg CO2-C/kg/h) was computed using the following equation:
C O 2 C = ( B V ) N E T × W s
where CO2 − C (mg/kg/h) represents the microbial respiration rate, B is the volume of acid used for the control, V is the volume used for the treated sample, N is the acid normality, E is the equivalent weight of CO2 (22), T is the incubation time (h), and Wₛ is the mass of the soil sample (kg).

2.3.6. Nitrate, Available Phosphorus, and Available Potassium

Soil NO3, available P, and K were analyzed using procedures adapted from Motsara and Roy [18]. To extract NO3, 10 g of soil was mixed with 20 mL of 0.5 M K2SO4 and shaken for 30 min. The mixture was then centrifuged at 4000 rpm for 5 min, and the supernatant was passed through Whatman No. 5 filter paper (Cat No. 1005–110, Cytiva, Shanghai, China). The NO3 concentration in the filtrate was determined by reacting with 5% salicylic acid to produce a colorimetric compound, which was measured at 410 nm using a UV–Vis double-beam spectrophotometer (Lambda 365, PerkinElmer Ltd., Bangkok, Thailand).
Available P was quantified using the Olsen method. A 1.0 g soil sample was extracted with 20 mL of 0.5 M NaHCO3 and agitated on an orbital shaker (MS–NOR–30, Major Science, Saratoga, New York, USA) for 30 min. The extract was centrifuged at 4000 rpm for 5 min and filtered, and the P concentration was measured at 882 nm with a UV–Vis spectrophotometer.
To assess available K, 2.5 g of soil was treated with 25 mL of 1 M NH4C2H3O2 and shaken for 30 min. After filtration, the K content was measured using a flame photometer (AE–FP8201, A&E Lab (UK) Co., Ltd., London, UK) at a detection wavelength of 383 nm.

2.4. Plant Sampling and Measurements

Ten days after germination, the number of emerged sunflower sprouts was recorded. Seedlings were gently uprooted with intact root systems and rinsed first with tap water and then with DI water to remove residual soil. The cleaned sprouts were briefly air-dried at room temperature and stored in sealed Ziplock bags at 4 °C until analysis. All measurements were conducted in triplicate.
Details of the germination rate assessment and leaf area measurement methodology are provided in the Supplementary Materials (Sections S1 and S2, respectively).

2.4.1. Root-to-Shoot Ratio

The lengths of both shoots and roots were measured for 24 sunflower sprouts per pot using a ruler, with values recorded in centimeters (cm). These measurements were used to compute the root-to-shoot (R/S) ratio, following Equation (6):
R o o t t o s h o o t   r a t i o = R o o t   l e n g t h   ( c m ) S h o o t   l e n g t h   ( c m )
Following measurement, shoots and roots were separated using scissors and weighed to obtain their fresh biomass. The root samples were then oven-dried at 60 °C for 72 h to determine dry biomass. The shoot portions were retained for subsequent analysis of TPC, DPPH antioxidant capacity, and total chlorophyll, as outlined in the following sections.

2.4.2. Total Phenolic Content

After cleaning, sunflower sprouts were separated into parts and ground into a fine powder. Extraction of lipophilic and hydrophilic compounds followed a modified method from Deng et al. [21]. For lipophilic compounds, 0.5 g of powder was mixed with 5 mL of tetrahydrofuran, incubated in a shaking water bath (37 °C, 30 min), and centrifuged at 4200 rpm for 30 min. The supernatant was collected. This step was repeated with another 5 mL of solvent, and both supernatants were pooled.
The residue was then extracted twice using 5 mL of a methanol–acetic acid–water solution (50:3.7:46.3, v/v/v) under the same conditions. The combined supernatants formed the hydrophilic extract. All extracts were stored at −20 °C and analyzed within 24 h to preserve compound stability.
TPC was determined using the Folin–Ciocalteu colorimetric assay with modifications from Deng et al. [21]. A 0.5 mL extract aliquot was mixed with 2.5 mL of diluted Folin–Ciocalteu reagent (1:10). After 4 min, 2 mL of saturated sodium carbonate was added, and the mixture was incubated in the dark at room temperature for 2 h. Absorbance was recorded at 760 nm using a UV–Vis spectrophotometer (Shimadzu, Kyoto, Japan). Gallic acid was used as the standard, and results were expressed in mg gallic acid equivalents (mg GAE) per 100 g fresh weight (FW). Total TPC was the sum of both extract fractions.

2.4.3. DPPH Antioxidant Activity

Antioxidant activity was evaluated using the 1,1-diphenyl-2-picrylhydrazyl (DPPH) radical scavenging assay as described by Ghafoor et al. [22], with slight modifications. A 1 mL aliquot of extract was mixed with 2 mL of DPPH solution, vortexed, and incubated in the dark at room temperature for 30 min. Absorbance was measured at 517 nm using a UV-1240 mini-UV–Vis spectrophotometer.
The antioxidant capacity was calculated using the following equation:
D P P H = C T r o l o x V e x t r a c t m s a m p l e   10
where CTrolox refers to the Trolox-equivalent concentration determined from the calibration curve (µmol/mL), Vextract is volume of extract used (mL), and msample is the weight of the sample used for extraction (g). The multiplication factor of 10 standardizes the value per 10 g of FW. The total antioxidant capacity was calculated as the sum of activities from both the hydrophilic and lipophilic extract fractions.

2.4.4. Total Chlorophyll Content

Chlorophyll content was assessed using a modified protocol from Barua et al. [23]. Approximately 1 g of fresh leaf tissue was chopped, homogenized with 20 mL of 80% acetone, and centrifuged at 5000 rpm for 5 min. The supernatant was filtered through Whatman No. 1 filter paper into a 100 mL volumetric flask. The residue was re-extracted with an additional 20 mL of 80% acetone. This cycle was repeated until the residue appeared colorless. All filtrates were pooled, and the final volume was adjusted to 100 mL with 80% acetone. Absorbance was measured at 645 nm and 663 nm using a Shimadzu UV–Vis spectrophotometer. Total chlorophyll content (mg/100 g FW) was calculated using:
T o t a l   c h l o r o p h y l l = 20.2 O D 645 + 8.02 O D 663 V 1000 × W × 100
where OD represents absorbance values at the respective wavelengths, V is the total volume of the chlorophyll extract (mL), and W is fresh weight of tissue extracted (g). A factor of 100 was applied to scale the result per 100 g of tissue.

2.5. Statistical Analyses

Statistical analyses were performed using R (RStudio v2022.02.1). One-way ANOVA models were fitted using the aov() function to evaluate treatment effects on individual variables. Prior to analysis, model assumptions were verified: normality of residuals was confirmed via the Shapiro–Wilk test and visual inspections (histograms, Q-Q plots), and homogeneity of variance was assessed using Levene’s test. Estimated marginal means and pairwise comparisons (Tukey-adjusted) were computed with the emmeans() package, and significance groupings were visualized using cld(). Pearson correlation analysis was conducted with the cor() and cor.mtest() functions at a 95% confidence level.
For correlation analysis, the mean values of measured variables were calculated across the three replicates for each treatment. These treatment-level means (n = 9) were used in Pearson correlation analyses, yielding degrees of freedom (df) = 7. Correlation coefficients and associated p-values were calculated using the cor() and cor.mtest() functions at a 95% confidence level. Correlation matrices were visualized with the corrplot package, displaying only statistically significant (p < 0.05) relationships in the lower triangle. These analyses support treatment comparisons and relationships among variables but are not intended to infer causal or mechanistic pathways due to the study’s applied, factorial design.

3. Results and Discussion

3.1. Soil Aggregation and Physicochemical Properties

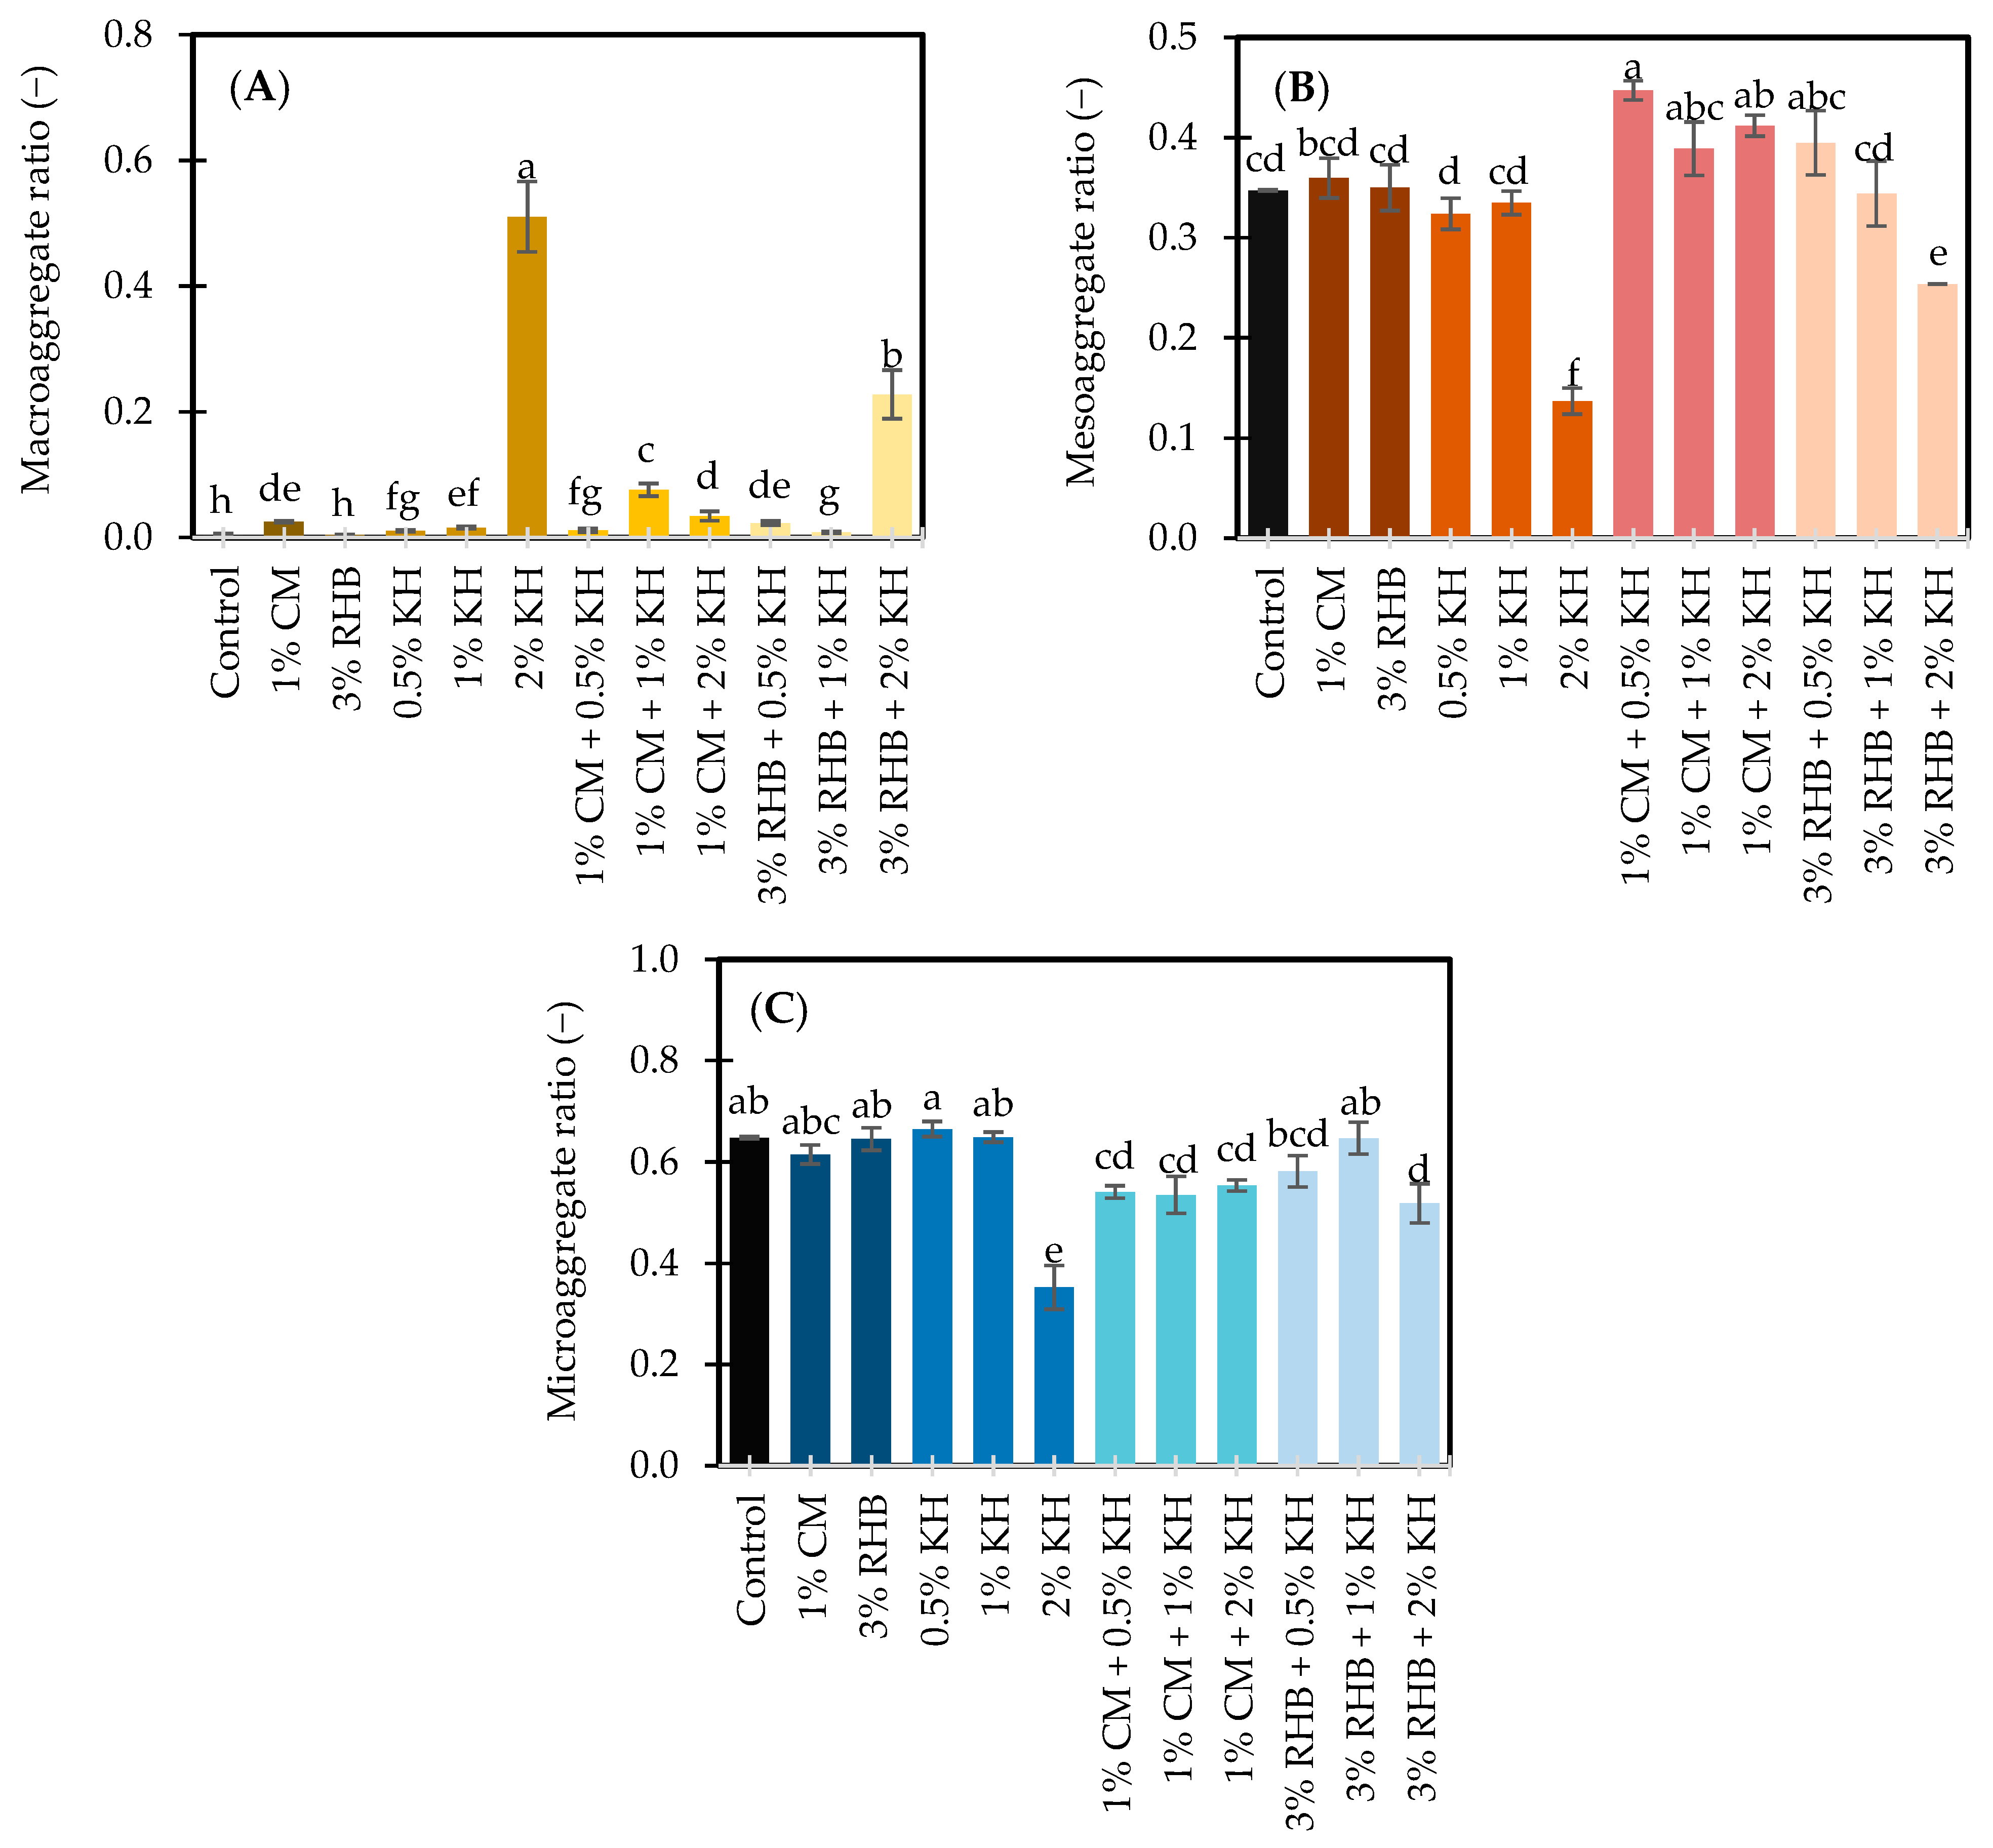
3.1.1. Soil Aggregation in Response to Treatments

Although improvements in soil aggregation were observed, the short experimental duration may limit the ability to draw reliable long-term conclusions regarding soil structural stability. These results should be interpreted as initial responses to the applied treatments rather than definitive evidence of sustained aggregate formation.
Soil aggregation, including MaA, MeA, and MiA, was significantly influenced by the type and combination of amendments applied (Figure 1A–C). In the control treatment, MaA was 0.00, MeA was 0.35, and MiA was 0.65, serving as baseline values. The 2% KH treatment resulted in the highest MaA ratio (0.51), followed by the combination of 3% w/w RHB + 2% w/w KH (0.23) (Figure 1A), indicating that higher KH concentrations strongly promote MaA formation. This effect is likely attributable to the high content of humic substances in KH, which enhances inter-particle bonding and stimulates microbial production of extracellular polymeric substances (EPS)—both of which are crucial drivers of aggregate development [8]. However, excessive KH may also lead to over-flocculation, producing larger aggregate clumps that alter aggregate size distribution [7].
CM also increased MaA formation, likely due to its high OM content and labile carbon fraction, which fuels microbial activity and the secretion of organic binding agents such as polysaccharides and microbial exudates [24]. These compounds act as natural cementing agents that stabilize soil particles. Previous research has demonstrated that organic manure improves MaA more effectively than inorganic fertilizers, largely due to its role in enhancing microbial biomass and providing bioavailable carbon and nutrients [25,26].
A synergistic effect was observed in the 3% w/w RHB + 2% w/w KH treatment, where biochar contributed a porous structure and a long-lasting carbon source to support microbial colonization, while KH supplied soluble organic molecules and cations that facilitated microbially mediated aggregation and organic cementation processes [5].
MeA formation was highest in the 1% w/w CM + 0.5% w/w KH treatment (0.45), representing a 28.6% increase over the control (Figure 1B). This result suggests that a balanced combination of organic inputs (from CM) and humic compounds (from KH) promotes MeA stability by stimulating microbial communities and preserving particulate OM [24]. In contrast, the 2% w/w KH treatment alone resulted in the lowest MeA (0.14), likely due to over-flocculation or an imbalance in ionic interactions, which may have shifted the distribution of aggregates toward larger MaA or destabilized intermediate structures [11].
MiA was highest under the 0.5% w/w KH treatment (0.67), followed by 3% w/w RHB and 1% w/w KH (both at 0.65) (Figure 1C). These results indicate that moderate levels of KH and RHB support MiA formation, possibly through enhanced microbial activity and the supply of organic binding agents derived from root exudates and microbial by-products [25]. Conversely, significant reductions in MiA were observed in high-KH treatments, particularly 2% w/w KH alone (0.35; a 46.2% decrease) and 3% w/w RHB + 2% w/w KH (0.52; a 20% decrease). These negative effects may be attributed to over-flocculation, the disruption of fine particle networks, or salt accumulation that interferes with microbial activity and aggregate cohesion [27]. Additionally, combining CM with high KH concentrations (e.g., 1% w/w CM + 2% w/w KH) further reduced MiA, possibly due to excessive organic loading or cation saturation, which may overwhelm the soil’s capacity to maintain stable microaggregate structures.

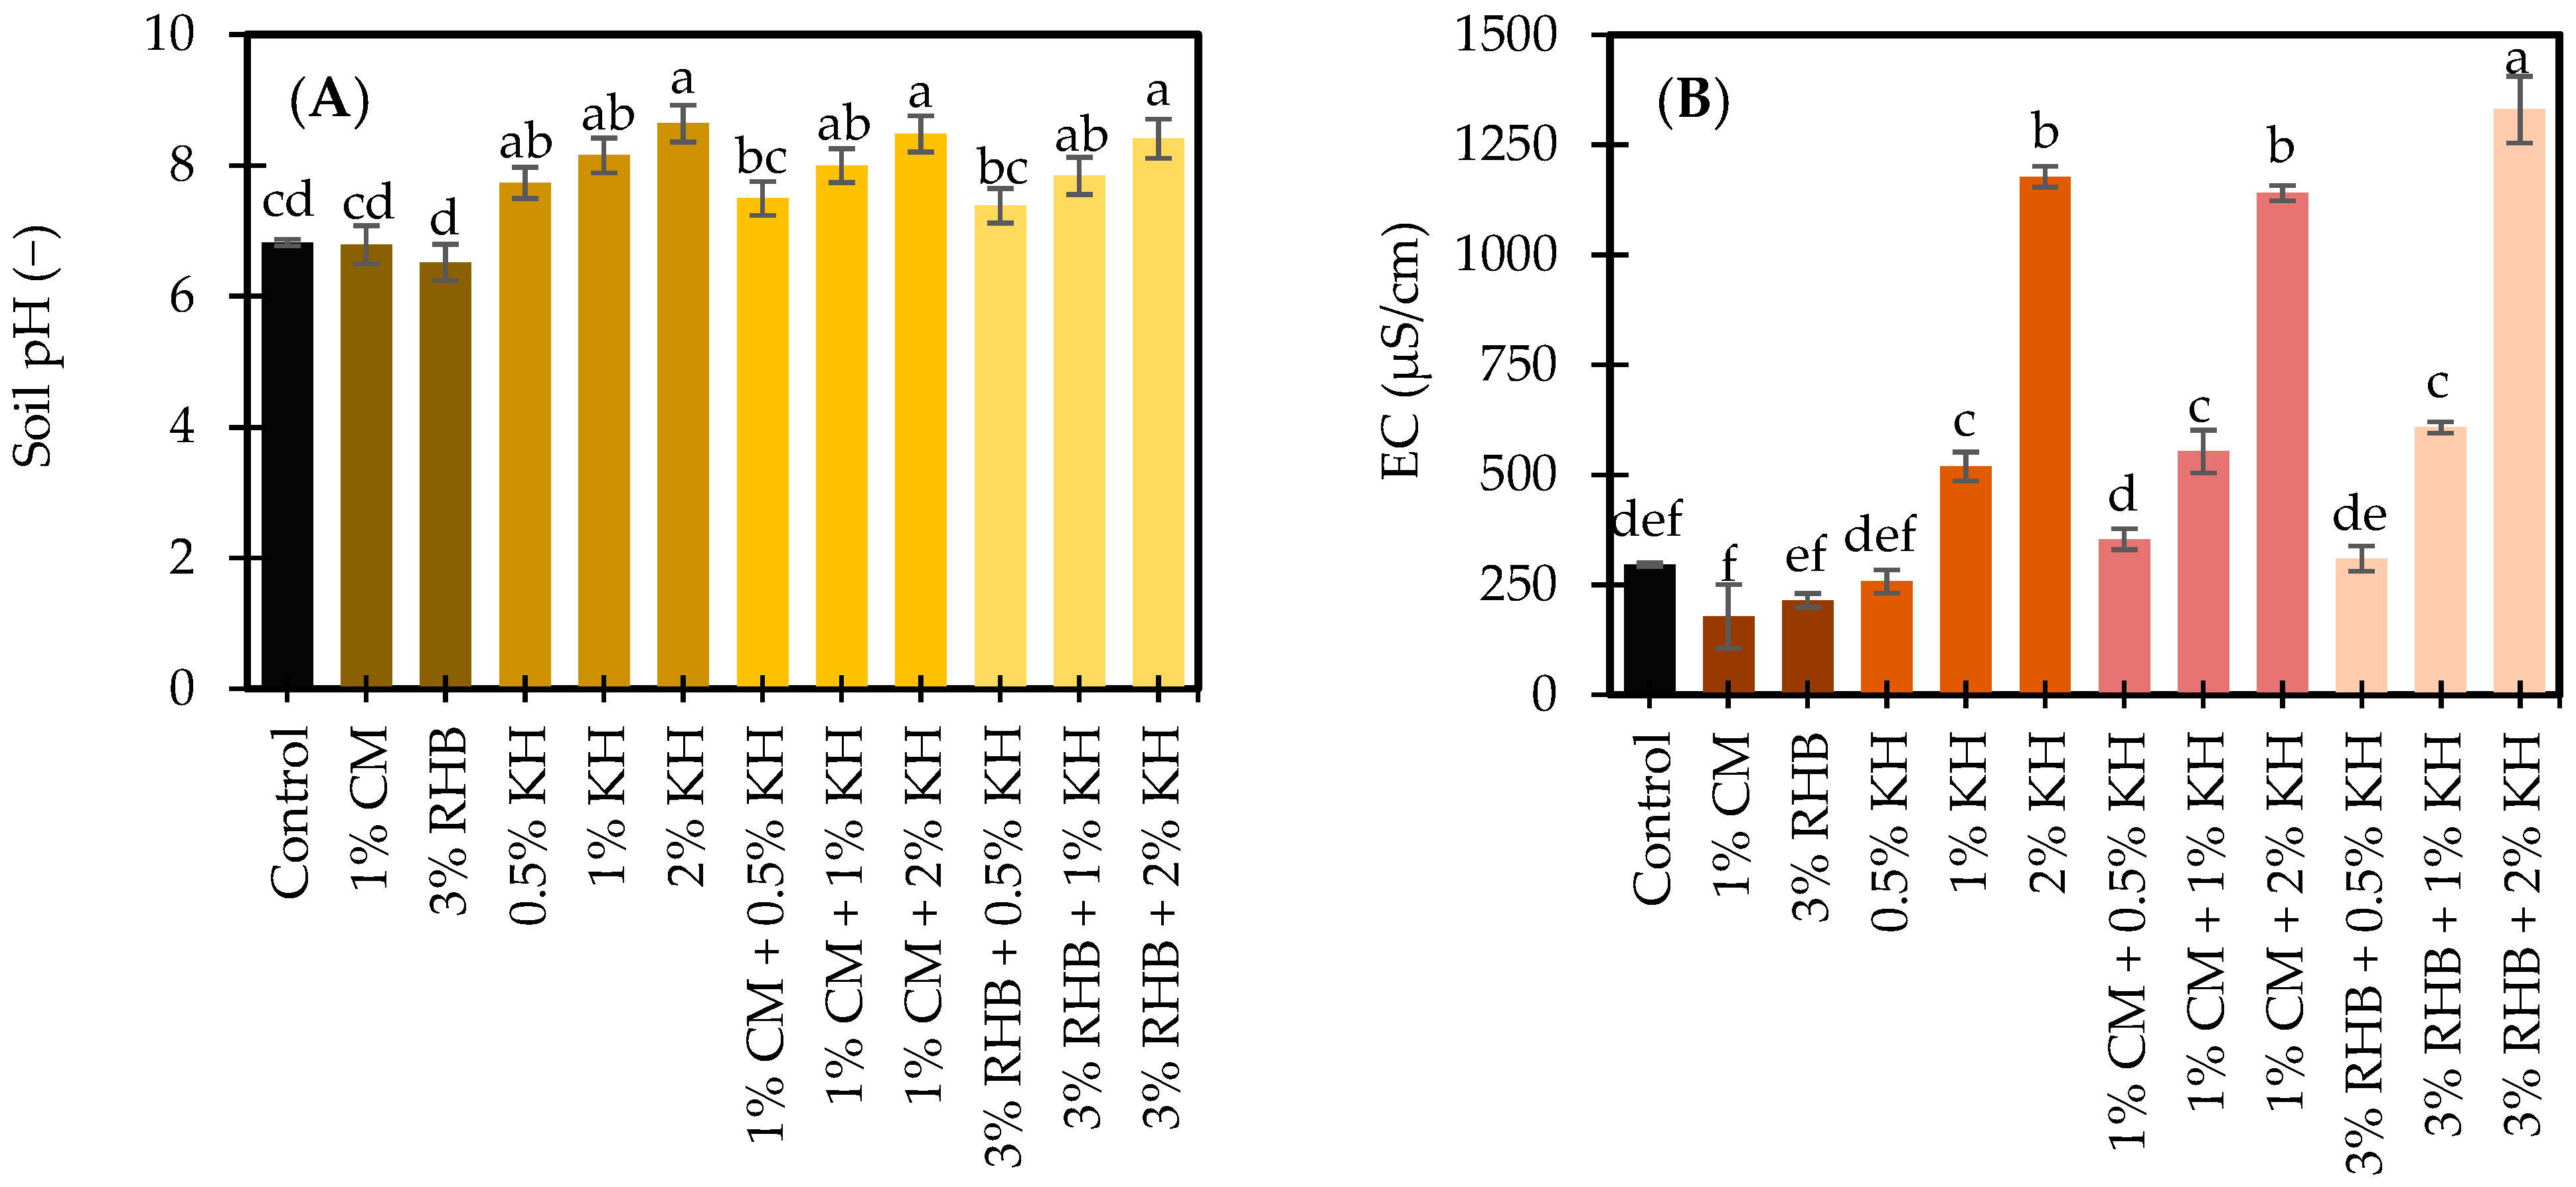
3.1.2. pH and Electrical Conductivity in Response to Treatments

The soil pH (Figure 2A) and electrical conductivity (EC; Figure 2B) were significantly influenced by the type and combination of soil amendments applied. The control treatment showed a baseline pH of 6.8. Application of 2% w/w KH yielded the highest soil pH at 8.6, followed by 3% RHB + 2% KH (8.4) and 1% KH (8.2). All KH-based treatments, whether applied individually or in combination with CM or RHB, elevated soil pH relative to the control, highlighting KH’s strong alkalizing effect. Even at the lowest application rate (0.5% w/w), KH raised the soil pH to 7.7. In contrast, CM and RHB alone had a minimal effect on pH, with values of 6.8 and 6.5, respectively.
The observed pH increase following KH application is attributed to its alkaline nature and the presence of functional groups such as carboxyl and phenolic groups that can neutralize acidity by exchanging H+ ions [28]. KH also supplies potassium ions (K+), which replace exchangeable H+ and Al3+ on soil colloids, thereby reducing soil acidity [28]. Additionally, KH promotes the formation of bicarbonate ions (HCO3) during dissolution, which buffer the soil and further neutralize excess protons [29].
Although CM had an initial pH of 8.7 (Table 1), its application (1% w/w) did not significantly alter soil pH. This is likely due to the buffering capacity of OM, which contains both acidic (e.g., NH4+) and basic (e.g., Ca2+, Mg2+) components that counterbalance each other, maintaining pH near neutrality. Previous studies have reported similar buffering effects of cow manure in neutral soils and its ability to increase pH only in acidic conditions [30].
RHB application did not significantly affect soil pH, which is consistent with the measured pH of the RHB used in this study (6.7)—notably lower than the typical values (>8.0) reported for rice husk biochar produced at 500 °C. This discrepancy may be attributed to the unique characteristics of the silica-rich rice husk feedstock, leaching during storage, or variations in pyrolysis conditions. Recent studies have shown that RHB pH can vary widely, ranging from 7.0 to 11.2 depending on feedstock type, pyrolysis temperature, and duration [31]. These factors likely explain the limited effect of RHB on soil pH in this study, particularly since the baseline soil was already neutral. Although alkaline biochar has been shown to raise pH in acidic soils [32], its effect is generally minimal in neutral or calcareous soils, as observed here.
Regarding EC, the control treatment recorded a baseline value of 295.7 µS/cm (Figure 2B). The highest EC was observed in the 3% w/w RHB + 2% w/w KH treatment, which reached 1329.7 µS/cm—a 349.5% increase over the control. This was followed by 2% w/w KH (1177 µS/cm) and 1% w/w CM + 2% w/w KH (1140 µS/cm), corresponding to increases of 298.0% and 285.6%, respectively. Moderate increases were recorded in 1% w/w KH (+75.3%), 1% w/w CM + 1% w/w KH (+86.9%), and 3% w/w RHB + 1% w/w KH (+105.4%). In contrast, the 1% w/w CM and 3% w/w RHB treatments alone resulted in EC values of 178 µS/cm and 214.3 µS/cm, respectively, showing no significant deviation from the control.
The substantial increase in EC under KH-based treatments is attributed to KH’s high content of water-soluble ions, with an initial EC of 10.8 mS/cm (Table 1). The addition of KH, especially at higher concentrations, directly contributes to the accumulation of soluble salts in soil [30]. In contrast, the low EC of CM (1.6 mS/cm) and its modest application rate (1% w/w) were insufficient to significantly alter soil salinity. Supporting this, Van Dang et al. [30] reported that only higher CM application rates (e.g., 10 Mg/ha/year) significantly affected EC, with site-specific outcomes.
The non-significant effect of RHB on EC is similarly explained by its low intrinsic EC (0.1 mS/cm; Table 1). This result aligns with previous findings that biochar’s impact on EC depends heavily on its feedstock, ash content, and aging process. While some studies have shown that biochar can lower EC over time due to salt leaching or adsorption [33], others found that alkaline biochar with high EC increases soil EC, particularly in acidic soils [32]. Therefore, RHB’s limited influence on EC in this study is consistent with its measured properties and the near-neutral baseline soil.
These findings underscore the importance of carefully managing KH application rates. Although KH effectively enhances soil pH and nutrient availability, excessive use can elevate EC to levels that risk salt stress, thereby impairing plant growth [34]. Optimizing KH at low-to-moderate doses can mitigate these risks and support soil health improvements without inducing toxicity or nutrient imbalances.

3.1.3. Soil Organic Carbon in Response to Treatments

The SOC content was significantly affected by the type and combination of soil amendments applied (Figure 2C). The control treatment exhibited the lowest SOC level at 1.9%, which served as the baseline. The highest SOC content was observed in the treatment combining 1% w/w CM with 2% w/w KH, reaching 3.1%—a 62.9% increase over the control. This was followed by the 3% w/w RHB + 2% w/w KH treatment, which recorded a SOC value of 2.7% (a 45.0% increase). Additional treatments, including 2% w/w KH, 1% w/w CM, 1% w/w CM + 0.5% w/w KH, and 1% w/w CM + 1% w/w KH, also significantly enhanced SOC, with average increases of approximately 34–35% compared to the control.
The notable increase in SOC from the 1% CM + 2% KH treatment is likely due to the complementary effects of both amendments. CM is rich in OM (Table 1), which contributes directly to the soil carbon pool and stimulates microbial activity [35]. This microbial stimulation enhances the decomposition of organic inputs and leads to the production of extracellular polysaccharides, glomalin, and other microbial byproducts that promote soil aggregation and protect OC from mineralization [24].
KH, on the other hand, is a concentrated source of humic substances that not only supply additional OC but also stabilize SOC through chemical interactions with minerals. These humic compounds enhance the formation of organo–mineral complexes, reduce microbial mineralization rates, and further support microbial activity [36]. The combination of labile carbon from CM and chemically stable compounds from KH results in both short-term enrichment and long-term stabilization of SOC. This synergy explains why this treatment yielded the highest SOC content.
Similarly, the treatment with 3% RHB + 2% KH resulted in elevated SOC levels. Although the OC content of the RHB used in this study (8.1%) is lower than the commonly referenced threshold of >55% for high-carbon biochar, this can be attributed to the silica-rich nature of rice husks, which dilutes carbon concentration. RHBs generally contain high ash and low fixed carbon content, particularly when derived from small-scale, practical pyrolysis systems [37]. Nevertheless, despite its lower carbon content and resistance to microbial degradation, RHB contributes significantly to soil improvement by enhancing structure through its high porosity and surface area, while serving as a long-term carbon reservoir [38,39]. Additionally, it offers surfaces for organic molecule adsorption and promotes microbial colonization, indirectly contributing to SOC stabilization. When combined with KH, the physical protection offered by RHB complements the chemical stabilization provided by KH, resulting in enhanced SOC retention.
Despite these benefits, the application of 2% KH alone or in combination with CM or RHB can increase soil pH and EC. These changes may negatively impact nutrient availability and increase salinity, which could affect plant health. Therefore, while higher KH rates are effective in promoting SOC accumulation, careful management is required to avoid potential adverse effects on soil chemistry and crop performance. Balancing the carbon input, stabilization potential, and soil chemical conditions is essential for maximizing the benefits of organic amendments on SOC.

3.1.4. Soil Respiration in Response to Treatments

Soil respiration rates varied considerably among the different amendment treatments, indicating distinct levels of microbial and root activity in response to each application (Figure 2D). The control treatment exhibited a baseline respiration rate of 19.2 mg CO2-C/kg/h. The highest soil respiration was recorded in the treatment with 1% w/w CM combined with 2% w/w KH, reaching 30.0 mg CO2-C/kg/h—a 56.4% increase compared to the control. Treatments with 1% w/w CM, 1% w/w CM + 0.5% w/w KH, and 1% w/w CM + 1% w/w KH also showed substantial increases, averaging 27.3 mg CO2-C/kg/h, equivalent to a 42.4% increase. These findings suggest a synergistic effect between CM and KH in enhancing microbial respiration.
The pronounced increase in soil respiration with CM application aligns with previous studies [40], which attribute the effect to its high levels of labile OC and nutrient content. These inputs stimulate nutrient cycling processes, microbial growth, and enzyme production [41,42]. CM has also been shown to activate hydrolytic enzymes such as cellobiohydrolase and acetylglucosaminidase, along with genes related to the carbon cycle [40]. Additionally, CM improves inorganic nitrogen availability [43], which further stimulates microbial respiration. When combined with KH, the amendment contributes to enhanced microbial metabolism by functioning as an electron shuttle and promoting enzymatic activity. Humic substances in KH are known to stimulate both oxidative and hydrolytic enzymes involved in OM decomposition, including cellulase, dehydrogenase, and β-glucosidase [40]. Although microbial community composition and enzyme activities were not directly measured in this study, the elevated CO2 efflux observed in the CM + KH treatment aligns with previously reported functional responses to similar organic amendment combinations [44].
In contrast, treatments with KH alone at 1% and 2% w/w led to reductions in soil respiration by 18.8% and 30.8%, respectively, relative to the control. While low-dose KH (0.5% w/w) slightly increased respiration, higher rates appeared to inhibit microbial activity. This suppression is likely due to the stabilization of SOC through the formation of organo–mineral complexes that limit substrate availability for microbes [45]. Additionally, high KH concentrations may cause excessive soil aggregation, physically restricting microbial access to carbon sources. Similar declines in soil respiration following high humate applications have been reported in paddy and wetland soils, emphasizing the dose-dependent nature of KH’s effects on microbial dynamics [46].
A moderate increase in soil respiration was observed in treatments with RHB and its combinations with KH, averaging 22.4 mg CO2-C/kg/h (a 16.7% increase over the control). RHB is known to improve microbial habitats through its porous structure and to enhance nutrient retention, supporting microbial growth over time [42,47]. When combined with KH, RHB may mitigate the negative effects of high KH rates by buffering pH, improving soil aeration, and facilitating substrate access. This interaction explains the relatively higher respiration rates in RHB + KH treatments compared to KH alone. However, the effects depend heavily on dosage and application ratio; for instance, Holatko et al. [48] reported reduced respiration when RHB was applied with low doses of humate. These outcomes underscore the importance of balancing labile and stable carbon inputs to optimize microbial responses and soil carbon mineralization.

3.1.5. Nitrate, Available Phosphorus, and Available Potassium in Response to Treatments

The concentrations of soil NO3 (Figure 3A), available P (Figure 3B), and available K (Figure 3C) varied considerably across the different soil amendment treatments. In the control treatment, baseline values were recorded at 33.5 mg/kg for NO3, 27.6 mg/kg for available P, and 479.6 mg/kg for available K. While several treatments significantly altered NO3 and available P levels, no statistically significant differences were observed in available K among treatments.
The most pronounced increase in soil NO3 concentration was observed in the 3% w/w RHB + 2% w/w KH treatment, which reached 73.8 mg/kg—an increase of approximately 120% compared to the control. The application of 2% w/w KH alone also significantly elevated NO3 levels to 48.6 mg/kg, representing a 44.9% increase. A moderate increase was recorded in the 1% w/w CM + 2% w/w KH treatment, with an 18.5% rise. These increases can be attributed to the combined effects of nutrient supply and retention. KH serves as a direct source of nitrate (Table 1), while RHB improves soil structure, porosity, and moisture retention—factors that can reduce nitrogen losses and enhance NO3 availability. Although RHB is known to reduce NO3 leaching and denitrification, in this study, soil moisture was maintained at approximately 60% WFPS, which limits the likelihood of leaching or anaerobic losses. Therefore, the observed increases in NO3 levels are more likely due to improved nutrient retention, gradual NO3 release, microbial immobilization, and plant uptake dynamics. These findings align with those of Kumar and Singh [49], who also reported elevated NO3 concentrations in KH-amended soils under conditions that minimized denitrification.
In contrast, several treatments resulted in substantial reductions in NO3 levels. These included 0.5% w/w KH (−73.5%), 1% w/w KH (−64.8%), 1% w/w CM (−60.0%), 3% w/w RHB + 0.5% w/w KH (−48.7%), 1% w/w CM + 1% w/w KH (−42.2%), 1% w/w CM + 0.5% w/w KH (−41.8%), and 3% w/w RHB (−39.1%). The reductions may be attributed to increased microbial immobilization and plant uptake of NO3. CM serves as a source of OM that enhances microbial growth, which in turn immobilizes nitrate within microbial biomass [50]. Additionally, RHB has a relatively low NO3 content (Table 1) and can adsorb NO3 ions, thereby reducing their availability in the soil solution [51].
Lower doses of KH (0.5–1% w/w) also led to NO3 depletion, likely because they supplied insufficient NO3 to counterbalance microbial immobilization or plant uptake. Moreover, KH has been reported to stimulate root growth and nutrient absorption [52], further reducing soil NO3 levels by enhancing plant uptake. This interpretation is supported by El-Naqma [53], who observed reductions in available soil N, P, and K alongside increased plant nutrient uptake following KH application.
The highest increase in available P was observed in the treatment with 1% w/w CM + 0.5% w/w KH, which reached 37.4 mg/kg—representing a 35.5% increase compared to the control (Figure 3B). This was followed by the 1% w/w CM + 2% w/w KH (27.2% increase) and 1% w/w CM + 1% w/w KH (9.7% increase) treatments, indicating a clear synergistic effect between CM and KH in enhancing P availability. This synergy is likely due to the complementary mechanisms of both amendments: CM provides a rich source of organic P, offering both readily available and slowly mineralized forms [54], while KH promotes the mobilization of bound P through chelation and the release of organic acids that inhibit P fixation and enhance solubility [55]. Additionally, CM may stimulate microbial activity, which further facilitates the mineralization of organic P. Together, these mechanisms contribute to the improved availability of soil P. Similar effects have been reported by Abdelkader [56], although the magnitude of response varied depending on the application rate and seasonal conditions.
In contrast, treatments involving RHB alone, low rates of KH, and their combinations led to significant declines in available P. For example, applications of 0.5% w/w KH, 1% w/w KH, and 3% w/w RHB resulted in reductions of 66.6%, 55.6%, and 42.5%, respectively. These decreases may be attributed to the adsorption of phosphate ions onto the biochar surface or the formation of insoluble phosphate compounds in the soil. Biochar, particularly when derived from certain feedstocks and produced at high temperatures, contains functional groups with a strong affinity for anionic species like phosphate [57]. This tendency is especially pronounced in the short term, while long-term studies have shown more variable outcomes, ranging from neutral to positive effects on P availability [58]. Moreover, in the absence of sufficient KH, the phosphate retained by biochar may not be readily solubilized or available for plant uptake [59].
KH may also promote plant root growth and nutrient uptake efficiency [60], potentially reducing available soil P due to enhanced uptake by plants. The combination of RHB and KH, which resulted in a 45.7% reduction in available P, likely reflects both the sorptive properties of biochar and the plant uptake-stimulating effects of KH. This finding underscores the importance of carefully balancing amendment dosages to avoid unintended antagonistic interactions.
Unlike NO3 and P, available K levels exhibited only modest changes across treatments (Figure 3C). The most notable increase was observed in the 3% w/w RHB + 1% w/w KH treatment, which recorded the highest available K concentration. This enhancement is likely the result of a synergistic effect between RHB’s high cation exchange capacity and the K contribution from KH [61]. However, the majority of treatments showed minimal changes in available K, suggesting that much of the added K was rapidly taken up by plants or temporarily held in soil exchange sites. This indicates that K dynamics in this system are more strongly influenced by plant uptake and short-term nutrient cycling than by long-term retention or release from soil amendments [62].

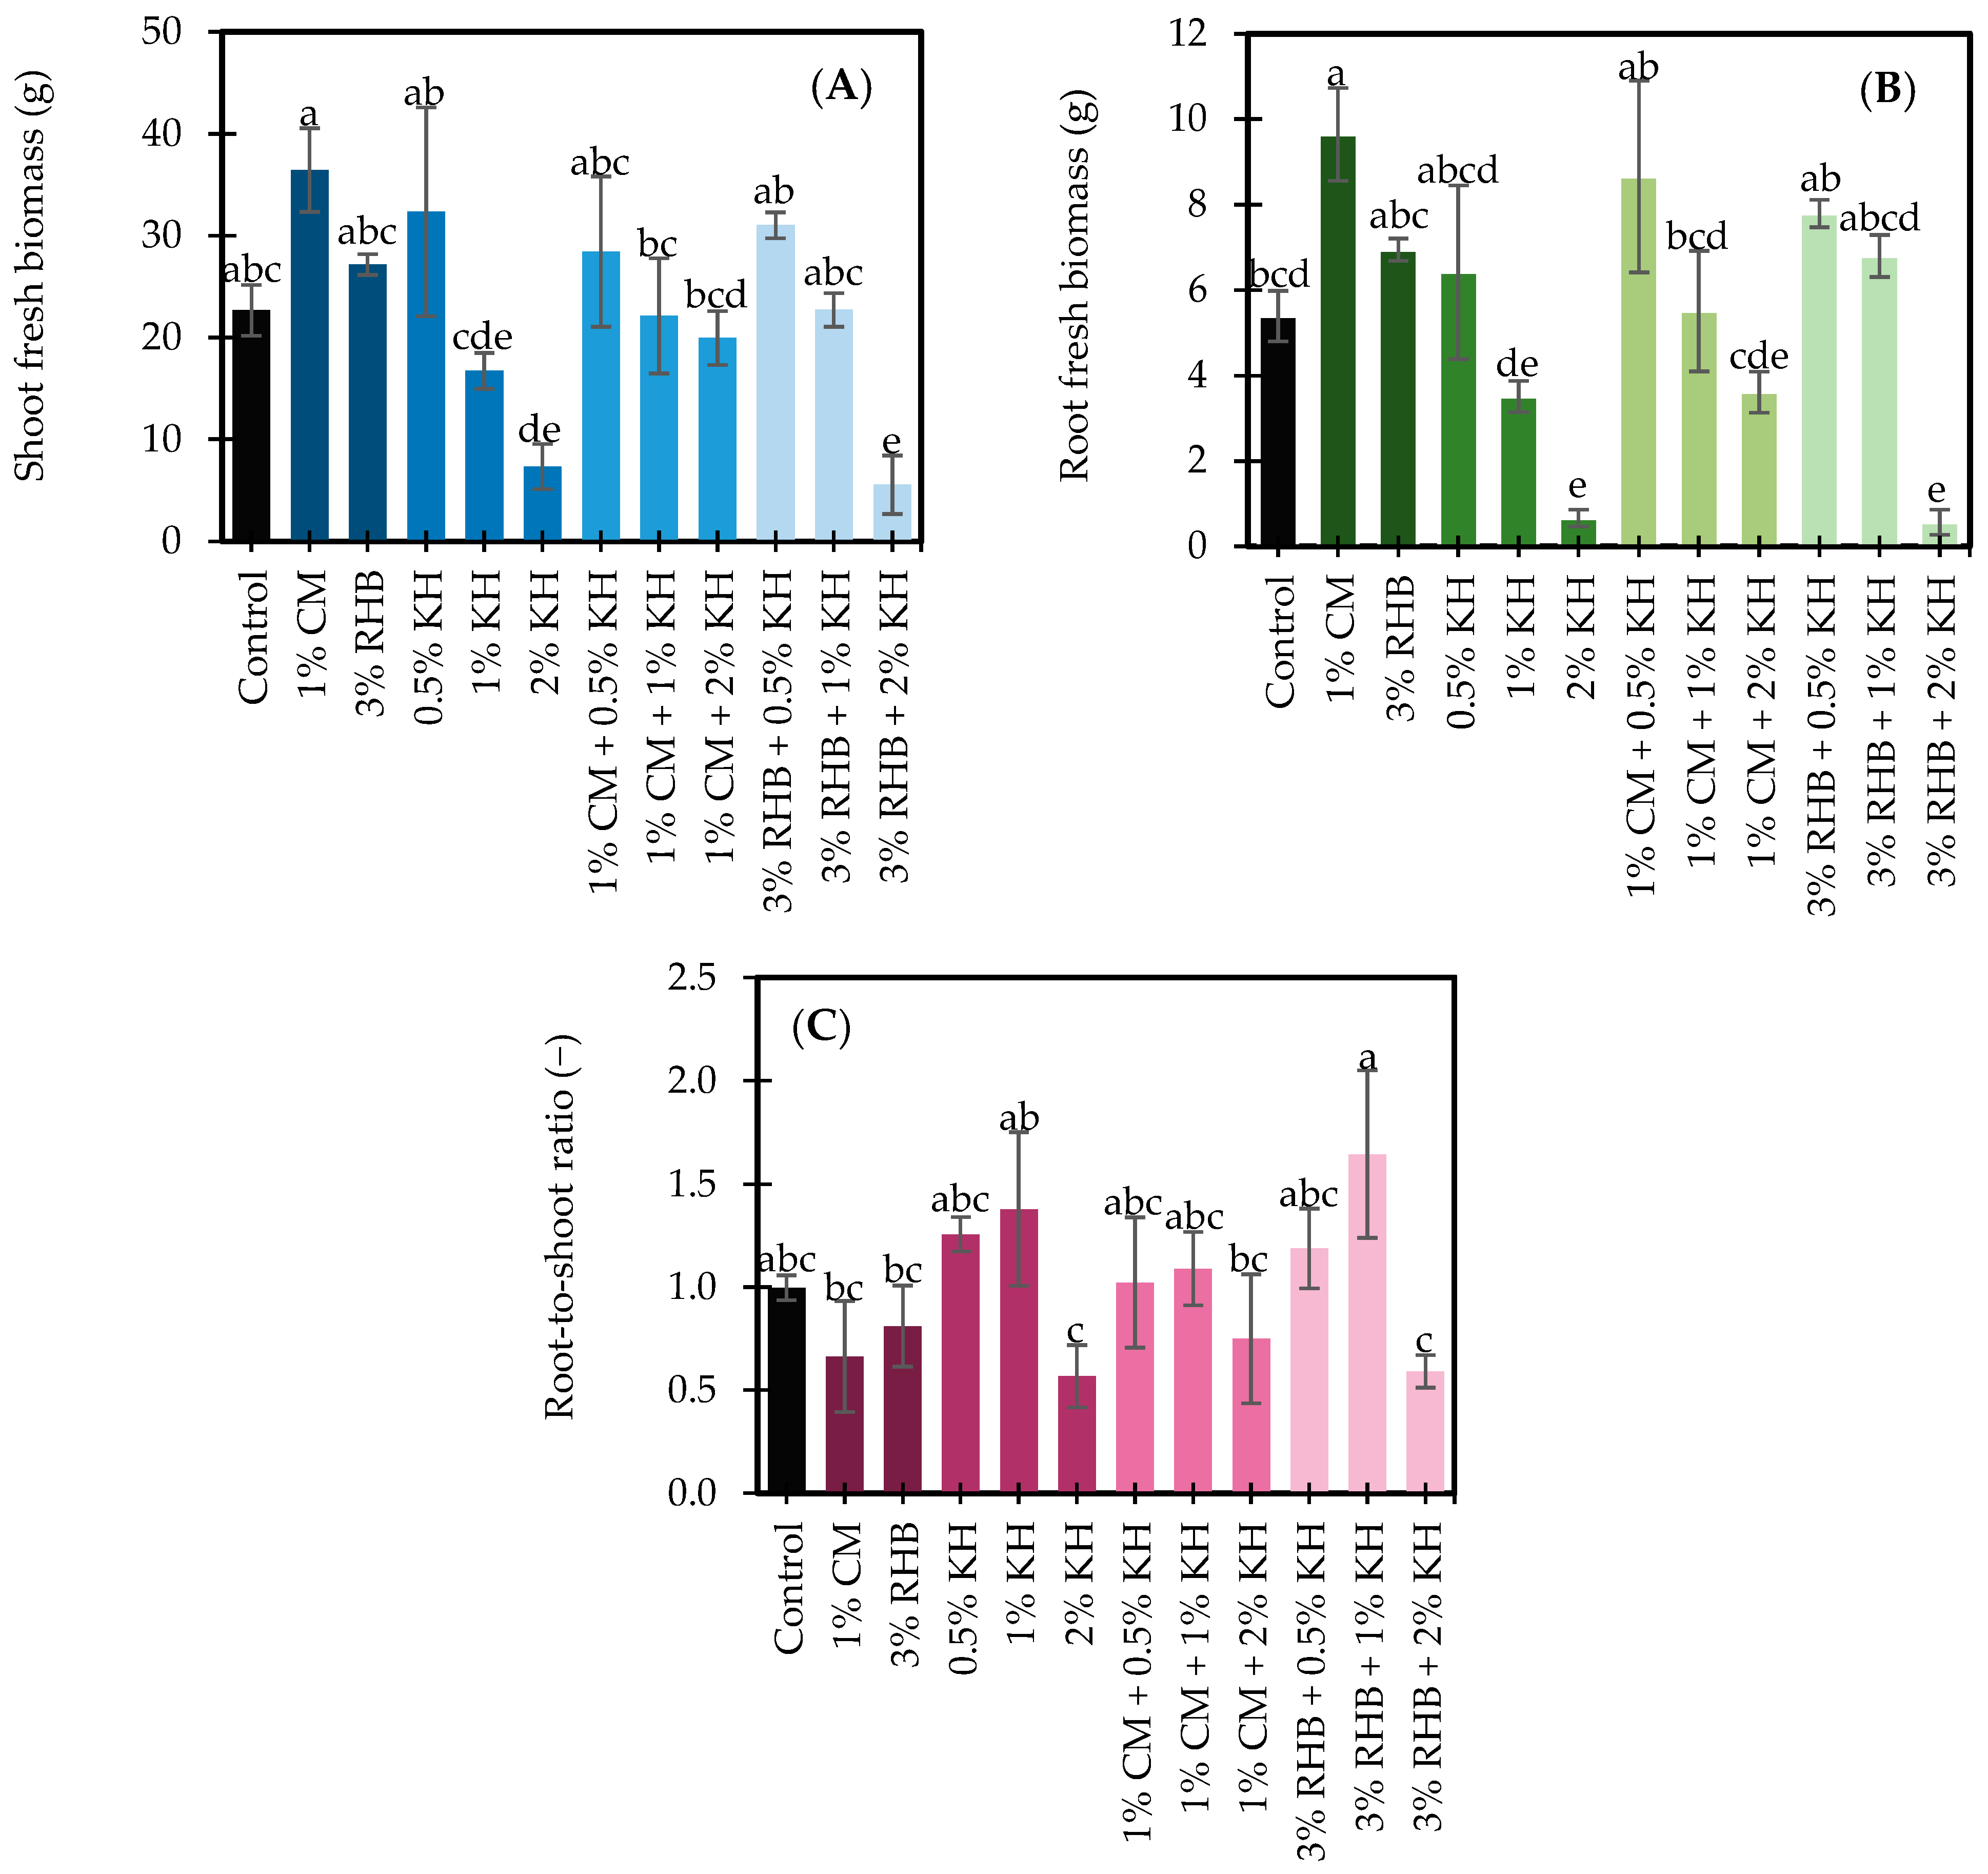
3.2. Development Traits and Biomass Distribution in Sunflower Sprouts

Detailed results on the effects of treatments on germination rate and average total leaf area per sprout, along with supporting discussion and references, are provided in the Supplementary Materials (Sections S1 and S2, respectively). In the main text, only plant biomass and root-to-shoot ratio in response to treatments are presented.
The shoot and root biomass, along with the R/S ratio of sunflower sprouts, were significantly influenced by the type and combination of soil amendments applied (Figure 4A–C). The control treatment recorded a shoot biomass of 22.7 g and a root biomass of 5.4 g, with an R/S ratio of 1.0, serving as the baseline for comparison.
Among all treatments, the application of 1% w/w CM resulted in the highest shoot (36.4 g) and root biomass (9.7 g), representing increases of 60.8% and 79.0%, respectively, compared to the control. However, the R/S ratio in this treatment decreased by 44%, indicating a greater allocation of biomass to shoots than to roots. Similar trends were observed in treatments with 0.5% w/w KH and combinations such as 1% w/w CM + 0.5% w/w KH and 3% w/w RHB + 0.5% w/w KH. These treatments enhanced shoot and root biomass by 25–43% and 19–61%, respectively, while maintaining or slightly improving the R/S ratio. These outcomes suggest that such combinations support balanced vegetative growth by improving nutrient uptake and creating favorable physiological conditions.
The observed improvements can be attributed to the individual and synergistic effects of CM, RHB, and moderate levels of KH. CM contributes to increased plant growth by enhancing soil fertility, physical structure (Section 3.1.1), and microbial activity (Section 3.1.4). Likewise, RHB improves soil aeration, WHC, and nutrient retention [8], supporting both root and shoot development. These findings are supported by previous studies. Zhang et al. [63] demonstrated that organic manure stimulates soil enzyme activity and improves nutrient availability, leading to increased root growth in cotton. Ibrahim et al. [64] and Yang et al. [65] also reported enhanced root length and density in wheat and rice following farm manure applications. Furthermore, several studies have documented the positive effects of biochar on root development [66].
When combined with moderate KH levels, the benefits are further amplified. KH has been reported to enhance nutrient uptake efficiency and stimulate plant metabolic activity [67], which together foster optimal conditions for both root development and shoot expansion. The relatively stable R/S ratios observed in these treatments reflect efficient biomass partitioning and overall plant vigor. In addition, the increase in root biomass under low KH levels aligns with findings by Nemeata et al. [68] and Rose et al. [69], who reported enhanced root weights following the application of humic substances. Similarly, Malik et al. [70] observed improved root proliferation in response to rice–straw biochar and humic acid treatments.
In contrast, high KH concentrations (2% w/w) had a markedly negative impact on plant biomass. The 2% w/w KH treatment alone reduced shoot biomass by 67.6% and root biomass by 87.8% compared to the control. The combination of 3% w/w RHB + 2% w/w KH yielded the lowest shoot (5.6 g) and root (0.6 g) biomass values, representing reductions of 75.5% and 89.4%, respectively. These treatments also exhibited notably low R/S ratios, indicating impaired root development and strong stress responses, likely induced by osmotic stress, nutrient imbalances, or ionic toxicity, similar to effects observed in citrus crops [71]. Notably, the presence of biochar was insufficient to mitigate the negative impact of excessive KH, highlighting the risk of over-application.
Interestingly, the 1% w/w KH treatment alone, while reducing shoot and root biomass by 26.2% and 34.9%, respectively, produced the highest R/S ratio of 1.9—an 88% increase compared to the control. This shift suggests a greater allocation of biomass to root growth under mild stress conditions. In a controlled pot experiment with uniform soil mixing, this response may reflect a physiological adaptation to elevated KH concentrations. Mild osmotic stress or altered hormonal signaling (e.g., increased auxin or abscisic acid activity) could have favored root development over shoot growth. Humic substances are known to influence plant hormone balance and root architecture depending on concentration [72]. Although the total biomass was reduced, the elevated R/S ratio indicates a potential strategic adjustment that may enhance the plant’s future capacity for nutrient and water uptake.

3.3. Secondary Metabolites in Sunflower Sprouts

In this study, the effects of 2% w/w KH on bioactive compounds were not investigated due to significantly reduced germination rates (Supplementary Materials Section S1) at this concentration, which resulted in insufficient plant material for analysis.

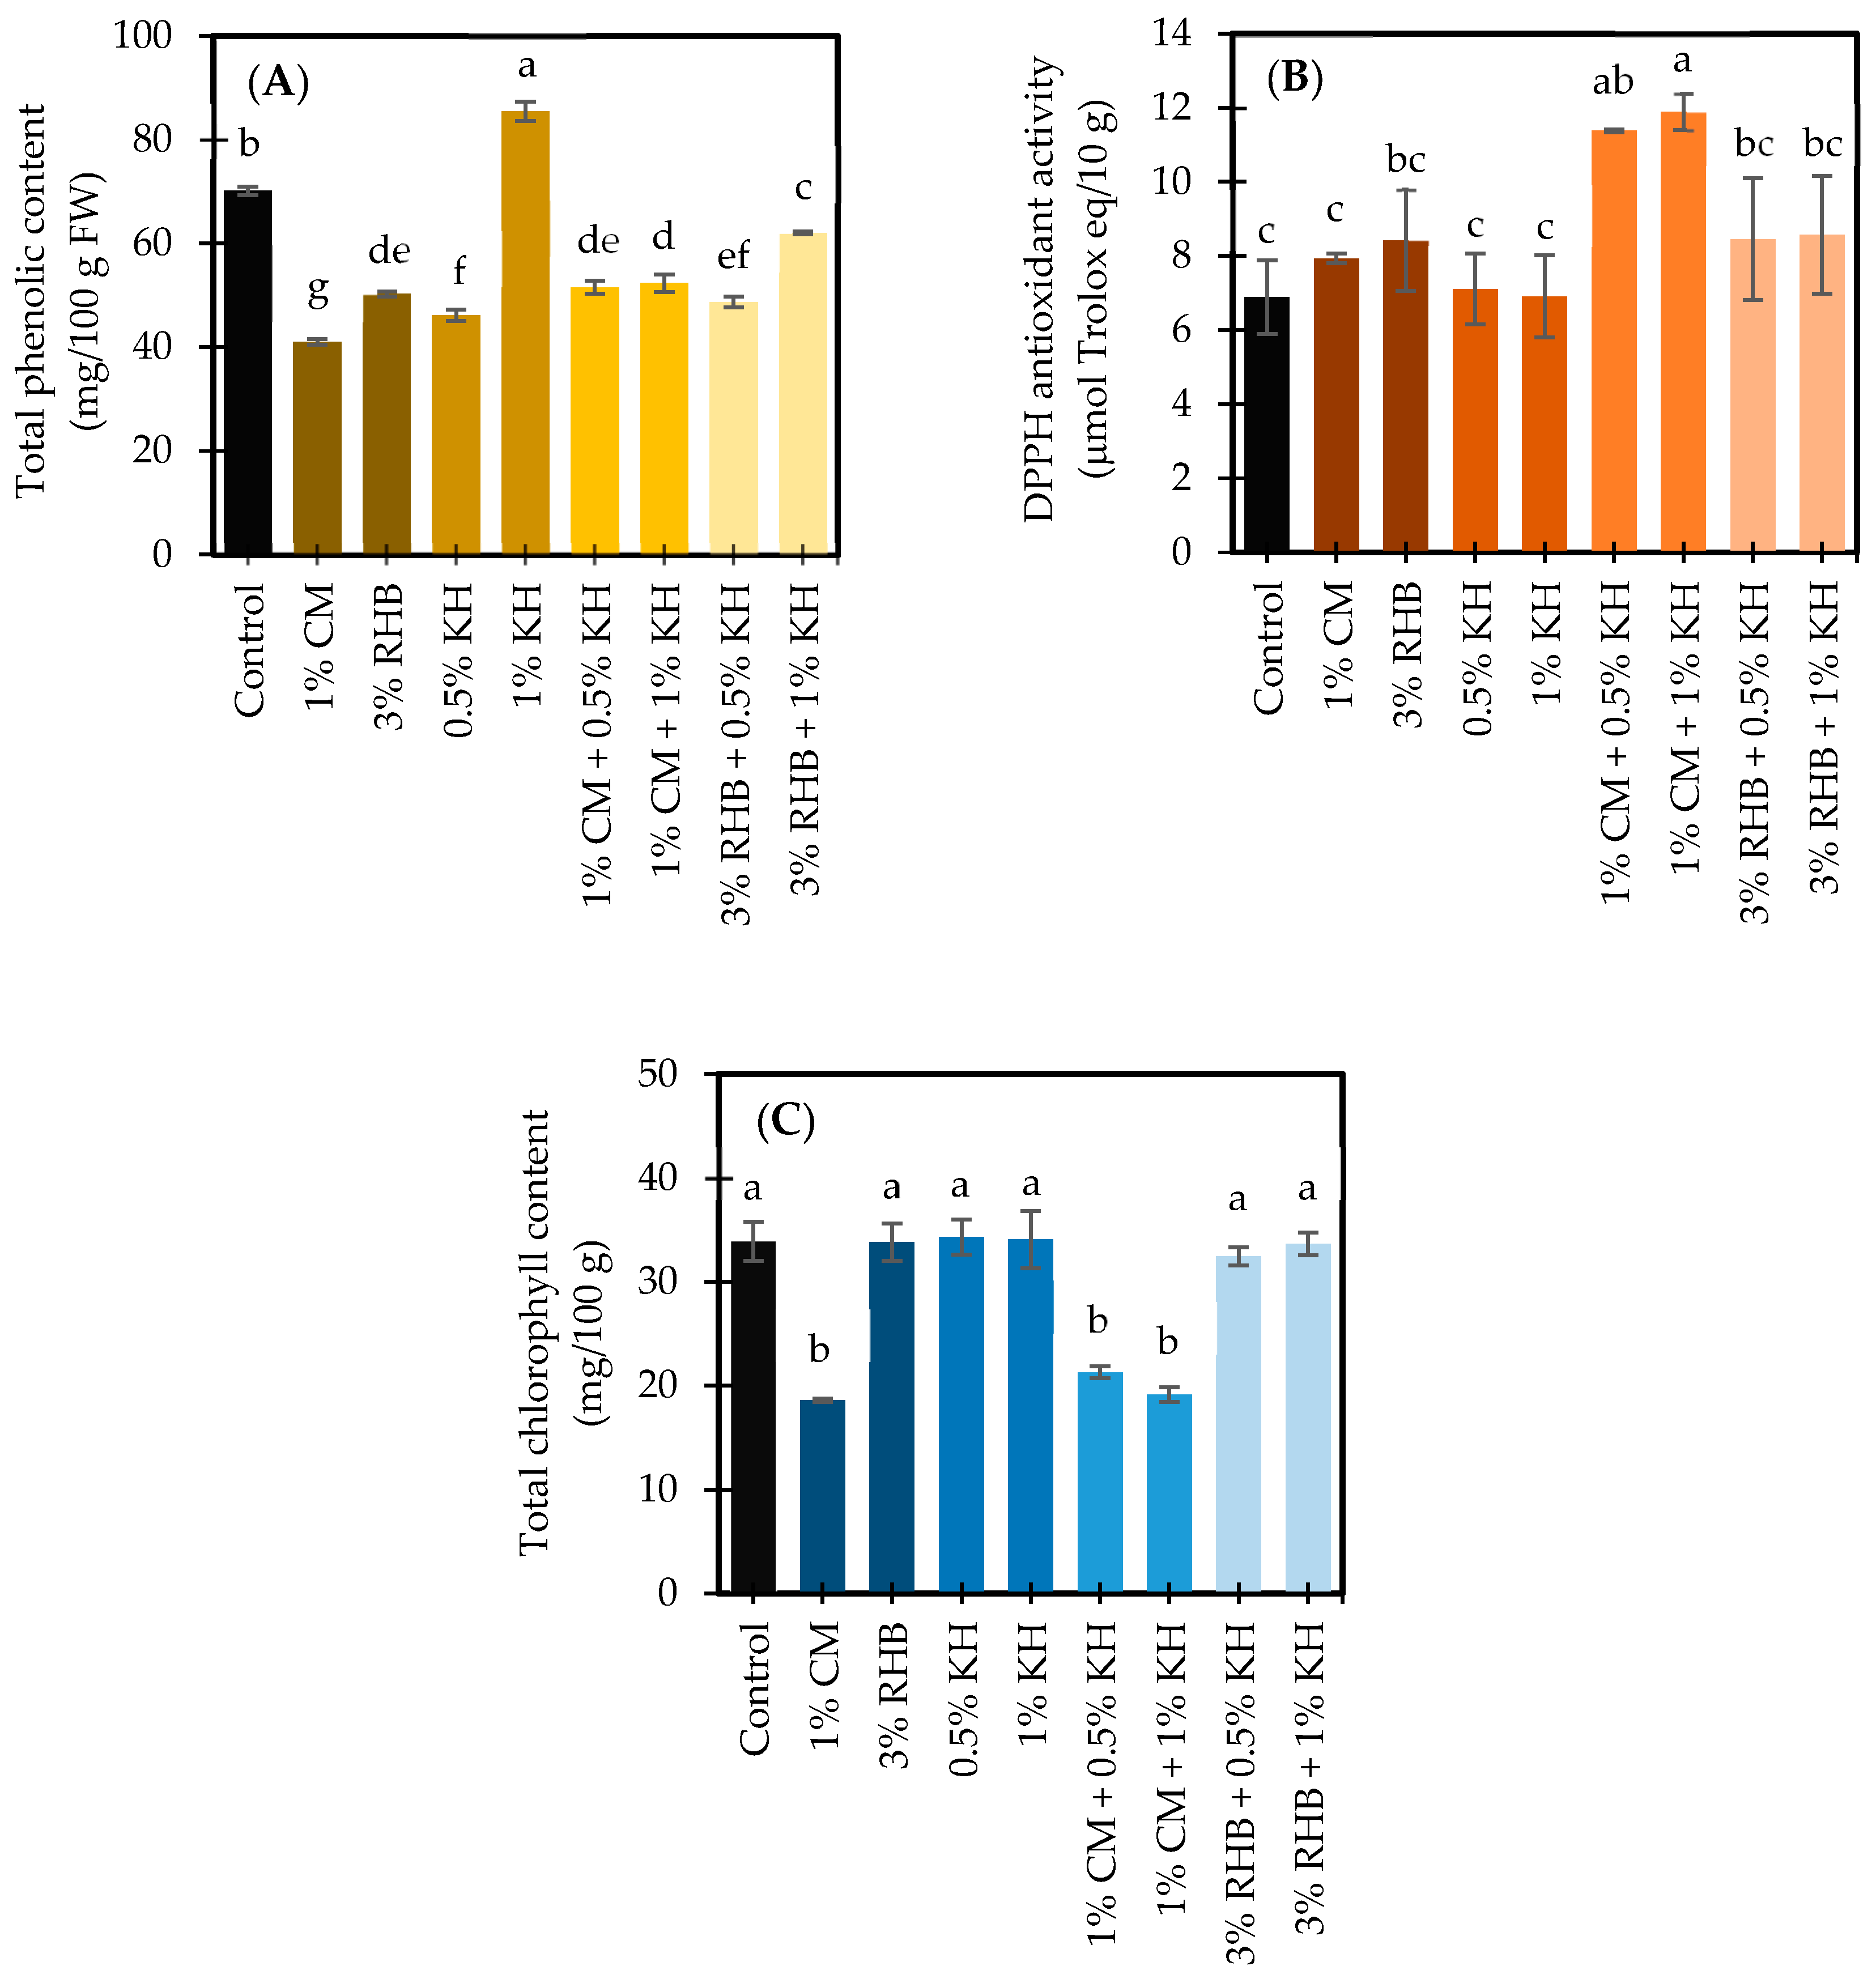
3.3.1. Total Phenolic Content in Response to Treatments

The TPC of sunflower sprouts varied significantly among different soil amendments (Figure 5A). The highest TPC was observed in sprouts grown exclusively with 1% w/w KH, reaching 85.5 mg/100 g FW, representing a 21.9% increase compared to the control (70.1 mg/100 g FW). Although several studies have investigated physiological mechanisms influenced by KH, direct evidence regarding its specific effects on TPC is limited. The increased TPC observed following KH application may result from its ability to enhance the activity of antioxidant enzymes such as catalase (CAT), peroxidase (POD), and superoxide dismutase (SOD). These enzymes mitigate oxidative stress [10] and potentially regulate phenolic biosynthesis pathways. Additionally, KH may enhance nutrient uptake and photosynthetic efficiency, improving plant growth and resilience [10]. Such improvements likely create optimal conditions that promote phenolic compound accumulation, underscoring the beneficial impact of KH on the biochemical composition of plants.
In contrast, all other treatments exhibited significantly lower TPC compared to the control (Figure 5A). The lowest TPC value was recorded in sprouts grown with 1% w/w CM, yielding 41.0 mg/100 g FW, representing a 41.5% decrease compared to the control. Similarly, treatments with 3% w/w RHB, treatments with 0.5% w/w KH, and combined amendments such as 1% w/w CM + 0.5% w/w KH, 1% w/w CM + 1% w/w KH, and 3% w/w RHB + 0.5% w/w KH also resulted in TPC reductions ranging approximately from 25% to 34%. Among these combined amendments, the treatment with 3% w/w RHB + 1% w/w KH showed the smallest reduction (11.6%) relative to the control.
These reductions may reflect the alleviation of stress conditions provided by the amendments. Organic amendments like CM typically enrich the soil with essential nutrients, particularly nitrogen, promoting rapid vegetative growth and thereby decreasing oxidative stress in plants. Lower stress levels reduce the metabolic necessity for plants to produce phenolic compounds as defensive antioxidants [73]. Additionally, when nitrogen availability is high, phenylalanine—a key precursor in the phenylpropanoid pathway—tends to be preferentially directed toward protein synthesis rather than secondary metabolite production, potentially explaining the reduced phenolic accumulation observed in manure-treated plants [74]. A short cropping cycle might also influence phenolic accumulation, as demonstrated by Thepsilvisut et al. [75] in white mugwort, where chicken manure application increased TPC only after multiple harvesting cycles.
Similarly, the findings from Tu et al. [76] and Wang et al. [77] indicate that biochar addition significantly enhances antioxidant enzyme activities, such as SOD, while concurrently reducing oxidative stress markers like malondialdehyde (MDA), hydrogen peroxide (H2O2), and superoxide radicals (O2) in tomato and Malus hupehensis Rehd. seedlings, respectively. Typically, phenolic compounds are synthesized by plants as a response to oxidative stress to mitigate cellular damage. Thus, when oxidative stress is effectively reduced through increased antioxidant enzyme activity, plants may exhibit less metabolic need to synthesize phenolic compounds. Consistent with these findings, the intermediate phenolic content observed in sunflower sprouts treated with 3% w/w RHB combined with 1% w/w KH suggests a beneficial interaction between these amendments. This synergistic effect may result from biochar’s capacity to enhance soil physical properties, such as moisture retention and aeration, complemented by KH’s role in improving nutrient uptake and overall metabolic efficiency. Consequently, this combination appears to create optimal conditions, balancing stress alleviation and moderate phenolic accumulation.

3.3.2. DPPH Antioxidant Activity in Response to Treatments

The DPPH radical scavenging activity of sunflower sprouts varied significantly across different soil amendment treatments (Figure 5B). The highest antioxidant activity was observed in sprouts grown with the combined amendment of 1% w/w CM + 1% w/w KH, reaching 11.9 µmol Trolox eq/10 g, representing a substantial increase of 72.6% compared to the control (6.9 µmol Trolox eq/10 g). This result was statistically superior to all other treatments. Similarly, the 1% w/w CM + 0.5% w/w KH treatment significantly enhanced antioxidant activity to 11.4 µmol Trolox eq/10 g, marking a 65.2% increase relative to the control. In contrast, single amendments—including 1% w/w CM, 0.5% w/w KH, and 1% w/w KH—resulted in minor and statistically insignificant improvements in DPPH radical scavenging activity, showing increases ranging from only 0.3% to 15.1% compared to the control. Sprouts treated with 3% RHB exhibited a moderate but statistically significant increase of 22.2%. Biochar-based combined treatments (3% w/w RHB + 0.5% w/w KH and 3% w/w RHB + 1% w/w KH) showed intermediate antioxidant activities, with increases of approximately 22.6% and 24.4%, respectively, though these values were statistically comparable to the control.
The significant enhancement in antioxidant activity observed in combined treatments, particularly CM with KH, clearly demonstrates a synergistic interaction. This synergy results from complementary roles of these amendments: CM provides essential nutrients, notably nitrogen and micro-nutrients, that stimulate enzymatic activities and secondary metabolite pathways vital for antioxidant compound synthesis. Simultaneously, KH enhances the efficiency of nutrient uptake and activates antioxidant enzymes (such as SOD, CAT, and POD), thereby reducing oxidative stress in plant tissues [78]. Consequently, the combined application of CM and KH delivers benefits beyond those achievable with either amendment alone [79].
The moderate improvement in antioxidant activity observed with RHB-based amendments likely results from enhanced soil physical and chemical properties, including improved moisture retention, aeration, and nutrient availability. Such improvements in soil conditions indirectly promote plant growth and reduce stress, thus potentially increasing antioxidant capacity [80]. However, the relatively lower antioxidant activity compared to combined CM and KH treatments suggests that biochar has a limited direct effect on stimulating antioxidant biosynthesis.
Interestingly, the KH treatment alone increased TPC without significantly enhancing DPPH radical scavenging activity. Although this finding might initially appear contradictory, it can be explained by differences in the antioxidant effectiveness of various phenolic compounds produced by plants. KH application stimulates the phenylpropanoid pathway, leading to increased phenolic accumulation; however, not all phenolic compounds possess strong radical-scavenging properties detectable by a DPPH assay. Some phenolics primarily serve structural or stress-signaling functions and contribute less directly to measurable antioxidant capacity [81]. Moreover, the KH-induced activation of antioxidant enzymes may reduce internal oxidative stress, thereby decreasing the plant’s metabolic demand for potent antioxidant phenolics. As a result, plants may accumulate larger amounts of phenolics with lower antioxidant potency, which could explain the observed increase in TPC without a corresponding rise in DPPH activity [82]. This underscores the complexity of phenolic biosynthesis and highlights the importance of evaluating both the quantity and the functional quality of phenolic compounds when assessing plant antioxidant responses to soil amendments.

3.3.3. Chlorophyll Content in Response to Treatments

The total chlorophyll content of sunflower sprouts varied significantly among the different soil amendments (Figure 5C). The highest chlorophyll levels were recorded in sprouts treated with 0.5% w/w KH (34.3 mg/100 g), 1% w/w KH (34.1 mg/100 g), and 3% w/w RHB (33.8 mg/100 g), all statistically similar to the control (33.9 mg/100 g). These treatments showed negligible changes, indicating that single applications of KH or RHB neither substantially increased nor reduced chlorophyll synthesis. In contrast, sprouts grown with 1% w/w CM alone exhibited the lowest chlorophyll content, significantly decreasing by 45.2% compared to the control (18.6 mg/100 g). Similarly, combined treatments involving CM and KH (1% w/w CM + 0.5% w/w KH and 1% w/w CM + 1% w/w KH) significantly reduced chlorophyll levels by 37.2% (21.3 mg/100 g) and 43.6% (19.1 mg/100 g), respectively. Biochar-based combinations (3% w/w RHB + 0.5% w/w KH and 3% w/w RHB + 1% w/w KH) resulted in minimal changes, decreasing chlorophyll content only slightly (approximately 0.7–4.2%), and these were not statistically different from the control.
Previous studies have shown that KH generally enhances chlorophyll synthesis by promoting nutrient uptake and activating antioxidant enzymes [82]. However, the minimal changes observed in this study suggest that the effects of KH on chlorophyll content may be context-dependent, influenced by factors such as plant species, soil conditions, or growth stage. The maintenance of chlorophyll content under RHB treatment alone or in combination with KH likely reflects biochar’s positive impact on soil physical properties, including improved moisture retention, aeration, and nutrient availability. Supporting evidence from Cong et al. [83] indicated that moderate rates of biochar significantly enhanced chlorophyll levels in maize, while Liu et al. [84] found similar effects in other crops, though outcomes varied with fertilizer combinations and growth stages.
In contrast, the marked reduction in chlorophyll content observed with CM, either alone or combined with KH, suggests potential nutrient imbalances or the over-supply of nitrogen, which may have disrupted photosynthetic processes. Sharma et al. [85] reported similar results in kiwifruit vines, where excessive manure application led to lower chlorophyll levels. Additionally, the short cropping cycle of sunflower sprouts may not have allowed sufficient time for CM’s benefits to manifest. This is supported by Thepsilvisut et al. [75], who found increased chlorophyll content in white mugwort only after extended periods of manure application. These findings highlight that while CM provides essential nutrients, its short-term effects on chlorophyll synthesis may be limited, particularly in fast-growing crops.

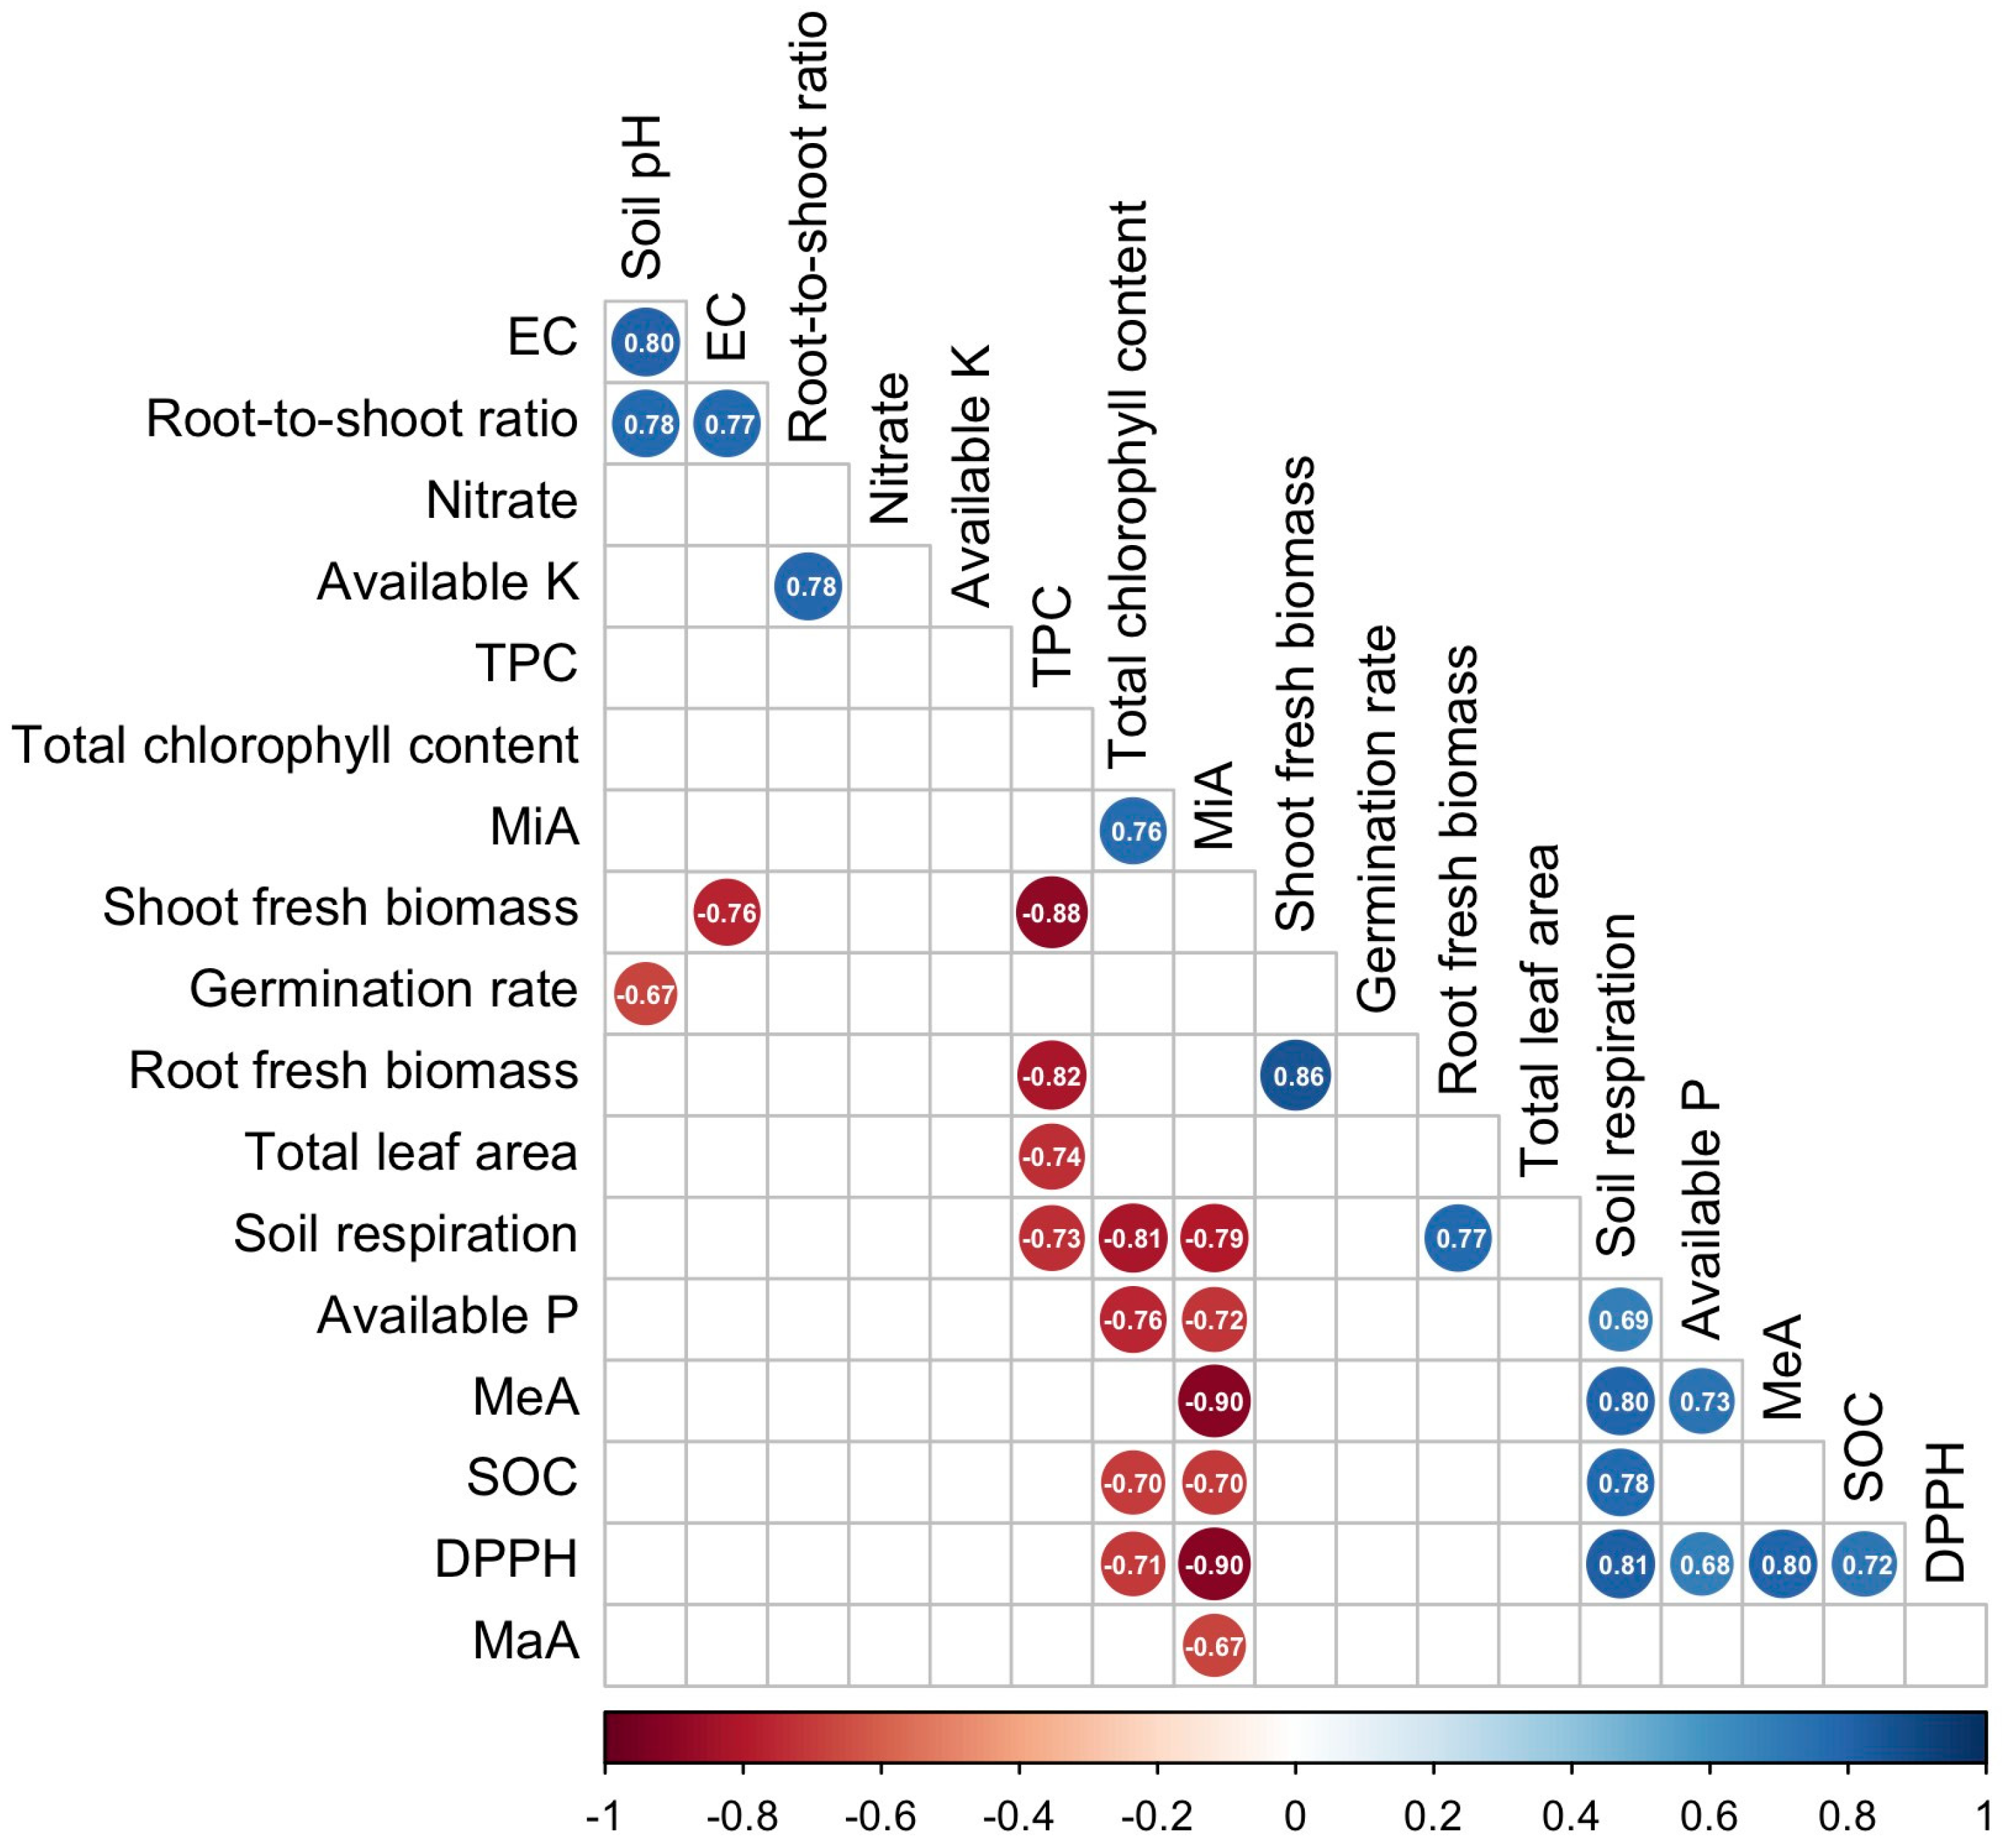
3.4. Correlation Analysis Among Soil Properties, Plant Traits, and Bioactive Compounds

A Pearson correlation analysis based on treatment-level means (n = 9) revealed several statistically significant relationships among soil properties, plant growth parameters, and bioactive compounds in sunflower sprouts (Figure 6). These correlations provide insight into how different soil and plant variables interact, reflecting both the biological and physicochemical dynamics of the soil–plant system.
Soil pH exhibited strong positive correlations with EC (r = 0.80) and the root-to-shoot ratio (r = 0.78). These relationships suggest that higher soil pH may enhance nutrient solubility and ionic mobility, promoting more favorable root development relative to shoot biomass. However, a moderate negative correlation was observed between soil pH and germination rate (r = −0.67), indicating that slightly more acidic conditions may favor seedling emergence. Similarly, EC showed a strong positive correlation with the root-to-shoot ratio (r = 0.77), underscoring the role of ion concentration in stimulating root growth. However, EC was negatively correlated with shoot fresh biomass (r = −0.76), suggesting that elevated salinity may impair shoot development despite supporting root allocation—a trend consistent with salt stress effects on plant physiology [86].
Soil aggregation characteristics also influenced plant and soil biological responses. MiA showed strong negative correlations with soil respiration (r = −0.79), available P (r = −0.72), MeA (r = −0.90), SOC (r = −0.70), DPPH radical scavenging activity (r = −0.90), and MaA (r = −0.67). These findings imply that high MiA proportions may restrict oxygen diffusion and microbial accessibility, thereby limiting nutrient availability and biochemical activity in the rhizosphere.
Soil respiration, an indicator of microbial activity, was strongly positively correlated with available P (r = 0.69), MeA (r = 0.80), SOC (r = 0.78), and DPPH activity (r = 0.81). These associations reinforce the central role of microbial respiration in driving nutrient mineralization, OM turnover, and antioxidant production potential. The positive correlations between available P and both MeA (r = 0.73) and DPPH (r = 0.69) highlight the interdependence of soil structure, nutrient status, and biochemical resilience.
In addition, SOC showed strong correlations with DPPH activity (r = 0.72), reflecting the role of OM in enhancing soil biochemical functioning. These interactions underscore the importance of maintaining aggregate stability and carbon-rich soils to support robust microbial and antioxidant activities.
A robust positive correlation between shoot and root fresh biomass (r = 0.86) confirms their close physiological linkage. Root biomass was also positively correlated with soil respiration (r = 0.77), reflecting the contribution of root exudates to microbial stimulation and rhizosphere dynamics. These results suggest that healthier root systems enhance microbial activity through increased carbon inputs. In contrast, several growth-related parameters were negatively associated with TPC. Specifically, TPC was inversely correlated with shoot biomass (r = −0.88), root biomass (r = −0.82), total leaf area (r = −0.74), and soil respiration (r = −0.73). These findings support the notion of a resource allocation trade-off, where plants under stress or nutrient-limited conditions divert energy from primary growth to the synthesis of secondary metabolites like phenolics [87].
Total chlorophyll content showed a positive correlation with MiA (r = 0.76), possibly indicating a compensatory mechanism in compacted soils. Although higher MiA typically indicates restricted porosity and gas exchange, plants may respond by boosting chlorophyll synthesis to sustain photosynthesis under stress. This aligns with findings that soil compaction can stimulate chlorophyll production as an adaptive response [88].
However, chlorophyll content exhibited strong negative correlations with soil respiration (r = −0.81), available P (r = −0.76), SOC (r = −0.70), and DPPH activity (r = −0.71). These inverse relationships suggest a decoupling between photosynthetic pigment accumulation and microbial or biochemical activity. Such patterns may reflect shifts in plant resource allocation under suboptimal soil conditions, where chlorophyll synthesis is prioritized despite limited microbial processes or nutrient cycling [89].
Collectively, these results provide a holistic view of the interconnected dynamics between soil structure, nutrient status, microbial activity, and plant physiological performance. The improvements observed in soil aggregation, respiration, and nutrient availability suggest that combining organic and humic-based amendments can enhance key indicators of soil functionality. These enhancements were closely associated with increased plant biomass and modulated levels of bioactive compounds, reflecting a balance between vegetative growth and secondary metabolite synthesis. The patterns observed imply that plants respond adaptively to varying soil conditions by reallocating metabolic resources, particularly under enhanced or constrained nutrient and microbial environments. These insights underscore the potential of integrated soil amendment strategies to simultaneously promote soil health and optimize crop quality in short-cycle systems, reinforcing the role of tailored organic inputs in sustainable agricultural practices.

4. Conclusions

This study provides mechanistic insights into how the combined application of CM, RHB, and KH influences soil function, plant growth, and biochemical traits in short-cycle cropping systems, using sunflower sprouts as a model. CM application enhanced shoot and root biomass, increased SOC, and stimulated soil respiration—likely driven by improved nutrient availability that supported microbial activity. RHB contributed to the stabilization of MeA and enhanced DPPH antioxidant capacity, indicating improved soil structure and moderated nutrient release. KH, when applied at low to moderate rates (0.5–1% w/w), promoted chlorophyll synthesis and leaf development. However, higher application levels (2% w/w) negatively affected biomass accumulation and microbial activity, possibly due to salinity-related stress, although salinity was not directly measured in this study.
The most notable improvements were observed when CM and KH were co-applied, particularly at 1% w/w CM combined with 0.5–1% w/w KH. This combination more effectively enhanced available P, SOC, microbial respiration, plant biomass, and DPPH antioxidant activity compared to individual treatments, suggesting synergistic interactions between the nutrient-enriching effects of CM and the bioactive, hormone-like properties of KH. These combinations likely stimulated the microbial turnover of organic inputs while simultaneously promoting plant growth and antioxidant capacity—an integrated soil–plant feedback mechanism rarely documented in previous research. PCA further supported these outcomes by revealing the distinct clustering of co-application treatments, aligned with improved soil biological activity, nutrient status, and plant biochemical responses. Altogether, the findings advance our understanding of how multifunctional organic amendments can be strategically combined to optimize both soil health and crop quality in rapid-growth cropping systems.
Although this experiment was conducted in a controlled pot setup with sandy loam soil, it lays the groundwork for field-scale strategies that integrate organic amendments with complementary functions. Future research should explore how these synergistic mechanisms perform under different soil textures, climate regimes, and crop types to develop scalable, site-specific solutions for climate-resilient and nutrient-enriched cropping systems.

Supplementary Materials

The following supporting information can be downloaded at https://www.mdpi.com/article/10.3390/agronomy15071651/s1, Figure S1: Effects of soil amendments on (A) germination rate and (B) total leaf area per sprout. Bars labeled with different letters (a–e) indicate statistically significant differences among treatments at p < 0.05.

Author Contributions

Funding acquisition, P.K.; methodology, T.R. and T.B.; formal analysis, T.R.; investigation, T.R. and P.U.; writing—original draft preparation, T.R. and P.U.; writing—review and editing, T.B. and P.K.; supervision, P.K. All authors have read and agreed to the published version of the manuscript.

Funding

This study was financially supported by the Fundamental Fund and the Targeted Research Fund, with additional support from Chiang Mai University. The postdoctoral fellowships awarded to Thidarat Rupngam and Patchimaporn Udomkun are gratefully acknowledged.

Data Availability Statement

The datasets used and/or analyzed during this current study are available from the corresponding author upon reasonable request.

Acknowledgments

We would like to acknowledge all support from Chiang Mai University.

Conflicts of Interest

Author Thirasant Boonupara was employed by the company Living Soil Co., Ltd. The remaining authors declare that the research was conducted in the absence of any commercial or financial relationships that could be construed as a potential conflict of interest.

References

  1. Bebber, D.P.; Richards, V.R. A meta-analysis of the effect of organic and mineral fertilizers on soil microbial diversity. Appl. Soil Ecol. 2022, 175, 104450. [Google Scholar] [CrossRef]
  2. Upadhyay, S.K.; Srivastava, A.K.; Rajput, V.D.; Chauhan, P.K.; Bhojiya, A.A.; Jain, D.; Chaubey, G.; Dwivedi, P.; Sharma, B.; Minkina, T. Root exudates: Mechanistic insight of plant growth promoting rhizobacteria for sustainable crop production. Front. Microbiol. 2022, 13, 916488. [Google Scholar] [CrossRef]
  3. Bhunia, S.; Bhowmik, A.; Mallick, R.; Mukherjee, J. Agronomic efficiency of animal-derived organic fertilizers and their effects on biology and fertility of soil: A review. Agronomy 2021, 11, 823. [Google Scholar] [CrossRef]
  4. Shyam, S.; Ahmed, S.; Joshi, S.J.; Sarma, H. Biochar as a soil amendment: Implications for soil health, carbon sequestration, and climate resilience. Discov. Soil 2025, 2, 18. [Google Scholar] [CrossRef]
  5. Giagnoni, L.; Renella, G. Effects of biochar on the C use efficiency of soil microbial communities: Components and mechanisms. Environments 2022, 9, 138. [Google Scholar] [CrossRef]
  6. Pandian, K.; Vijayakumar, S.; Mustaffa, M.R.A.F.; Subramanian, P.; Chitraputhirapillai, S. Biochar—A sustainable soil conditioner for improving soil health, crop production and environment under changing climate: A review. Front. Soil Sci. 2024, 4, 1376159. [Google Scholar] [CrossRef]
  7. Oliveira, C.F.; Mendes, L.W.; Alleoni, L.R.F. Potassium organomineral fertilizer alters the microbiome of a sandy loam tropical soil. Appl. Soil Ecol. 2025, 207, 105960. [Google Scholar] [CrossRef]
  8. Liu, C.; Shang, H.; Han, L.; Sun, X. Effect of alkali residue and humic acid on aggregate structure of saline-alkali soil. Soil Sci. Soc. Am. J. 2024, 88, 291–303. [Google Scholar] [CrossRef]
  9. Lehmann, J.; Joseph, S. (Eds.) Biochar for Environmental Management: Science, Technology and Implementation, 2nd ed.; Routledge: Hoboken, NJ, USA, 2024. [Google Scholar] [CrossRef]
  10. Shen, J.; Xiao, X.; Zhong, D.; Lian, H. Potassium humate supplementation improves photosynthesis and agronomic and yield traits of foxtail millet. Sci. Rep. 2024, 14, 9508. [Google Scholar] [CrossRef]
  11. Zaghloul, E.A.; Awad, E.S.A.; Mohamed, I.R.; El-Hameed, A.M.A.; Feng, D.; Desoky, E.S.M.; Algopishi, U.B.; Al Masoudi, L.M.; Elrys, A.S.; Mathew, B.T.; et al. Co-application of organic amendments and natural biostimulants on plants enhances wheat production and defense system under salt-alkali stress. Sci. Rep. 2024, 14, 29742. [Google Scholar] [CrossRef]
  12. Holatko, J.; Hammerschmiedt, T.; Mustafa, A.; Kintl, A.; Radziemska, M.; Baltazar, T.; Jaskulska, I.; Malicek, O.; Latal, O.; Brtnicky, M. Carbon-enriched organic amendments differently affect the soil chemical, biological properties and plant biomass in a cultivation time-dependent manner. Chem. Biol. Technol. Agric. 2022, 9, 52. [Google Scholar] [CrossRef]
  13. Laghari, M.; Mirjat, M.S.; Hu, Z.; Fazal, S.; Xiao, B.; Hu, M.; Chen, Z.; Guo, D. Effects of biochar application rate on sandy desert soil properties and sorghum growth. Catena 2015, 135, 313–320. [Google Scholar] [CrossRef]
  14. Rupngam, T.; Udomkun, P.; Boonupara, T.; Kaewlom, P. Enhancing soil health, growth, and bioactive compound accumulation in sunflower sprouts using agricultural byproduct-based soil amendments. Agronomy 2025, 15, 1213. [Google Scholar] [CrossRef]
  15. Fichtner, T.; Goersmeyer, N.; Stefan, C. Influence of soil pore system properties on the degradation rates of organic substances during soil aquifer treatment (SAT). Appl. Sci. 2019, 9, 496. [Google Scholar] [CrossRef]
  16. Kroetsch, D.; Wang, C. Particle size distribution. Soil Sampl. Methods Anal. 2008, 2, 713–725. [Google Scholar] [CrossRef]
  17. Hendershot, W.H.; Lalande, H.; Duquette, M. Soil reaction and exchangeable acidity. In Soil Sampling and Methods of Analysis; Lewis Publishers: Boca Raton, FL, USA, 1993. [Google Scholar] [CrossRef]
  18. Motsara, M.R.; Roy, R.N. Guide to Laboratory Establishment for Plant Nutrient Analysis. FAO Fertilizer and Plant Nutrition Bulletin, 19. 2008. Available online: https://www.fao.org/4/i0131e/i0131e.pdf (accessed on 11 April 2025).
  19. Smallholder Agriculture. Soil Health Evaluation Manual (Version 6.4). 2020. Available online: https://smallholder-sha.org/wp-content/uploads/2020/08/soiltoolkitmanual_sv6.4_edits_8_2020_pom_rewrite_changeaccepted.pdf (accessed on 27 December 2024).
  20. Page, A.L.; Robert, H.; Miller, D.; Keeney, R. (Eds.) Methods of Soil Analysis. Part 2: Chemical and Microbiological Properties, 2nd ed.; Agronomy Monograph No. 9, Part 2; American Society of Agronomy: Madison, WI, USA, 1982; Front Matter—1982—Agronomy Monographs—Wiley Online Library. [Google Scholar]
  21. Deng, G.F.; Lin, X.; Xu, X.R.; Gao, L.L.; Xie, J.F.; Li, H.B. Antioxidant capacities and total phenolic contents of 56 vegetables. J. Funct. Foods 2013, 5, 260–266. [Google Scholar] [CrossRef]
  22. Ghafoor, K.; Ozcan, M.M.; AL-Juhaimi, F.; Babiker, E.E.; Fadimu, G.J. Changes in quality, bioactive compounds, fatty acids, tocopherols, and phenolic composition in oven- and microwave-roasted poppy seeds and oil. LWT—Food Sci. Technol. 2019, 99, 490–496. [Google Scholar] [CrossRef]
  23. Barua, U.; Das, R.P.; Gogoi, B. Chlorophyll estimation in some minor fruits of Assam. Ecol. Environ. Conserv. 2016, 22, 1787–1789. [Google Scholar] [CrossRef]
  24. Wang, Y.; Hu, N.; Ge, T.; Kuzyakov, Y.; Wang, Z.L.; Li, Z.; Tang, Z.; Chen, Y.; Wu, C.; Lou, Y. Soil aggregation regulates distributions of carbon, microbial community and enzyme activities after 23-year manure amendment. Appl. Soil Ecol. 2017, 111, 65–72. [Google Scholar] [CrossRef]
  25. Lehmann, J.; Kleber, M. The contentious nature of soil organic matter. Nature 2015, 528, 60–68. [Google Scholar] [CrossRef]
  26. Zhang, J.; Chi, F.; Wei, D.; Zhou, B.; Cai, S.; Li, Y.; Kuang, E.; Sun, L.; Li, L.J. Impacts of long-term fertilization on the molecular structure of humic acid and organic carbon content in soil aggregates in black soil. Sci. Rep. 2019, 9, 11908. [Google Scholar] [CrossRef] [PubMed]
  27. Quaggiotti, S.; Ruperti, B.; Pizzeghello, D.; Francioso, O.; Tugnoli, V.; Nardi, S. Effect of low molecular size humic substances on nitrate uptake and expression of genes involved in nitrate transport in maize (Zea mays L.). J. Exp. Bot. 2004, 55, 803–813. [Google Scholar] [CrossRef]
  28. Stevenson, F.J. Humus chemistry: Genesis, composition, reactions. J. Chem. Educ. 1995, 72, A93. [Google Scholar] [CrossRef]
  29. Tan, K.H. Humic Matter in Soil and the Environment: Principles and Controversies, 2nd ed.; CRC Press: Boca Raton, FL, USA, 2003. [Google Scholar] [CrossRef]
  30. Van Dang, L.; Ngoc, N.P.; Hung, N.N. Soil quality and pomelo productivity as affected by chicken manure and cow dung. Sci. World J. 2021, 2021, 6289695. [Google Scholar] [CrossRef] [PubMed]
  31. Asadi, H.; Ghorbani, M.; Rezaei-Rashti, M.; Abrishamkesh, S.; Amirahmadi, E.; Chengrong, C.H.E.N.; Gorji, M. Application of rice husk biochar for achieving sustainable agriculture and environment. Rice Sci. 2021, 28, 325–343. [Google Scholar] [CrossRef]
  32. Da Silva Mendes, J.; Fernandes, J.D.; Chaves, L.H.G.; Guerra, H.O.C.; Tito, G.A.; de Brito Chaves, I. Chemical and physical changes of soil amended with biochar. Water Air Soil Pollut. 2021, 232, 338. [Google Scholar] [CrossRef]
  33. Chen, X.; Lewis, S.; Heal, K.V.; Lin, Q.; Sohi, S.P. Biochar engineering and ageing influence the spatiotemporal dynamics of soil pH in the charosphere. Geoderma 2021, 386, 114919. [Google Scholar] [CrossRef]
  34. Safdar, H.; Amin, A.; Shafiq, Y.; Ali, A.; Yasin, R.; Shoukat, A.; Hussan, M.U.; Sarwar, M.I. A review: Impact of salinity on plant growth. Nat. Sci. 2019, 17, 34–40. [Google Scholar] [CrossRef]
  35. Gross, A.; Glaser, B. Meta-analysis on how manure application changes soil organic carbon storage. Sci. Rep. 2021, 11, 5516. [Google Scholar] [CrossRef]
  36. Moustafa, Y.; Hammam, A.; Haddad, S. Potassium humate application and cutting immature flowers affect soil properties, microbial activity and jerusalem artichoke yield components. J. Soil Sci. Agric. Eng. 2018, 9, 33–41. [Google Scholar] [CrossRef]
  37. Tsai, W.-T.; Lin, Y.-Q.; Huang, H.-J. Valorization of Rice Husk for the Production of Porous Biochar Materials. Fermentation 2021, 7, 70. [Google Scholar] [CrossRef]
  38. Fatima, S.; Riaz, M.; Al-Wabel, M.I.; Arif, M.S.; Yasmeen, T.; Hussain, Q.; Roohi, M.; Fahad, S.; Ali, K.; Arif, M. Higher biochar rate strongly reduced decomposition of soil organic matter to enhance C and N sequestration in nutrient-poor alkaline calcareous soil. J. Soils Sediments 2021, 21, 148–162. [Google Scholar] [CrossRef]
  39. Liu, S.; Kong, F.; Li, Y.; Jiang, Z.; Xi, M.; Wu, J. Mineral-ions modified biochars enhance the stability of soil aggregate and soil carbon sequestration in a coastal wetland soil. Catena 2020, 193, 104618. [Google Scholar] [CrossRef]
  40. Han, Z.; Xu, P.; Li, Z.; Guo, S.; Li, S.; Liu, S.; Wu, S.; Wang, J.; Zou, J. Divergent effects of biochar amendment and replacing mineral fertilizer with manure on soil respiration in a subtropical tea plantation. Biochar 2023, 5, 73. [Google Scholar] [CrossRef]
  41. Abagandura, G.O.; Mahal, N.K.; Butail, N.P.; Dhaliwal, J.K.; Gautam, A.; Bawa, A.; Kovács, P.; Kumar, S. Soil labile carbon and nitrogen fractions after eleven years of manure and mineral fertilizer applications. Arch. Agron. Soil Sci. 2023, 69, 875–890. [Google Scholar] [CrossRef]
  42. Chakraborty, A.; Chakrabarti, K.; Chakraborty, A.; Ghosh, S. Effect of long-term fertilizers and manure application on microbial biomass and microbial activity of a tropical agricultural soil. Biol. Fertil. Soils 2011, 47, 227–233. [Google Scholar] [CrossRef]
  43. López-López, G.; Lobo, M.C.; Negre, A.; Colombàs, M.; Rovira, J.M.; Martorell, A.; Reolid, C.; Sastre-Conde, I. Impact of fertilisation practices on soil respiration, as measured by the metabolic index of short-term nitrogen input behaviour. J. Environ. Manag. 2012, 113, 517–526. [Google Scholar] [CrossRef]
  44. Afzal, S.; Muhammad, D.; Ullah, R.; Adnan, M.; Saeed, B.; Alzayed, R.M.; Alhajouj, S.A.; Alaida, M.F.; Ahmad, M.; Altalhi, A.; et al. Interactive effect of humic acid and farmyard manure on soil health and microbial activity in calcareous soil. Pak. J. Bot. 2025, 57, 3. [Google Scholar] [CrossRef]
  45. Di Iorio, E.; Circelli, L.; Angelico, R.; Torrent, J.; Tan, W.; Colombo, C. Environmental implications of interaction between humic substances and iron oxide nanoparticles: A review. Chemosphere 2022, 303, 135172. [Google Scholar] [CrossRef]
  46. Tan, W.; Jia, Y.; Huang, C.; Zhang, H.; Li, D.; Zhao, X.; Wang, G.; Jiang, J.; Xi, B. Increased suppression of methane production by humic substances in response to warming in anoxic environments. J. Environ. Manag. 2018, 206, 602–606. [Google Scholar] [CrossRef]
  47. Gao, S.; DeLuca, T.H.; Cleveland, C.C. Biochar additions alter phosphorus and nitrogen availability in agricultural ecosystems: A meta-analysis. Sci. Total Environ. 2019, 654, 463–472. [Google Scholar] [CrossRef] [PubMed]
  48. Holatko, J.; Hammerschmiedt, T.; Datta, R.; Baltazar, T.; Kintl, A.; Latal, O.; Pecina, V.; Sarec, P.; Novak, P.; Balakova, L.; et al. Humic acid mitigates the negative effects of high rates of biochar application on microbial activity. Sustainability 2020, 12, 9524. [Google Scholar] [CrossRef]
  49. Kumar, D.; Singh, A.P. Efficacy of potassium humate and chemical fertilizers on yield and nutrient availability patterns in soil at different growth stages of rice. Commun. Soil Sci. Plant Anal. 2017, 48, 245–261. [Google Scholar] [CrossRef]
  50. Chen, Z.X.; Elrys, A.S.; Zhang, H.M.; Tu, X.S.; Wang, J.; Cheng, Y.; Zhang, J.B.; Cai, Z.C. How does organic amendment affect soil microbial nitrate immobilization rate? Soil Biol. Biochem. 2022, 173, 108784. [Google Scholar] [CrossRef]
  51. Yao, Y.; Gao, B.; Zhang, M.; Inyang, M.; Zimmerman, A.R. Effect of biochar amendment on sorption and leaching of nitrate, ammonium, and phosphate in a sandy soil. Chemosphere 2012, 89, 1467–1471. [Google Scholar] [CrossRef]
  52. Canellas, L.P.; Olivares, F.L.; Aguiar, N.O.; Jones, D.L.; Nebbioso, A.; Mazzei, P.; Piccolo, A. Humic and fulvic acids as biostimulants in horticulture. Sci. Hortic. 2015, 196, 15–27. [Google Scholar] [CrossRef]
  53. El-Naqma, K. The role of humate substances in controlling synergism and antagonism of nutrients uptake by potato plants. Environ. Biodivers. Soil Secur. 2020, 4, 149–165. [Google Scholar] [CrossRef]
  54. Garg, S.; Bahl, G.S. Phosphorus availability to maize as influenced by organic manures and fertilizer P associated phosphatase activity in soils. Bioresour. Technol. 2008, 99, 5773–5777. [Google Scholar] [CrossRef] [PubMed]
  55. Oburger, E.; Jones, D.L.; Wenzel, W.W. Phosphorus saturation and pH differentially regulate the efficiency of organic acid anion-mediated P solubilization mechanisms in soil. Plant Soil 2011, 341, 363–382. [Google Scholar] [CrossRef]
  56. Abdelkader, A.E. Effect of different levels of farmyard manure, mineral fertilization and potassium humate on growth and productivity of garlic. Sciences 2019, 9, 287–296. [Google Scholar]
  57. Li, R.; Wang, J.J.; Zhou, B.; Awasthi, M.K.; Ali, A.; Zhang, Z.; Gaston, L.A.; Lahori, A.H.; Mahar, A. Enhancing phosphate adsorption by Mg/Al layered double hydroxide functionalized biochar with different Mg/Al ratios. Sci. Total Environ. 2016, 559, 121–129. [Google Scholar] [CrossRef] [PubMed]
  58. Nelson, N.O.; Agudelo, S.C.; Yuan, W.; Gan, J. Nitrogen and phosphorus availability in biochar-amended soils. Soil Sci. 2011, 176, 218–226. [Google Scholar] [CrossRef]
  59. Gatabazi, A. Nitrogen, Phosphorus and Potassium Availability as Influenced by Humate and Fulvate Soil Amendment. Ph.D. Thesis, University of Pretoria, Pretoria, South Africa, 2014. [Google Scholar]
  60. Bilias, F.; Kalderis, D.; Richardson, C.; Barbayiannis, N.; Gasparatos, D. Biochar application as a soil potassium management strategy: A review. Sci. Total Environ. 2023, 858, 159782. [Google Scholar] [CrossRef] [PubMed]
  61. Reitemeier, R.F. Soil potassium. Adv. Agron. 1951, 3, 113–164. [Google Scholar] [CrossRef]
  62. Minnikova, T.; Kolesnikov, S.; Minkina, T.; Mandzhieva, S. Assessment of ecological condition of haplic chernozem calcic contaminated with petroleum hydrocarbons during application of bioremediation agents of various natures. Land 2021, 10, 169. [Google Scholar] [CrossRef]
  63. Zhang, Z.; Dong, X.; Wang, S.; Pu, X. Benefits of organic manure combined with biochar amendments to cotton root growth and yield under continuous cropping systems in Xinjiang, China. Sci. Rep. 2020, 10, 4718. [Google Scholar] [CrossRef]
  64. Ibrahim, M.; Yamin, M.; Sarwar, G.; Anayat, A.; Habib, F.; Ullah, S. Tillage and farm manure affect root growth and nutrient uptake of wheat and rice under semi-arid conditions. Appl. Geochem. 2011, 26, S194–S197. [Google Scholar] [CrossRef]
  65. Yang, C.; Yang, L.; Yang, Y.; Ouyang, Z. Rice root growth and nutrient uptake as influenced by organic manure in continuously and alternately flooded paddy soils. Agric. Water Manag. 2004, 70, 67–81. [Google Scholar] [CrossRef]
  66. Zou, Z.; Fan, L.; Li, X.; Dong, C.; Zhang, L.; Zhang, L.; Fu, J.; Han, W.; Yan, P. Response of plant root growth to biochar amendment: A meta-analysis. Agronomy 2021, 11, 2442. [Google Scholar] [CrossRef]
  67. El-Masry, T.; El-Sawah, N.; Osman, A.; Abd El-Ghany, S.; Abed El-Hamed, G. Influence of potassium humate and calcium phosphate on production of pepper seedlings. Fayoum J. Agric. Res. Dev. 2021, 35, 363–379. [Google Scholar] [CrossRef]
  68. Nemeata Alla, H.; Sasy, A.; Helmy, S.A. Effect of potassium humate and nitrogen fertilization on yield and quality of sugar beet in sandy soil. J. Plant Prod. 2018, 9, 333–338. [Google Scholar] [CrossRef]
  69. Rose, M.T.; Patti, A.F.; Little, K.R.; Brown, A.L.; Jackson, W.R.; Cavagnaro, T.R. A meta-analysis and review of plant-growth response to humic substances: Practical implications for agriculture. Adv. Agron. 2014, 124, 37–89. [Google Scholar] [CrossRef]
  70. Malik, Z.; Malik, N.; Noor, I.; Kamran, M.; Parveen, A.; Ali, M.; Sabir, F.; Elansary, H.O.; El-Abedin, T.K.Z.; Mahmoud, E.A.; et al. Combined effect of rice-straw biochar and humic acid on growth, antioxidative capacity, and ion uptake in maize (Zea mays L.) grown under saline soil conditions. J. Plant Growth Regul. 2023, 42, 3211–3228. [Google Scholar] [CrossRef]
  71. Syvertsen, J.P.; Garcia-Sanchez, F. Multiple abiotic stresses occurring with salinity stress in citrus. Environ. Exp. Bot. 2014, 103, 128–137. [Google Scholar] [CrossRef]
  72. de Moura, O.V.T.; Berbara, R.L.L.; de Oliveira Torchia, D.F.; Da Silva, H.F.O.; de Castro, T.A.V.T.; Tavares, O.C.H.; Rodrigues, N.F.; Zonta, E.; Santos, L.A.; García, A.C. Humic foliar application as sustainable technology for improving the growth, yield, and abiotic stress protection of agricultural crops. A review. J. Saudi Soc. Agric. Sci. 2023, 22, 493–513. [Google Scholar] [CrossRef]
  73. Farhadian, M.; Fallah, S.; Kaul, H.P.; Salehi, A. Effects of cow manure and humic acid on Echinacea purpurea (L.) performance and essential oils accumulation under drought conditions. Ind. Crops Prod. 2024, 222, 119826. [Google Scholar] [CrossRef]
  74. Li, J.; Zhu, Z.; Gerendás, J. Effects of nitrogen and sulfur on total phenolics and antioxidant activity in two genotypes of leaf mustard. J. Plant Nutr. 2008, 31, 1642–1655. [Google Scholar] [CrossRef]
  75. Thepsilvisut, O.; Chutimanukul, P.; Sae-Tan, S.; Ehara, H. Effect of chicken manure and chemical fertilizer on the yield and qualities of white mugwort at dissimilar harvesting times. PLoS ONE 2022, 17, e0266190. [Google Scholar] [CrossRef]
  76. Tu, Y.; Shen, J.; Peng, Z.; Xu, Y.; Li, Z.; Liang, J.; Wei, Q.; Zhao, H.; Huang, J. Biochar-dual oxidant composite particles alleviate the oxidative stress of phenolic acid on tomato seed germination. Antioxidants 2023, 12, 910. [Google Scholar] [CrossRef]
  77. Wang, Y.; Pan, F.; Wang, G.; Zhang, G.; Wang, Y.; Chen, X.; Mao, Z. Effects of biochar on photosynthesis and antioxidative system of Malus hupehensis Rehd. seedlings under replant conditions. Sci. Hortic. 2014, 175, 9–15. [Google Scholar] [CrossRef]
  78. El-Beltagi, H.S.; Al-Otaibi, H.H.; Parmar, A.; Ramadan, K.M.A.; Lobato, A.K.S.; El-Mogy, M.M. Application of potassium humate and salicylic acid to mitigate salinity stress of common bean. Life 2023, 13, 448. [Google Scholar] [CrossRef] [PubMed]
  79. Abdelrasheed, K.G.; Mazrou, Y.; Omara, A.E.D.; Osman, H.S.; Nehela, Y.; Hafez, E.M.; Rady, A.M.S.; El-Moneim, D.A.; Alowaiesh, B.F.; Gowayed, S.M. Soil amendment using biochar and application of K-humate enhance the growth, productivity, and nutritional value of onion (Allium cepa L.) under deficit irrigation conditions. Plants 2021, 10, 2598. [Google Scholar] [CrossRef]
  80. Ghassemi-Golezani, K.; Rahimzadeh, S. The biochar-based nanocomposites influence the quantity, quality and antioxidant activity of essential oil in dill seeds under salt stress. Sci. Rep. 2022, 12, 21903. [Google Scholar] [CrossRef] [PubMed]
  81. Chrząszcz, M.; Krzemińska, B.; Celiński, R.; Szewczyk, K. Phenolic composition and antioxidant activity of plants belonging to the Cephalaria (Caprifoliaceae) genus. Plants 2021, 10, 952. [Google Scholar] [CrossRef]
  82. Rostaei, M.; Fallah, S.; Carrubba, A.; Lorigooini, Z. Organic manures enhance biomass and improve content, chemical compounds of essential oil and antioxidant capacity of medicinal plants: A review. Heliyon 2024, 10, e36693. [Google Scholar] [CrossRef]
  83. Cong, M.; Hu, Y.; Sun, X.; Yan, H.; Yu, G.; Tang, G.; Chen, S.; Xu, W.; Jia, H. Long-term effects of biochar application on the growth and physiological characteristics of maize. Front. Plant Sci. 2023, 14, 1172425. [Google Scholar] [CrossRef] [PubMed]
  84. Liu, M.; Linna, C.; Ma, S.; Ma, Q.; Guo, J.; Wang, F.; Wang, L. Effects of biochar with inorganic and organic fertilizers on agronomic traits and nutrient absorption of soybean and fertility and microbes in purple soil. Front. Plant Sci. 2022, 13, 871021. [Google Scholar] [CrossRef]
  85. Sharma, S.; Rana, V.S.; Rana, N.; Sharma, U.; Gudeta, K.; Alharbi, K.; Ameen, F.; Bhat, S.A. Effect of organic manures on growth, yield, leaf nutrient uptake and soil properties of kiwifruit (Actinidia deliciosa Chev. ) cv. Allison. Plants 2022, 11, 3354. [Google Scholar] [CrossRef]
  86. Zou, Y.; Zhang, Y.; Testerink, C. Root dynamic growth strategies in response to salinity. Plant Cell Environ. 2021, 45, 695–704. [Google Scholar] [CrossRef]
  87. Figueroa-Macías, J.P.; García, Y.C.; Núñez, M.; Díaz, K.; Olea, A.F.; Espinoza, L. Plant growth-defense trade-offs: Molecular processes leading to physiological changes. Int. J. Mol. Sci. 2021, 22, 693. [Google Scholar] [CrossRef]
  88. Yan, S.; Yi-Quan, W.; Rui-qian, T. Effects of soil compaction stress on photosynthesis, chlorophyll fluorescence parameters of cucumber (Cucumis sativus L.) leaves. J. Plant Nutr. Fertil. 2009, 15, 638–642. [Google Scholar] [CrossRef]
  89. Fageria, N.K.; Baligar, V.C.; Jones, C.A. Growth and Mineral Nutrition of Field Crops, 3rd ed.; CRC Press: Boca Raton, FL, USA, 2010. [Google Scholar] [CrossRef]
Figure 1. Effects of different soil amendments on soil (A) macroaggregrate (MaA, >2 mm), (B) mesoaggregrate (MeA, 250 µm–2 mm), and (C) microaggregate (MiA, <250 µm). Values represent means ± standard deviation. Bars labeled with different letters (a–h) indicate statistically significant differences among treatments at p < 0.05.
Agronomy 15 01651 g001
Figure 2. Effects of different soil amendments on (A) pH, (B) electrical conductivity (EC), (C) soil organic carbon (SOC), and (D) soil respiration. Bars labeled with different letters (a–f) indicate statistically significant differences among treatments at p < 0.05.
Agronomy 15 01651 g002aAgronomy 15 01651 g002b
Figure 3. Effects of soil amendments on soil (A) nitrate (NO3), (B) available phosphorus (P), and (C) available potassium (K). Bars labeled with different letters (a–g) indicate statistically significant differences among treatments at p < 0.05.
Agronomy 15 01651 g003
Figure 4. Effects of soil amendments on (A) shoot fresh biomass, (B) root fresh biomass, and (C) root-to-shoot (R/S) ratio of sunflower sprouts. Bars labeled with different letters (a–e) indicate statistically significant differences among treatments at p < 0.05.
Agronomy 15 01651 g004
Figure 5. Effects of soil amendments on (A) total phenolic content (TPC), (B) DPPH radical scavenging activity, and (C) chlorophyll content in sunflower sprouts. Bars labeled with different letters (a–g) indicate statistically significant differences among treatments at p < 0.05.
Agronomy 15 01651 g005
Figure 6. Correlation matrix among soil properties, plant growth parameters, and bioactive compounds in sunflower sprouts based on treatment-level means (n = 9). Blue and red circles indicate positive and negative correlations, respectively, with the size and intensity reflecting the strength of the relationship. Correlation coefficients with |r| > 0.666 are statistically significant at p < 0.05 (df = 7).
Agronomy 15 01651 g006
Table 1. Baseline characteristics of the soil, cow manure (CM), rice husk biochar (RHB), and potassium humate (KH) were assessed before their application in the experiment.
PropertySoilCMRHBKH
Soil textureSandy loam---
pH value (–)6.6 (0.2) 18.7 (0.1)6.7 (0.0)10.8 (0.1)
Electrical conductivity (EC, mS/cm)0.6 (0.0)1.6 (0.1)0.1(0.0)10.8 (0.2)
Organic matter (OM, %)4.3 (0.1)65.3 (2.1)13.2 (1.2)36.7 (0.8)
Soil organic carbon (SOC, %)2.5 (0.2)37.2 (0.8)8.1 (0.5)21.3 (0.5)
Moisture (%)0.4 (0.0)5.2 (0.0)5.0 (0.3)8.7 (0.0)
Water holding capacity (WHC, %)16.1 (1.8)481.2 (19.5)225.2 (12.1)-
Nitrate (NO3, mg/kg)120.2 (6.1)117.1 (16.5)40.8 (5.6)3473.6 (89.7)
Available phosphorus (P, mg/kg)15.9 (1.0)2481.7 (202.0)75.3 (7.3)75.3 (19.2)
Available potassium (K, mg/kg)460.5 (12.3)10215.3 (482.5)2525.4 (142.5)7276.9 (771.4)
Humic acid (%) 2---67.5 (2.5)
Water solubility (%) 2---97.5 (2.5)
1 Values in parentheses are standard deviations. 2 Values that appear on the product label.
Disclaimer/Publisher’s Note: The statements, opinions and data contained in all publications are solely those of the individual author(s) and contributor(s) and not of MDPI and/or the editor(s). MDPI and/or the editor(s) disclaim responsibility for any injury to people or property resulting from any ideas, methods, instructions or products referred to in the content.

