1. Introduction
Rice (
Oryza sativa) is one of the major grain crops in China, and its output has been stable at more than 200 million tons for many years [
1]. In the face of the reduction in rice arable land area, the degree of mechanization of production, and other status quo elements, sustainable development and the concept of green production have been paid more and more attention; rice production is faced with a number of challenges, one of which is the problem of nitrogen fertilizer transport and management [
2].
The key to improving rice yield is to promote the growth of yield components. Some studies have shown that increasing nitrogen fertilizer under low nitrogen application rates helps improve the number of effective spikes and seed yield per unit area. However, once the nitrogen application exceeds the level required to meet the nutritional needs of rice, further increases in nitrogen can actually lead to a decline in yield [
3]. The effect of fertilizer application on yield components also varies, and increasing the amount of fertilizer application can increase the number of firm grains and the number of effective spikes, thus increasing the yield, while the thousand-grain weight will slightly decrease with the increase in fertilizer application [
4]. For a long time, there have been different conclusions about the effect of fertilization on rice quality. Some studies have found that an appropriate increase in nitrogen fertilization is beneficial to the improvement of nutritional quality, processing quality, and cooking taste quality, while high fertilization is detrimental to the main quality traits such as whole rice rate, chalky grain rate, and amylose content [
5]. Under different levels of nitrogen application, rice yield and rice protein content both increased with the increase in nitrogen application, while rice straight-chain starch content decreased with the increase in nitrogen application, which in turn would affect the flavor quality of rice [
6]. Therefore, refined nitrogen management is needed to achieve an optimal trade-off between productivity and grain quality.
Nitrogen, as a core nutrient element for rice growth, is limited by the amount of nitrogen fertilizer applied, and its transport and uptake mechanisms have a profound impact on the formation of rice yield and quality [
7]. The translocation of nitrogen within the plant regulates its allocation between vegetative organs (such as leaves and stems) and reproductive organs (such as panicles and grains), which is essential for effective grain filling, yield improvement, and enhanced rice quality, including nutritional value and palatability [
8]. Nitrogen uptake efficiency is related to the ability of the rice root system to obtain nitrogen efficiently from the soil, which directly affects the growth rate and development process of rice. Good nitrogen uptake can also significantly improve the appearance and processing quality of rice, for example, by increasing the transparency, reducing the chalky whiteness, and improving the nutritional value of rice [
9].
In the past, farmers would increase rice yields by over-applying nitrogen fertilizer, but this practice has brought about multiple negative impacts. On the one hand, insufficient understanding of the plant’s nitrogen fertilizer requirements leads to over-application and inefficient use of nitrogen fertilizer, which may result in losses of resources [
10] and may also lead to the risk of contamination of groundwater, rivers, and neighboring ecosystems by residual nitrogen fertilizers in the soil of farmland [
11]. In fact, the overuse of nitrogen fertilizers is a global issue that poses serious threats to ecological security, contributing to problems such as eutrophication, greenhouse gas emissions, and biodiversity loss. In regions with intensive agriculture, such as parts of Southeast Asia, Europe, and North America, excessive nitrogen application has become a major environmental concern. Moreover, reducing nitrogen use is crucial not only from an environmental standpoint but also from an economic perspective—especially for smallholder farmers. Excessive fertilization increases input costs without guaranteeing proportional yield gains, thereby diminishing economic returns. Promoting efficient nitrogen use can help reduce production costs, improve sustainability, and enhance resilience for resource-constrained producers.
Aiming at the current challenges of nitrogen fertilizer application in China, this study conducted a series of nitrogen fertilization experiments using Nanjing 9108 and Ming 1 Youzhenzhan as representative materials. The two varieties selected for this study are representative cultivars widely grown in different regions: Nanjing 9108 is a typical variety extensively cultivated in Nanjing, while Ming 1 Youzhenzhan is commonly planted in Fujian. Their selection allows for a meaningful comparison of nitrogen management effects across major rice subspecies, thereby enhancing the relevance of the results.
This study focuses on evaluating how varying nitrogen application levels influence rice yield components and grain quality traits in both japonica and indica rice. It also explores how these two varieties respond differently to nitrogen input, aiming to identify fertilization strategies that balance agronomic performance with resource efficiency. By combining empirical data with comparative analysis, the findings are expected to support the development of predictive tools for more sustainable and intelligent nitrogen management in precision rice production.
It is hypothesized that moderate nitrogen application will enhance both yield and grain quality compared to low or excessive input, but the extent and nature of these improvements may differ between the two varieties due to their distinct genetic and physiological traits.
2. Materials and Methods
2.1. Experimental Materials
This study was conducted at the experimental site of the Jiangsu Academy of Agricultural Sciences. The rice materials used were late-maturing japonica rice variety Nanjing 9108 and the late-season indica hybrid variety Ming 1 Youzhenzhan, provided by the Institute of Cereal Crops at the Jiangsu Academy of Agricultural Sciences and the Sanming Academy of Agricultural Sciences, Fujian Province, respectively.
The experimental equipment included an electric constant-temperature forced-air drying oven, a HOBO U23 air temperature and humidity data logger (Onset Computer Corporation, Bourne, MA, USA), a SPAD-502 Plus portable chlorophyll meter (Konica Minolta, Tokyo, Japan), a semi-micro automatic titration system, a Kjeldahl nitrogen analyzer (VELP Scientifica, Usmate Velate, Lombardy, Italy), a JLG-III rice huller (Chengdu Grain Research Institute, Chengdu, China), a Pearlest rice milling machine (Kett Corporation, Tokyo, Japan), an SC-E rice quality evaluation instrument (Hangzhou Wanshen Instrument Co., Ltd., Hangzhou, China), and a UV-1800 ultraviolet–visible spectrophotometer (Shimadzu Corporation, Kyoto, Japan).
2.2. Experimental Design
The experiment was carried out over two years, in 2022 and 2023. In early May of each year, the Nanjing 9108 and the Ming 1 Youzhenzhan were sown in seedling beds. After emergence in June, seedlings exhibiting similar growth vigor were selected and transplanted into 60 plastic turnover boxes (each measuring 67.5 cm in length, 51 cm in width, and 22 cm in height). Each box was filled with 18 cm of rice paddy soil (loam soil, which forms clumps when squeezed by hand and crumbles when released). The planting configuration consisted of row spacing at 25 cm and plant spacing at 13 cm. For Nanjing 9108, two seedlings were planted per hole, whereas for Ming 1 Youzhenzhan, one seedling was planted per hole. Each turnover box contained a total of 12 transplanted holes. Following transplanting, the water level in each box was maintained 4 cm above the soil surface. An air temperature and humidity data logger was positioned in the rice growth area (approximately 1.5 m above the ground) to monitor the temperature of the rice canopy under natural conditions.
The rice material used in this study was grown in the field and managed using conventional high-quality cultivation practices. Based on the research of Zhao Can et al., the experiment used the average nitrogen application rate of local farmers in Jiangsu as a control and applied 108.00 kg/hm2 of pure nitrogen (N) as base fertilizer (urea or compound fertilizer; the compound fertilizer used was a commercially available product with a nutrient composition of N:P2O5:K2O = 15:15:15) to each turnover box before transplanting. Both varieties received the same amounts of tillering and panicle fertilizers (urea) during the early tillering and early heading stages, respectively. The control group (CK) received 81 kg/hm2 of both tillering and panicle fertilizers, resulting in a total application of 270 kg/hm2 of pure nitrogen, referred to as 100% N. The ratio of base fertilizer, tillering fertilizer, and panicle fertilizer was set at 4:3:3.
As shown in
Table 1, four treatments were established for the total nitrogen fertilizer experiment, with equal amounts of tillering and panicle fertilizers applied for each treatment: N1 (75% N, 60.75 kg/hm
2), N2 (50% N, 40.50 kg/hm
2), N3 (25% N, 20.25 kg/hm
2), and N4 (no nitrogen treatment). In the panicle fertilizer reduction experiment, tillering fertilizer was the same as the control (CK), and two treatments were used for panicle fertilizer: N5 (50% N, 40.50 kg/hm
2) and N6 (no panicle fertilizer treatment). Additionally, two treatments were established for the compound fertilizer substitution experiment: N7 (100% compound fertilizer) and N8 (50% urea + 50% compound fertilizer). The fertilizers were applied on June 6 (base fertilizer) and June 13 (tillering fertilizer) for both varieties. The panicle fertilizer for Nanjing 9108 was applied on 7 August, and for Ming 1 Youzhenzhan on 29 July.
2.3. Climate Conditions
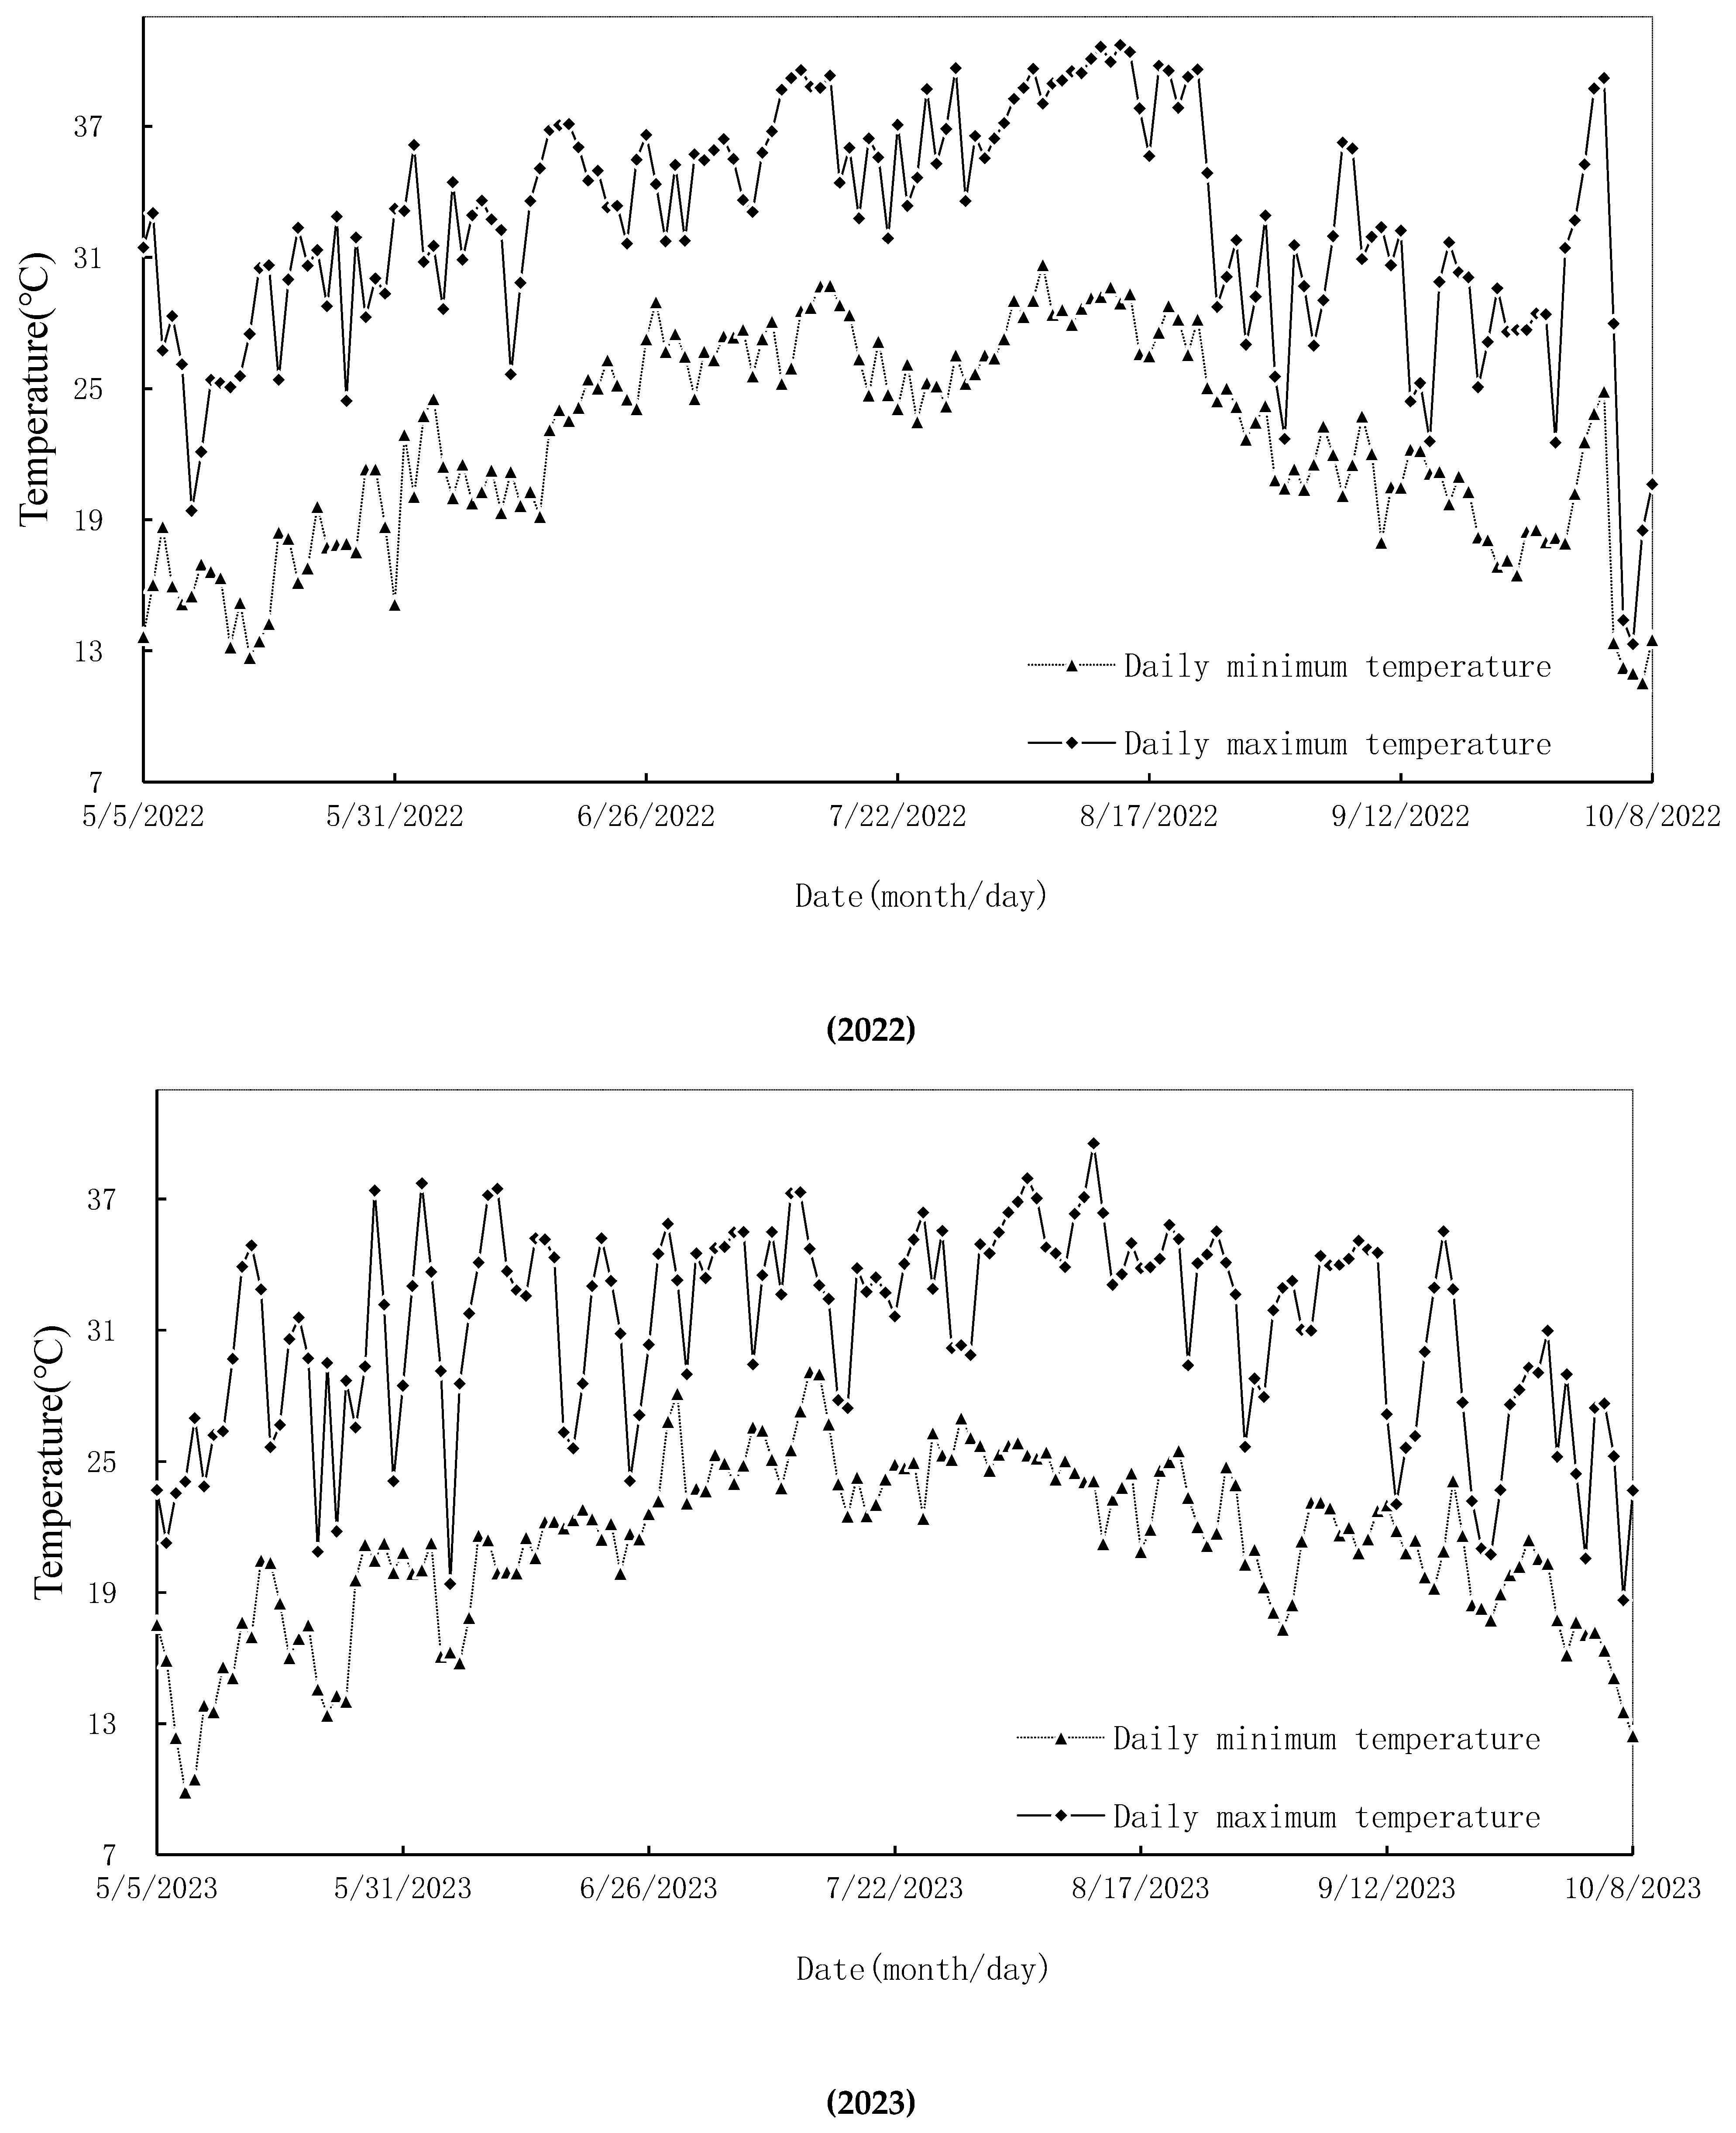
As shown in
Figure 1, a HOBO U23 air temperature and humidity data logger was placed in the rice-growing area at approximately 1.5 m above ground level to record daily air temperature data under natural conditions in 2022 and 2023. The temporal variation trends of meteorological factors over the two years were generally consistent. Although precipitation and cloud cover were not recorded during the experimental period, daily maximum and minimum air temperatures were monitored. The diurnal temperature range (DTR), defined as the difference between the daily maximum and minimum temperatures, was used as an indicator to infer weather conditions. Typically, a larger DTR suggests clear and sunny weather due to strong solar radiation during the day and significant cooling at night. In contrast, a smaller DTR indicates cloudy or rainy conditions. These factors affect rice photosynthesis as well as nitrogen uptake and translocation rates, thereby influencing both yield and grain quality.
2.4. Determination Items and Methods
2.4.1. Yield Assessment
After the rice had matured, the nitrogen (N) content, yield, and factors contributing to yield in each above-ground organ (leaves, stem sheaths, and grains) were measured separately. Specifically, the following parameters were assessed: effective panicle number per unit area, number of grains per panicle, seed-setting rate (%), 1000-grain weight (g), and individual plant yield (g). After harvest, the following rice quality indicators were determined: brown rice percentage (%), milled rice percentage (%), whole milled rice percentage (%), chalkiness degree (%), chalky grain percentage (%), grain length (mm), grain width (mm), length-to-width ratio, transparency (grade), alkali spreading value (grade), gel consistency (mm), taste quality, protein content (%), and amylose content (%).
2.4.2. Grain Quality Determination
The determination of rice quality was conducted following the standards outlined in NY/T 83-2017 “Methods for Determination of Rice Quality” [
12], NY 147-88 “Methods for Determination of Rice Quality” [
13], GB/T 22294-2008 “Grain and Oil Inspection—Determination of Rice Gel Consistency” [
14] and GB/T 15683-2008 “Determination of Rice Linear Starch Content” [
15], among others.
2.4.3. Nitrogen Transport and Absorption Parameters
The total nitrogen content of samples taken from various aboveground organs was determined using the sulfuric acid–hydrogen peroxide digestion method combined with semi-micro Kjeldahl nitrogen determination. The nitrogen concentration in each tissue was expressed as the total nitrogen content per kilogram of dry matter (g·kg
−1). The nitrogen-related calculation formulas are as follows:
2.5. Data Processing and Analysis
The data collected in this study were processed using Microsoft Excel 2019. Experimental results were averaged over two years. For statistical analysis, one-way Analysis of Variance (ANOVA) was conducted using SPSS 26 statistical software (IBM Corp., Armonk, NY, USA). Post hoc multiple comparisons were performed using the Least Significant Difference (LSD) and Duncan’s tests.
In order to construct and study the collaborative simulation model of rice quantity and quality during the later growth stages, the changes in rice quality for the two tested varieties under different nitrogen fertilizer treatments were analyzed in 2023. Origin 2019 software was used for function fitting, and the mean square error (
MSE) values and determination coefficients (
R2) of all fitted functions were calculated for screening and verification. The formula for calculating the mean square error (
MSE) is as follows:
In this study, ni represents the total nitrogen applied under different nitrogen fertilizer treatments, while ai represents the average quality data of the harvested rice following each nitrogen fertilizer treatment. The degree of freedom (N) for each fitting function is calculated by subtracting the number of parameters in the fitting function from the number of samples and then subtracting one.
Finally, the function with the smallest mean square error (MSE), denoted as fk(x), was selected as the fitting function for the quality of the rice under the total nitrogen fertilizer control test.
Subsequently, the effectiveness of the fit was evaluated based on the coefficient of determination,
R2.
A represents the average value of rice quality data under all nitrogen fertilizer total treatments.
Furthermore, the rice quality of the two tested varieties under different nitrogen fertilizer total control experiments in 2022 was used to validate each fitting model. The evaluation index used for this validation is the relative root mean square error (
rRMSE), and the specific formula is as follows:
Here, OBSi represents the observed value, SIMi is the simulated value, and n is the sample size. The smaller the rRMSE value, the better the simulation effect. If rRMSE > 30%, the model does not meet the statistical requirements.
2.6. Selection of the Best Fertilization Measures to Balance Yield and Quality for Crop Production
Improved rice quality is often accompanied by a decrease in yield. Farmers generally demonstrate a limited tolerance for yield reductions, with their willingness to adopt nitrogen reduction practices diminishing markedly once yield loss surpasses 30%. Based on on-site investigations at agricultural extension stations, a yield threshold of 30% was set to balance improving rice quality while maintaining an acceptable yield level in practical rice crop production [
16,
17]. Given the numerous quality indicators for rice, this study selects four key indicators—representing rice processing quality, appearance quality, nutritional quality, and cooking taste quality—that show significant differences between the two rice varieties in the N1-N8 experiment. Finally, from the selected treatments that result in less than a 30% yield reduction compared to the control (CK), the fertilization treatment yielding the best quality relative to CK was further identified, based on these four quality indicators, aiming to provide guidance for optimal fertilization in rice crop production.
3. Results
3.1. Effects of Nitrogen Fertilizer Management on Rice Yield and Its Contributing Factors
3.1.1. Effects of Nitrogen Fertilizer Management on Rice Yield
As shown in
Table 2, for Nanjing 9108, the yield reductions under the N1-N8 treatments compared to the control (CK) were 43.32%, 39.41%, 47.61%, 47.95%, 13.95%, 26.83%, 2.88%, and 20.05%, respectively. With the exception of the N7 treatment, all other nitrogen fertilizer reduction treatments resulted in a significant decrease in individual plant yield compared to CK.
For Ming 1 Youzhenzhan, the yield reductions of the N1-N6 treatments compared to the control (CK) were 23.07%, 52.52%, 54.63%, 63.10%, 1.87%, and 29.50%, respectively. The N7 and N8 treatments resulted in significant yield increases of 51.26% and 23.74%, respectively, relative to the control (CK). Individual plant yield under the N2, N3, and N4 treatments was significantly lower than the control (CK), whereas the N7 treatment resulted in a significantly higher yield than CK.
In summary, when the total amount of nitrogen fertilizer applied is reduced, the overall performance of both japonica and indica rice shows a decrease in yield per plant as the total nitrogen application decreases. Indica rice is more sensitive to reductions in nitrogen fertilizer, while japonica rice is more dependent on panicle fertilizer. Increasing the proportion of compound fertilizer to replace urea can significantly improve the yield per plant of indica rice.
3.1.2. The Impact of Nitrogen Fertilizer Management on the Contributing Factors of Rice Yield
For Nanjing 9108, under the N1-N8 treatments, the number of grains per spike, seed setting rate, and thousand-grain weight did not show significant differences compared to the control (CK). However, the number of effective panicles in Nanjing 9108 was significantly lower than CK under the N2, N3, and N4 treatments, with reductions of 37.05%, 37.05%, and 42.88%, respectively. No significant differences were observed between the other treatments and CK.
For Ming 1 Youzhenzhan, the number of grains per spike was significantly lower than CK by 22.70% under the N4 treatment. The number of effective panicles in Ming 1 Youzhenzhan was significantly lower than CK under the N2, N3, and N4 treatments, with reductions of 42.84%, 42.84%, and 48.59%, respectively. The number of effective panicles was significantly higher than CK under the N7 and N8 treatments, with increases of 45.67% and 25.71%, respectively. The seed setting rate in Ming 1 Youzhenzhan was significantly lower than CK under the N2, N3, N7, and N8 treatments, with reductions of 12.12%, 15.65%, 21.68%, and 19.30%, respectively. No significant differences in thousand-grain weight were observed for either variety under any of the N1-N8 treatments compared to CK.
Overall, for Nanjing 9108 (japonica), the number of grains per panicle, seed setting rate, and thousand-grain weight were not significantly affected by nitrogen fertilizer treatments. For Ming 1 Youzhenzhan (indica), the effective number of panicles was significantly influenced by compound fertilizer application. The number of grains per spike was less dependent on nitrogen fertilizer, significantly decreasing only when nitrogen was omitted. The seed setting rate was highly sensitive to nitrogen reduction and urea substitution with compound fertilizer. Thousand-grain weight remained unaffected across treatments. Excessive nitrogen reduction caused a significant decrease in the effective number of panicles in both varieties.
3.2. The Impact of Nitrogen Fertilizer Management on the Quality Composition Indicators of Rice
3.2.1. The Impact of Nitrogen Fertilizer Management on Processing Quality
As shown in
Table 3, For Nanjing 9108, the brown rice rate was significantly lower than CK under the N1, N2, N3, N4, N6, and N8 treatments, with reductions of 3.46%, 3.21%, 3.98%, 3.98%, 1.63%, and 1.36%, respectively. The polished rice rate of Nanjing 9108 was significantly lower than CK under the N3 and N6 treatments, with reductions of 5.24% and 3.35%, respectively. The whole rice rate was significantly lower than CK under the N3 and N5 treatments, with reductions of 8.35% and 2.58%, respectively.
For Ming 1 Youzhenzhan, the brown rice rate was significantly lower than CK under the N2, N3, N4, and N8 treatments, with reductions of 2.98%, 2.73%, 1.86%, and 2.36%, respectively. No significant differences in polished rice rate and whole rice rate were observed under the N1-N8 treatments compared to CK.
In summary, the quality parameters of Nanjing 9108 (japonica rice) were more sensitive to both the rate and type of nitrogen fertilizer applied, as evidenced by significant decreases in brown rice rate, polished rice rate, and whole rice rate. Conversely, Ming 1 Youzhenzhan (indica rice) exhibited significant changes only in brown rice rate, while polished rice rate and whole rice rate remained largely stable, indicating a lower sensitivity to nitrogen fertilizer variations.
3.2.2. The Impact of Nitrogen Fertilizer Management on Appearance Quality
Table 4 shows the changes in the appearance quality of rice under different nitrogen fertilizer treatments. For Nanjing 9108, no significant differences in grain length, grain width, or grain shape were observed under the N1-N8 treatments compared to CK. The chalkiness rate and chalkiness degree of Nanjing 9108 were significantly higher than CK under the N2, N3, N4, N5, N6, and N8 treatments, with increases of 16.85%, 7.41%, 16.31%, 20.62%, 19.81%, and 5.66%, and 49.57%, 17.24%, 58.19%, 59.48%, 57.76%, and 15.09%, respectively. The chalkiness rate and degree were significantly lower than CK, decreasing by 7.14% and 8.62%, respectively. Under the N5 and N6 treatments, the transparency was significantly increased compared to CK, with increases of 25% for both.
For Ming 1 Youzhenzhan, no significant differences in grain length, width, shape, or transparency were observed under the N1–N8 treatments compared to CK. However, the chalkiness rate and chalkiness degree of Ming 1 Youzhenzhan were significantly lower than CK under the N1, N6, N7, and N8 treatments, with decreases of 18.87%, 9.43%, 38.99%, and 37.74%, and 9.76%, 26.83%, 51.22%, and 46.34%, respectively. In contrast, under the N2–N5 treatments, the chalkiness rate significantly increased compared to CK, reaching 27.67%, 18.24%, 40.25%, and 33.33%, while the chalkiness degree increased by 29.27%, 24.39%, 29.27%, and 26.83%, respectively.
In summary, a substantial reduction in nitrogen fertilizer or alterations in fertilization strategies significantly affect the chalkiness rate and chalkiness degree of japonica rice, with panicle fertilizer having a particularly strong influence on grain transparency. For indica rice, a moderate reduction or complete cessation of nitrogen fertilizer application, as well as the substitution of urea with compound fertilizer, can effectively reduce the chalkiness rate and degree. However, excessive nitrogen reduction or halving the panicle fertilizer application may lead to a decline in rice appearance quality.
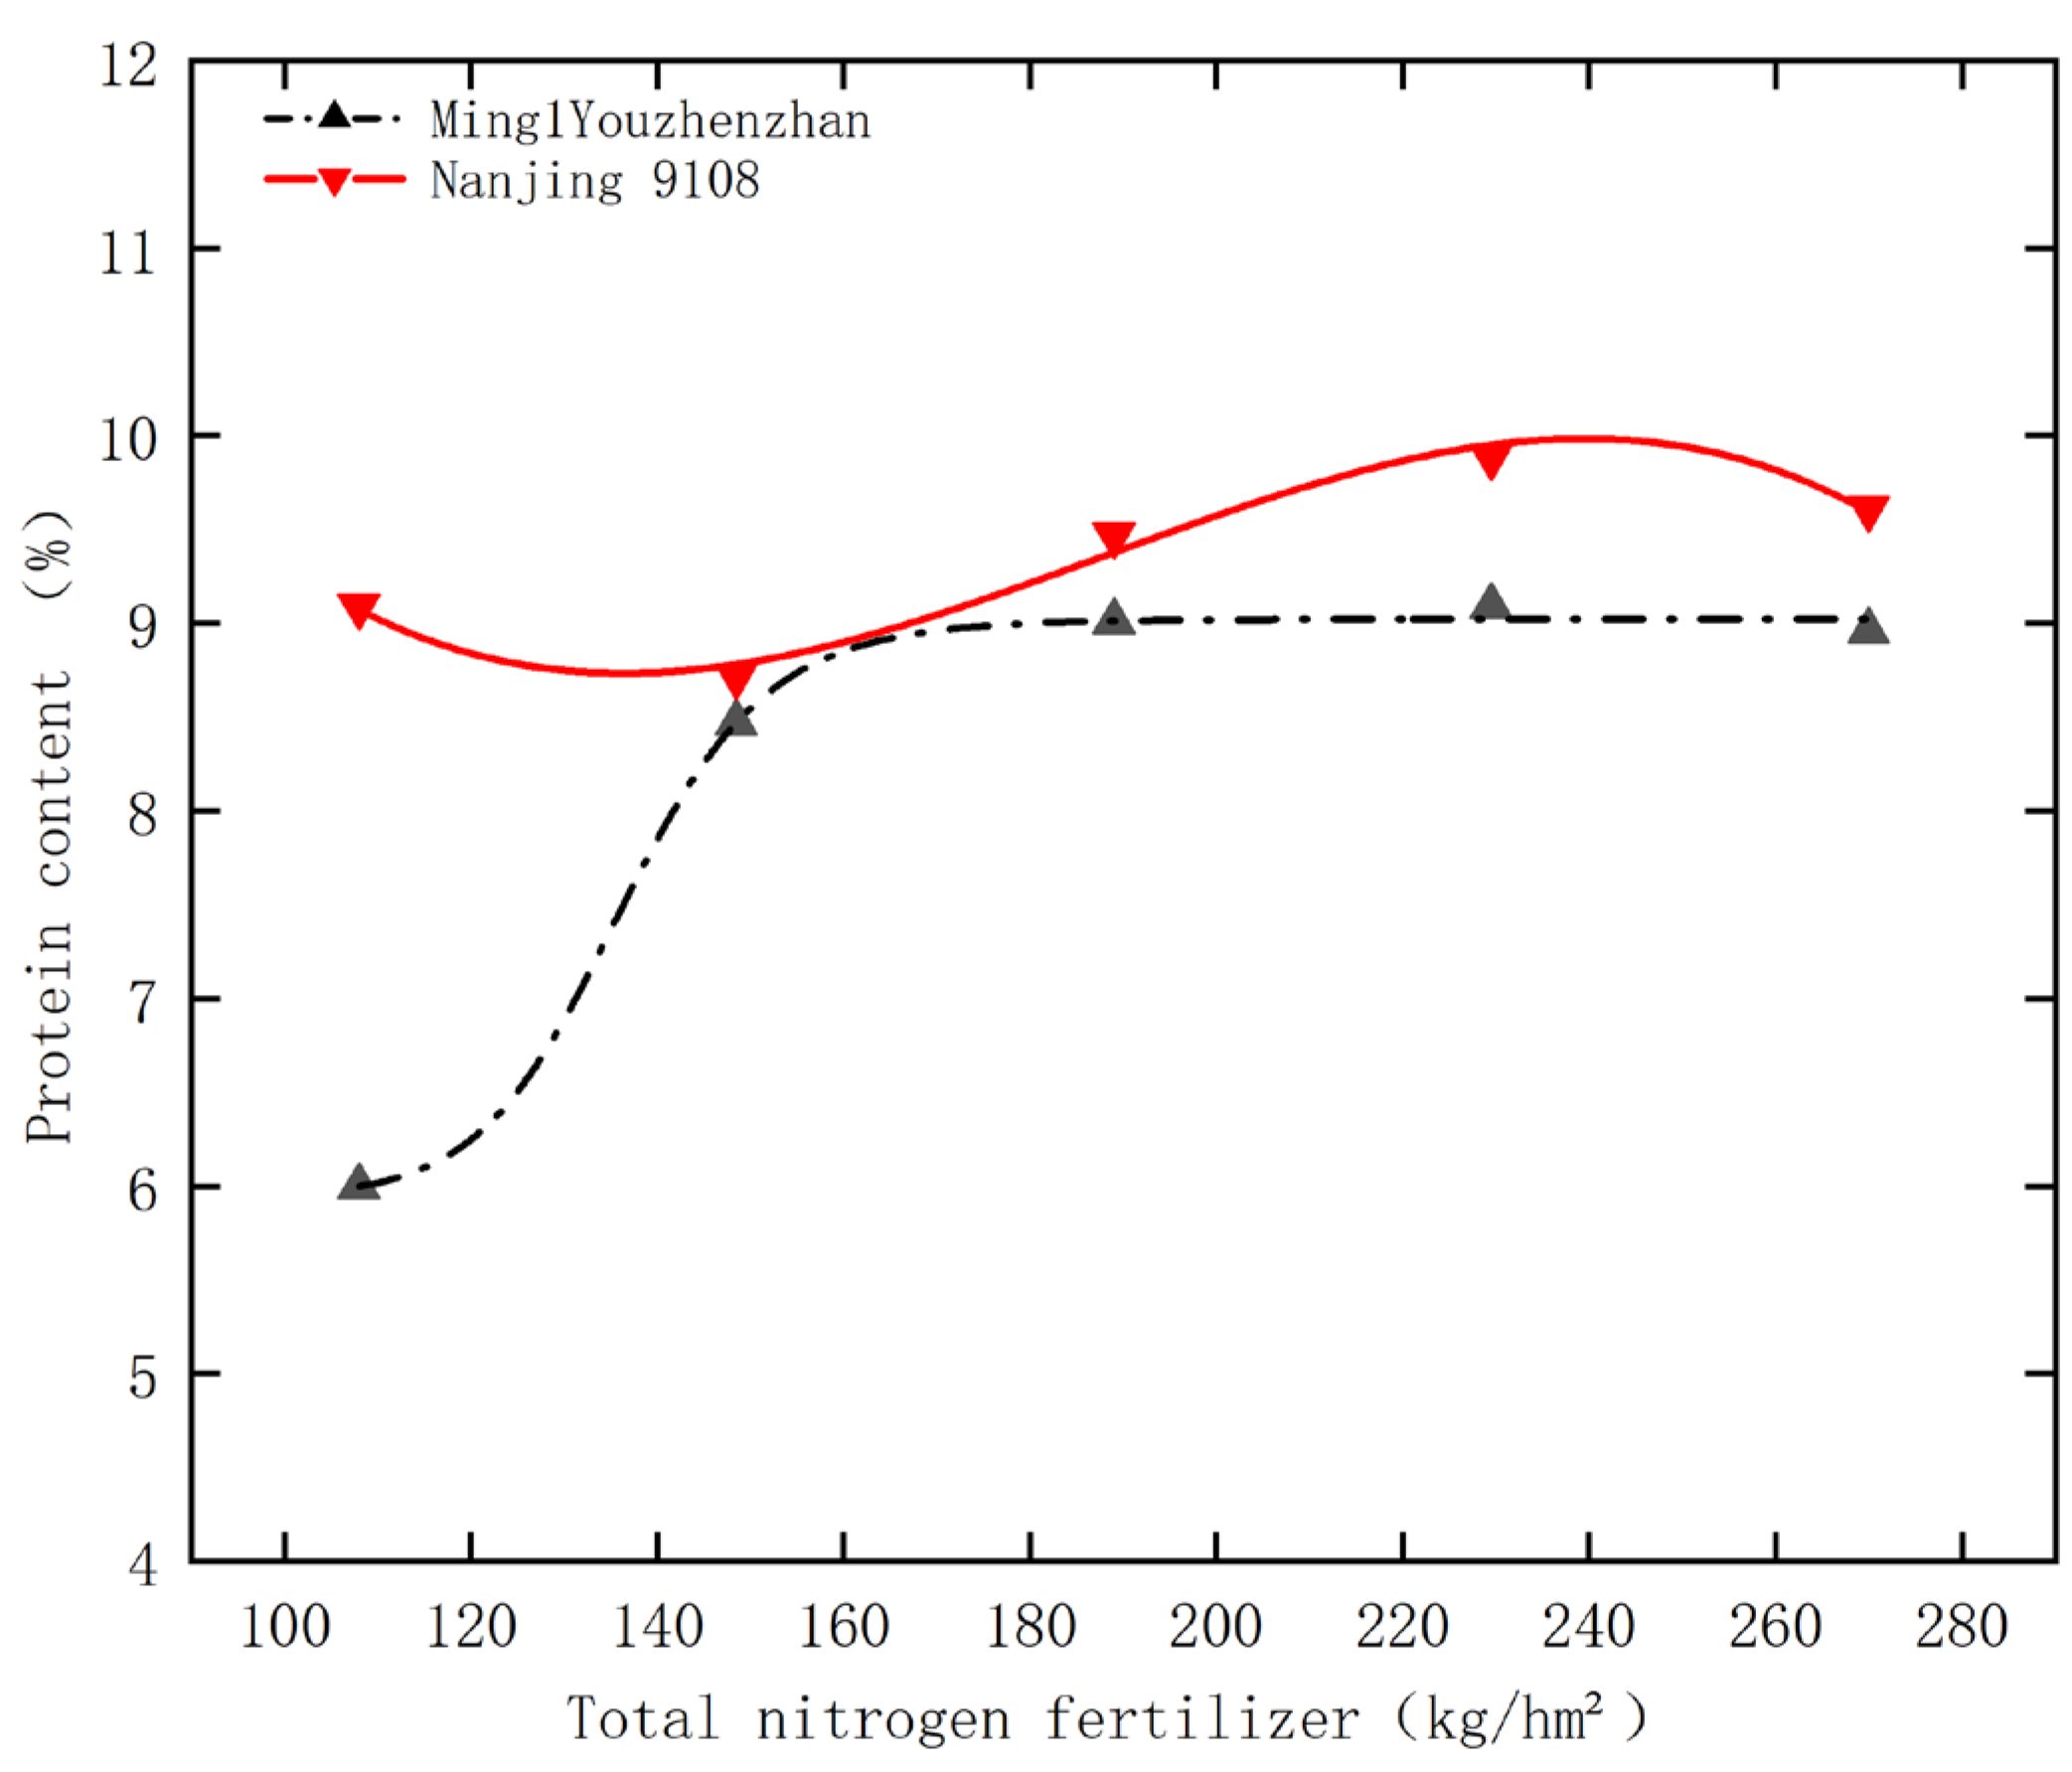
3.2.3. The Impact of Nitrogen Fertilizer Management on Protein Content
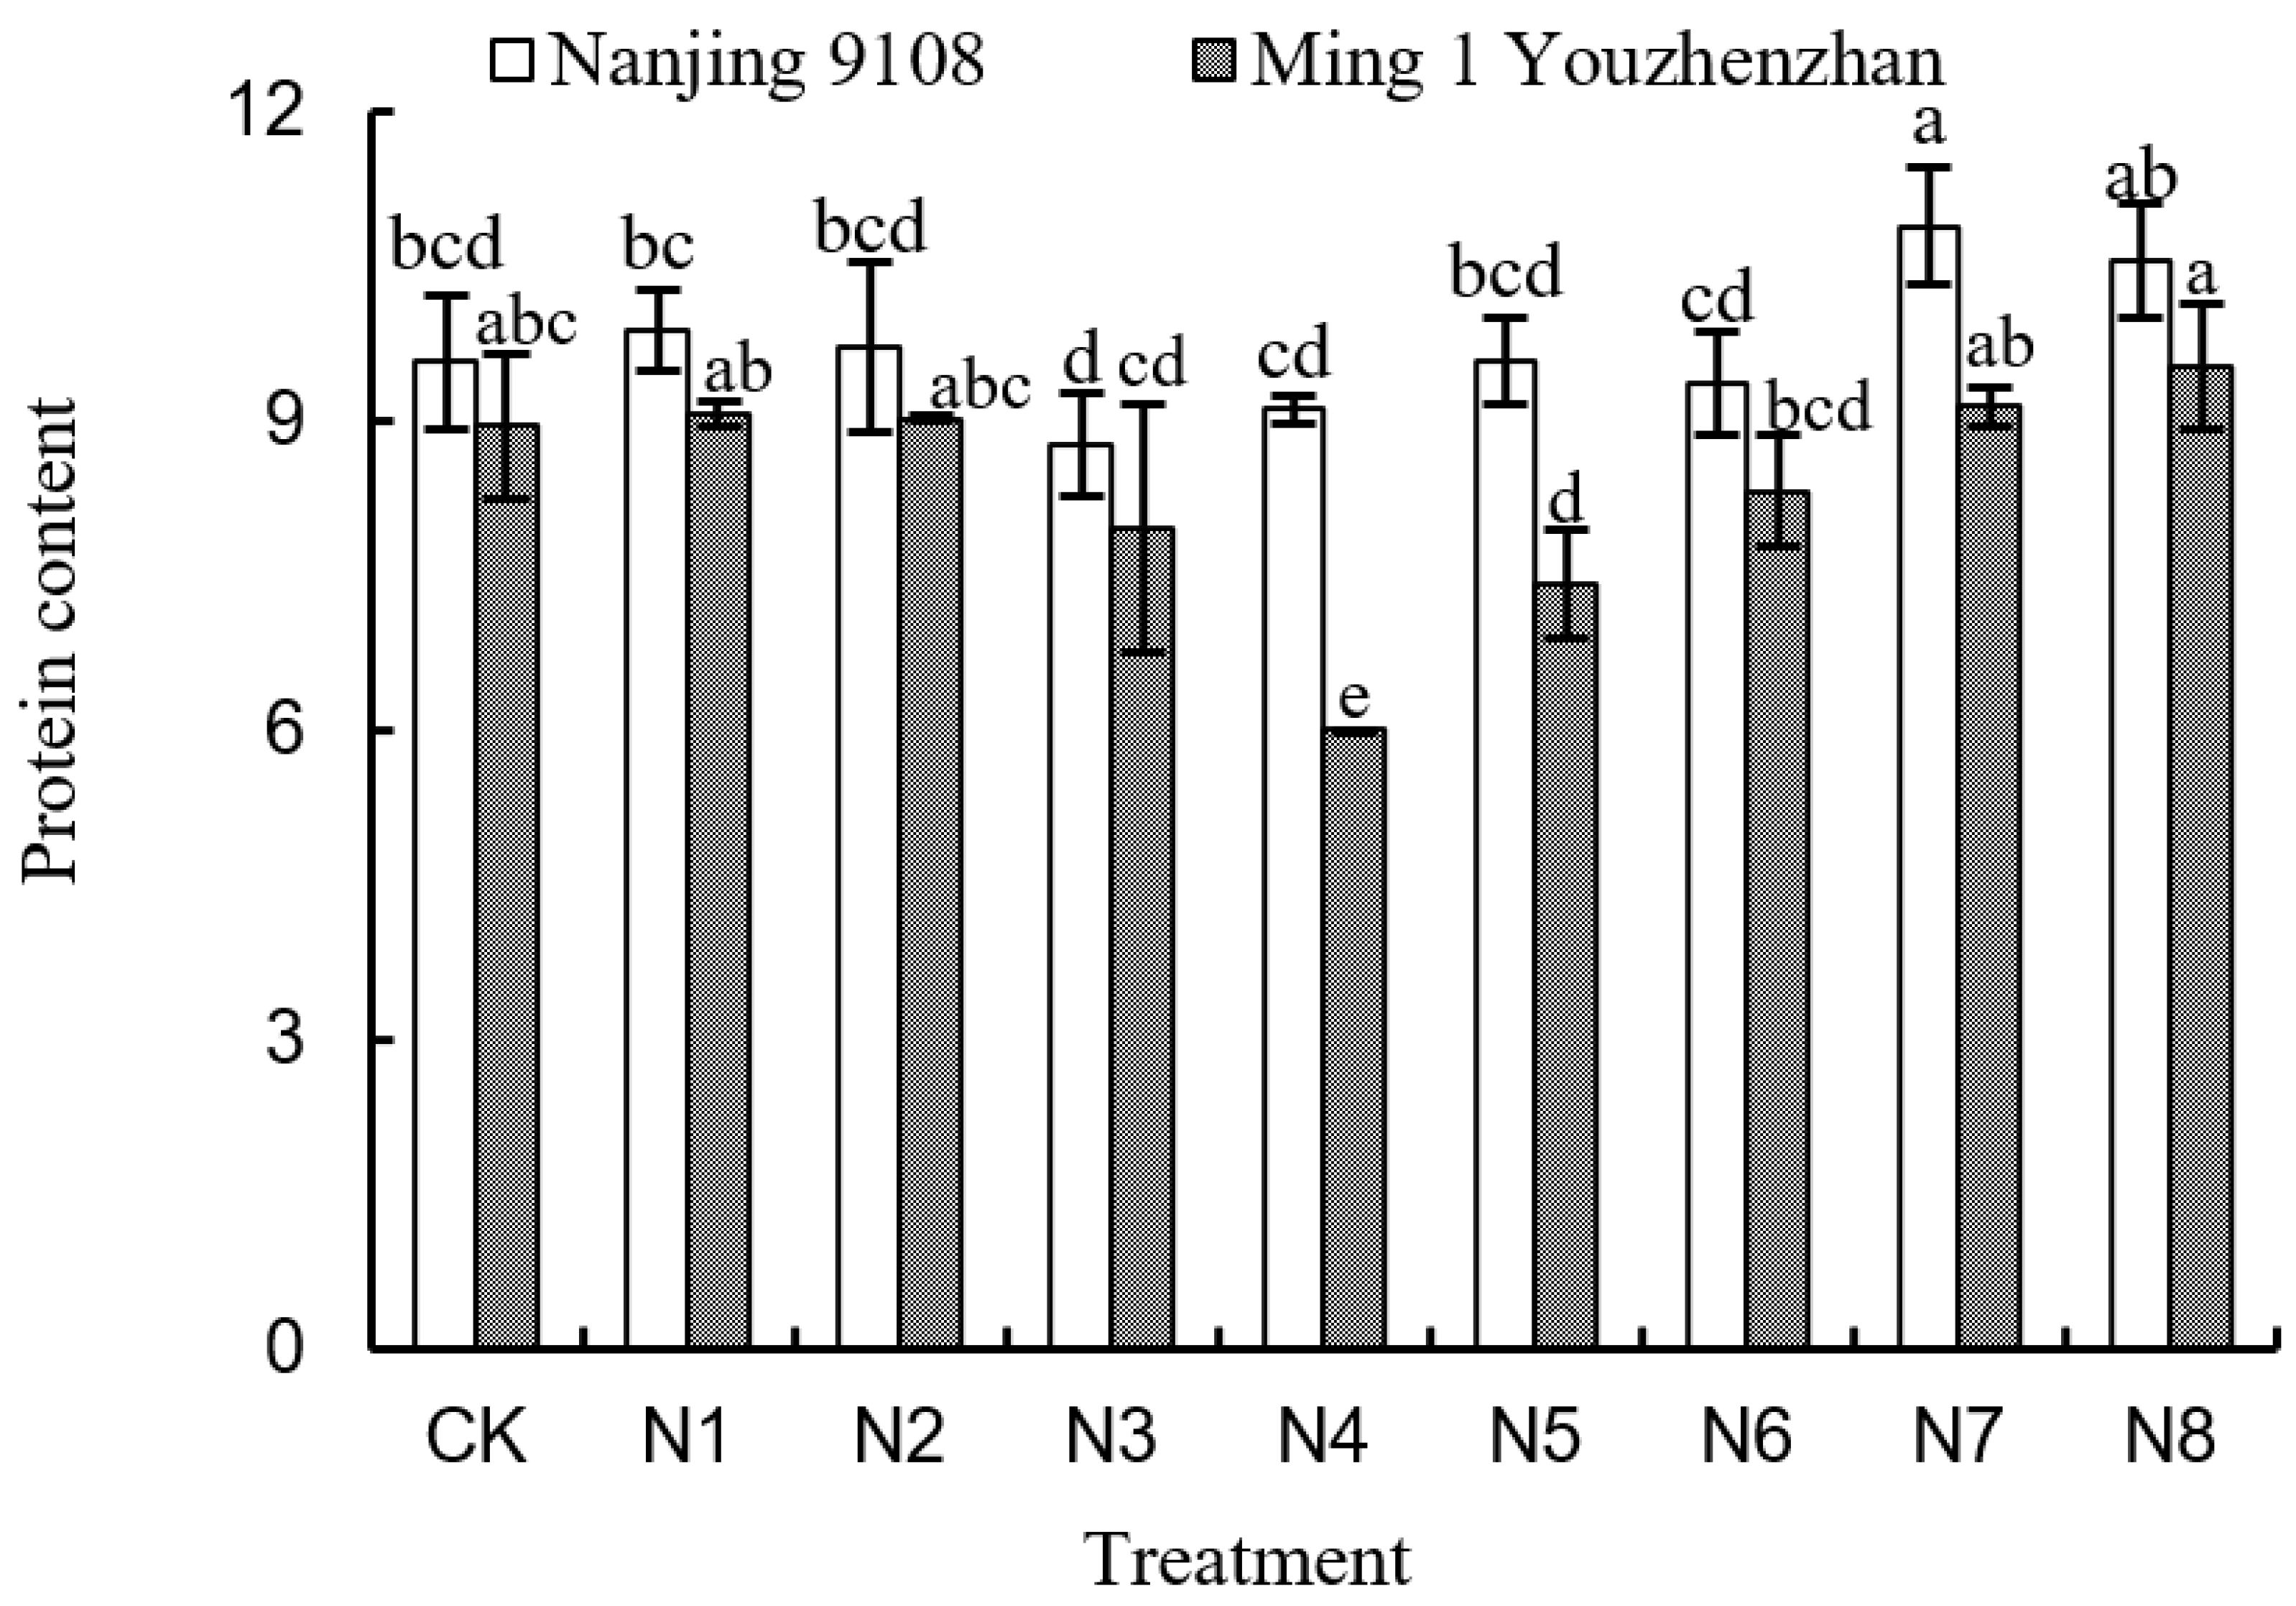
In this study, protein content was selected as a representative indicator of rice nutritional quality. As shown in
Figure 2, for Nanjing 9108, the protein content under the N7 treatment was significantly higher than that of the control (CK), with an increase of 13.74%. For Ming 1 Youzhenzhan, the protein content was significantly lower than CK under the N4 and N5 treatments, decreasing by 32.91% and 17.19%, respectively. Increasing the proportion of compound fertilizer in place of urea can significantly enhance the protein content of both japonica and indica rice. Additionally, the protein content of indica rice is strongly influenced by the total amount of nitrogen fertilizer applied.
3.2.4. Effect of Nitrogen Fertilizer Management on Cooking and Taste Quality
As shown in
Table 5, the amylose content of Nanjing 9108 under the N6 treatment was significantly lower than that of the control (CK), decreasing by 7.53%. For Nanjing 9108, the gel consistency under the N7 treatment was significantly higher than that of CK (by 2.86%), whereas it was significantly lower under all other treatments. The alkali spreading value was significantly higher than CK under the N1, N3, N4, and N7 treatments, increasing by 1.72%, 3.45%, 3.45%, and 3.45%, respectively. In contrast, the value was significantly lower than CK under the N2, N5, and N6 treatments, with reductions of 3.45%, 5.17%, and 5.17%, respectively. The taste value was significantly higher than CK under the N1–N4 and N6 treatments, with increases of 3.21%, 2.85%, 5.67%, 4.01%, and 4.91%, respectively, whereas it was significantly lower under the N8 treatment (by 2.98%)
For Ming 1 Youzhenzhan, the amylose content under the N5 treatment was significantly lower than that of CK, decreasing by 7.75%. The gel consistency was significantly higher than CK under the N2, N4, N5, and N8 treatments, with increases of 5.70%, 6.96%, 7.59%, and 1.90%, respectively. Conversely, the gel consistency under the N6 and N7 treatments was significantly lower than CK, by 2.53% for both treatments. The alkali spreading value was significantly lower than CK under the N1, N2, N5, N6, and N8 treatments, decreasing by 10.34%, 13.79%, 5.17%, 5.17%, and 1.72%, respectively. The taste value was significantly higher than CK under the N1, N4, N5, and N6 treatments, increasing by 2.36%, 4.68%, 4.55%, and 3.73%, respectively, while the N7 and N8 treatments led to significantly lower taste values compared to CK, decreasing by 2.61% and 1.41%.
In summary, rational application of panicle fertilizer can regulate amylose content in both indica and japonica rice, while appropriate use of compound fertilizer enhances gel consistency in japonica rice. Adjustments in nitrogen fertilizer type and quantity can improve gel consistency in indica rice, and controlling both total nitrogen and panicle fertilizer application helps prevent excessive alkali spreading values. Moderate nitrogen reduction, optimized panicle fertilization, and avoiding excessive substitution of urea with compound fertilizer are effective strategies for improving rice eating quality.
3.3. Changes in Rice Quality with Total Nitrogen Fertilizer Content
3.3.1. Quantitative Relationship and Testing of Total Nitrogen Application on Rice Quality
In the total nitrogen fertilizer experiment, different types of functions were fitted to the relationship between nitrogen application levels and various rice quality traits. The function with the lowest mean square error (
MSE) was selected, and the coefficient of determination (
R2) was calculated to assess the goodness of fit.
Table 6 and
Table 7 present the fitting functions for the quality traits of Nanjing 9108 and Ming 1 Youzhenzhan, respectively. Except for the relationship between amylose content and total nitrogen fertilizer, which showed a poor fit, the
R2 values for the other quality indicators met statistical standards and demonstrated good model performance.
3.3.2. Changes in Processing Quality with Total Nitrogen Application
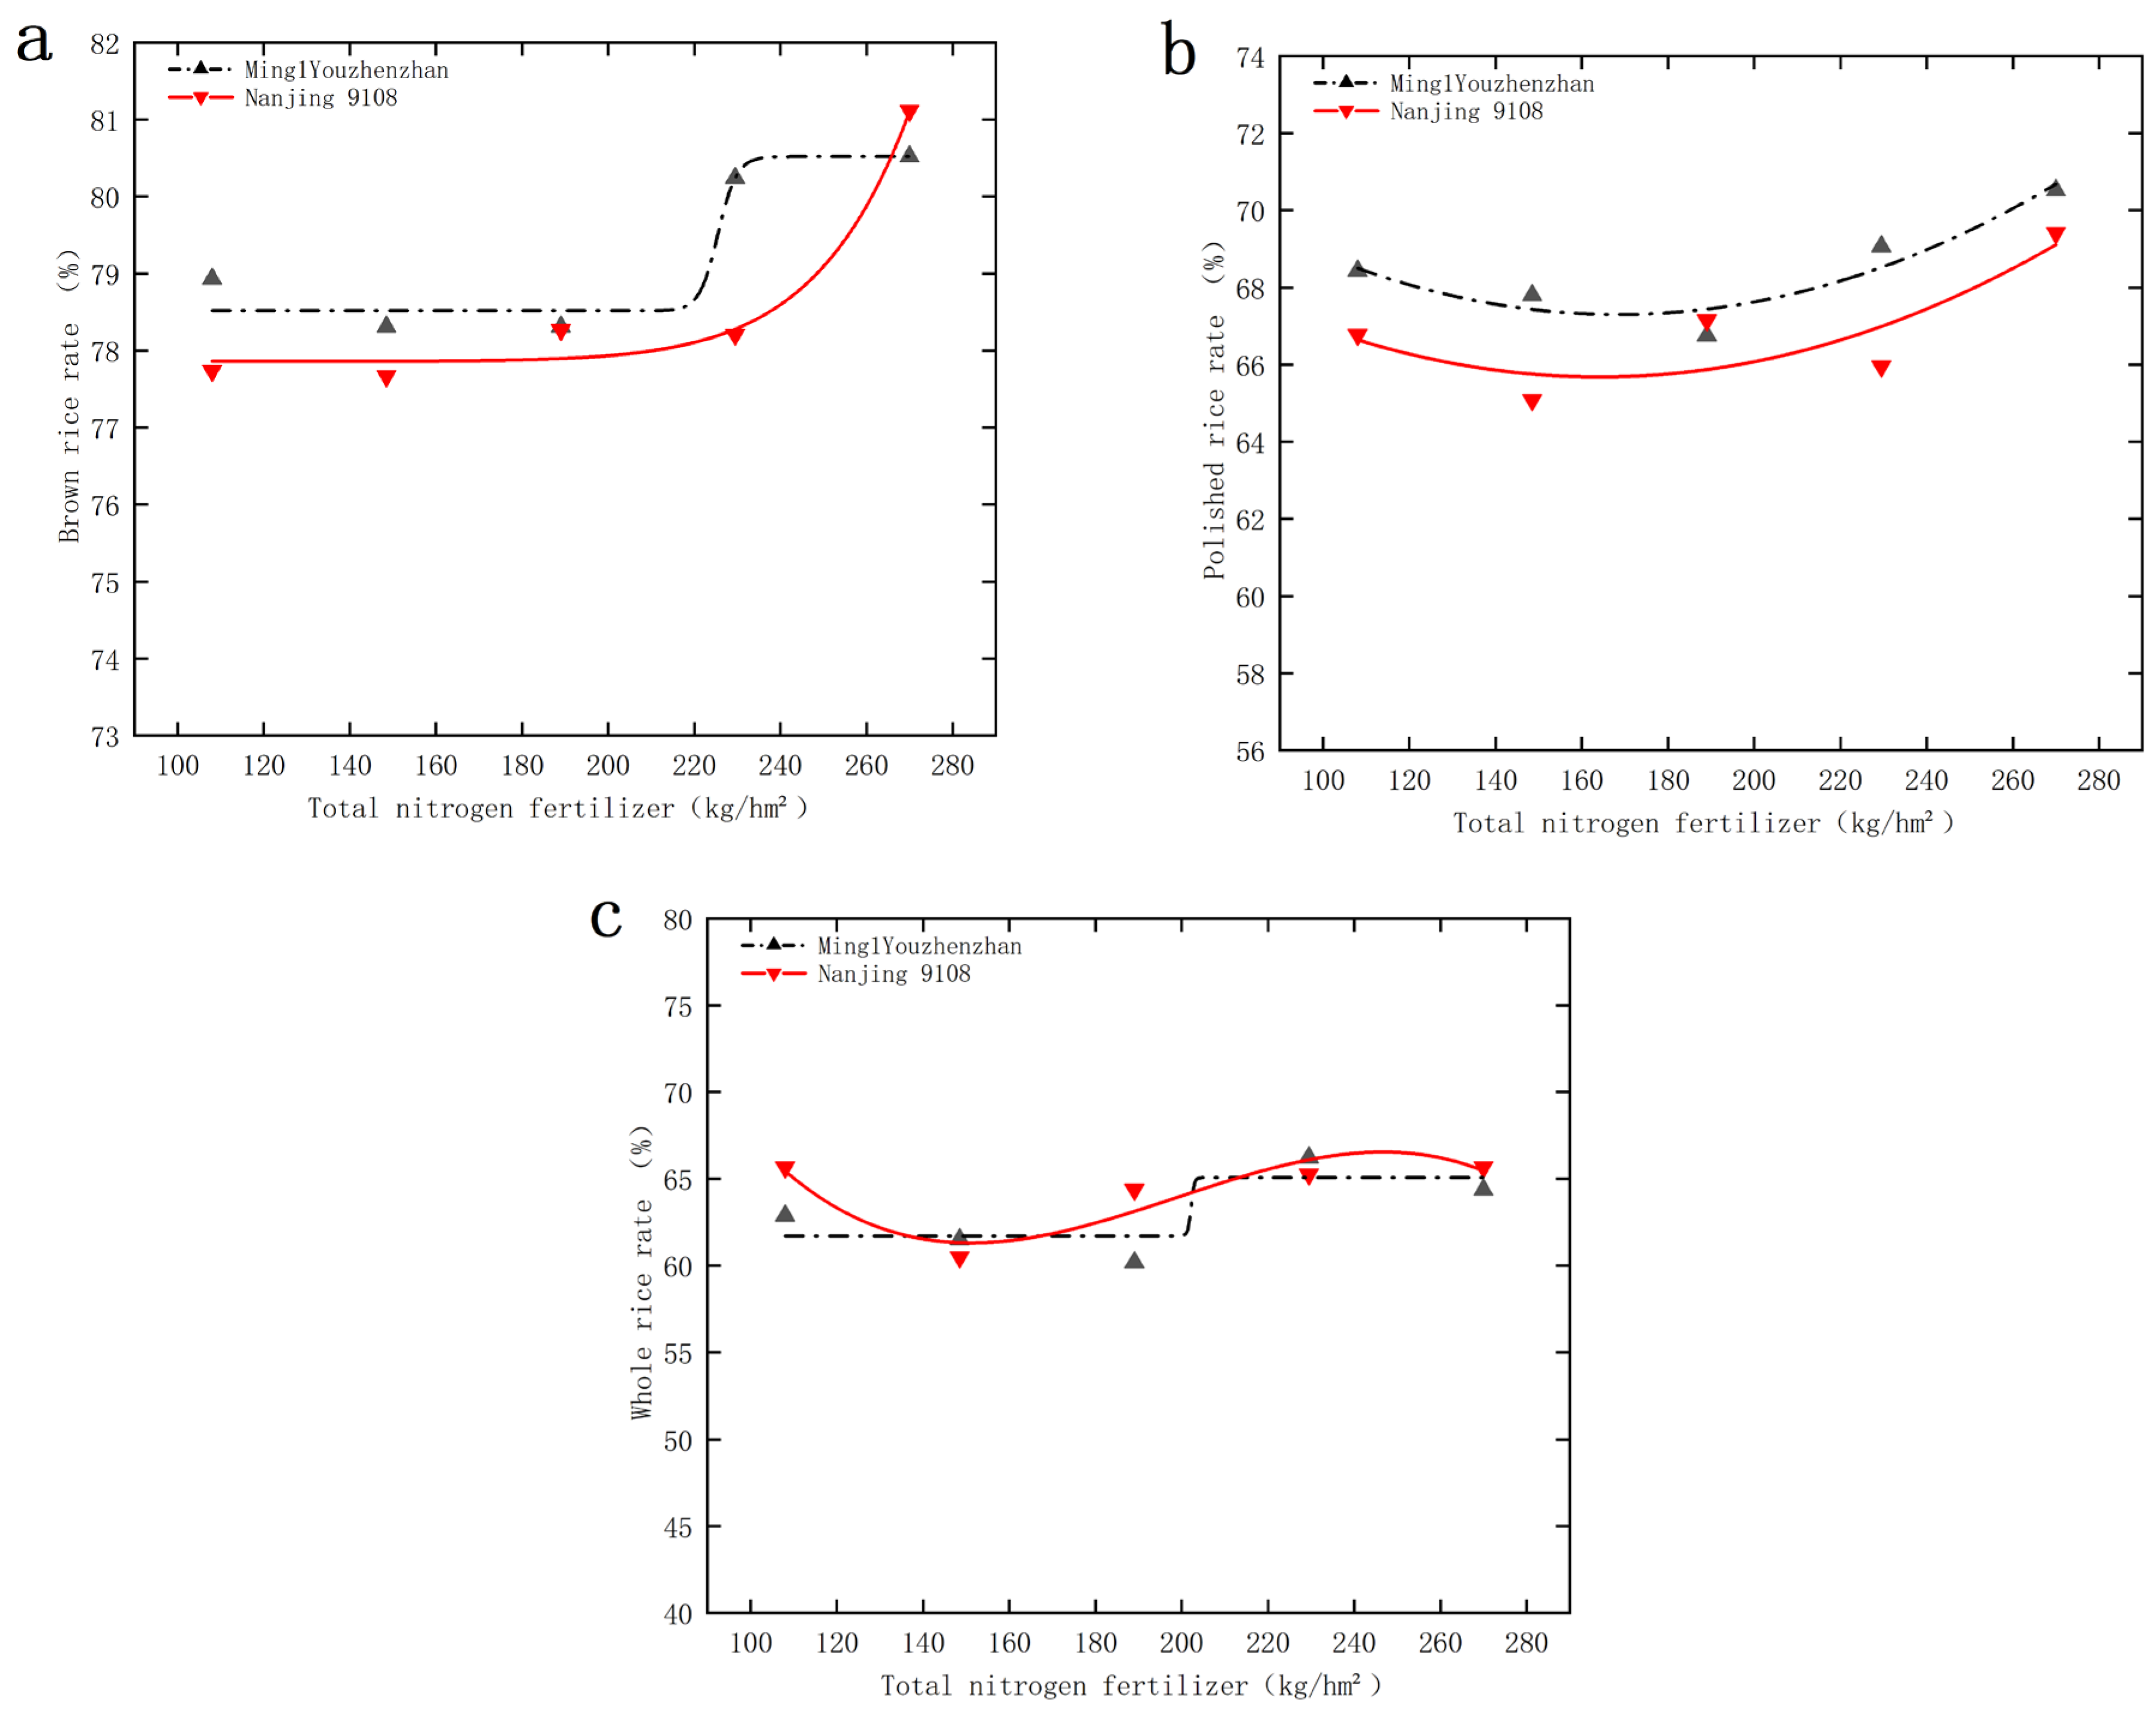
Figure 3 illustrates the variation curves of three processing quality traits for the two experimental rice varieties under different total nitrogen fertilizer treatments. In the case of Nanjing 9108, the brown rice rate showed a significant decrease under the N1 treatment (229.5 kg/hm
2), while the changes between N2 and N4 (189–108 kg/hm
2) were relatively stable. The polished rice rate exhibited a trend of gradual decline followed by recovery as the nitrogen fertilizer reduction increased. The whole rice rate initially decreased and then increased with the reduction in nitrogen application.
For Ming 1 Youzhenzhan, the brown rice rate significantly declined under the N2 treatment. The fitting curve for the polished rice rate showed a gentle downward trend followed by a slight rebound, reaching its lowest point at the N3 treatment. The whole rice rate demonstrated a consistent downward trend with increasing nitrogen reduction but slightly increased at N4 compared to N3.
3.3.3. Changes in Appearance Quality with Total Nitrogen Application
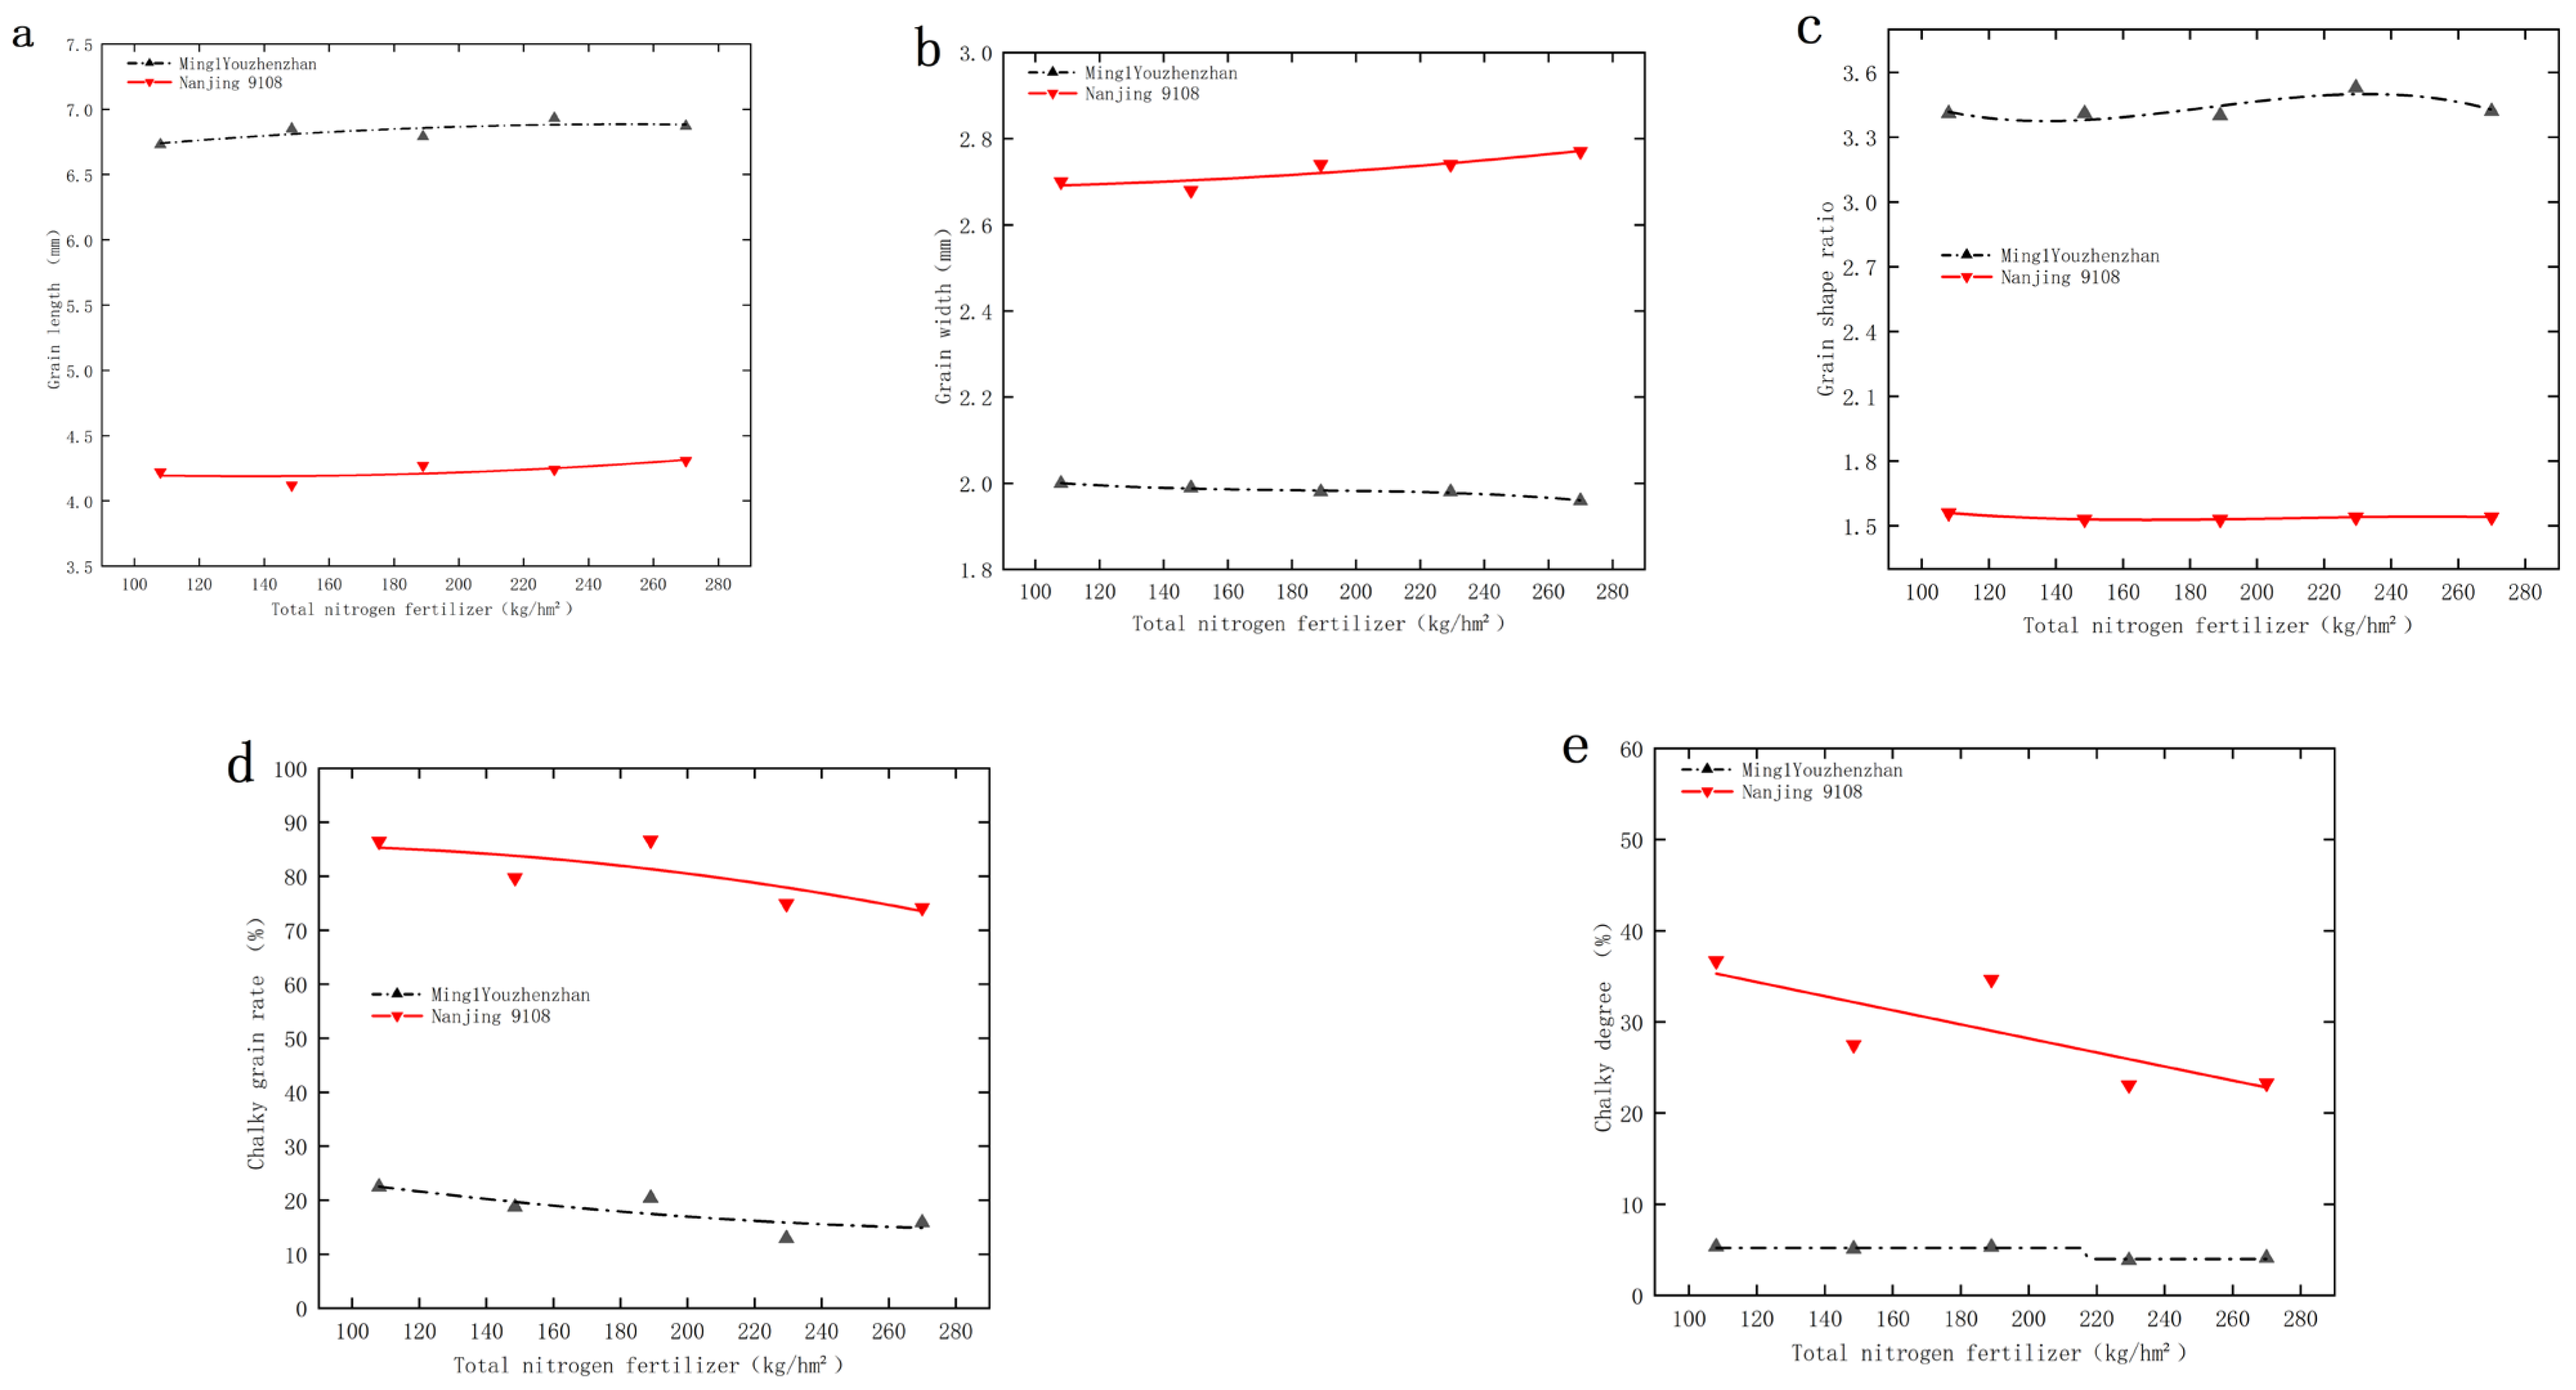
As shown in
Figure 4, in the total nitrogen fertilizer experiment for Nanjing 9108, the grain length remained relatively stable. The grain width and grain shape exhibited a gradual downward trend as the nitrogen fertilizer reduction increased. Meanwhile, the chalkiness rate and chalkiness degree showed a fluctuating upward trend with decreasing nitrogen application.
In the total nitrogen fertilizer experiment for Ming 1 Youzhenzhan, the grain length, grain width, and grain shape remained relatively stable. However, as the total amount of nitrogen decreased and the reduction ratio increased, the chalkiness rate and chalkiness degree initially decreased and then gradually increased.
Overall, except for the chalkiness traits in japonica rice, other appearance quality indicators did not show significant changes with varying total nitrogen application.
3.3.4. Changes in Protein Content with Total Nitrogen Fertilizer
As shown in
Figure 5, the protein content of Nanjing 9108 in the total nitrogen fertilizer experiment fluctuated slightly under the N1 and N2 treatments. According to the fitted curve, as the total nitrogen application decreased, the protein content showed a gradual increase, followed by a slight decline and then a modest rebound.
For Ming 1 Youzhenzhan, the protein content began to decrease significantly starting from the N3 treatment in the total nitrogen fertilizer experiment.
3.3.5. Changes in Cooking and Taste Quality with Total Nitrogen Fertilizer Content
Figure 6 illustrates the variation in cooking and taste quality of rice under different nitrogen fertilizer application levels. In the total nitrogen fertilizer experiment for Nanjing 9108, there were no significant differences in amylose content across treatments, and the fitting curve remained relatively flat. Gel consistency showed a significant drop at the N3 treatment, followed by a rebound at N4. The fitting curve for the alkali spreading value remained relatively stable before N3, but showed an upward trend under the N4 treatment. The taste value curve exhibited a pattern of initially increasing and then decreasing as the level of nitrogen fertilizer reduction increased.
For Ming 1 Youzhenzhan, the fitting curve for amylose content showed a slow rise followed by a slight decline with increased nitrogen reduction. The gel consistency curve showed overall fluctuations with a general upward trend. The alkali spreading value followed a U-shaped pattern, decreasing first and then increasing. The taste value showed a fluctuating upward trend as nitrogen fertilizer application was reduced.
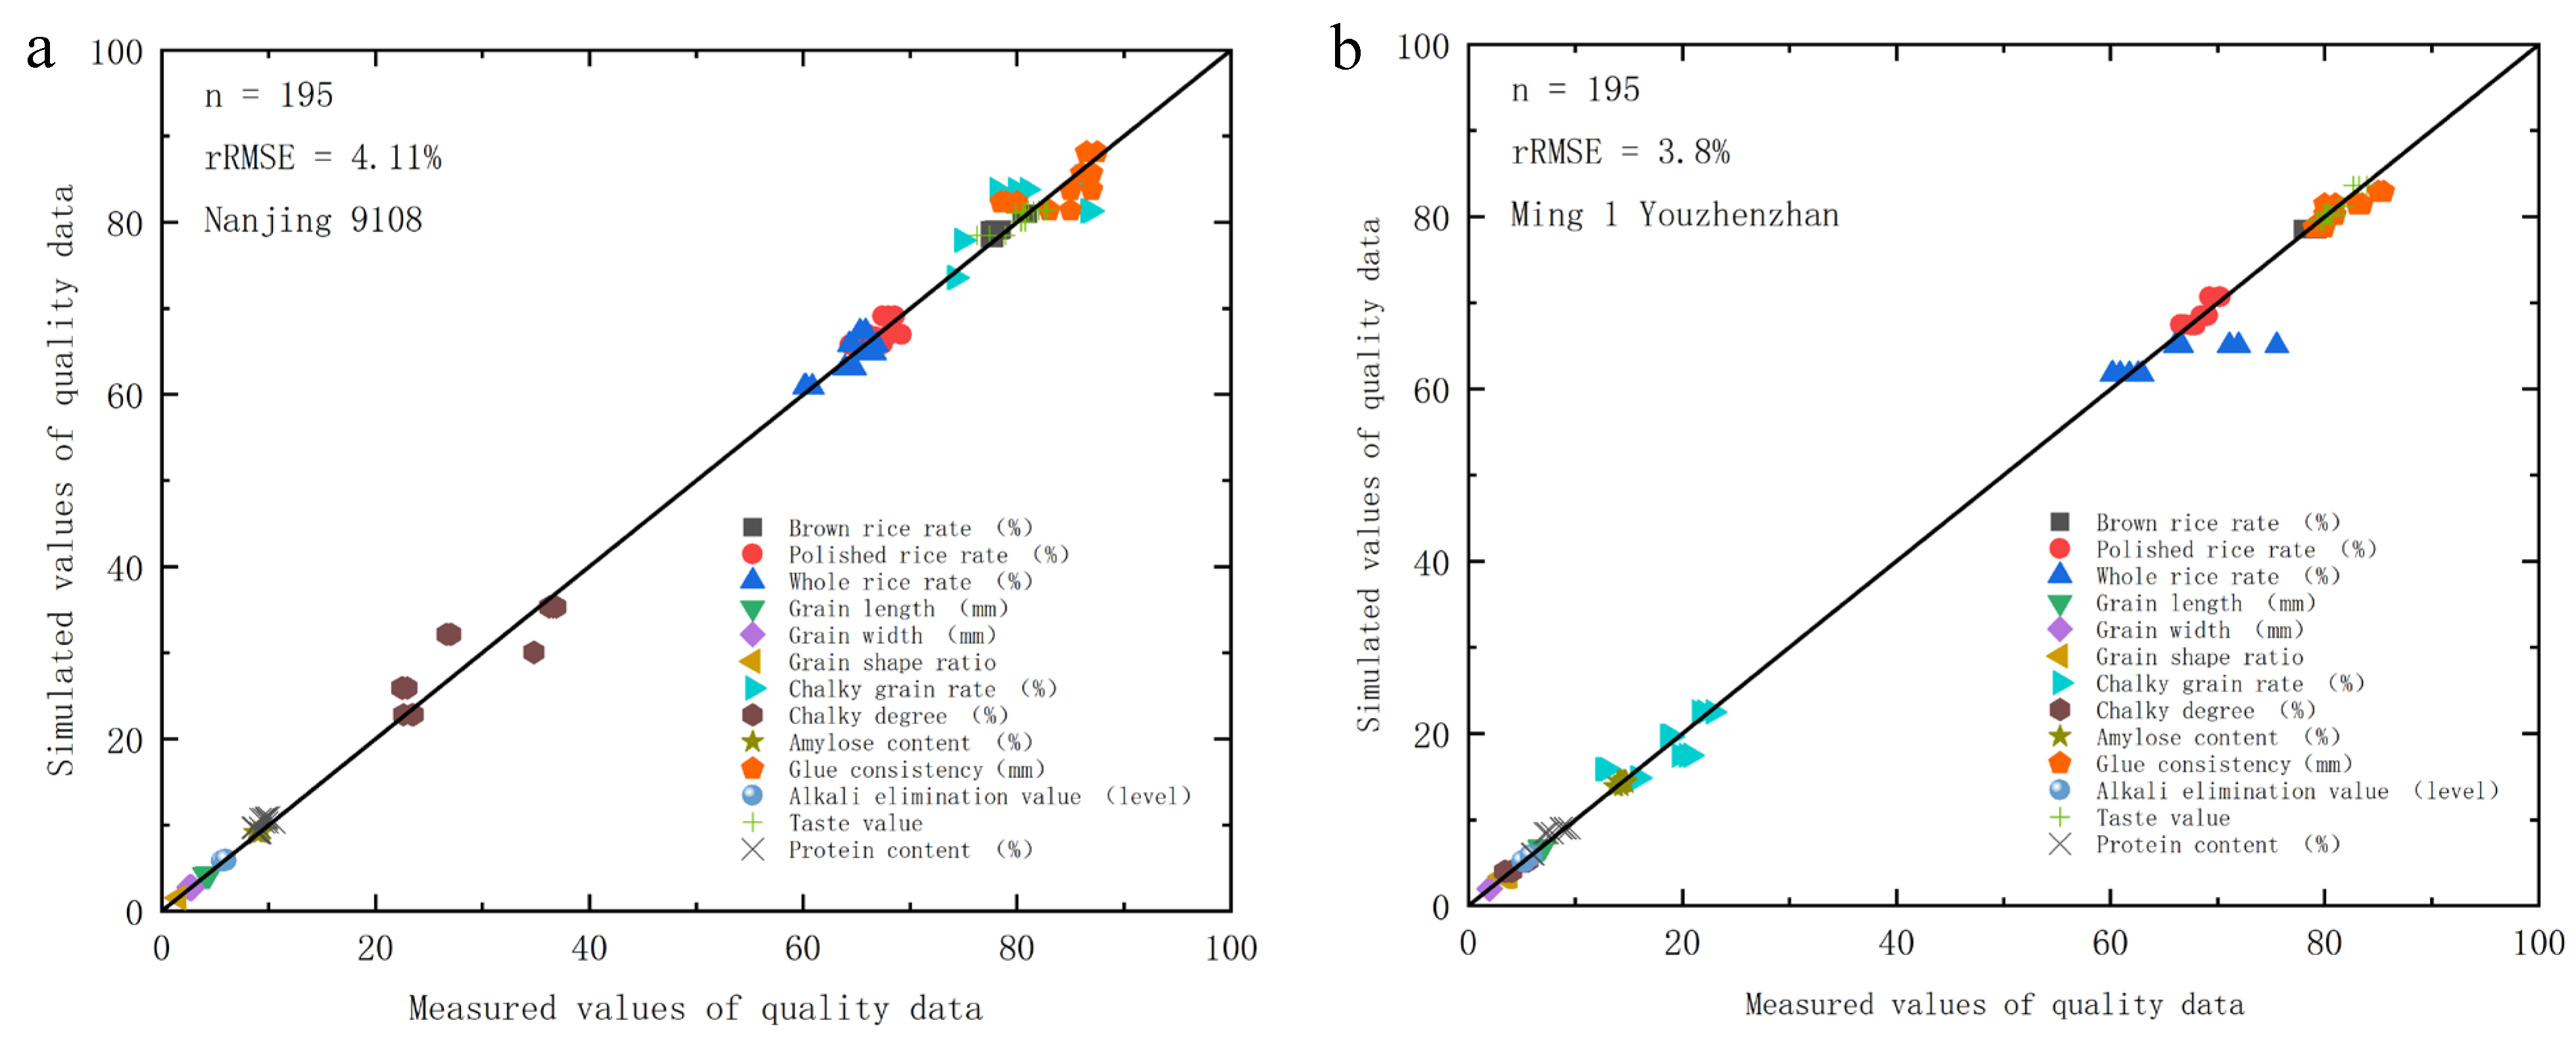
3.3.6. Model Verification
The rice quality data of the two tested varieties under different total nitrogen fertilizer control experiments in 2022 were used to test each fitting model (
Figure 6).
As shown in
Figure 7, the relative root mean square errors (
RMSEs) for the rice quality indicators of Nanjing 9108 and Ming 1 Youzhenzhan were 4.11% and 3.8%, respectively. These values indicate that the fitting models accurately predict the changes in quality indicators for both varieties under different total nitrogen fertilizer treatments.
3.4. The Impact of Nitrogen Fertilizer Management on Nitrogen Absorption and Transport
As shown in
Table 8, for Nanjing 9108, no significant differences were observed in the leaf nitrogen transport rate, the whole-plant nitrogen transport rate, or the contribution rate of leaf nitrogen transport to panicles under the N1–N8 treatments when compared to the control (CK). However, the stem nitrogen transport rate under the N5 and N8 treatments was significantly higher than CK, increasing by 20.00% and 100.00%, respectively. Nitrogen absorption efficiency was significantly lower than CK under the N1, N2, N6, and N8 treatments, with reductions of 22.81%, 35.09%, 12.28%, and 12.28%, respectively. However, under the N7 treatment, nitrogen absorption efficiency was significantly higher than CK, increasing by 19.30%. Furthermore, the contribution rate of stem nitrogen transport to panicles was significantly higher than CK under the N5 and N8 treatments, with increases of 147.06% and 123.53%, respectively.
For Ming 1 Youzhenzhan, no significant differences were found in stem nitrogen transport rate across all treatments compared to CK. However, under the N4 treatment, the leaf nitrogen transport rate was significantly higher than CK, increasing by 19.30%, while under N7 and N8 treatments, it was significantly lower than CK, decreasing by 52.63% and 59.65%, respectively. The whole-plant nitrogen transport rate under N7 and N8 also significantly increased compared to CK, reaching 100.00% and 85%, respectively. Nitrogen absorption efficiency was significantly lower than CK under N1 (by 10.00%), but significantly higher than CK under N2, N5, N7, and N8 treatments, increasing by 10.00%, 12.73%, 16.36%, and 14.55%, respectively. Under the N3 treatment, the contribution rate of stem nitrogen transport to panicles was significantly higher than CK, increasing by 15.38%. Conversely, the contribution rate of leaf nitrogen transport to panicles was significantly lower than CK under N7 and N8, with reductions of 77.78% and 75.93%, respectively.
In the case of japonica rice under different nitrogen fertilizer treatments, there was no significant effect on the leaf nitrogen transport rate, the whole-plant nitrogen transport rate, or the contribution of leaf nitrogen transport to panicles. Controlling the reduction in panicle fertilizer application and substituting compound fertilizers can help effectively transport and utilize nitrogen in stems. Furthermore, the rational application of compound fertilizers can improve nitrogen absorption efficiency. For indica rice, the nitrogen transport rate in stems is not highly sensitive to nitrogen fertilizer treatments. The complete absence of nitrogen fertilizer accelerates nitrogen transport in leaves. The use of compound fertilizers can modify the distribution of nitrogen within the plant. A moderate reduction in nitrogen fertilizer application is necessary; insufficient nitrogen fertilizer leads to a decrease in nitrogen absorption efficiency. In cases of severe nitrogen fertilizer deficiency, more nitrogen from the stems will be transported to the ears to support seed growth.
3.5. Analysis of the Relationship Between Yield, Quality, and Optimal Nitrogen Application Measures
3.5.1. Correlation Analysis Between Yield and Quality Composition Indicators
Based on the significance analysis of the relationship between nitrogen fertilizer management and rice quality composition indicators discussed earlier, the brown rice rate, chalky grain rate, protein content, and taste value were selected as representative indicators for rice processing quality, appearance quality, nutritional quality, and cooking taste quality, respectively.
As shown in
Table 9, the correlation coefficients between yield and representative quality indicators for the two tested varieties under different nitrogen fertilizer treatments were calculated and analyzed. The results indicated that the yield of Nanjing 9108 was significantly positively correlated with the brown rice rate and significantly negatively correlated with the taste value. In contrast, the yield of Ming 1 Youzhenzhan showed a significant negative correlation with the chalky grain rate.
3.5.2. Comprehensive Analysis of Optimal Nitrogen Application Measures
According to
Table 10, when considering all four quality indicators and maintaining a yield reduction of less than 30%, the N7 treatment, which involves 100% compound fertilizer, occurred most frequently as the optimal nitrogen application measure. The N5 and N6 treatments, which reduce or eliminate panicle fertilizer, tied for second place in frequency of occurrence, while the N8 treatment (50% compound fertilizer) had the lowest frequency. To optimize rice quality while ensuring yield, applying 100% compound fertilizer (N7) in japonica rice was found to have the best effect on quality improvement. Additionally, reducing panicle fertilizer by 50% (N5) or completely eliminating panicle fertilizer (N6) also yielded good quality results. The substitution of 50% compound fertilizer for chemical fertilizer (N8) can maintain a stable nutritional quality level without significant decline.
The N1 and N6 treatments of indica rice had the highest frequency of occurrence as optimal nitrogen management strategies, followed by the N7 treatment. The N5 and N8 treatments had an equal frequency of occurrence, ranking third. Due to the N6 treatment leading to a nearly 30% decrease in grain yield, it was not considered an optimal choice. Under the condition of ensuring that the yield reduction remains below 30%, the nitrogen application measure of reducing the total nitrogen fertilizer by 25% (N1) was found to be the most effective for improving quality in indica rice. Additionally, the nitrogen management strategy of replacing all chemical fertilizers with 100% compound fertilizer (N7) also achieved good quality outcomes. The application of a 50% reduction in panicle fertilizer (N5) and the substitution of 50% compound fertilizer for chemical fertilizer (N8) both showed moderate improvements in quality.
In summary, although the three nitrogen treatments that led to the best quality for the two tested rice varieties were not identical, quality improvements were observed under the following fertilization measures: reducing panicle fertilizer by 50% (N5), completely replacing chemical fertilizer with compound fertilizer (N7), and substituting 50% compound fertilizer for chemical fertilizer (N8). Therefore, adopting these three fertilization strategies can ensure the best quality while also considering yield.
4. Discussion
The key to improving rice yield lies in the effective coordination and optimization of yield components such as the number of effective panicles, grains per panicle, 1000-grain weight, and seed setting rate. Nitrogen fertilizer significantly influences the formation of yield components [
18,
19]. Nitrogen reduction treatments usually result in fewer effective panicles and lower grain numbers per unit area, ultimately leading to yield loss [
20,
21]. However, rice spike traits tend to perform better under low or moderate nitrogen input, with larger spikes and fuller grains [
22]. While some studies have shown that nitrogen application has minimal impact on grains per spike or 1000-grain weight [
23], many report significant reductions in these traits with declining nitrogen levels, although the seed setting rate may conversely improve [
24].
In the present study, reductions in total nitrogen application led to yield decreases in both japonica and indica rice. Indica rice exhibited higher sensitivity to nitrogen reduction, while japonica rice showed a stronger dependence on panicle fertilizer. Notably, replacing urea with compound fertilizer effectively increased the yield of indica rice. Excessive nitrogen reduction caused a pronounced drop in the number of effective panicles in both varieties. These findings align with previous work [
25,
26].
Rice processing quality, determined by milling efficiency and commercial rice yield, is also influenced by nitrogen levels. A declining trend in brown rice rate and whole semolina percentage has been reported under reduced nitrogen input [
27]. Our results confirm that japonica rice is more sensitive to both nitrogen quantity and source. Adjustments to fertilization strategies significantly affected its brown rice rate, polished rice rate, and whole rice rate. Indica rice, however, maintained more stable processing quality under different nitrogen schemes, likely due to its genetic traits and superior adaptability to nutrient stress [
28].
Regarding appearance quality—an attribute closely tied to consumer preference—our results demonstrated that excessive nitrogen reduction or inappropriate fertilization increased chalkiness in japonica rice. In contrast, moderate nitrogen reduction or partial replacement of urea with compound fertilizer reduced chalkiness in indica rice, highlighting the agronomic relevance of tailoring nitrogen management to rice type [
29,
30].
Protein content, a major nutritional quality indicator, was enhanced in both rice types through the substitution of urea with compound fertilizer. This strategy offers a practical agronomic advantage by simultaneously increasing protein levels and promoting nitrogen use efficiency [
31,
32,
33]. For eating quality, our findings suggest that rational application of panicle fertilizer can regulate amylose content, while compound fertilizer improves gel consistency and controls alkali spreading value in both rice types. Overuse of nitrogen or panicle fertilizer, however, may disturb starch structure, reducing taste quality [
34,
35,
36,
37].
In this study, the quantitative relationship between total nitrogen application and rice quality was verified by fitting a function based on the total nitrogen application and the rice quality data of the two test varieties, which provides a theoretical basis for the construction and research of the synergistic simulation model of rice quantity and quality in the later stage. In order to avoid overfitting, the method of penalizing complex models, i.e., the more parameters in the fitting function, the smaller the degree of freedom and the larger the corresponding MSE, is used to select a concise expression of the fitting function, and to balance the fitting accuracy and generalization ability.
Nitrogen uptake and transport efficiency differ between rice varieties [
38,
39]. The results showed that for japonica rice, reducing panicle fertilizer while substituting urea with compound fertilizer facilitated effective nitrogen transport from stems to panicles and improved nitrogen uptake. In contrast, indica rice’s stem nitrogen transport rate was relatively insensitive to nitrogen adjustments. These differences likely stem from varietal variation in nitrogen form utilization and transport efficiency [
40]. Importantly, nitrogen reduction should be moderate—excessive reduction lowers nitrogen uptake and affects quality formation. Our findings reinforce the need for variety-specific fertilization strategies to optimize nitrogen use efficiency, yield, and quality concurrently.
A key challenge in commercial rice production is reconciling yield and quality, as higher yields are frequently obtained at the expense of grain quality. Identifying fertilization strategies that allow producers to achieve both goals has therefore become a priority. Slow-release nitrogen sources (e.g., controlled-release urea) can partially address this conflict by synchronizing nitrogen supply with crop demand [
41,
42]. However, our results indicate that additional gains can be achieved by strategically substituting urea with compound fertilizer that supplies balanced macro- and micronutrients. In this study, optimal nitrogen schedules were identified for japonica and indica rice on the practical premise that yield penalties must remain below 30%, thereby offering actionable reference points for future fertilizer management.
The present experiment used relatively wide increments for panicle-stage N reductions and did not isolate potential interactions among supplementary nutrients in the compound fertilizer; these factors may have introduced noise into the response curves. Future trials should narrow the fertilizer gradients, account for site-specific soil fertility and varietal traits, and feed the resulting data into decision-support tools for site-specific, ‘smart’ nitrogen scheduling. By fitting concise response functions for yield and key quality traits, this work establishes a predictive framework that can guide data-driven nitrogen reduction while safeguarding grain quality.
5. Conclusions
In this study, based on the significance analysis of the effect of nitrogen fertilizer transport on rice quality, brown rice percentage, chalkiness, protein content, and taste value were screened to represent the processing quality, appearance quality, nutritional quality, and cooking taste quality of rice, respectively. Considering the four quality indices comprehensively, under the precondition of ensuring a yield reduction of less than 30%, the nitrogen application measure of 100% compound fertilizer replacing chemical fertilizer in japonica rice is the best for quality enhancement, the nitrogen application measure of 50% reduction of spike fertilizer and no spike fertilizer can also obtain better quality, and 50% compound fertilizer replacing chemical fertilizer can also ensure that the level of nutritional quality will not be reduced. The nitrogen application measure of reducing the total nitrogen fertilizer of indica rice by 25% is the best for quality improvement, while the nitrogen application measure of replacing chemical fertilizer with 100% compound fertilizer can also obtain better quality, and the reduction in spike fertilizer by 50% and the replacement of chemical fertilizer by 50% compound fertilizer can also improve the quality to a certain extent. From a practical agronomic perspective, three fertilization strategies—50% panicle nitrogen reduction (N5), 50% compound fertilizer substitution (N7), and 100% compound fertilizer substitution (N8)—emerged as highly effective and stable for both rice types. These strategies allow producers to achieve a balance between high yield and high quality, thereby offering cost-effective, environmentally friendly, and scalable fertilization options for modern rice cultivation. This study provides a scientific reference for optimizing nitrogen management in rice production, supporting precision fertilization strategies tailored to specific varietal responses and production goals.


