Article

Flowering and Morphology Responses of Greenhouse Ornamentals to End-of-Day Blue-Dominant Lighting with Different Phytochrome Photostationary States

1
School of Environmental Sciences, University of Guelph, Guelph, ON NIG 2W1, Canada
2
Institute of Urban Agriculture, Chinese Academy of Agricultural Science, Chengdu 610299, China
*
Author to whom correspondence should be addressed.
These authors contributed equally to this work.
Agronomy 2025, 15(7), 1649; https://doi.org/10.3390/agronomy15071649
Submission received: 30 May 2025 / Revised: 30 June 2025 / Accepted: 4 July 2025 / Published: 7 July 2025

Abstract

To investigate whether blue-dominant spectra from end-of-day (EOD) lighting can regulate crop morphological and flowering responses, chrysanthemum (Chrysanthemum × morifolium; obligate short day), geranium (Pelargonium × hortorum; day neutral), calibrachoa (Calibrachoa × hybrida; facultative long day), and gerbera (Gerbera jamesonii; facultative short day) plants were grown under different light-emitting diode (LED) spectrum treatments from January to April 2020, in Guelph, Canada. The spectrum treatments were (1) no EOD lighting, (2) narrowband blue from LEDs (B), (3) a combination of narrowband blue, red, and far-red LEDs with a photon flux ratio of 47:3:1 (blue:red:far-red; BRFR). The B and BRFR treatments ran daily from 0.5 h to 4.5 h after dusk. Compared to the control without EOD lighting, chrysanthemum flower initiation was completely inhibited under BRFR. Flowering time was slightly delayed, but flower bud number increased under B. Side branch number, leaf area, and main stem length and diameter increased under B and BRFR. In the geranium B and BRFR did not affect flowering, but increased side branch number and length and diameter of the main stem. Both spectrum treatments promoted earlier flowering in the calibrachoa, but BRFR produced more flower buds. The calibrachoa aerial dry biomass and main stem length increased under B and BRFR. The gerbera leaf chlorophyll index and leaf thickness increased under BRFR. Both spectrum treatments increased the gerbera flower bud size, despite having little effect on flowering time. In all species, at least one of the LED treatments increased canopy size. Therefore, low levels of B or BRFR can be potentially used for EOD lighting to regulate the flowering and morphology of potted ornamentals.

1. Introduction

For potted greenhouse flowering commodities, a common goal is to produce plants that flower in a rapid and uniform manner while maintaining a desired canopy morphology [1,2]. However, during the darker months at higher latitudes, flowering time is delayed in long-day plants (LDPs) and canopy size is smaller in short-day plants (SDPs), with both aspects being compromised in day neutral plants (DNPs) due to lower natural light levels and shorter photoperiods. Chrysanthemum (Chrysanthemum × morifolium), geranium (Pelargonium × hortorum), calibrachoa (Calibrachoa × hybrida), and gerbera (Gerbera jamesonii) are popular ornamental plant species, which are classified as obligate SDP, DNP, facultative LDP, and facultative SDP, respectively [3]. Addressing the lighting-related issues that occur during the darker months for these commodities is meaningful to floriculture growers.
Electric lighting is commonly used for greenhouse production during the darker months to supplement lower natural light levels and shorter photoperiods [4,5]. Especially, day-extension lighting at the end of day (EOD) can be adopted to promote the flowering of LDPs by extending the natural photoperiod. However day extension lighting inhibits the flowering of short-day plants (SDPs), inhibiting their marketability if they ae grown in the same cultivation environment [1,6]. Besides photoperiod, plant flowering can also be mediated by spectral quality because the two light factors have independent pathways for flower induction despite a crosstalk between them [7,8,9,10,11,12]. Narrowband light-emitting diodes (LEDs) have become an important electric lighting source in horticultural production, especially with their capability to manipulate the spectral quality in greenhouse and vertical farm environments [10,13,14,15]. When electric lighting is provided between dusk and dawn, the spectral composition of the light source can be manipulated to regulate plant flowering and morphology due to there being no background spectral effects of sunlight [16]. Consequently, the spectral quality of EOD lighting could be optimized to minimize negative effects on the flowering of SDPs while promoting the flowering of LDPs. This is potentially economically important for commercial greenhouse producers that cultivate floriculture commodities from different photoperiod response groups within the same production area.
Narrowband LEDs with peak wavelengths (λpeak) between 400 and 500 nm (i.e., blue) may provide one optimal spectral quality for EOD lighting to moderate flowering responses. Our recent growth chamber studies indicated that under long photoperiods (e.g., 16 and 24 h d−1), narrowband blue vs. red (λpeak 600 to 700 nm) from LEDs at 100 µmol m−2 s−1 promoted flowering and elongation not only in LDPs such as petunia (Petunia × hybrida) and calibrachoa, but also in African marigold (Tagetes erecta), a facultative SDP [17,18]. For obligate SDP chrysanthemum in a growth chamber, 11 h daytime lighting immediately followed by a 4 h EOD exposure to 100 µmol m−2 s−1 of narrowband blue from LEDs promoted stem elongation but did not inhibit flowering [11,19]. Similar chrysanthemum flowering responses were observed under an extension of short-day (9–10 h) photoperiod, with 10−60 µmol m−2 s−1 of 4 h blue LEDs for either EOD lighting or night-interruption (NI) lighting in a growth chamber, where white LEDs or red + blue LEDs were used for daytime lighting [12,20,21,22,23]. Differing from chamber studies, in a greenhouse experiment with ≈ 9 h of natural light, a 4 h night-interruption lighting with 30 µmol m−2 s−1 from blue LEDs delayed the flowering of chrysanthemum and African marigold (both SDPs) while promoting stem elongation [24]. However, the night-interruption lighting with 1.5 µmol m−2 s−1 from blue LEDs in a greenhouse did not affect flowering time and stem elongation [25], indicating a sensitivity in plant responses to the lighting intensity of blue LEDs. When narrowband blue spectra from LEDs was used to promote the flowering of LDPs by extending the photoperiod in greenhouse conditions, the minimum effective intensity was 5 µmol m−2 s−1 for coreopsis (Coreopsis grandiflora) and snapdragon (Antirrhinum majus) and 15 μmol m−2 s−1 for petunia and rudbeckia (Rudbeckia hirta) [26]. Therefore, a low intensity (e.g., around 15 µmol m−2 s−1) of narrowband blue from LEDs may be used to provide long-day conditions during short days in greenhouse environments to promote flowering in LDPs while minimizing the negative effects on the flowering of SDPs.
Even if both SDPs and LDPs flower when using narrowband blue spectra from LEDs to extend the photoperiod during short-day conditions, the spectral quality may be detrimental to plant morphology by promoting excessive stem elongation, especially in LDPs. Excessive plant elongation is an undesirable morphological trait for most potted flower crops [27]. However, flower promotion is often associated with stem elongation, especially for LDPs grown in greenhouse environments [28]. This association was also observed in our recent growth chamber studies on ornamental plants (petunia, calibrachoa, geranium, and marigold) grown under narrowband blue LED treatments [17,18,29]. The combination of flower promotion and stem elongation under narrowband (or pure) blue spectra from LEDs was explained as a shade-avoidance response (SAR) related to the low phytochrome photostationary state (PPS) of the spectrum [30], indicating a low phytochrome activity [17,18,29] which may also modify the activity of other blue photoreceptors such as cryptochrome and phototropin [31,32].
Creating an impure blue spectrum with a higher PPS from a LED combination may be a way to solve the elongation issues caused by pure blue spectra from narrowband blue LEDs. When increased ratios of red and far-red (red:far-red = 6:6, 6:4, 6:2, and 6:0) from LEDs (with low light levels) were added to pure blue, the PPS values of the resulting impure blue spectrum combinations gradually increased from 0.50 (for pure blue) to 0.68 eventually, despite still being lower than the PPS of pure red (0.89) [17]. Among the spectrum treatments, which were defined by their photon flux ratios of blue, red, and far-red (i.e., B:R:FR), B94:R6:FR2 inhibited plant elongation compared to pure blue and promoted flowering compared to pure red in the LDPs petunia and calibrachoa. Compared with pure blue, an impure blue spectrum with a higher PPS may be a preferred spectral quality for EOD lighting to promote plant flowering while maintaining desired canopy morphology characteristics, especially for LDPs. However, the spectrum treatments in Kong et al. [17] were provided as sole-source lighting in a growth chamber environment, rather than as EOD lighting treatments in a greenhouse environment. Since both plant elongation and flowering responses can differ in greenhouse vs. growth chamber environments [33,34,35], the effects of blue-dominant (i.e., pure and impure blue) EOD spectrum treatments on plant elongation and flowering need to be investigated in the winter greenhouse production of plant species from different photoperiod response groups.
Although many studies have investigated the morphology modification and flowering promotion responses to different electric lighting technologies, this information is unavailable on EOD treatments comprising low levels (e.g., 15 µmol m−2 s−1) of blue-dominant spectra with different PPSs on ornamental plants from different photoperiod response groups. Chrysanthemum, geranium, calibrachoa, and gerbera are popular ornamental plant species, which are classified as obligate SDP, DNP, facultative LDP, and facultative SDP, respectively [3]. The objective of this study was to explore the effectiveness of 4 h EOD blue-dominant spectrum treatments with different PPSs for the winter greenhouse production of these ornamental plant species by examining their flowering and morphology responses.

2. Materials and Methods

2.1. Plant Materials and Growing Conditions

The experiment was conducted in three adjacent research greenhouse compartments (each 7.2 × 7.2 m) in one of the wings of the Bovey Research Greenhouse Facility at the University of Guelph (Guelph, ON, Canada, latitude 43°33′ N, longitude 80°15′ W). The wings of this facility are in the east–west orientation, thus the majority of the direct sunlight in the darker months in each comes from the direction of the south wall in each compartment. There is individual climate control in each compartment using aspirated sensor packages (Omni sensor, Argus Control Systems Ltd., Surrey, BC, Canada) positioned at canopy level in the middle of each compartment. Each compartment contained four parallel benches (each 4.6 × 1.1 m, with 0.9 m spacing between them), with the long sides of the benches oriented in the east–west direction. Only the 3 benches in each compartment (9 total) located farthest from the south wall were used in this trial; this maximized the uniformity of natural lighting and aerial environmental conditions within the crop-growing areas of the study. Commercially produced transplants of chrysanthemum ‘Breeze Yellow’, geranium ‘Calliope Medium Dark Red’, calibrachoa ‘Bloomtastic-Pink Flare’, and gerbera ‘Midi Purple’ (Bayview Flowers, Jordan Station, ON, Canada; Jeffery’s Greenhouses, St. Catharines, ON, Canada) were planted into 11.4 cm-diameter plastic pots in a peat-based substrate (Sunshine Mix #1; Sungro Horticulture, Brantford, ON, Canada). The specific transplanting date and other key time points are listed in Table S1. After transplanting, all plants were acclimated to the research greenhouse environment for 10 days under natural light conditions, except for the chrysanthemum which were exposed to a daily 4 h photoperiod extension treatment, starting at dusk, using white LEDs (the white channel of LX602C, Heliospectra AB, Gothenburg, Sweden). The peak wavelengths (λpeak) ± full width at half maximum (FWHM) of the two peaks in the white spectrum were at 447 nm ± 16 nm and 570 nm ± 136 nm, the estimated PPS was 0.81 [30], and the canopy-level photosynthetic photon flux density (PPFD; 400 to 700 nm) was ≈ 15 μmol m−2 s−1. At the end of the acclimation period, uniformly sized plants of each species were selected for the treatments. The chrysanthemum, geranium, calibrachoa, and gerbera plants were approximately 6, 4, 5, and 3 cm tall and had approximately 9, 8, 17, and 3 unfolded leaves, respectively.
The EOD spectrum treatments were initiated 10 days after transplanting. Plants were top-irrigated as needed, alternately with well water [electrical conductivity (EC) ≈ 0.8 dS m−1, pH ≈ 7.5] and a nutrient solution (EC ≈ 2.6 dS m−1, pH ≈ 6.5). The nutrient solution consisted of well water plus a water-soluble fertilizer (20–8–20; Plant Products Inc., Brampton, ON, Canada) at a mass ratio of 800:1. The environment was kept at 21 °C during the day (dawn to dusk) and 18 °C during the night (dusk to dawn) with a constant relative humidity (RH) setpoint of 55% throughout the trial (including acclimation period) (Table 1). When the RH was below the setpoint, moisture was added via a fogging system controlled by a climate computer (Titan, Argus Control Systems Ltd., Surrey, BC, Canada). Temperature and RH data were recorded every 15 min using the climate computer. Natural light intensity was measured by a quantum sensor (SQ-100, Apogee Instruments, Logan, UT, USA) placed at canopy level on the second bench from the south wall in the middle compartment. Measurements were recorded every 120 s using a datalogger (U12-012, Onset Computer Corporation, Bourne, MA, USA). Daily light integrals (DLIs, mol m−2 d−1) were calculated for each day of the trial: weekly average (± standard error, n = 7) natural DLIs are presented in Figure S1.

2.2. Experimental Design and Spectrum Treatments

The EOD spectrum treatments were as follows: (1) B, pure blue from narrowband LEDs and (2) BRFR, impure blue from a combination of narrowband blue, red, and far-red from LEDs with a photon flux ratio of B47:R3:FR1. Darkness (D, i.e., no EOD lighting) served as a control treatment. The EOD spectrum treatments were provided using tunable spectrum LED fixtures (LX602C) which were turned on daily from 0.5 h after dusk to 4.5 h after dusk at canopy level with a PPFD of 14 μmol m−2 s−1. The λpeak and FWHM of the blue, red, and far-red LED channels were 446 ± 20 nm, 660 ± 16 nm, and 734 ± 16 nm, respectively. The estimated PPSs were 0.47 and 0.66 for the B and BRFR treatment spectra, respectively, based on Sager et al. [30].
Two LED fixtures were hung over each bench with the B or BRFR treatment, spaced 120 cm apart (on center) at a height of 140 cm from the bench to the LED arrays. Because of the low natural light levels inside the experimental greenhouse compartments (e.g., Llewellyn et al. [36]), single, mogul-based HPS fixtures (400W with DEEP reflectors, PL Lighting, Hamilton, ON, Canada; estimated PPS = 0.84) were hung at the center of each bench for all plots, including those in control treatment. For the EOD treatment plots, the HPS bulb was centered between the LED fixtures. The HPS provided a canopy-level PPFD (mean ± SE, n = 9) of 73 ± 2.2 μmol m−2 s−1 in each plot. The HPSs were turned on 8 h before dusk and off 0.5 h before dusk each day to allow natural twilight conditions, resulting in an additional 2.0 mol m−2 d−1 of PAR at the canopy level. To prevent light contamination between treatment plots, each bench was separated by automatic, bench-level black-out curtains [37] which fully enclosed the light fixtures and growing area on each bench 0.25 h after dusk and opened 4.75 h after dusk (i.e., closed 15 min before EOD treatments started, opened 15 min after EOD treatments ceased). Spectrum distributions and canopy-level photon flux densities (PFDs) were measured using a radiometrically calibrated spectrometer (Flame-S-XR; Ocean Optics, Inc., Dunedin, FL, USA) with a CC3 cosine corrector attached to a 1.9 m × 400 μm optical fiber. Intensity and spectrum distributions were measured 13 cm above the bench in a 3 × 3 square grid (40 cm squares, centered under the HPS, n = 9) at night-time on each bench before transplanting. The HPS PFD distributions were measured with all HPS fixtures turned on and the black-out curtains fully opened. The LED treatments’ PFD distributions were measured with the black-out curtains fully closed. The spectral photon flux distributions of the white LED, HPS, and EOD B and BRFR treatments are presented in Figure S2.
The experiment was conducted as a randomized complete block design for each plant species, with three blocks (i.e., individual greenhouse compartments) (Figure S3). The spectrum treatments were randomly allocated to separate benches (4.6 m × 1.2 m with 0.67 m spacing between benches) in each greenhouse compartment. In the center of each greenhouse bench, a 1.2 m × 1.6 m growing area was divided into four equal-sized quadrants (0.6 m × 0.8 m each), which were each randomly assigned to an individual plant species (Figure S4). Within each quadrant, 12 randomly selected plants of the given species were evenly spaced on 0.2 m centers in a 3 × 4 configuration. The six plants of each species in the center of the growing area (represented by solid colors in Figure S4) were investigated until harvest and the edge plants in each quadrant (i.e., not bordered by other plants on all sides, represented with cross-hatching in Figure S4) were not used for any growth or flowering measurements until the center plants were harvested. When the center plants were harvested (described below as Section 2.3), the edge plants were moved to the positions previously occupied by the center plants to extend the evaluations of flower development time for treatment plots without 50% plants flowering (described below as Section 2.3). Representative images showing the layout of a single bench during both day and EOD periods are shown in Figure S5.

2.3. Flowering, Morphology, and Biomass Measurements

The six center plants in each plot were investigated for the appearance of visible flower buds twice per week from the beginning of the trial, with the recording of flower appearance starting on day 28 after initiating the EOD spectrum treatments in chrysanthemum and geranium, day 36 in calibrachoa, and day 45 in gerbera. In each assessment, the number of visible buds on each plant and the flowering index of each bud were recorded. Although the classification system in the BBCH monograph provides a standardized scale to distinguish different phenological growth stages in many plant species [38], it cannot accurately and quantitively indicate flowering progress over entire plants. Consequently, we developed an evaluation method called mean flowering index, which integrates both the number of visible floral buds and flowering index for each individual floral bud on each plant. The flowering index of individual flower buds for each species were defined according to the graphics in Figure 1.
For any given plant on any given day, if no flower buds were visible then the flowering index of this plant was recorded as zero. If flower buds were visible, the mean flowering index of that plant was calculated at each measurement interval following Equation (1), which is as follows:
Mean   flowering   index   of   individual   plant   = i = 1 m ( N i × i ) i = 1 m N i
where i is the defined flowering index value of each individual bud; Ni is the number of flower buds indexed i; and m is the maximum flowering index value for each species. The progress of flowering responses was characterized using the temporal changes in mean flowering index and cumulative flower bud number.
Plant harvesting began on 19 March 2020 (week 12) and finished on 14 April 2020 (week 15). Harvesting of each species was performed block by block: detailed information about harvesting dates and other key time points can be found in Table S1. In each species × block combination, when ≥50% of the center plants had at least one open flower (i.e., with the maximum flowering index defined in Figure 1) in any treatment then all center plants of that species from all treatment plots inside the respective block were harvested for morphology and biomass measurements. Immediately before harvesting each plant, the canopy height was measured from substrate surface to the highest point of the plant, the width was measured at two perpendicular horizontal directions (i.e., in line with the long and short sides of the benches, respectively) using a ruler, and the chlorophyll content index was measured in three fully expanded leaves located within the upper canopy using a chlorophyll meter (SPAD 502; Spectrum Technologies, Inc., Aurora, IL, USA). Then the plant was cut at the substrate surface, and the aerial tissues were separated into floral tissues (FLs; flowers and visible flower buds), main stem without leaves (MS), leaves on the MS, and side branches with attached leaves (SBs). No SBs were separated for gerbera due to its rosette-type growth. The MS length was measured from the cutting position to the stem apex using a ruler and MS diameter was measured in two perpendicular directions at the inter-node located at the midpoint of the stem using a digital caliper. The number of leaves, nodes, and SBs (>1 cm in length) on the MS were counted. The total area of leaves on the MS for each plant was measured using a leaf area meter (LI-3100; LI-COR, Lincoln, NE, USA). The separate aerial plant tissues were oven-dried to constant weight at 65 °C and then the dry weight (DW) of each tissue was measured. Individual FL DW, the internode length of MS, the individual leaf area (only for the leaves on the main stem), leaf mass per area (LMA), and the percentage of aboveground dry biomass that was FL, MS, and SB were calculated using Equations (2)–(8), respectively. The equations are as follows:
Individual   FL   DW   ( mg ) = Total   DW   of   flower   buds   ( g ) Total   number   of   flower   buds   × 1000
Internode   length   ( cm ) = MS   length   ( cm ) Node   number   on   MS
Individual   leaf   area   c m 2 = Total   leaf   area   on   MS   ( c m 2 ) Leaf   number   on   MS
LMA   mg   c m - 2   = DW   of   leaves   on   MS   ( g ) Total   leaf   area   on   MS   ( c m 2 ) × 1000
FL / Aerial   DW   % = DW   of   flower   buds   ( g ) Total   DW   of   aerial   tissues   ( g ) × 100
MS / Aerial   DW   % =   DW   of   main   stem   ( g ) Total   DW   of   aerial   tissues   ( g ) × 100
SB / Aerial   DW   ( % ) = DW   of   side   branches   ( g ) Total   DW   of   aerial   tissues   ( g ) × 100
For the earliest flowering treatment(s) in each species × block combination, the time to ≥50% flowered plants was the same as the harvest date. After harvesting the center plants, the remaining edge plants were moved to the center region under the spectrum treatments until ≥50% of these plants had at least one open flower in each block × species × treatment combination. No chrysanthemum plants under the BRFR treatment had visible flower buds at the end of the whole experiment.

2.4. Statistical Analysis

Data were subjected to analysis of variance using Data Processing System Software (DPS, version 7.05; Refine Information Tech. Co., Hangzhou, China) and were presented as means ± standard error (SE, n = 3). For each species, separation of means was performed using Duncan’s new multiple range test at the p ≤ 0.05 level.

3. Results

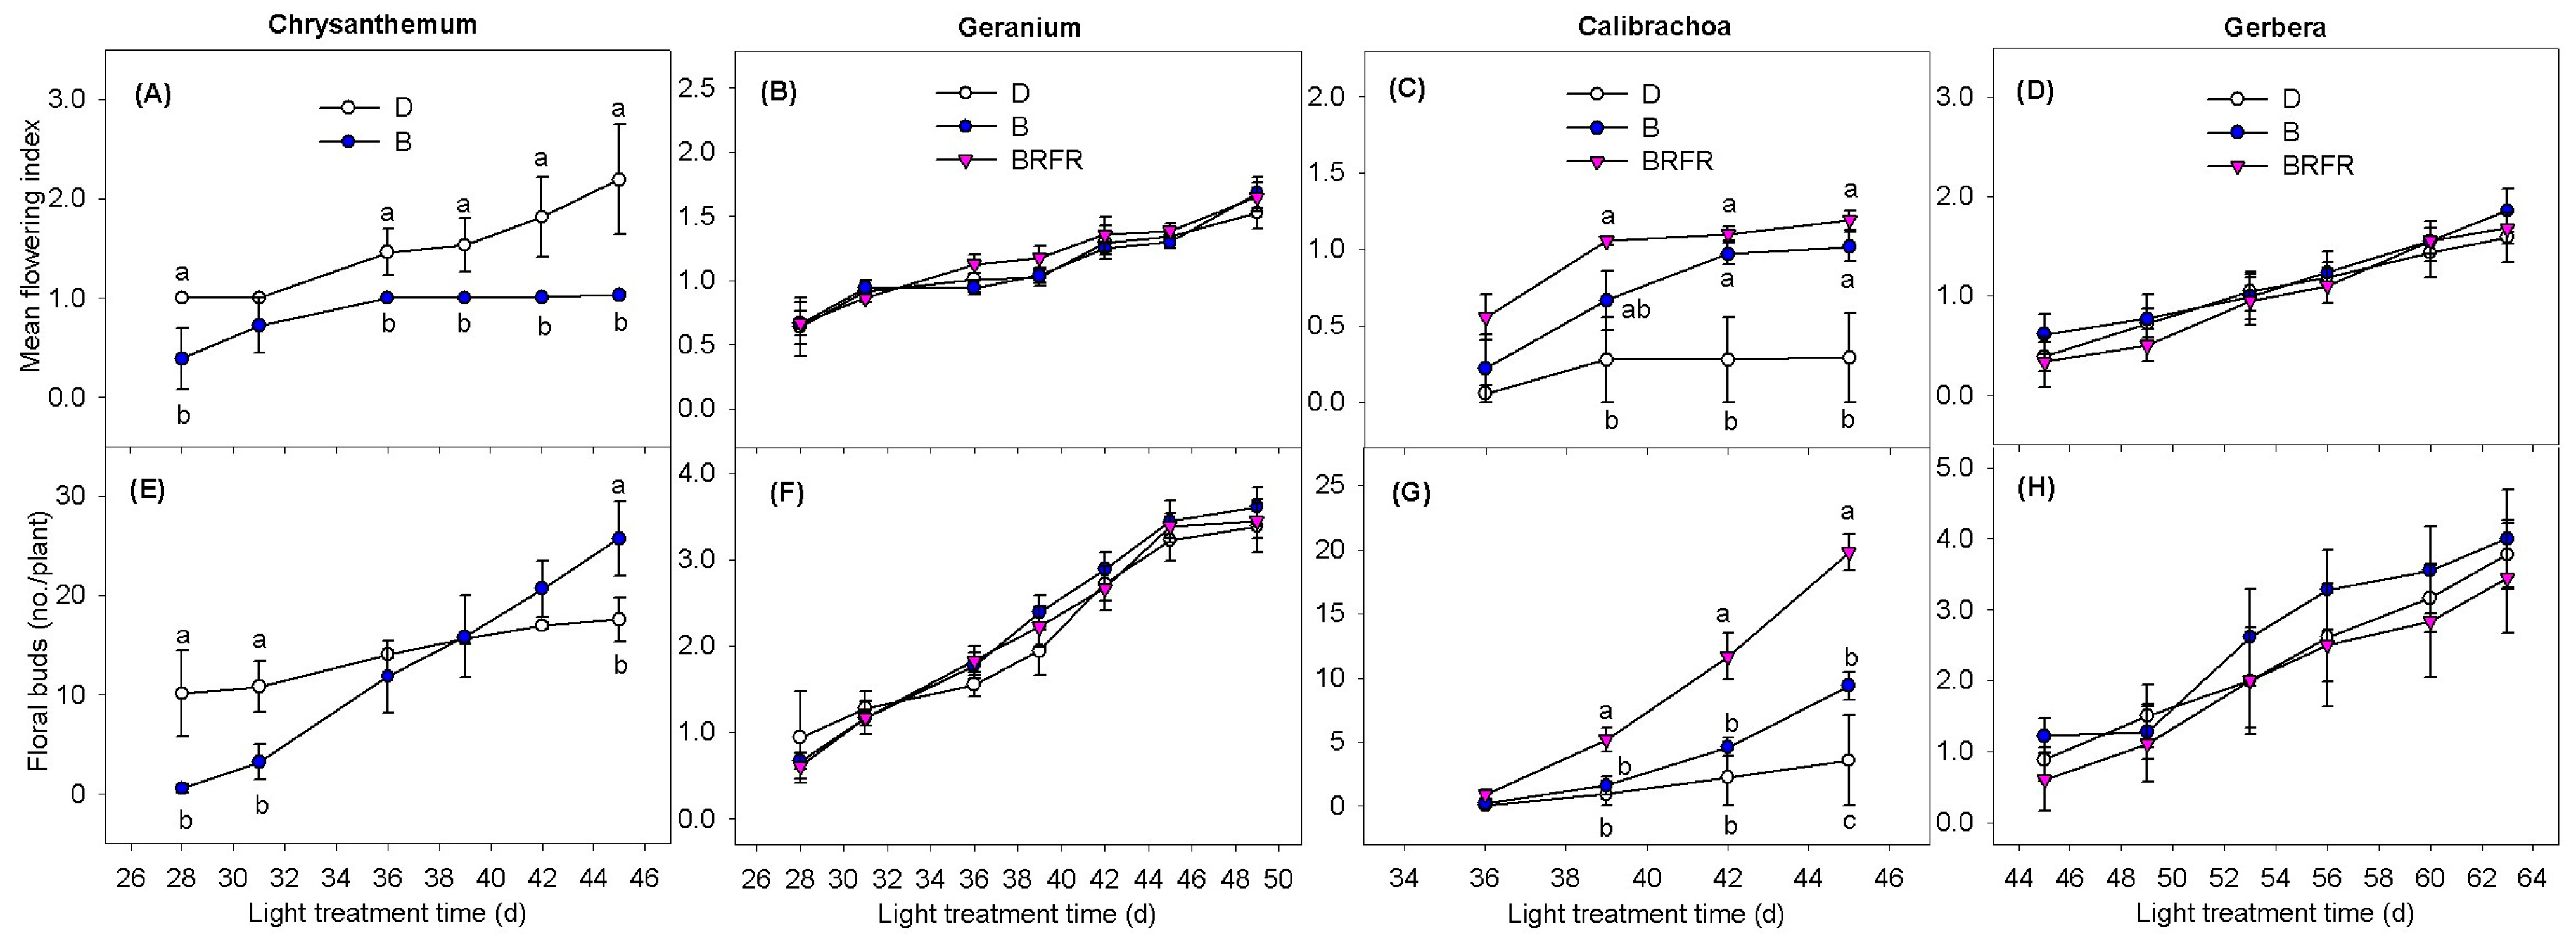
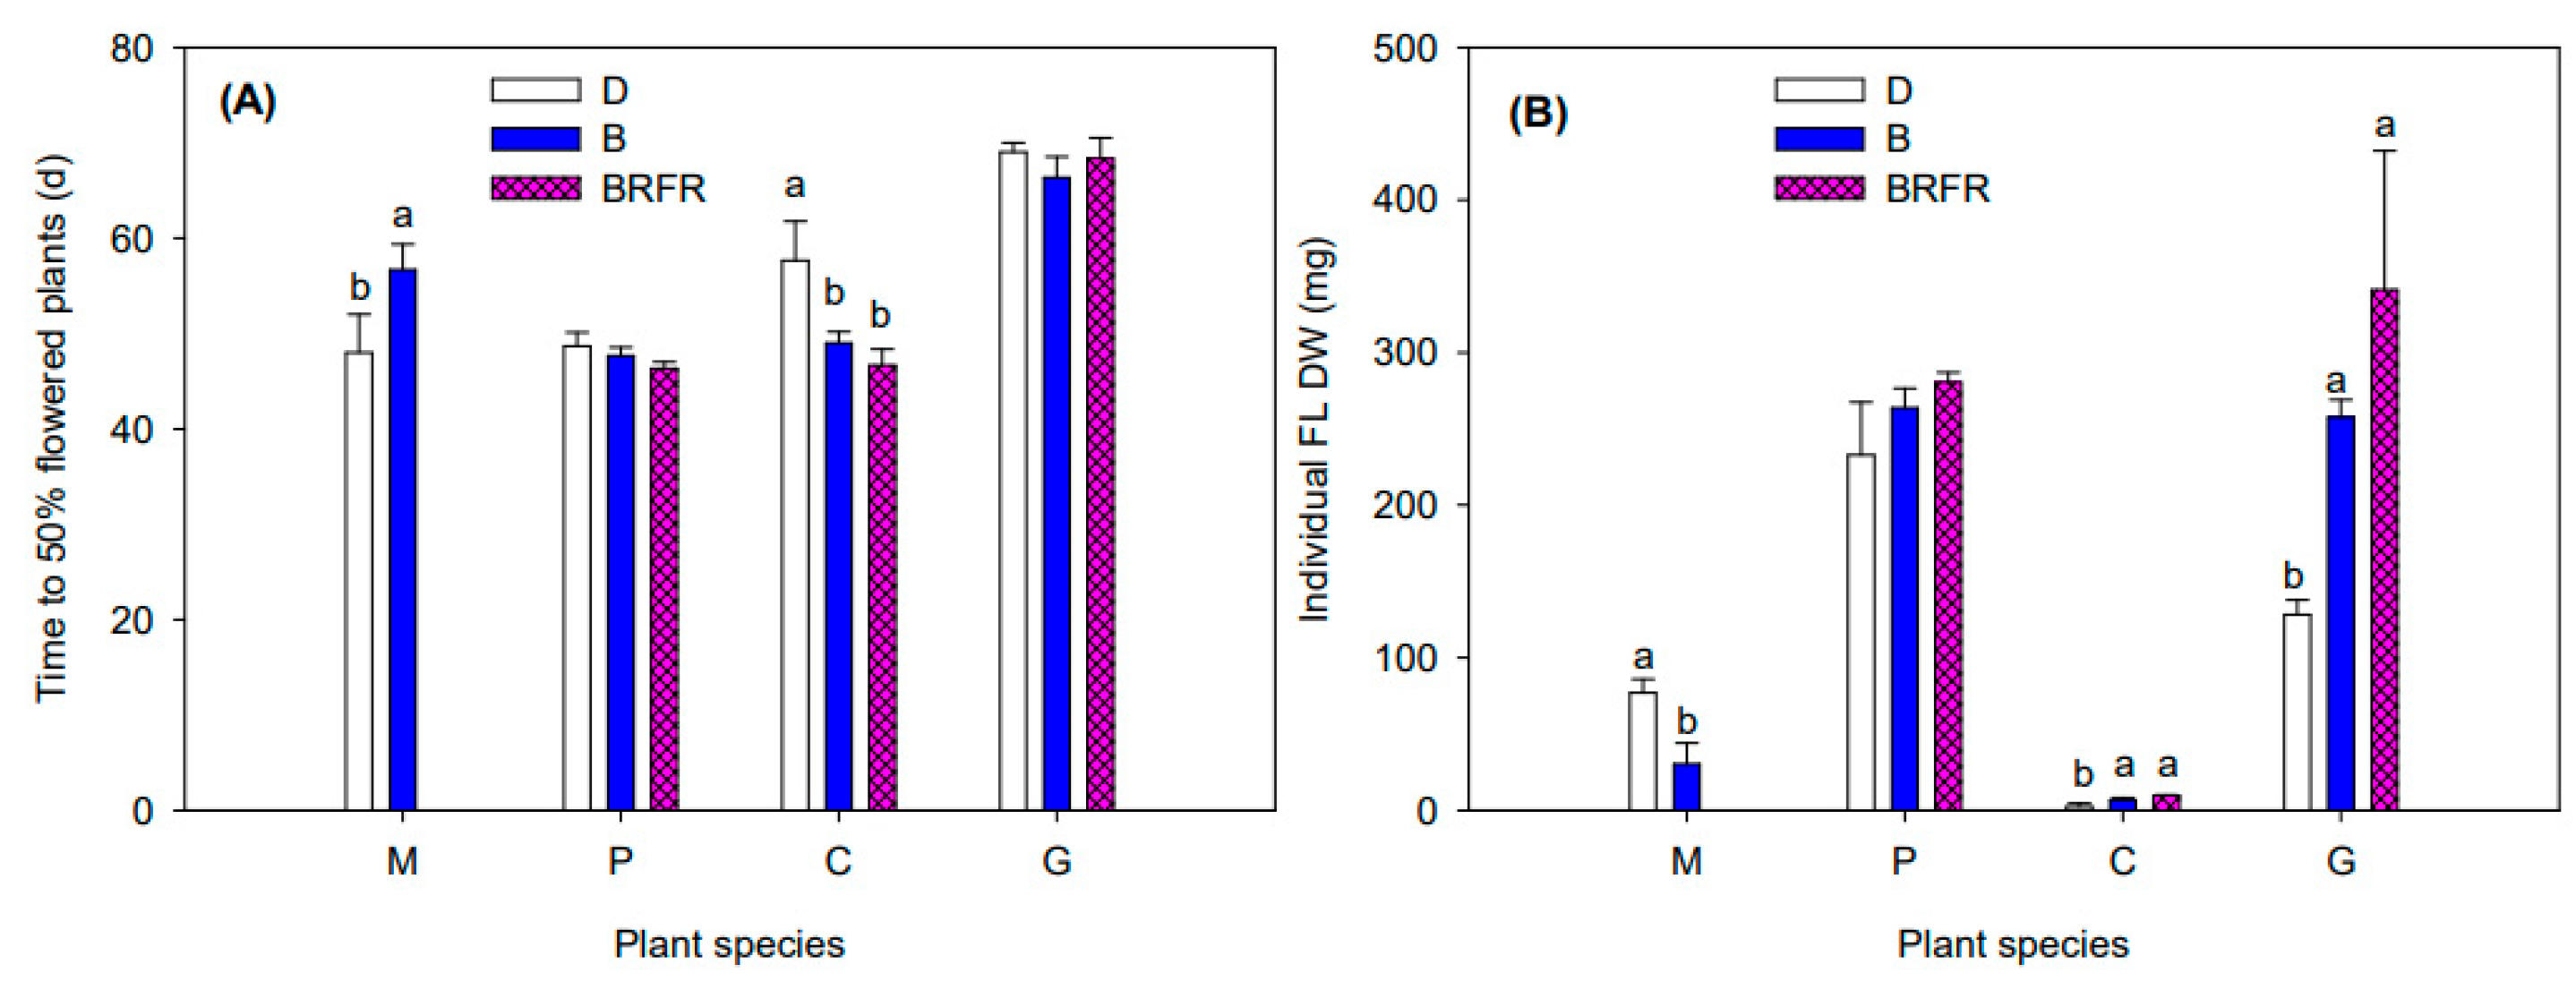
3.1. Flowering Responses

At the beginning of chrysanthemum flowering, plants grown under B vs. D had a lower mean flowering index and fewer flower buds (Figure 2A,E). However, with time advancement, the number of flower buds on chrysanthemum plants under B increased faster than those under D. By the end of the investigation, chrysanthemum under B vs. D had more flower buds despite a lower mean flowering index. No plants under the BRFR treatment had visible flower buds from the start to the end of the whole experiment, so only two treatments were presented in chrysanthemum. There were no treatment effects on calibrachoa flower development until day 39 when plants under BRFR had a higher flowering index than D and more flower buds than B and D (Figure 2C,G). By day 45, calibrachoa grown under BRFR had more flower buds than B and D and a higher flowering index than D. By day 45, calibrachoa grown under B had more flower buds and a higher mean flowering index than D but did not differ from BRFR in the mean flowering index. There were no treatment effects on the flowering index and flower bud numbers in geranium (Figure 2B,F) and gerbera (Figure 2D,H).
There were only spectrum treatment effects on time to 50% flowering in chrysanthemum and calibrachoa (Figure 3A). Chrysanthemum flowers opened the fastest under D followed by B. No chrysanthemum flowering occurred under BRFR. Calibrachoa flowers opened the fastest under B and BRFR, suggesting that short days delayed flower development. There were no treatment effects on time to flower opening in geranium and gerbera.
Individual flower DW in chrysanthemum was higher under D than B (Figure 3B). Individual flower DWs in calibrachoa and gerbera were higher under B and BRFR than D despite no difference between B and BRFR. There were no treatment effects on individual flower DWs in geranium.

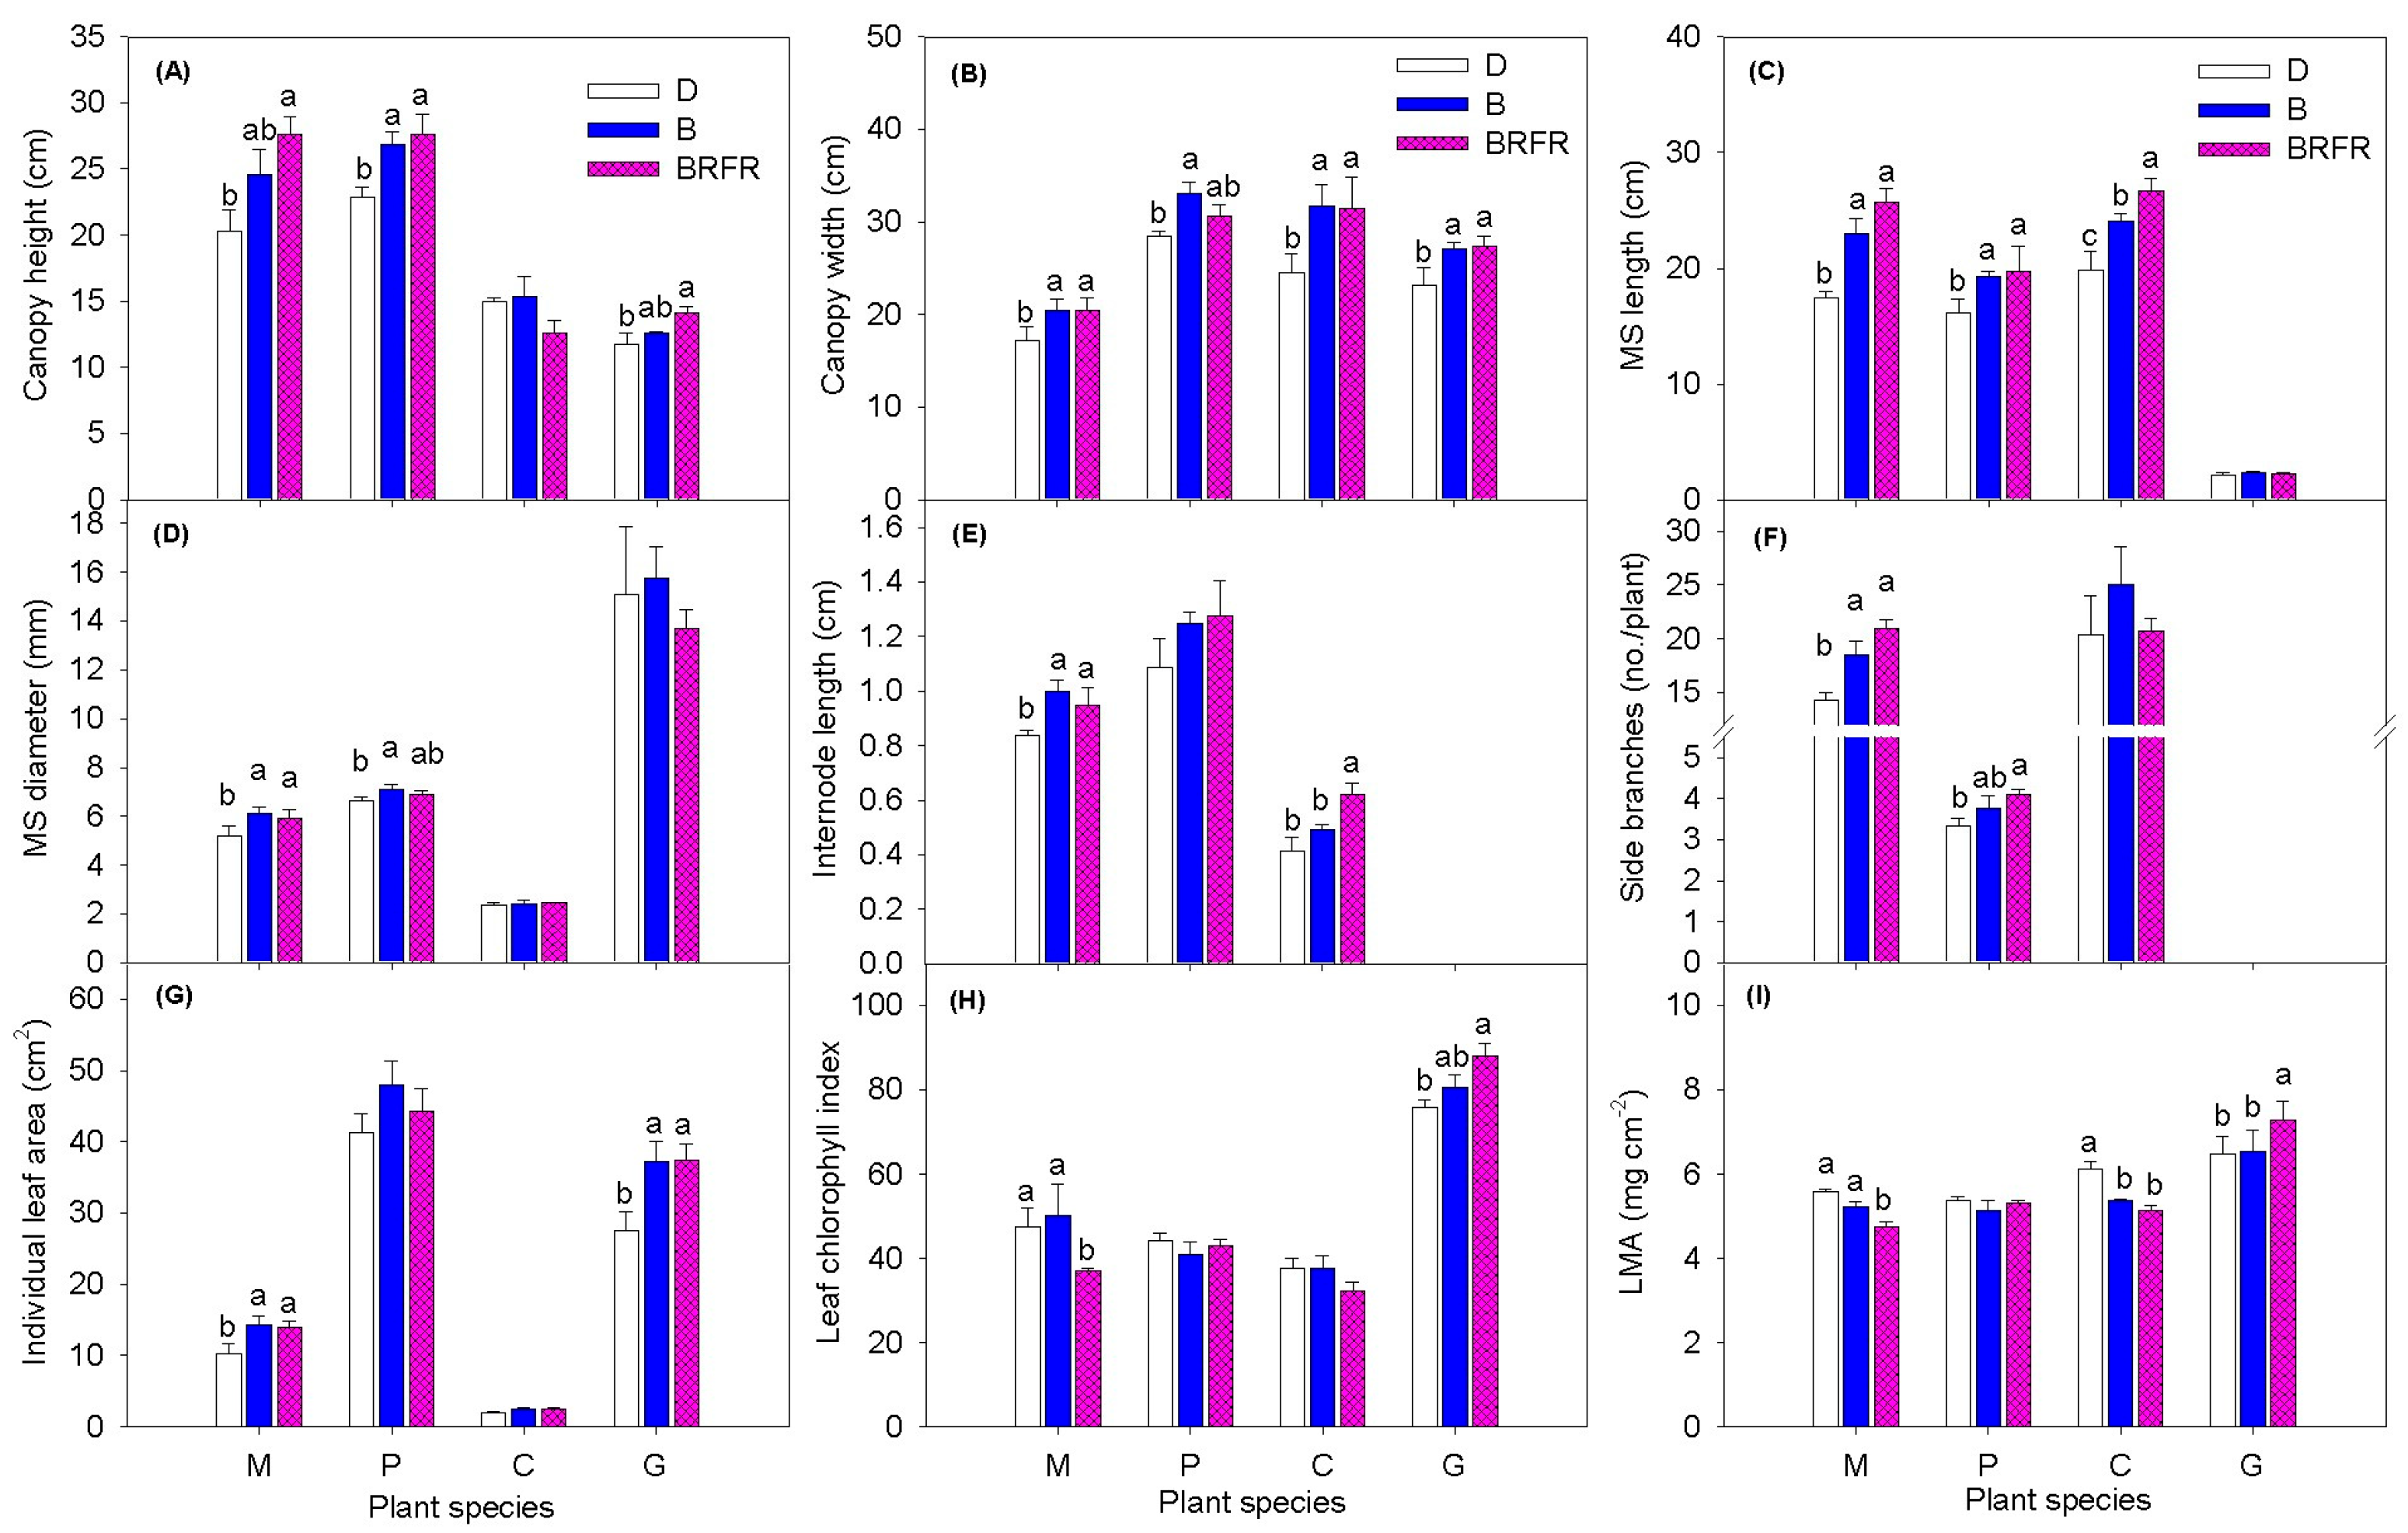
3.2. Plant Morphology

The canopy was taller under BRFR vs. D in chrysanthemum, geranium, and gerbera and under B vs. D in geranium (Figure 4A). The canopy was wider under B vs. D in all species and under BRFR vs. D in chrysanthemum, calibrachoa, and gerbera (Figure 4B). There were no treatment effects on canopy height and width between B and BRFR in all species.
The MS was longer under B and BRFR vs. D in chrysanthemum, calibrachoa and geranium (Figure 4C). In calibrachoa, the MS was shorter under B than BRFR. The MS was thicker under B vs. D in chrysanthemum and geranium, and under BRFR vs. D in chrysanthemum (Figure 4D). The internodes were longer under B vs. D in chrysanthemum, under BRFR vs. D in chrysanthemum and calibrachoa, and under BRFR vs. B in calibrachoa (Figure 4E). The number of side branches was greater under B vs. D in chrysanthemum and under BRFR vs. D in chrysanthemum and geranium (Figure 4F). Individual leaf area on the MS was larger under B and BRFR vs. D in chrysanthemum and gerbera (Figure 4G). The leaf chlorophyll index was lower in chrysanthemum but higher in gerbera under BRFR vs. D. Chrysanthemum leaf chlorophyll index was higher under B vs. BRFR (Figure 4H). The LMA under BRFR vs. D was lower in chrysanthemum and calibrachoa and higher in gerbera (Figure 4I). The LMA was lower under B vs. D in calibrachoa. The LMA under B vs. BRFR was higher in chrysanthemum and lower in gerbera.

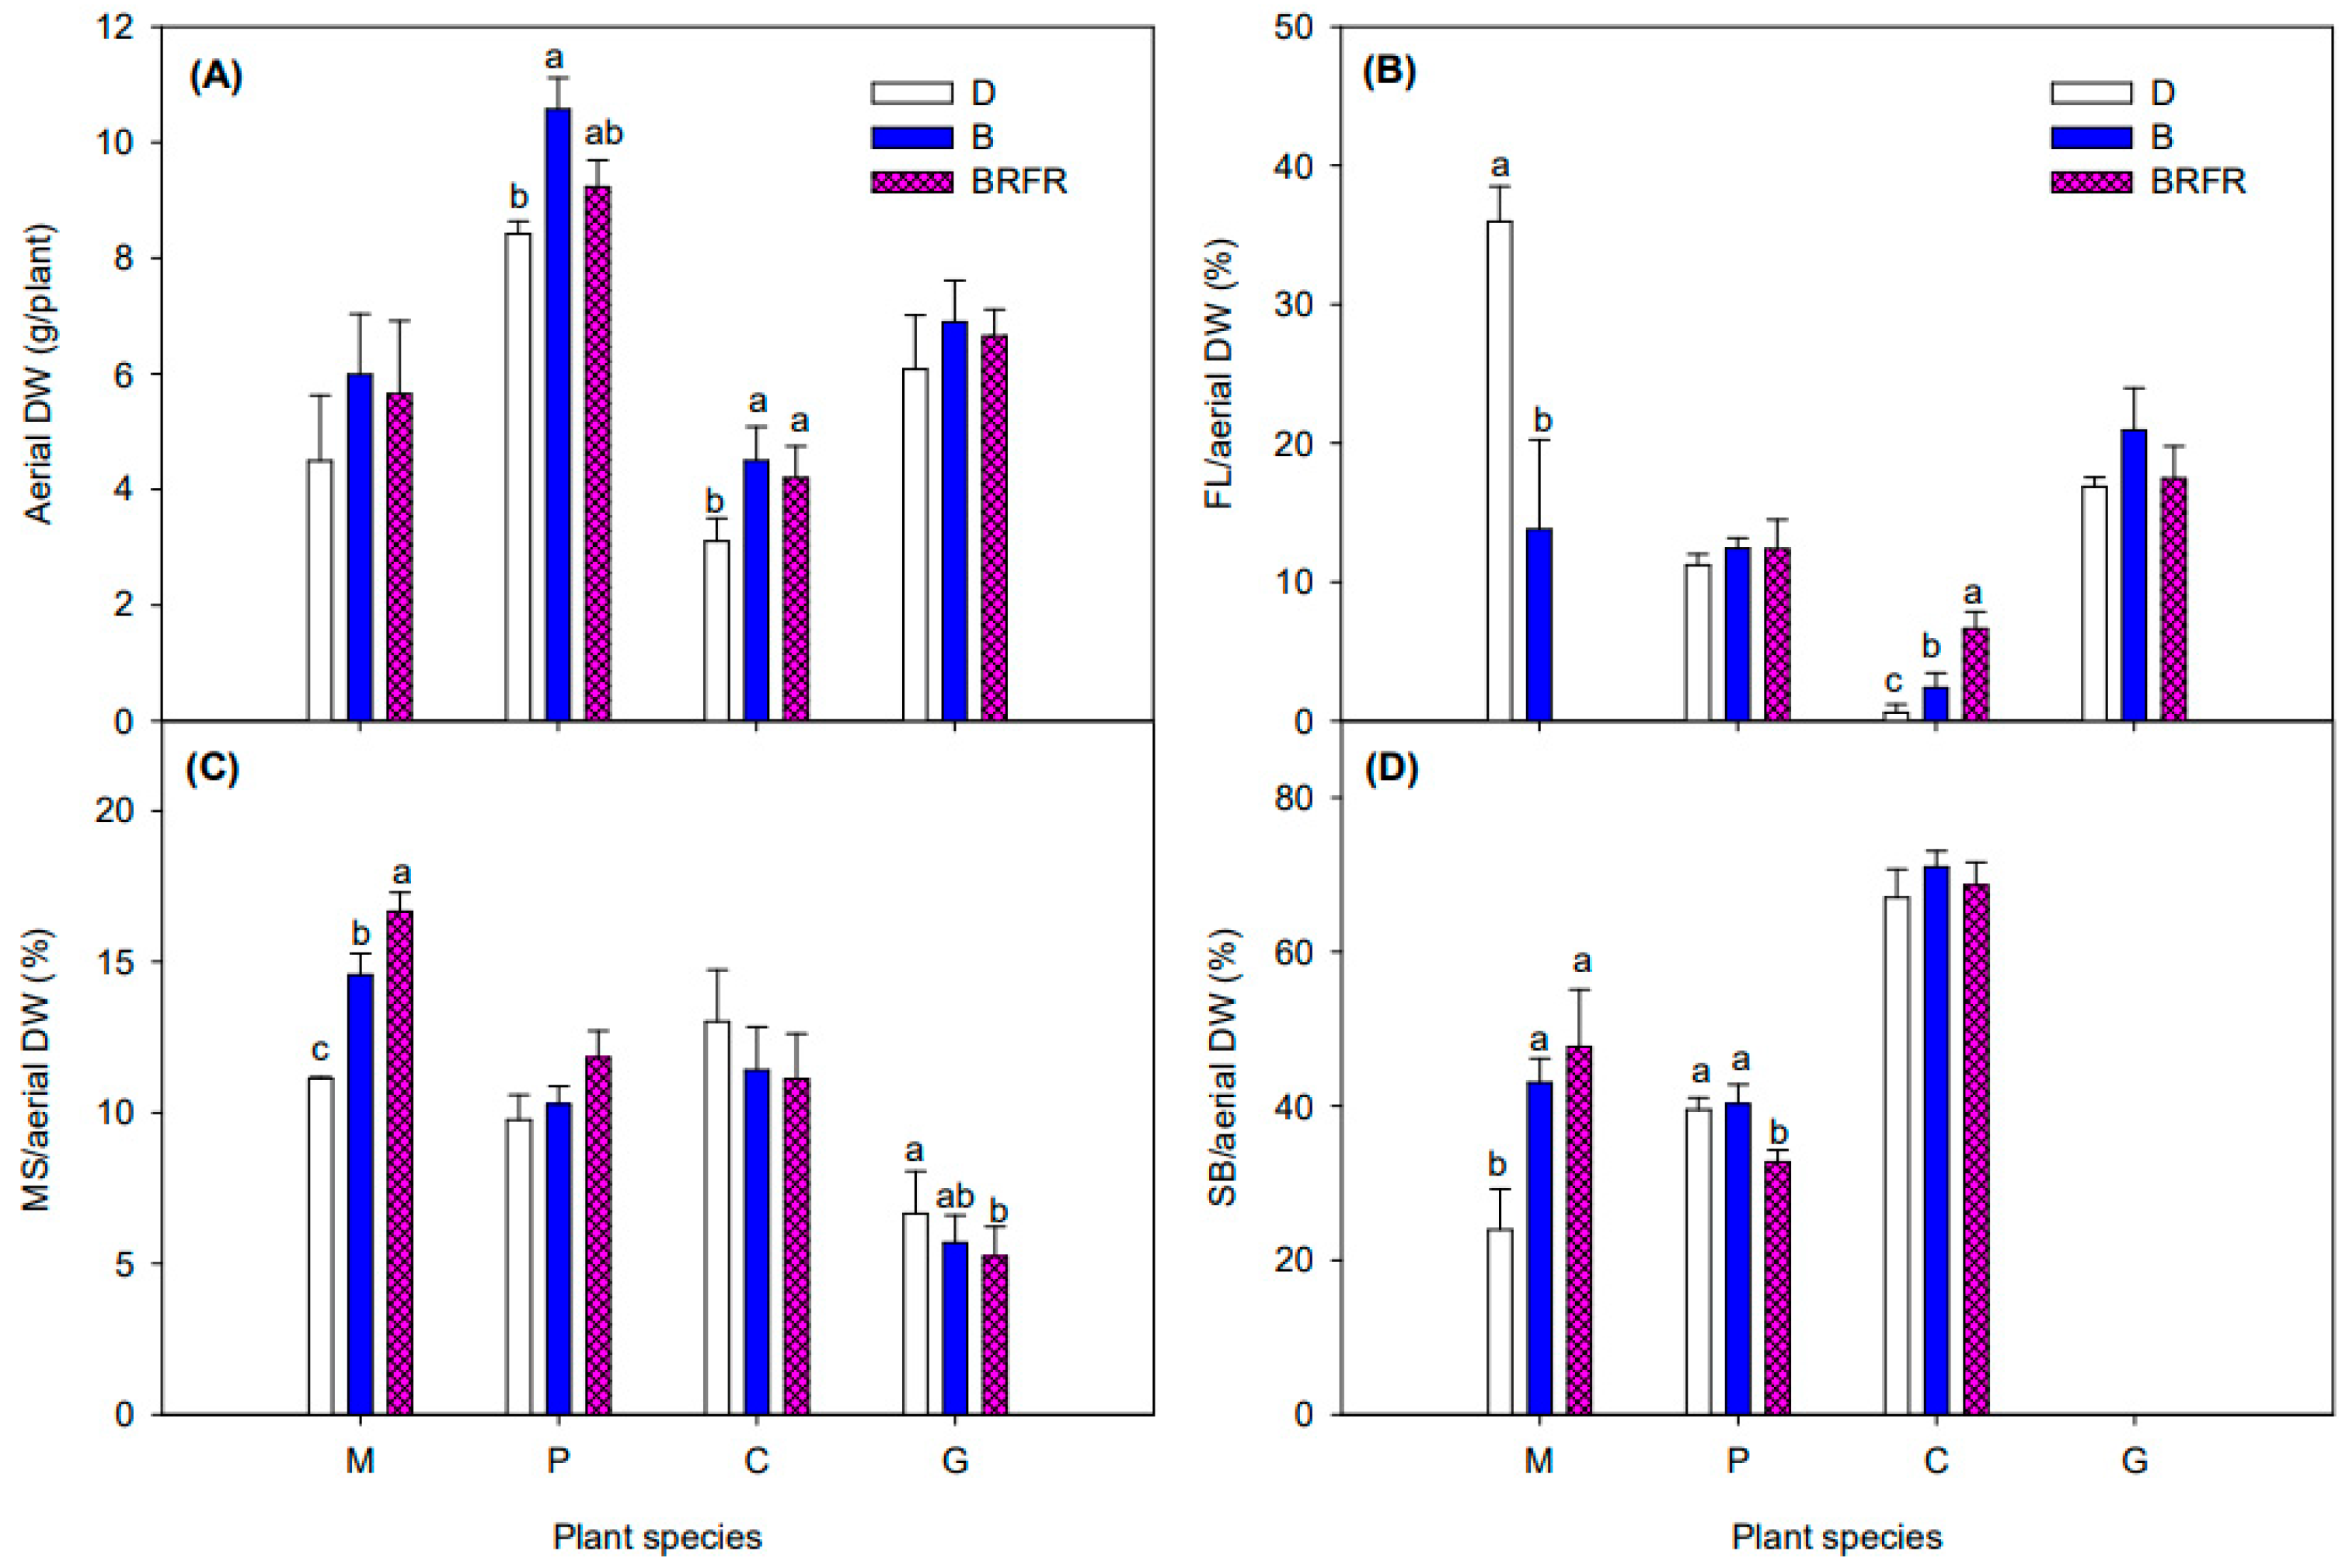
3.3. Plant Biomass and Its Allocation

The total DW of aerial tissues was greater under B vs. D in geranium and calibrachoa, and under BRFR vs. D in calibrachoa (Figure 5A). The proportion of total aerial DW that was from floral tissues was higher under D vs. B in chrysanthemum; no chrysanthemum floral tissues appeared under BRFR (Figure 5B). The proportion of total aerial DW that was from floral tissues in calibrachoa was highest in BRFR followed by B followed by D. The proportion of total aerial DW that was main stem biomass in chrysanthemum was highest in BRFR followed by B followed by D (Figure 5C). The proportion of total aerial DW that was main stem biomass in gerbera was lower in BRFR than D. The proportion of total aerial DW that was side branch biomass was greater under B and BRFR vs. D in chrysanthemum, and under B and D vs. BRFR in geranium (Figure 5D).

4. Discussion

4.1. Flowering of Obligate SDP Chrysanthemum Mainly Depends on the PPS of the Blue-Dominant Spectrum from EOD Lighting

For the obligate SDP chrysanthemum, flowering responses were only slightly delayed under the 4 h-EOD pure blue spectrum treatment, although the day length was extended to more than the critical photoperiod. It appears that night-time exposure to low-intensity pure blue spectra from narrowband LEDs is not sensed by chrysanthemum plants as an effective signal to completely inhibit photoperiod-mediated flowering response [39]. It has been found that the effectiveness of narrowband blue LED in photoperiod-prolonging treatments to regulate flowering is related to total dose (i.e., intensity × duration). For example, greenhouse chrysanthemum flowering was delayed by 4 h of night interruption (NI) with pure blue from narrowband LEDs at 30 µmol m−2 s−1 [24], but completely inhibited by 4 h daytime extension with pure blue from narrowband LEDs at 40 µmol m−2 s−1 compared to no photoperiod-prolonging treatment [33]. For chrysanthemums grown in high tunnels covered with shading nets, overnight lighting with pure blue from narrowband LEDs at ≈ 20 µmol m−2 s−1 inhibited flowering, but shorter night lighting treatments failed to prevent flowering [40]. In addition to the low dose, the reason that the pure blue treatment did not completely inhibit chrysanthemum flowering may be partly due to the increased PPS of daytime light by supplemental HPS lighting. It has been found that variations in phytochrome activity, influenced by daytime light quality, can lead to different chrysanthemum flowering responses to subsequent blue LED lighting used for photoperiod extension [21,22,23]. Another possibility is that even under long-day conditions the chrysanthemum plants under the pure blue treatment might have also initiated flowering as a SAR through a light-quality-regulated pathway [41]. Low activity of phytochrome-B (PHYB) and cryptochrome−1 (CRY1) or high activity of phytochrome-A (PHYA) and cryptochrome−2 (CRY2) may play important roles in this process. This is supported by the low PPS (0.47) of the pure blue spectrum in the current study, and also a high expression of PHYA and a low expression of PHYB in chrysanthemums grown under 4 h of NI lighting from pure blue LEDs at 10 µmol m−2 s−1 in a growth chamber [20]. Also, our chamber study on flowering responses of CRY-deficient and overexpressing Arabidopsis plants indicated that sole-source lighting with pure blue from LEDs decreased CRY1 activity and increased CRY2 activity [32].
Despite a slight delay in flowering time, the pure blue (B) treatment increased the number of chrysanthemum flower buds at the time of harvest compared to D (i.e., no EOD spectrum treatment). Similar results have been observed in this species and kalanchoe (Kalanchoe blossfeldiana; another obligate SDP) in response to 4 h pre-dark (i.e., 4 h immediately before dark) supplemental lighting from blue LEDs (10−30 µmol m−2 s−1) under a 13 h photoperiod in an indoor setting [42,43,44,45]. Possibly, in addition to photoperiod and light quality pathways, photon flux from the blue spectrum can also regulate flowering through a light quantity pathway [41]. In this case, photosynthetic carbohydrates that are formed under B treatments can act either as an internal signal to increase the expression of FLOWERING LOCUS T (FT), a florigen, or as a transportation vector to deliver the FT from leaves to shoot apices [46]. The higher chrysanthemum floral bud numbers in the B treatment were also possibly the result of more SBs (Figure 4F). Accordingly, flower buds continued forming on the SBs in the B treatment after new flower bud formation had slowed in the control treatment (Figure 2E). Pinching to increase side branching is a common way to increase flower numbers in chrysanthemum production. The increased chrysanthemum side branching under the B treatment was probably due to the extended photoperiod, as was seen in Yang et al. [42] where long-day conditions were more favorable to the formation of branches than short-day conditions. This morphological modification in vegetative growth by the B treatment might have been mainly attributed to its effects on photomorphogenic responses rather than photosynthesis, since the B treatment did not increase total aerial dry biomass but did affect chrysanthemum vegetative morphology, such as in the increased canopy width, main stem length and diameter, and increased individual leaf area (Figure 4). Although chrysanthemums in the B treatment had more flower buds, the size of individual flower buds and total floral biomass were lower than in D due to the delayed flower development. Nevertheless, the higher number of flower buds under B vs. D, combined with a wider canopy and more side branches, are preferred traits by customers, which could potentially increase the finished plant value.
In contrast with B, the complete inhibition of chrysanthemum flower initiation under BRFR may have been due to activated phytochrome. In the present study, BRFR had a higher PPS value than B (i.e., 0.66 vs. 0.47). In many cases, when PPS is above 0.60, phytochrome (especially PHYB) would be activated to induce plant responses [47], such as that which were found in the aerial tissue elongation responses of some ornamental plants [17,29]. Similarly, flowering was inhibited in some SDPs, including chrysanthemums, when grown under spectrum treatments with R:FR ≥ 0.66 (i.e., PPS ≥ 0.63) [48]. It has been found that in chrysanthemum, AFT (an anti-florigen) is induced by activated PHYB under non-flowering-inductive conditions (e.g., NI lighting with narrowband red LEDs) [49]. Considering the contrasting flowering responses to pure and impure blue spectrum treatments from LEDs in the present study (i.e., with relatively low and high PPS, respectively), it is possible to manipulate chrysanthemum flowering using dimmable, multi-channel LED fixtures based on different production targets. For example, pure blue from LEDs at end of day can be adopted for the production of flowering plants, while adding small amounts of narrowband red and far-red to blue (to raise the PPS) can be used for the production of vegetative tissues in mother plants to increase the numbers and quality of harvestable cuttings. This is supported by the more vigorous vegetative growth in the BRFR vs. D treatments (e.g., larger plant canopy, more side branches, higher leaf area, and thicker stems).

4.2. EOD Lighting Using Impure B Spectrum with Higher PPS Had Greater Flowering Promotion Effects in LDP Calibrachoa than Pure B Spectrum with Lower PPS

For the LDP calibrachoa, the B and BRFR treatments both promoted earlier flowering compared with D. It appeared that both pure and impure blue spectrum treatments were effective as photoperiod extensions to promote the flowering of an LDP like calibrachoa. The flowering speed of the LDP Arabidopsis was directly and positively related to the duration of a impure blue treatment derived from the emission spectrum from blue fluorescent tubes passed through a filter [50], and a similar result was found in another LDP, petunia, under pure blue treatment from narrowband LED lighting [51]. Possibly, wavelengths from the blue waveband (i.e., 400 to 500 nm) are an important signal for LDPs to sense daylength to initiate flowering under natural conditions [9]. Also, the promotional flowering responses of LDPs such as calibrachoa to blue wavelengths seem to be only related to light duration rather than the spectrum’s PPS. The reason may lie in that CRY2 plays a primary role in the photoperiodic flowering of LDPs mediated by blue wavelengths and that both low-intensity blue-dominant spectrum treatments can activate CRY2 [52,53,54]. The two LED treatments in the present study had similar promotional effects on the flower appearance (e.g., mean flower index and time to 50% flowered plants) of calibrachoa, despite having different PPS values. This contrasts with our previous growth chamber study, where a lower-PPS pure blue from LEDs caused earlier flower appearance in calibrachoa than a higher-PPS impure blue treatment that had a spectrum similar to BRFR in the present study, and both spectra were provided as continuous lighting [17]. It appears that different PPS values of blue-dominant spectra used for extending the natural light photoperiod in a greenhouse, rather than for continuous lighting in a chamber, did not affect the flower initiation time of LDPs like calibrachoa. Possibly, for blue-dominant EOD spectrum treatments, the spectrum purity and phytochrome activity play less important roles in the flower initiation of this species than their photoperiod signal.
In addition to earlier flowering, the two EOD treatments increased calibrachoa flower bud numbers compared with D. This might have partly resulted from increased aerial biomass accumulation under the EOD treatments in this species, which provided a better nutritional foundation for the formation of flower buds [55]. However, despite a similar promotional effect on aerial biomass, calibrachoa under BRFR had increased flower bud numbers and DWs compared to B. Therefore, the spectral quality of EOD treatments may also regulate flower bud formation of calibrachoa plants. For LDPs, flower development is often most rapid when the spectrum contains far-red (700 to 800 nm), especially at the end of the photoperiod [56,57,58,59]. Also, many LDPs interpret exposure to far-red at the end of the photoperiod as a long-day signal [60]. In the present study, the low level of far-red in the BRFR treatment might have contributed to the formation of more flower buds on calibrachoa plants compared with the B treatment.
Regardless of PPS value, both LED treatments also increased calibrachoa main stem length and canopy width compared with D, despite no differences in canopy height because the elongated main stems tended to droop. In this case, the activity of PHYs affected by the EOD treatments seems to have had a minimal effect on plant elongation. This contrasts with our previous growth chamber studies where stem elongation was tightly related to PHY activity caused by the treatment spectra from continuous lighting, i.e., the elongation was promoted under a pure blue spectrum from LEDs (with low PPS) but not under an impure blue spectrum with a higher PPS (>0.6) in some LDPs such as calibrachoa, petunia, and wild Arabidopsis [17,29,31,32]. These contrasting results may be due to different lighting ways and background conditions: the LED treatments were applied as EOD lighting for only 4 h in a greenhouse environment in the present study versus continuous lighting treatments inside a growth chamber in the previous studies. Therefore, the effects of different PPS values of the EOD spectrum treatments on stem elongation may be minor relative to the low R:FR in natural sunlight during twilight periods [61], when the PPS drops to approximately 0.40−0.45 [62]. However, the lower intensity of the EOD treatments relative to natural daylight might have triggered SARs in calibrachoa plants, which were demonstrated by decreased LMAs in addition to promoted stem elongations [63].

4.3. EOD Lighting with Blue-Dominant Spectra Did Not Affect Flowering of DNP Geranium and Facultative SDP Gerbera but Modified Plant Morphology

Neither flowering time nor flower bud number were affected by the two EOD treatments in both DNP (geranium) and facultative SDP (gerbera) in the current study. In geranium grown under short days in a growth chamber, neither flowering time nor flower number were affected by a 4 h NI treatment of narrowband blue from LEDs at 10 μmol m−2 s−1 [64]. In this study, the gene expressions for PHYA, PHYB, and CRY1 were similar under NI lighting with narrowband blue from LEDs and the SD control. Similar flowering responses as gerbera have been found under short-day conditions (9 h) in African marigold, a SDP, where a 4 h NI lighting with narrowband blue from LEDs at 1.5 μmol m−2 s−1 did not affect flowering time [25], but 30 μmol m−2 s−1 delayed flowering [24]. This implies that low-levels (e.g., <30 μmol m−2 s−1) of narrowband blue spectra from LEDs, provided outside of the normal PAR photoperiod, may not be perceived as a day-length signal by either obligate SDPs (e.g., chrysanthemum) or facultative SDPs (e.g., gerbera). The apparent intensity-dependence of pure blue spectra treatments on flowering may be related to a positive correlation between CRY1 activity and light intensity, despite varying thresholds among plant genotypes.
Although DNPs are considered insensitive to the photoperiod in terms of flowering responses, the photoperiod can affect their morphology. For example, many DNPs are taller under long days than short days [1]. In the present study, the B and BRFR treatments enlarged geranium plant canopy and enhanced the thickness and length of the main stem but did not affect the internode length. Apparently, the promoted plant elongation of geranium is not an SAR, which is normally demonstrated by thinner and longer stems with elongated internodes [63]. Also, the typical SARs in leaf traits, such as modified leaf size, reduced chlorophyll content, and decreased leaf thickness [63], were not found under the EOD spectrum treatments. If not due to SAR, the elongation growth of geranium plants under the EOD treatments might be attributed to increased biomass accumulation, which is partly supported by the substantial or potential increase in aerial DW under the B and BRFR treatments, respectively.
In gerbera, the B and BRFR treatments also modified plant morphology by increasing flower bud DW, canopy size (i.e., height or width), individual leaf area, and LMA, despite no effects on total aerial DW. It appeared that photomorphogenesis rather than photosynthesis contributed to the morphological modifications by B and BRFR in geranium. In this species, larger canopies, thicker leaves, and larger flower buds are normally desired plant traits. Therefore, the morphological modifications by the EOD spectrum treatments may improve plant appearance and marketability. In greenhouse potted gerbera production, some long days are usually used for “bulking up” (i.e., increasing canopy size) before transitioning to short days for flowering promotion [65]. In short-day conditions, this step may be unnecessary if EOD lighting using the spectra in the present study were adopted.

5. Conclusions

In summary, compared with D, the 4 h low-level EOD B treatment delayed flowering time slightly, and increased flower bud number in chrysanthemum, but BRFR completely inhibited flower initiation for this species. Furthermore, both EOD spectrum treatments produced wider plant canopies, more side branches, larger leaves, and longer and thicker main stems in chrysanthemum. In calibrachoa both EOD spectrum treatments promoted earlier flowering, and BRFR had greater promotional effects on the number of flower buds than B. Calibrachoa plants had greater aerial biomass accumulation, wider plant canopies, and longer main stems in both EOD spectrum treatments. Although EOD spectrum treatments did not change the flowering time and flower bud numbers in geranium and gerbera, they promoted more desirable morphology attributes (according to typical market preferences). Therefore, it is possible to use these EOD spectrum treatments at to regulate the specific flowering and morphology responses of ornamental plants during winter greenhouse production. Future research on this topic should examine the responses of different species (and cultivars) from different photoperiod response groups to different EOD spectrum treatments. Along with different targeted spectra, future studies’ EOD spectrum treatments should investigate a range of different intensity levels and times of application, relative to the natural light photoperiod under greenhouse conditions. Another interesting area of future study would be the flowering responses of SD cannabis cultivars, grown both in greenhouse and indoor environments, to EOD high blue spectra treatments. These future studies should also endeavor to clarify the molecular mechanisms underlying the varying EOD spectrum responses of different plant species, such as those which were observed in the present study.

Supplementary Materials

The following supporting information can be downloaded at: https://www.mdpi.com/article/10.3390/agronomy15071649/s1, Figure S1: Weekly natural daily light integrals (DLIs) at canopy level. The natural photoperiod increased from 10.0 to 13.5 h over the course of the experiment. The average DLI over the entire experiment period was 6.7 mol m−2 d−1. Each point is a weekly average DLI ± standard error (n = 7). Figure S2: Relative photon flux distributions of spectrum treatments in greenhouse. (S2A) White LED (W) for extending the photoperiod of chrysanthemums; (S2B) high-pressure sodium (HPS) supplemental daytime lighting; (S2C) end-of-day pure blue spectrum (B); and (S2D) end-of-day spectrum combination comprising narrowband blue, red, and far-red from LEDs at a photon flux ratio of 47:3:1 (BRFR). Figure S3. The randomized complete block design for the experiment. B = end-of-day (EOD) lighting from narrowband blue LEDs; BRFR = EOD lighting from a combination of narrowband blue, red, and far-red LEDs at a photon flux ratio of 47:3:1; D = darkness (i.e., no EOD lighting). Figure S4. Schematic of the 1.2 m × 1.6 m growing area on a single bench divided into four quadrants (represented by different colors). For each bench, each quadrant was randomly assigned to one plant species. Each quadrant was divided into edge (checkerboard pattern) and treatment (solid colors) zones, each of which contains six evenly spaced (20 cm centers) plants. Once the center plants were harvested, the edge plants were moved into the center plants’ locations for further monitoring of time to flower. Each individual square is 20 cm × 20 cm. Figure S5. Representative images of the bench layout during both day (upper panels) and end-of-day (lower panels) periods. The upper left panel shows the HPS lighting turned on during the day and the lower left panel shows the LED lighting turned on after dusk. Note: the side curtains in the lower panels were temporarily raised just to take the photos. The right panels show the quadrant layout of the four plant species (clockwise from bottom left: geranium, chrysanthemum, gerbera, and calibrachoa—this order differs between benches). Table S1: The key dates over the experimental period in 2020 for the four plant species chrysanthemum, geranium, calibrachoa, and gerbera grown under different end-of-day spectrum treatments. Note: In each block and for each species, when ≥50% of the plants from any treatment(s) had at least one open flower, the sampling plants from all treatments were harvested for biomass measurements. The remaining plants were used to investigate the time to 50% flowered plants for each treatment until the end of trial.

Author Contributions

Conceptualization, Y.K., Q.L., D.L. and Y.Z.; methodology, Y.K., Q.L. and Y.Z.; validation, Y.K., D.L. and Y.Z.; formal analysis, Y.K. and Q.L.; investigation, Y.K., Q.L. and D.L.; resources, Q.L. and Y.Z.; data curation, Y.K., Q.L. and D.L.; writing—original draft preparation, Y.K., Q.L. and D.L.; writing—review and editing, Y.K., Q.L., D.L. and Y.Z.; visualization, Y.K.; project administration, Y.Z.; funding acquisition, Q.L. and Y.Z. All authors have read and agreed to the published version of the manuscript.

Funding

Funding was provided by the National Natural Science Foundation of China (Grant Number: 31872154), the Agricultural Science and Technology Innovation Program of China (34-IUA-03), and the Natural Sciences and Engineering Research Council of Canada (Grant Number: CRDPJ505238-16).

Data Availability Statement

All raw data has been curated by the corresponding author and will be made available upon request.

Acknowledgments

LED lighting was donated by Heliospectra. Thanks to Bayview Flowers and Jeffery’s Greenhouses for donating plant materials.

Conflicts of Interest

The authors declare no conflicts of interest. The funders had no role in the design of the study; in the collection, analyses, or interpretation of data; in the writing of the manuscript, or in the decision to publish the results.

References

  1. Runkle, E.S.; Heins, R.D. Manipulating the light environment to control flowering and morphogenesis of herbaceous plants. Acta Hortic. 2006, 711, 51–60. [Google Scholar] [CrossRef]
  2. Kohyama, F.; Whitman, C.; Runkle, E.S. Comparing flowering responses of long-day plants under incandescent and two commercial light-emitting diode lamps. HortTechnology 2014, 24, 490–495. [Google Scholar] [CrossRef]
  3. Erwin, J.; Mattson, N.; Warner, R. Light effects on bedding plants. Light Management in Controlled Environments; Meister Media Worldwide: Willoughby, OH, USA, 2017; pp. 119–134. [Google Scholar]
  4. Papadopoulos, A.P.; Demers, D.A.; Theriault, J. The Canadian greenhouse vegetable industry with special emphasis on artificial lighting. Acta Hortic. 2002, 580, 29–33. [Google Scholar] [CrossRef]
  5. Moe, R.; Grimstad, S.O.; Gislerod, H.R. The use of artificial light in year round production of greenhouse crops in Norway. Acta Hortic. 2006, 711, 35–42. [Google Scholar] [CrossRef]
  6. Meng, Q.; Runkle, E.S. Control of flowering using night-interruption and day-extension LED lighting. In LED Lighting for Urban Agriculture; Kozai, T., Fujiwara, K., Runkle, E.S., Eds.; Springer Science + Business Media: Singapore, 2016; pp. 191–201. [Google Scholar] [CrossRef]
  7. Simpson, G.G.; Dean, C. Arabidopsis, the Rosetta stone of flowering time? Science 2002, 296, 285–289. [Google Scholar] [CrossRef] [PubMed]
  8. Putterill, J.; Laurie, R.; Macknight, R. It’s time to flower: The genetic control of flowering time. Bioessays 2004, 26, 363–373. [Google Scholar] [CrossRef]
  9. Thomas, B. Light signals and flowering. J. Exp. Bot. 2006, 57, 3387–3393. [Google Scholar] [CrossRef]
  10. Paradiso, R.; Proietti, S. Light-quality manipulation to control plant growth and photomorphogenesis in greenhouse horticulture: The state of the art and the opportunities of modern LED systems. J. Plant Growth Regul. 2022, 41, 742–780. [Google Scholar] [CrossRef]
  11. Jeong, S.W.; Hogewoning, S.W.; van Ieperen, W. Responses of supplemental blue light on flowering and stem extension growth of cut chrysanthemum. Sci. Hortic. 2014, 165, 69–74. [Google Scholar] [CrossRef]
  12. Park, Y.G.; Jeong, B.R. How supplementary or night-interrupting low-intensity blue light affects the flower induction in chrysanthemum, a qualitative short-day plant. Plants 2020, 9, 1694. [Google Scholar] [CrossRef]
  13. Neo, D.C.J.; Ong, M.M.X.; Lee, Y.Y.; Teo, E.J.; Ong, Q.; Tanoto, H.; Xu, J.; Ong, K.S.; Suresh, V. Shaping and tuning lighting conditions in controlled environment agriculture: A review. ACS Agric. Sci. Technol. 2022, 2, 3–16. [Google Scholar] [CrossRef]
  14. Heuvelink, E.; Hemming, S.; Marcelis, L.F. Some recent developments in controlled-environment agriculture: On plant physiology, sustainability, and autonomous control. J. Hortic. Sci. Biotechnol. 2024, 1–11. [Google Scholar] [CrossRef]
  15. Morrow, R.C. LED lighting in horticulture. HortScience 2008, 43, 1947–1950. [Google Scholar] [CrossRef]
  16. Van Ieperen, W. Plant morphological and developmental responses to light quality in a horticultural context. Acta Hortic. 2012, 956, 131–139. [Google Scholar] [CrossRef]
  17. Kong, Y.; Schiestel, K.; Zheng, Y. Blue light associated with low phytochrome activity can promote flowering: A comparison with red light in four bedding plant species. Acta Hortic. 2020, 1296, 433–440. [Google Scholar] [CrossRef]
  18. Kong, Y.; Kamath, D.; Zheng, Y. Blue-light-promoted elongation and flowering are not artifacts from 24-h lighting: A comparison with red light in four bedding plant species. Acta Hortic. 2020, 1296, 659–666. [Google Scholar] [CrossRef]
  19. Singh, M.C.; van Ieperen, W.; Heuvelink, E.P. Effect of LEDs on flower bud induction in Chrysanthemum morifolium cv. Zembla. HortFlora Res. Spectr. 2013, 2, 185–188. [Google Scholar]
  20. Park, Y.G.; Jeong, B.R. Night interruption light quality changes morphogenesis, flowering, and gene expression in Dendranthema grandiflorum. Hortic. Environ. Biotechnol. 2019, 60, 167–173. [Google Scholar] [CrossRef]
  21. Higuchi, Y.; Sumitomo, K.; Oda, A.; Shimizu, H.; Hisamatsu, T. Day light quality affects the night-break response in the short-day plant chrysanthemum, suggesting differential phytochrome-mediated regulation of flowering. J. Plant Physiol. 2012, 169, 1789–1796. [Google Scholar] [CrossRef]
  22. Kohler, A.E.; Birtell, E.M.; Runkle, E.S.; Meng, Q. Day-extension blue light inhibits flowering of chrysanthemum when the short main photoperiod includes far-red light. J. Am. Soc. Hortic. Sci. 2023, 148, 89–98. [Google Scholar] [CrossRef]
  23. SharathKumar, M.; Luo, J.; Xi, Y.; van Ieperen, W.; Marcelis, L.F.; Heuvelink, E. Several short-day species can flower under blue-extended long days, but this response is not universal. Sci. Hortic. 2024, 325, 112657. [Google Scholar] [CrossRef]
  24. Meng, Q.; Runkle, E.S. Moderate-intensity blue radiation can regulate flowering, but not extension growth, of several photoperiodic ornamental crops. Environ. Exp. Bot. 2017, 134, 12–20. [Google Scholar] [CrossRef]
  25. Meng, Q.; Runkle, E.S. Low-intensity blue light in night-interruption lighting does not influence flowering of herbaceous ornamentals. Sci. Hortic. 2015, 186, 230–238. [Google Scholar] [CrossRef]
  26. Lopez, R.G.; Meng, Q.; Runkle, E.S. Blue radiation signals and saturates photoperiodic flowering of several long-day plants at crop-specific photon flux densities. Sci. Hortic. 2020, 271, 109470. [Google Scholar] [CrossRef]
  27. Rajapakse, N.C.; Young, R.E.; McMahon, M.J.; Oi, R. Plant height control by photoselective filters: Current status and future prospects. HortTechnology 1999, 9, 618–624. [Google Scholar] [CrossRef]
  28. Runkle, E.S.; Heins, R.D. Photocontrol of flowering and extension growth in the long-day plant pansy. J. Am. Soc. Hortic. Sci. 2003, 128, 479–485. [Google Scholar] [CrossRef]
  29. Kong, Y.; Stasiak, M.; Dixon, M.A.; Zheng, Y. Blue light associated with low phytochrome activity can promote elongation growth as shade-avoidance response: A comparison with red light in four bedding plant species. Environ. Exp. Bot. 2018, 155, 345–359. [Google Scholar] [CrossRef]
  30. Sager, J.C.; Smith, W.O.; Edwards, J.L.; Cyr, K.L. Photosynthetic efficiency and phytochrome photoequilibria determination using spectral data. Trans. Am. Soc. Agric. Eng. 1988, 31, 1882–1889. [Google Scholar] [CrossRef]
  31. Kong, Y.; Zheng, Y. Phototropin is partly involved in blue-light-mediated stem elongation, flower initiation, and leaf expansion: A comparison of phenotypic responses between wild Arabidopsis and its phototropin mutants. Environ. Exp. Bot. 2020, 171, 103967. [Google Scholar] [CrossRef]
  32. Kong, Y.; Zheng, Y. Low-activity cryptochrome 1 plays a role in promoting stem elongation and flower initiation of mature Arabidopsis under blue light associated with low phytochrome activity. Can. J. Plant Sci. 2022, 102, 755–759. [Google Scholar] [CrossRef]
  33. SharathKumar, M.; Heuvelink, E.; Marcelis, L.F.; Van Ieperen, W. Floral induction in the short-day plant chrysanthemum under blue and red extended long-days. Front. Plant Sci. 2021, 11, 610041. [Google Scholar] [CrossRef] [PubMed]
  34. Ying, Q.; Kong, Y.; Zheng, Y. Applying blue light alone, or in combination with far-red light, during nighttime increases elongation without compromising yield and quality of indoor-grown microgreens. HortScience 2020, 55, 876–881. [Google Scholar] [CrossRef]
  35. Ying, Q.; Kong, Y.; Zheng, Y. Overnight supplemental blue, rather than far-red, light improves microgreen yield and appearance quality without compromising nutritional quality during winter greenhouse production. HortScience 2020, 55, 1468–1474. [Google Scholar] [CrossRef]
  36. Llewellyn, D.; Schiestel, K.; Zheng, Y. Increasing levels of supplemental LED light enhances the rate flower development of greenhouse-grown cut gerbera but does not affect flower size and quality. Agronomy 2020, 10, 1332. [Google Scholar] [CrossRef]
  37. Mah, J.J.; Llewellyn, D.; Zheng, Y. Blackout reduces height of easter lily but end-of-day red light treatment using light-emitting diodes does not. HortTechnology 2020, 30, 156–162. [Google Scholar] [CrossRef]
  38. Meier, U. BBCH-Monograph: Growth Stages of Mono- and Dicotyledonous Plants; Julius Kühn-Institut (JKI): Quedlinburg, Germany, 2018. [Google Scholar]
  39. Kong, Y.; Zheng, Y. Diverse flowering response to blue light manipulation: Application of electric lighting in controlled-environment plant production. Horticulturae 2024, 10, 578. [Google Scholar] [CrossRef]
  40. Nissim-Levi, A.; Kitron, M.; Nishri, Y.; Ovadia, R.; Forer, I.; Oren-Shamir, M. Effects of blue and red LED lights on growth and flowering of Chrysanthemum morifolium. Sci. Hortic. 2019, 254, 77–83. [Google Scholar] [CrossRef]
  41. Kong, Y.; Zheng, Y. Complex signaling networks underlying blue-light-mediated floral transition in plants. Plants 2025, 14, 1533. [Google Scholar] [CrossRef]
  42. Yang, J.; Song, J.; Jeong, B.R. The flowering of SDP chrysanthemum in response to intensity of supplemental or night-interruptional blue light is modulated by both photosynthetic carbon assimilation and photoreceptor-mediated regulation. Front. Plant Sci. 2022, 13, 981143. [Google Scholar] [CrossRef]
  43. Yang, J.; Song, J.; Jeong, B.R. Blue light supplemented at intervals in long-day conditions intervenes in photoperiodic flowering, photosynthesis, and antioxidant properties in chrysanthemums. Antioxidants 2022, 11, 2310. [Google Scholar] [CrossRef]
  44. Yang, J.; Song, J.; Jeong, B.R. Low-intensity blue light supplemented during photoperiod in controlled environment induces flowering and antioxidant production in kalanchoe. Antioxidants 2022, 11, 811. [Google Scholar] [CrossRef] [PubMed]
  45. Yang, J.; Song, J.; Park, Y.G.; Jeong, B.R. Both the positioned supplemental or night-interruptional blue light and the age of leaves (or tissues) are important for flowering and vegetative growth in chrysanthemum. Plants 2024, 13, 2874. [Google Scholar] [CrossRef] [PubMed]
  46. Kong, Y.; Zheng, Y. Multiple signals can be integrated into pathways of blue-light-mediated floral transition: Possible explanations on diverse flowering responses to blue light manipulation. Agronomy 2025, 15, 1534. [Google Scholar] [CrossRef]
  47. Stutte, G.W. Light-emitting diodes for manipulating the phytochrome apparatus. HortScience 2009, 44, 231–234. [Google Scholar] [CrossRef]
  48. Craig, D.S.; Runkle, E.S. A moderate to high red to far-red light ratio from light-emitting diodes controls flowering of short-day plants. J. Am. Soc. Hortic. Sci. 2013, 138, 167–172. [Google Scholar] [CrossRef]
  49. Higuchi, Y.; Narumi, T.; Oda, A.; Nakano, Y.; Sumitomo, K.; Fukai, S.; Hisamatsu, T. The gated induction system of a systemic floral inhibitor, antiflorigen, determines obligate short-day flowering in chrysanthemums. Proc. Natl. Acad. Sci. USA 2013, 110, 17137–17142. [Google Scholar] [CrossRef] [PubMed]
  50. Eskins, K. Light quality effects on Arabidopsis development: Red, blue and far-red regulation of flowering and morphology. Physiol. Plant. 1992, 86, 439–444. [Google Scholar] [CrossRef]
  51. Fukuda, N.; Ajima, C.; Yukawa, T.; Olsen, J.E. Antagonistic action of blue and red light on shoot elongation in petunia depends on gibberellin, but the effects on flowering are not generally linked to gibberellin. Environ. Exp. Bot. 2016, 121, 102–111. [Google Scholar] [CrossRef]
  52. Guo, H.; Yang, H.; Mockler, T.C.; Lin, C. Regulation of flowering time by Arabidopsis photoreceptors. Science 1998, 279, 1360–1363. [Google Scholar] [CrossRef]
  53. Lin, C.; Yang, H.; Guo, H.; Mockler, T.; Chen, J.; Cashmore, A.R. Enhancement of blue-light sensitivity of Arabidopsis seedlings by a blue light receptor cryptochrome 2. Proc. Natl. Acad. Sci. USA 1998, 95, 2686–2690. [Google Scholar] [CrossRef]
  54. Lin, C. Photoreceptors and regulation of flowering time. Plant Physiol. 2000, 123, 39–50. [Google Scholar] [CrossRef]
  55. Zeevaart, J.A.D. Physiology of flower formation. Annu. Rev. Plant Physiol. 1976, 27, 321–348. [Google Scholar] [CrossRef]
  56. Runkle, E.S.; Heins, R.D. Specific functions of red, far red, and blue light in flowering and stem extension of long-day plants. J. Am. Soc. Hortic. Sci. 2001, 126, 275–282. [Google Scholar] [CrossRef]
  57. Thomas, B.; Vince-Prue, D. Do long-day plants and short-day plants perceive daylength in the same way? Flower. Newsl. 1995, 50–58. Available online: https://www.jstor.org/stable/43008156 (accessed on 29 May 2025).
  58. Lane, H.; Cathey, H.; Evans, L. The dependence of flowering in several long-day plants on the spectral composition of light extending the photoperiod. Am. J. Bot. 1965, 52, 1006–1014. [Google Scholar]
  59. Kohler, A.E.; Lopez, R.G. Duration of light-emitting diode (LED) supplemental lighting providing far-red radiation during seedling production influences subsequent time to flower of long-day annuals. Sci. Hortic. 2021, 281, 109956. [Google Scholar] [CrossRef]
  60. Lagercrantz, U. At the end of the day: A common molecular mechanism for photoperiod responses in plants? J. Exp. Bot. 2009, 60, 2501–2515. [Google Scholar] [CrossRef]
  61. Hughes, J.; Morgan, D.; Lambton, P.; Black, C.; Smith, H. Photoperiodic time signals during twilight. Plant Cell Environ. 1984, 7, 269–277. [Google Scholar] [CrossRef]
  62. Holmes, M.; Smith, H. The function of phytochrome in the natural environment—I. Characterization of daylight for studies in photomorphogenesis and photoperiodism. Photochem. Photobiol. 1977, 25, 533–538. [Google Scholar] [CrossRef]
  63. Smith, H.; Whitelam, G.C. The shade avoidance syndrome: Multiple responses mediated by multiple phytochromes. Plant Cell Environ. 1997, 20, 840–844. [Google Scholar] [CrossRef]
  64. Park, Y.G.; Muneer, S.; Soundararajan, P.; Manivnnan, A.; Jeong, B.R. Light quality during night interruption affects morphogenesis and flowering in geranium. Hortic. Environ. Biotechnol. 2017, 58, 212–217. [Google Scholar] [CrossRef]
  65. Singh, A.K. Flower Crops: Cultivation and Management; New India Publishing: New Delhi, India, 2006. [Google Scholar]
Figure 1. Representative images depicting the defined levels for the flowering index of each species.
Agronomy 15 01649 g001
Figure 2. Mean flowering index (AD) and cumulative number of flower buds (EH) of individual plants of chrysanthemum, geranium, calibrachoa, and gerbera grown under different end-of-day (EOD) spectrum treatments. Data are means ± standard error (SE) (n = 3). In the legends, B = EOD lighting from narrowband blue LEDs; BRFR = EOD lighting from a combination of narrowband blue, red, and far-red LEDs at a photon flux ratio of 47:3:1; D = darkness (i.e., no EOD lighting). For chrysanthemum (A,E), no plants under the BRFR treatment had visible flower buds from the start to the end of the whole experiment, so only two treatments were presented in this species. For each time point, data marked with the same or no letter are not significantly different at p ≤ 0.05 according to Duncan’s new multiple range test.
Agronomy 15 01649 g002
Figure 3. Number of days from the start of the treatment to 50% flowered plants in each species × treatment combination (A) and average dry weight (DW) of individual flower buds at plant harvest (B) in chrysanthemum (M), geranium (P), calibrachoa (C), and gerbera (G) under different end-of-day (EOD) spectrum treatments. Flowered plants (A) are defined as those that had at least one open flower. Data are means ± SE (n = 3). In the legends, B = EOD lighting from narrowband blue LEDs; BRFR = EOD lighting from a combination of narrowband blue, red, and far-red LEDs at a photon flux ratio of 47:3:1; D = darkness (i.e., no EOD lighting). In (B), DW = dry weight; FL = flower buds and opened flowers. For each plant species, bars marked with the same letter are not significantly different at p ≤ 0.05 according to Duncan’s new multiple range test. No data is shown for chrysanthemum under BRFR because no plants flowered by the end of the experiment.
Agronomy 15 01649 g003
Figure 4. Morphological parameters of whole plant canopy (A,B), main stem (CF), and foliar tissues on the main stem (GI), measured at harvest in chrysanthemum (M), geranium (P), calibrachoa (C), and gerbera (G) under different end-of-day (EOD) spectrum treatments. Data are means ± SE (n = 3). In (C,D), MS = main stem; in (I), LMA = leaf mass per unit area. In the legends, B = EOD lighting from narrowband blue LEDs; BRFR = EOD lighting from a combination of narrowband blue, red, and far-red LEDs at a photon flux ratio of 47:3:1; D = darkness (i.e., no EOD lighting). For each plant species, bars marked with the same letter are not significantly different at p ≤ 0.05 according to Duncan’s new multiple range test. No data is presented for internode length (E) and number of side branches (F) for gerbera due to its rosette-type growth.
Agronomy 15 01649 g004
Figure 5. Plant biomass accumulation (A) and partitioning (BD) at harvest in chrysanthemum (M), geranium (P), calibrachoa (C), and gerbera (G) under different end-of-day (EOD) spectrum treatments. Data are means ± SE (n = 3). In (AD), Aerial DW = total dry weight of all aboveground tissues; in (B), FL = floral tissues; in (C), MS = main stem tissues; in (D), SB = side branch tissues. In the legends, B = EOD lighting from narrowband blue LEDs; BRFR = EOD lighting from a combination of narrowband blue, red, and far-red LEDs at a photon flux ratio of 47:3:1; D = darkness (i.e., no EOD lighting). For each plant species, bars marked with the same letter are not significantly different at p ≤ 0.05 according to Duncan’s new multiple range test. Chrysanthemum did not develop visible flowers under BRFR (B), and gerbera did not have side branches (D); no bars are presented for these data.
Agronomy 15 01649 g005
Table 1. Day and night temperature and relative humidity (RH) in each compartment.
ParameterCompartment
123
Day temperature (°C)21.5 ± 0.4321.6 ± 0.4821.9 ± 1.22
Day RH (%)53.5 ± 4.8354.9 ± 3.3452.6 ± 4.08
Night temperature (°C)18.4 ± 0.3518.5 ± 0.3718.4 ± 0.45
Night RH (%)58.7 ± 3.3657.6 ± 2.3155.9 ± 2.67
Note: Data are means ± standard deviation (SD).
Disclaimer/Publisher’s Note: The statements, opinions and data contained in all publications are solely those of the individual author(s) and contributor(s) and not of MDPI and/or the editor(s). MDPI and/or the editor(s) disclaim responsibility for any injury to people or property resulting from any ideas, methods, instructions or products referred to in the content.

