Article

An Experimental Study on the Charging Effects and Atomization Characteristics of a Two-Stage Induction-Type Electrostatic Spraying System for Aerial Plant Protection

1
College of Engineering, Heilongjiang Bayi Agricultural University, Daqing 163319, China
2
Heilongjiang Province Conservation Tillage Engineering Technology Research Center, Daqing 163319, China
3
Key Laboratory of Soybean Mechanized Production, Ministry of Agriculture and Rural Affairs, Daqing 163319, China
4
School of Agricultural Engineering, Jiangsu University, Zhenjiang 212013, China
*
Author to whom correspondence should be addressed.
Agronomy 2025, 15(7), 1641; https://doi.org/10.3390/agronomy15071641
Submission received: 2 May 2025 / Revised: 29 June 2025 / Accepted: 1 July 2025 / Published: 5 July 2025
(This article belongs to the Section Agricultural Biosystem and Biological Engineering)

Abstract

To address the technical problems of broad droplet size spectrum, insufficient atomization uniformity, and spray drift in plant protection unmanned aerial vehicle (UAV) applications, this study developed a novel two-stage aerial electrostatic spraying device based on the coupled mechanisms of hydraulic atomization and electrostatic induction, and, through the integration of three-dimensional numerical simulation and additive manufacturing technology, a new two-stage inductive charging device was designed on the basis of the traditional hydrodynamic nozzle structure, and a synergistic optimization study of the charging effect and atomization characteristics was carried out systematically. With the help of a charge ratio detection system and Malvern laser particle sizer, spray pressure (0.25–0.35 MPa), charging voltage (0–16 kV), and spray height (100–1000 mm) were selected as the key parameters, and the interaction mechanism of each parameter on the droplet charge ratio (C/m) and the particle size distribution (Dv50) was analyzed through the Box–Behnken response surface experimental design. The experimental data showed that when the charge voltage was increased to 12 kV, the droplet charge-to-mass ratio reached a peak value of 1.62 mC/kg (p < 0.01), which was 83.6% higher than that of the base condition; the concentration of the particle size distribution of the charged droplets was significantly improved; charged droplets exhibited a 23.6% reduction in Dv50 (p < 0.05) within the 0–200 mm core atomization zone below the nozzle, with the coefficient of variation of volume median diameter decreasing from 28.4% to 16.7%. This study confirms that the two-stage induction structure can effectively break through the charge saturation threshold of traditional electrostatic spraying, which provides a theoretical basis and technical support for the optimal design of electrostatic spraying systems for plant protection UAVs. This technology holds broad application prospects in agricultural settings such as orchards and farmlands. It can significantly enhance the targeted deposition efficiency of pesticides, reducing drift losses and chemical usage, thereby enabling agricultural enterprises to achieve practical economic benefits, including reduced operational costs, improved pest control efficacy, and minimized environmental pollution, while generating environmental benefits.

1. Introduction

In recent years, plant protection unmanned aerial vehicles (UAVs) have emerged as a critical direction in the development of precision agricultural aviation equipment in China, owing to their technical advantages in high operational efficiency, low operating costs, and strong terrain adaptability [1,2,3]. Unlike ground-based boom sprayers, typical multi-rotor plant protection UAVs employ low-volume (LV) spraying technology, with application rates typically controlled within 12–20 L/hm2 [4,5,6]. Their operational height must be maintained within a threshold range of 1.5–3 m due to the influence of rotor downwash airflow [7]. Under these working conditions, the droplet size spectrum exhibits a span value > 1.5, while droplet trajectories are susceptible to coupled interference from environmental turbulence and rotor-induced windfield shear effects, resulting in drift and off-target deposition rates as high as 35–40% [8]. Consequently, developing auxiliary deposition-enhancement technologies such as aerial electrostatic spraying has become a pivotal breakthrough for improving pesticide utilization efficiency [9,10,11,12,13].
Electrostatic spraying technology enhances deposition efficiency by establishing a spatial electric field between charged droplets and targets [14]. Under the synergistic effect of rotor-induced airflow and Coulomb force fields, this technology significantly improves droplet deposition penetration [15,16]. The underlying mechanisms include the following: ① Reduced surface tension of charged droplets, promoting secondary atomization to achieve optimized droplet size distributions. ② Electric field-driven directional migration of charged droplet swarms, increasing terminal deposition velocity. ③ Enhanced adhesion to crop canopies through mirror charge effects [17]. Studies have demonstrated that when the charge-to-mass ratio (q/m) reaches 1.2 mC/kg, the deposition density disparity between the adaxial and abaxial leaf surfaces can be markedly reduced [18,19,20].
As the core actuator of electrostatic spraying systems, the electrode configuration of electrostatic nozzles directly governs charging efficiency and atomization uniformity. Based on charging principles, droplet electrification methods are classified as follows: Contact charging: high-voltage direct loading onto the liquid achieves high charging efficiency but risks electrical breakdown. Corona charging: ion cloud generation via corona discharge offers controllable field strength yet demands elevated voltages. Induction charging: non-contact charging through inter-electrode induction fields ensures operational safety, particularly suited for dynamic aerial conditions [21,22]. Significant advancements in aerial electrostatic nozzle design have been reported: Liu Peng [23]. developed a conical induction ring for the Y-5B manned agricultural aircraft, boosting cotton canopy deposition by 31.6%; Liao Hong [24] achieved a droplet charge-to-mass ratio of 1.18 mC/kg using a contact-charging electrostatic nozzle. Based on the inductive charging principle, Wang Yatao [25] designed an inductive electrostatic centrifugal nozzle. When the applied voltage reached 8 kV, the charge-to-mass ratio peaked at 0.59 mC/kg; and Lian Qi [26] designed a fan-shaped plate electrode for a six-rotor UAV. Experimental results showed that the average deposition density of charged droplets above crop leaves increased by 13.6%.
Despite these advances, critical bottlenecks persist in aerial electrostatic spraying: insufficient quantitative studies on multifactorial charging efficiency [27,28,29]; limitations in spatial distribution uniformity evaluation; absence of quantitative criteria correlating electrode structural parameters with charging performance; and poor device compatibility across UAV platforms [30,31,32].
This study addresses these challenges through a dual-stage induction electrode configuration, with a primary annular electrode for pre-charging enhancement and a secondary conical electrode for charge compensation, and Box–Behnken response surface models linking q/m and Dv50 to operational parameters. The findings provide theoretical support for standardized design of aerial electrostatic spray systems and operational parameter optimization. The specific research objectives and tasks primarily include the following:
1. Developing a two-stage inductive charging device to enhance the charge capacity of electrostatic spray droplets, achieving synergistic optimization of charging efficiency and atomization characteristics. 2. Quantitatively analyzing the interaction mechanisms of operational parameters (spray pressure, charging voltage, spray height) on droplet charge-to-mass ratio (q/m) and particle size distribution. 3. Establishing a response surface prediction model for charging efficacy and atomization performance to provide a theoretical basis for parameter optimization in plant protection UAV electrostatic spray systems. The research technical roadmap is illustrated in Figure 1.

2. Materials and Methods

2.1. Test Materials

Based on inductive droplet charging principles, this study developed a two-stage electrostatic nozzle induction electrode system with spatial electric field modulation (Figure 2) using a modular design framework. The system comprises three integrated modules: atomization module (nozzle), charge loading module (two-stage induction electrodes), and high-voltage generation module (electrostatic generator). Through dual-layer electric field synergy, the system achieves synchronized optimization of droplet charging and spatial distribution. This two-stage structure differs significantly from single-stage inductive systems: the primary electrode focuses on pre-charging in the liquid film breakup zone to enhance initial charging efficiency, while the secondary electrode provides a spatial gradient electric field to compensate for charge decay and regulate droplet trajectories. This configuration overcomes the charging efficiency limitations of traditional systems in aerial plant protection operations and enhances resistance to windfield interference. The core innovation lies in the hierarchically structured two-stage induction electrodes: A primary charging electrode (inner layer), fabricated from T2-grade copper alloy via precision wire-cut electrical discharge machining (EDM); its curvature radius was optimized through finite element electric field simulations to establish an axial non-uniform electric field within the liquid film breakup zone. A secondary induction electrode (outer layer), constructed using rolled anti-oxidation copper foil bonded to the housing via a lamination process; this component generates a spatial gradient electric field that concurrently enables secondary droplet atomization and trajectory modulation.
The experiment utilized ST110 series flat fan nozzles and TR80 series hollow cone nozzles (Lechler GmbH, Metzingen, Germany) as the base atomization units, The ST110 and TR80 series agricultural nozzles are shown in Figure 3. Through CFD-DPM coupled simulations, critical geometric parameters of the electrodes were determined. At spray pressures of 0.2–0.5 MPa, the VOF multiphase flow model identified the initial liquid film breakup zone within 12–18 mm downstream of the nozzle orifice. Based on this, the axial spacing between the two-stage electrodes was set to 16 ± 0.5 mm. The electrode dimension drawing is shown in Figure 4. The electrode geometry was optimized via electrostatic-fluidic coupled field simulations: The hollow cone nozzle was paired with a conical electrode (apex angle: 80°, generatrix length: 17 mm). The flat fan nozzle was matched to a wedge-shaped electrode (opening angle: 110°, flow-guiding plate length: 17 mm). This configuration maintained a 0.8–1.2 mm gap between the electrodes and liquid film to ensure sufficient induction electric field intensity (4.5–6.2 kV/cm).
The electrode system employs a layered electrical connection scheme (Figure 5): electrodes are connected to a JD-15 high-voltage electrostatic generator (adjustable output: 0–20 kV) via ceramic insulating terminals, establishing a spatial potential gradient distribution between the inner and outer electrodes. For the dual-plate structure of the flat fan nozzle, silver-plated copper braided straps were used for parallel connections. Testing confirmed a <5% potential difference across electrode surfaces, ensuring high uniformity of electric field distribution.

2.2. Test Equipment and Method

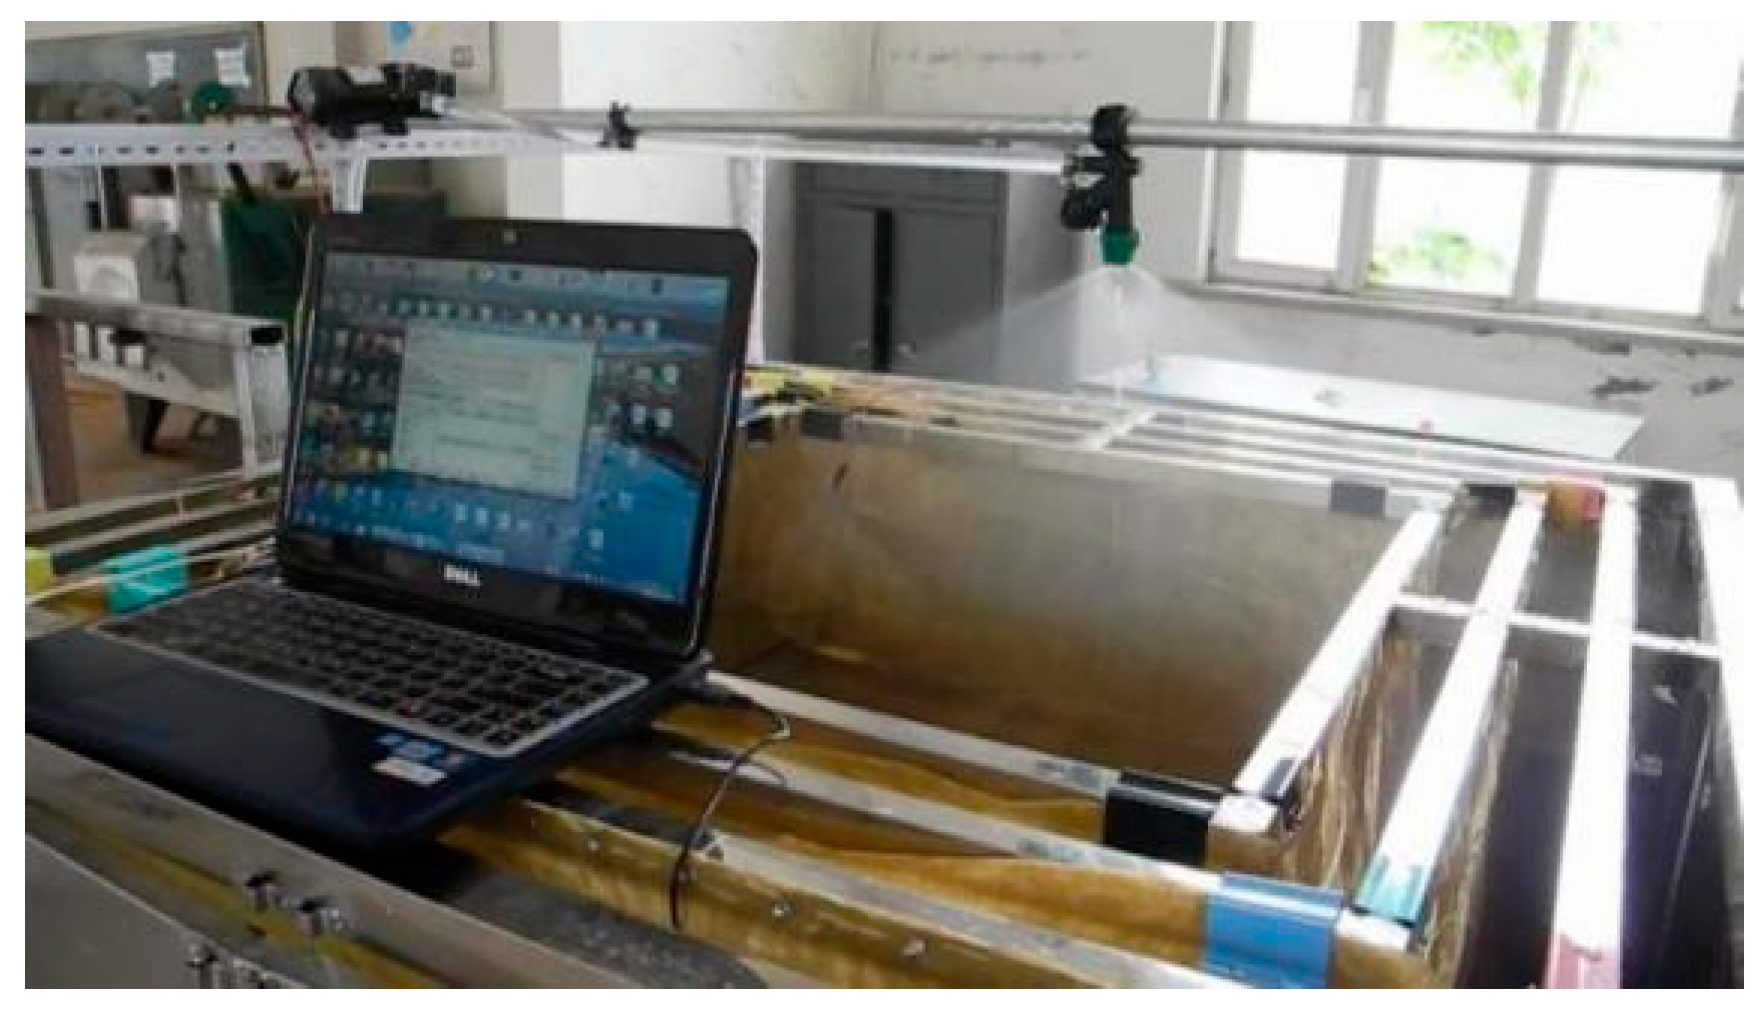
2.2.1. Charge-to-Mass Ratio Measurement System

The experiment was conducted at the HARDI Plant Protection Machinery Test Center of Heilongjiang Bayi Agricultural University. A droplet charge-to-mass ratio (q/m) quantitative detection platform based on the current integration method was established (Figure 6). The system comprises three modules: (1) Liquid Supply Unit: 20 L polyethylene chemical tank Diaphragm-type variable-frequency pump (flow rate: 0.1–3.0 L/min, accuracy: ±1.5% FS) and digital pressure gauge (range: 0–1 MPa). (2) Charging Unit: custom-developed two-stage induction nozzle DW-N303 high-voltage DC power supply (0–30 kV/2 mA). (3) Detection Unit: mesh-based collection assembly for droplets; microcurrent electrometer, timer, and computer core component; targeted gradient mesh charge collector (Figure 7) with three-layer graded copper mesh (80/200/400 mesh), 60° inclination angle 304 stainless steel drainage channel performance metrics (collection efficiency ≥ 92%) (residual volume < 1 mL).
The charge quantification process was conducted as the charged droplet swarms entered the collection assembly through a calibration zone (500 ± 5 mm below the nozzle), where current signals were acquired in real-time using a KEITHLEY 6487 picoammeter (Keithley, Cleveland, OH, USA) (resolution: 0.1 pA). Time-integrated mass was measured synchronously via a Sartorius CPA225D electronic balance (Lower Saxony, Göttingen, Germany) (accuracy: 0.1 mg). The charge-to-mass ratio (q/m) was calculated using the following formula:
q / m = 0 t I t d t ρ V = Q M
In the equation, I denotes the instantaneous current (μA), t represents the sampling period (s), ρ is the liquid density (kg/m3), and V refers to the collected liquid volume (mL). Each experimental group was replicated five times. Sampling duration was maintained at 60 ± 0.5 s. Ambient conditions were controlled at 25 ± 2 °C and 60 ± 5% RH.

2.2.2. Atomization Characteristics Inspection System

The droplet size distribution test was completed at the Precision Application Technology Research Centre of China Agricultural University, using a laser diffraction-based method to build a fogging detection test bed (Figure 8). The core equipment of the system includes the following: (1) Malvern Spraytec real-time spray particle size analyzer equipped with a 300 mm focal length lens set, measuring range 0.1–2000 μm, sampling frequency of 2500 Hz. The measurement distance was fixed within the core atomization zone (0–200 mm below the nozzle), with five replicates collected per test condition (each lasting 2 s) to ensure statistical significance of the particle size distribution. (2) Electrostatic spraying test bench with positioning accuracy of ±1 mm, equipped with laser alignment system to ensure that the measurement of the optical path and the axis of the fog field coincide. Figure 9 shows the schematic diagram of the inductive electrostatic spray droplet size test system, using laser diffraction technology, which can provide stable, real-time droplet size measurement data.

2.3. Numerical Simulation

2.3.1. Electrostatic Printhead Charging Performance One-Factor Test

Based on the theory of the charging characteristics of inductive electrostatic sprays, combined with the requirements of the testing of charging efficiency, the charging voltage (5–16 kV, step 1 kV) and spray height (100–1000 mm, step 100 mm) were selected as the key single variables. The 12 × 10 full factorial test matrix was generated by Design-Expert (V10), and each set of tests was repeated three times.

2.3.2. Electrostatic Printhead Charge Performance Response Surface Test

In order to determine the optimal range of operating parameters for this type of electrostatic spray gun, three factors that have a significant effect on the droplet charge-to-mass ratio were selected on the basis of the one-factor test, electrostatic voltage (A), spray flow rate (B), and spray height (C), and three-factor, three-level response surface analysis tests were conducted. A Box–Behnken design (BBD) was used to construct a three-factor, three-level response surface model (Table 1), and the parameter ranges were determined by inflection point analysis of the one-factor test:
As the spray flow rate of each model of the standard nozzle used in the test is determined by the spray pressure, the spray flow rate under the spray pressure of 0.20 and 0.35 Mpa is selected as the upper and lower level values of the flow factor in the test. The designed influencing factors and their upper and lower data in the software were as follows: the electrostatic voltage of the upper and lower levels were set to 15 and 5 kV; the spray flow up and down was at the level of 0.63 and 0.48 L/min; the spray height up and down was at the level of 1 and 0.2 m; the center of the level was in accordance with the upper and lower levels of the median value.

2.3.3. Single Factor Test for Atomization Performance

Using ST and TR nozzles as test subjects, single-factor experiments on pressure-–droplet size and charging voltage–droplet size relationships were conducted to investigate the influence of spray pressure and electrostatic voltage on droplet size distribution. The test liquid was tap water, with six nozzle models selected: LECHER TR80-01, TR80-02, TR80-03 (hollow cone type), ST110-01, ST110-02, and ST110-03 (flat fan type). Volume median diameter (Dv50) served as the droplet size metric, defined as the droplet diameter at which the cumulative volume distribution reaches 50% (abbreviated as VMD).
Test debugging to be tested in the spray area is located in the center of the spray; the pressure–particle size of the single-factor test in the spray measurement pressure adjustment was in the range of 0.25~0.35 MPa; charging voltage particle size of the single-factor test in the spray pressure is fixed to 0.3 Mpa; the electrostatic voltage is in the range of 6~15 kV. In the droplet size test in the indoor test without side wind conditions, take the distance from the nozzle of the 500 mm as the test plane, the same test conditions three times the results are averaged. The results of 3 tests under the same test conditions were averaged.

2.3.4. Multi-Factor Experiment on Atomization Performance of Electrostatic Nozzles

In order to investigate the influence of each factor on the droplet size, a multifactorial orthogonal test was conducted on the basis of a single-factor test to quantify the magnitude of correlation between each influencing factor and the droplet size. The independent variables were nozzle flow rate, spray pressure, and electrostatic voltage, and the dependent variable was droplet size. In order to facilitate the categorization study, the tests were conducted separately according to the type of nozzle. The indoor space for the particle size influence factor test can exclude the influence of environmental factors on the droplet size.

2.3.5. Spatial Particle Size Spectra of Inductive Aerospace Electrostatic Sprays

Compared with ordinary spray, the particle size of droplets under electrostatic spray is significantly reduced; in order to analyze the regulation mechanism of the electrostatic field on the spatial distribution of droplets, select one nozzle model from each of the two nozzle types. The design of the grid sampling scheme and the locations of sampling points in the spray flow field are shown in Figure 10. Sampling point layout: within the spatial boundary of the spray nozzle fog field, take the spray nozzle spray plumb line side of the area to be measured; longitudinal (Y-axis), 100–500 mm below the nozzle, step length of 100 mm; transverse (X-axis), spray width of 250 mm, step length of 50 mm; to form a total of 23 grid matrices. Each measurement point was collected for 10 s, and the local Dv50 was calculated by Spraytec (V2.0); then, the data of each sampling point were sorted out, and the Kriging interpolation was carried out by using OriginPro 2022 to draw a two-dimensional cloud map of the spatial distribution of the spray particle size spectrum.

3. Results

3.1. Electrostatic Spray Charging Characteristics

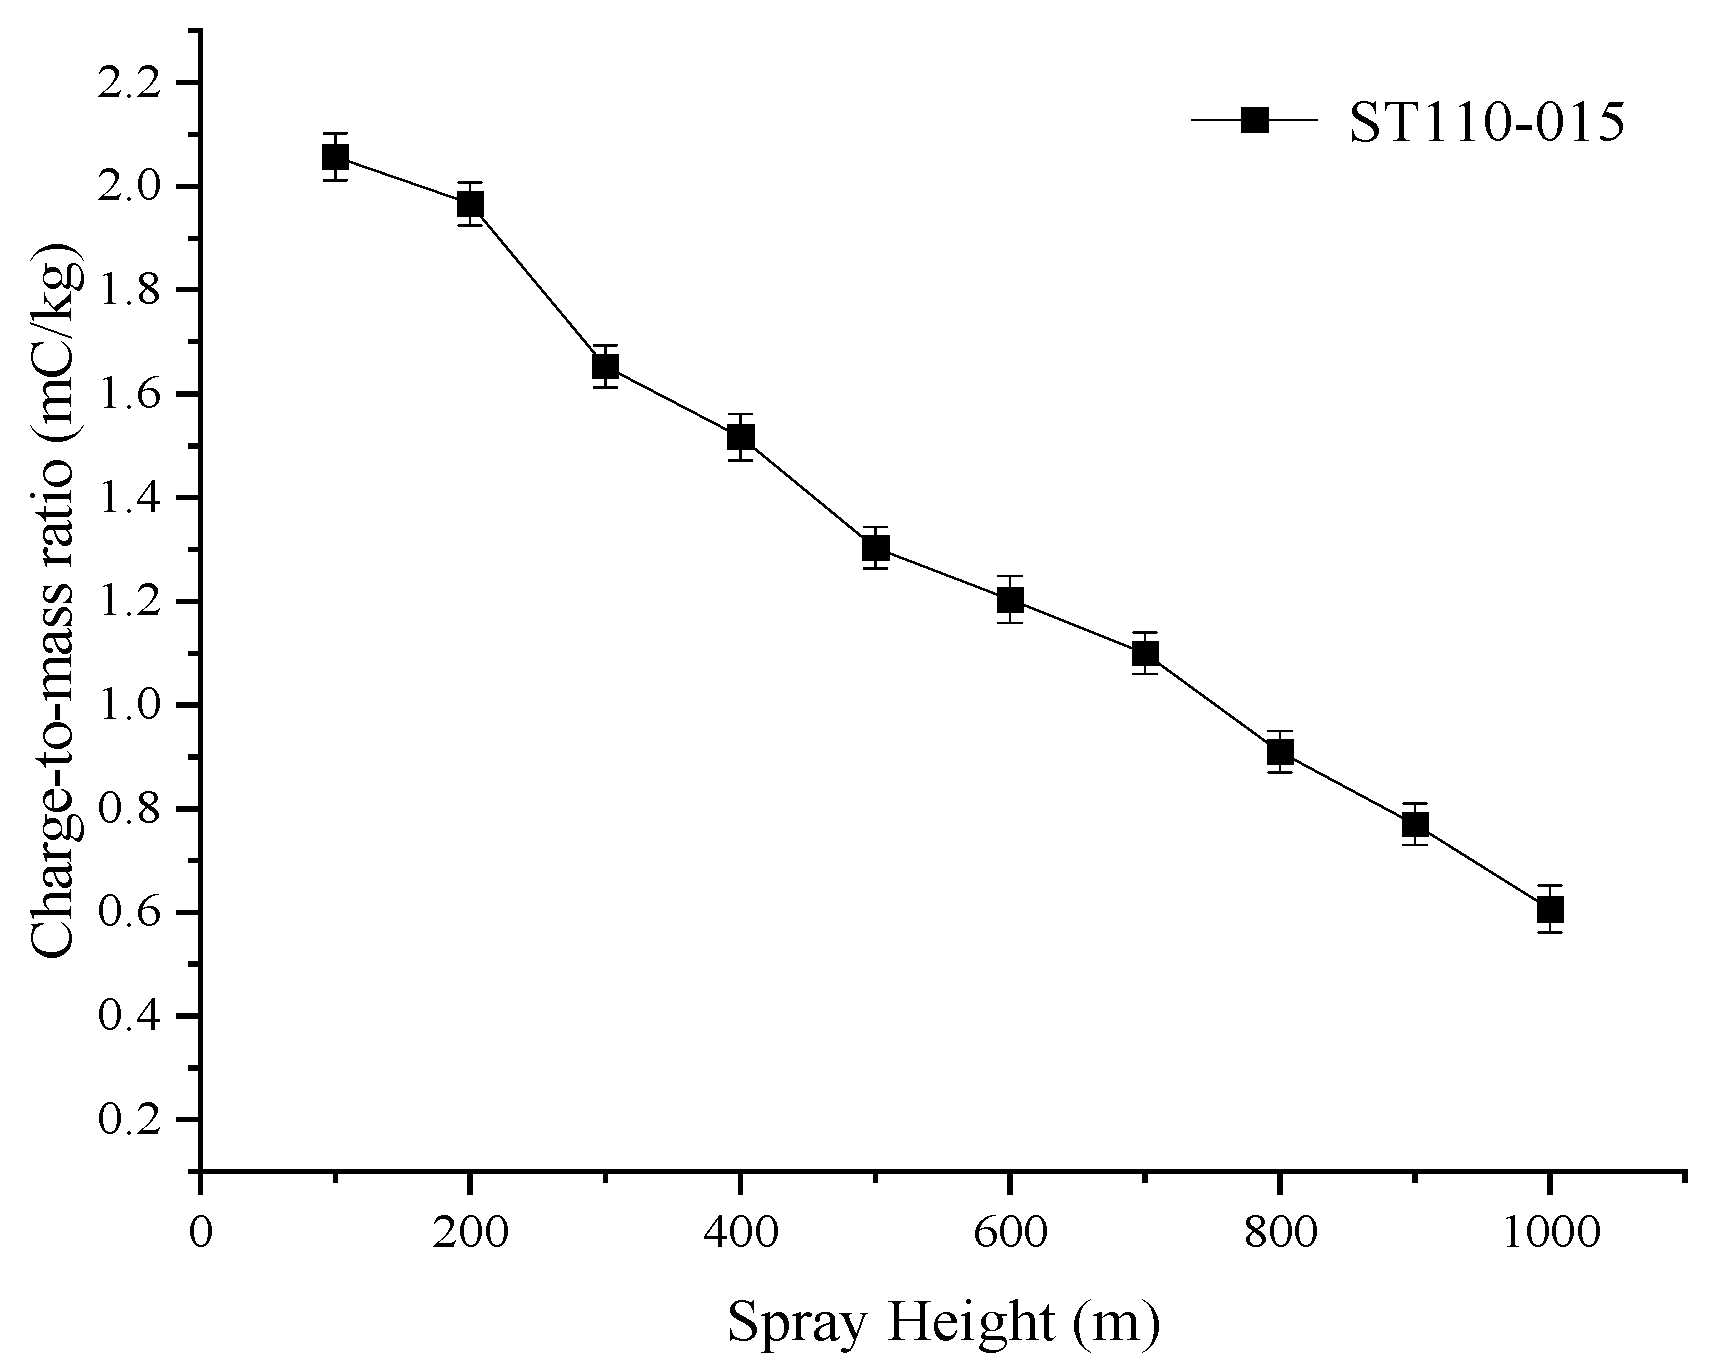
3.1.1. Mechanism of Single-Factor Influence on Droplet Charge-to-Mass Ratio

Based on the Maxwell–Wagner interfacial polarization theory and the Gamero–Castaño charge relaxation model, the regulation mechanism of charge voltage and spray height on the charge-to-mass ratio was systematically resolved by experiments.
Electrostatic voltage effect: As shown in Figure 11, when the voltage was increased from 5 kV to 12 kV, the charge-to-mass ratio showed a nonlinear growth trend, with a peak value of 1.62 mC/kg (RSD = 3.1%, p < 0.01), which was 83.6% higher than that of the base case (5 kV). This stage is consistent with the charge accumulation law of inductive charging, and, when the voltage exceeds 12 kV, the increasing voltage droplet charge-to-mass ratio no longer continues to grow but instead shows a decreasing trend. The significant decrease in the charge-to-mass ratio (21.0% to 1.28 mC/kg at 15 kV) is due to a dual mechanism: On the one hand, when the electrostatic voltage reaches about 12 kV, the surface charge density of the droplets approaches the Rayleigh limit value. On the other hand, after the charging capacity of the droplet itself reaches the limit, the charge decrease is accelerated if the electrostatic voltage continues to be increased, mainly due to the gas ionization breakdown, and micro-arc discharges between the electrodes are observed after the voltage exceeds a certain limit, which indicates that the field strength exceeds the air breakdown threshold, leading to the increase in the charge escape rate.
Spray height effect: The variation trend of spray height’s influence on the charge-to-mass ratio is shown in Figure 12. The charge-to-mass ratio measurement test is shown in Figure 13. From the analysis of the spray height on the charge-to-mass ratio change graph, in the spray height range of 10 to 100 cm, with the increase in droplet falling distance, the droplet charge-to-mass ratio value is a linear decline; the main cause of the attenuation includes the space charge effect and the loss of charge relaxation. The higher conductivity of the liquid leads to a competitive mechanism between the charge relaxation time and the droplet falling time. According to the relevant research, when the droplet charge-to-mass ratio is greater than 0.8 mc/kg, the charged droplets can be affected by the electric field force during the settling process, and the direction of motion is deflected; so, for the electrostatic spraying system, under the condition of voltage 10 kv, the spraying height of 800 mm or less is considered as the effective spraying height.

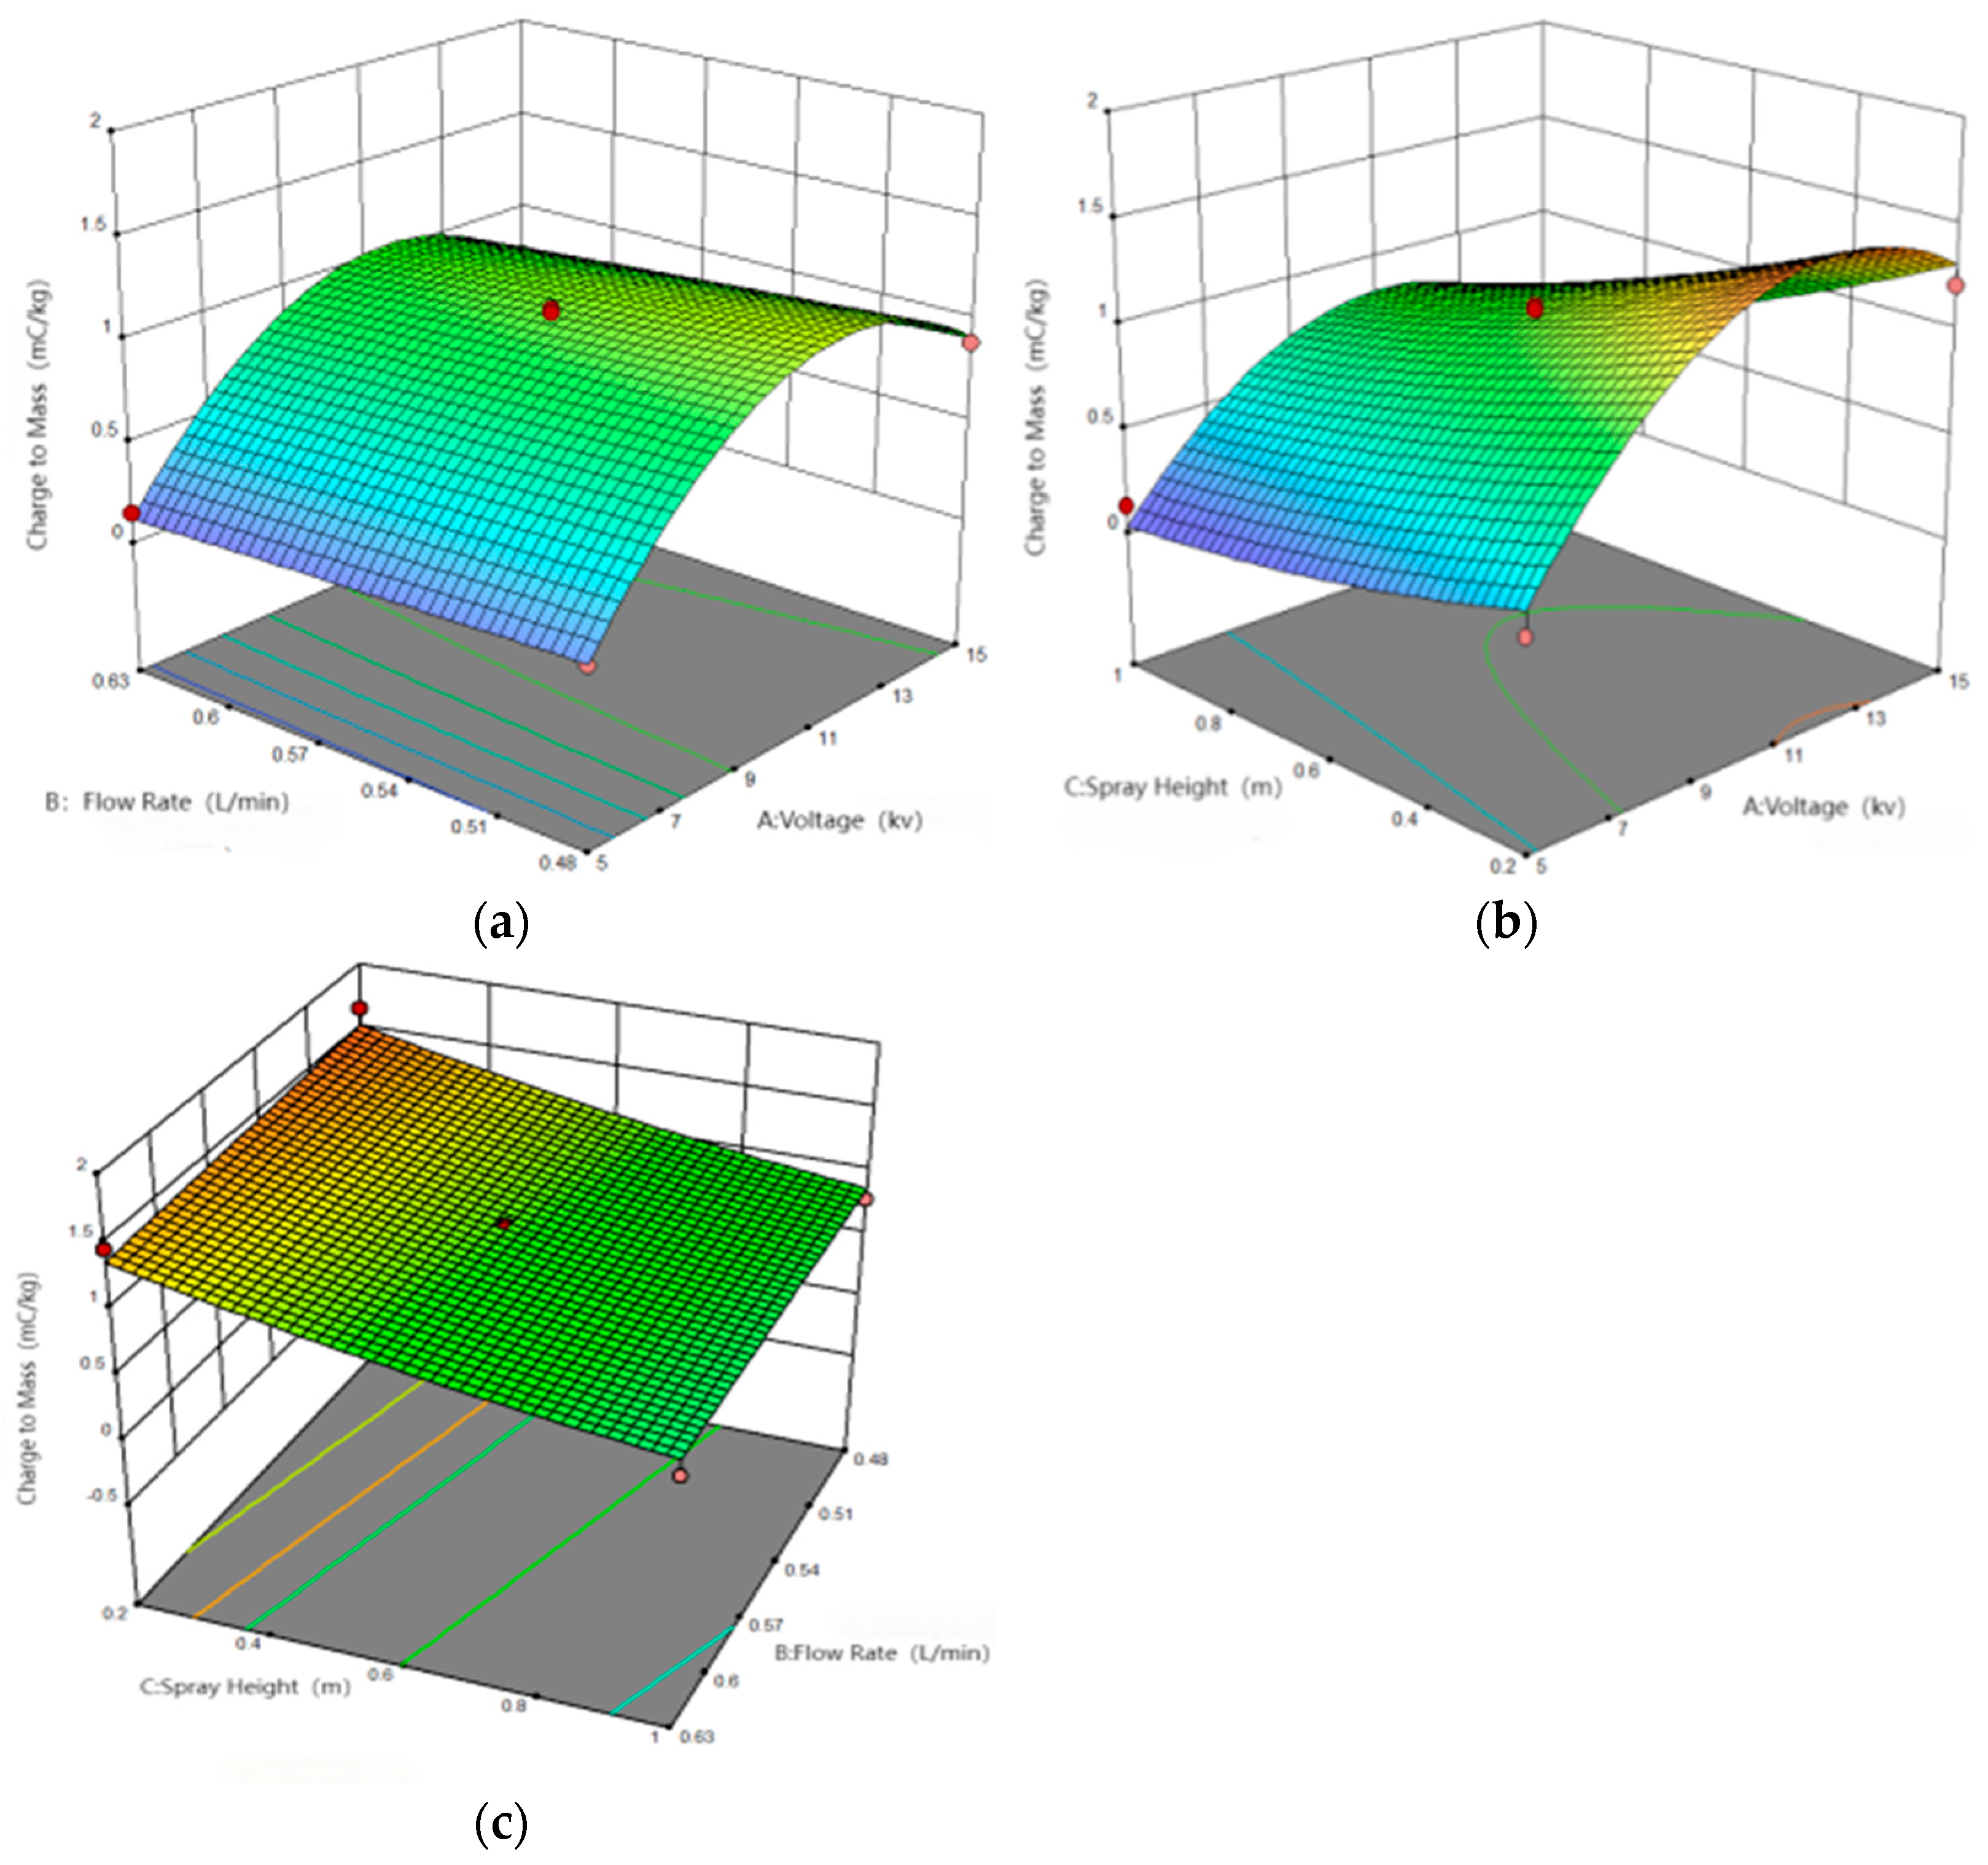
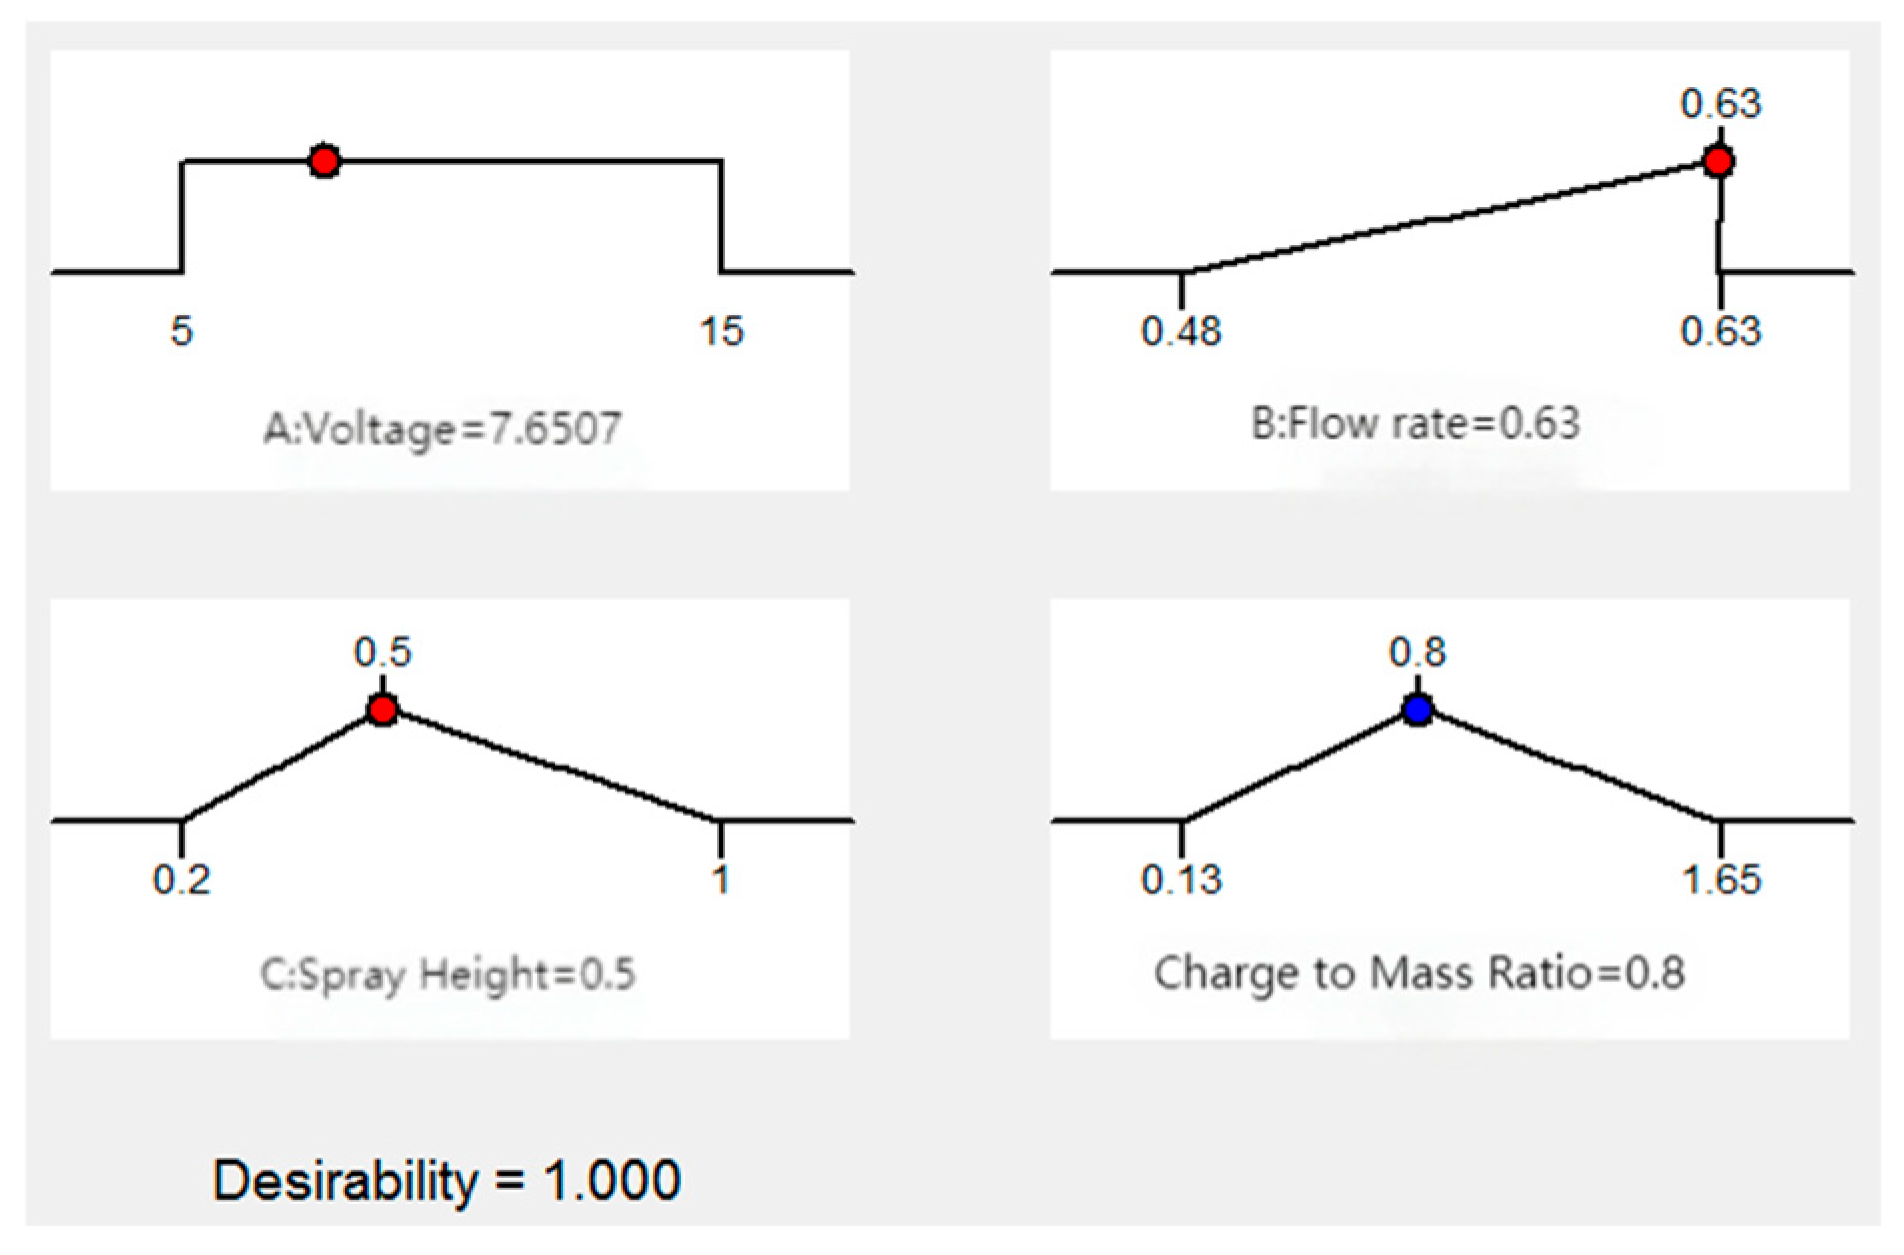
3.1.2. Multi-Parameter Coupling Effect of Load-to-Mass Ratio and Optimization Model

Model validation and statistical characterization: A second-order polynomial response surface model was developed based on Box–Behnken experimental data (see Table 2 for ANOVA results).
Y = 1.08 + 0.33 X 1 0.0688 X 2 0.3138 X 3 0.02 X 1 X 2 0.115 X 1 X 3 + 0.0075 X 2 X 3 0.5746 X 1 2 + 0.0021 X 2 2 + 0.0579 X 3 2
In the equation:
Y—Charge-to-Mass Ratio of Droplets (unit: mC/kg);
X1—Charging Voltage (unit: kV);
X2—Spray Flow Rate (unit: L/min);
X3—Spray Height (unit: m).
In the analysis of the statistical significance of the model, the test of significance of the model p < 0.05 proves that the fitted model is statistically significant. The independent variables primary terms X1, X3, and secondary term X2 were significant (p < 0.05). The calibration coefficient of determination, R2 (0.9086 > 0.80), and the prediction, R2 = 0.857, with a prediction error of <9.6%, showed that the model fit was good and could be used for the prediction of the value of the charge-to-mass ratio of the electrostatic spray droplets. The sensitivity analysis of each influence factor in the regression equation showed that the main effect of the factors was electrostatic voltage > spray height > spray flow rate, in which the electrostatic voltage was positively correlated with the charge-to-mass ratio, the spray flow rate and spray height were negatively correlated with the droplet charge-to-mass ratio, and the voltage-height interaction term showed a significant positive synergistic effect, which indicated that in the low-height interval, the voltage increase had a reduction effect.
Dynamic characteristics of the response surface: The dynamic characteristics of the response surface are shown in Figure 14. The three-dimensional surface and contour analysis is used to find the spatial action law of the key parameters and to analyze the effects of electrostatic voltage (X1), spray flow rate (X2), and spray height (X3) on the droplet charge-to-mass ratio.
Charging voltage and spray flow plane (X1–X2): Based on the second-order polynomial response surface fitting equation with partial derivatives for X1:
Y X 1 = 0.33 1.1492 X 1 0.02 X 2
It is found that the charge-to-mass ratio (Y) grows superlinearly with increasing voltage when the flow rate X2 ≤ 0.55 L/min, reaching a maximum value near X1 ≈ 12 kV (upper parabolic boundary).
Based on the second-order polynomial response surface fitting equation with partial derivatives for X2:
Y X 2 = 0.0688 + 0.0042 X 2 0.02 X 1
The marginal effect of the decrease in the load-to-mass ratio due to increased flow was calculated to be 0.142 mc·kg−1.
Voltage and height plane (X1–X3): Based on the second-order polynomial response surface fitting equation, fixing the spray flow rate at zero level, establishing the field strength attenuation compensation equation, requiring the charge-to-mass ratio Y ≥ 0.8 mc/kg, and solving for the X1 and X3 relationships:
X 1 10.2 + 2.83 X 3
It was shown that a voltage of 2.83 kV needed to be compensated for each 1 m increase in operating height to maintain a higher charge rate of the droplets, and the voltage effect gain coefficient reached 0.52 mc-kg−1-kV−1 in the height interval of 0.2–0.6 m. The positive effect of electrostatic voltage on the charge-to-weight ratio was significant.
Flow rate and height plane (X2–X3): The two-parameter interaction effect was not significant (p = 0.9203), but the combination of high flow rate (≥0.6 L/min) and high height (≥0.8 m) triggered a synergistic decay effect: the charge-to-mass ratio decreased to less than 0.5 mc/kg due to an accelerated rate of decrease in the superposition of the quadratic terms.
Employing Design-Expert software (V10) for experimental design, based on the results of central combination test, three significant influences of electrostatic voltage (X1), spray flow rate (X2), and spray height (X3) were selected for the three-factor, three-level response surface analysis. The critical height range for electrostatic spraying is shown in Figure 15. The critical voltage range for electrostatic spraying is shown in Figure 16. Through the second-order polynomial regression model fitting, the global maximum charge-to-mass ratio conditions were obtained, electrostatic voltage of 12 kV, spray flow rate of 0.48 L/min, and spray height of 0.2 m, when the droplet charge-to-mass ratio is about 1.62 mC/kg. At this time, although the electrostatic droplet charge-to-mass ratio reaches the maximum, the spray height is too low, and the practical application is limited. Therefore, it is necessary to balance the charging efficiency and operational feasibility to reset the research objectives. With Y = 0.8 mC/kg as the electrostatic spray charging effectiveness threshold, the parameter boundaries were inverted by a multiple quadratic regression model.
In the case where the spray voltage and spray flow is to achieve the best charging state, the spray height critical point is 1.79 m; that is, a spray height of not less than 1.79 m is within the scope of the droplet charge to basically meet the electrostatic spray droplet charge requirements. In the case where spray flow is not considered, at the spray height of 0.5 m on the plane and the charge-to-mass ratio of 0.8 mc/kg, the voltage critical point is 7.65 kV; that is, when the electrostatic voltage is greater than 7.65 kV at the spray height of 0~0.5 m, the range of the droplet charge-to-mass ratio is greater than 0.8 mc/kg, validating the pre-analysis of the voltage gain effect.

3.2. Atomization Performance Analysis of Electrostatic Spraying

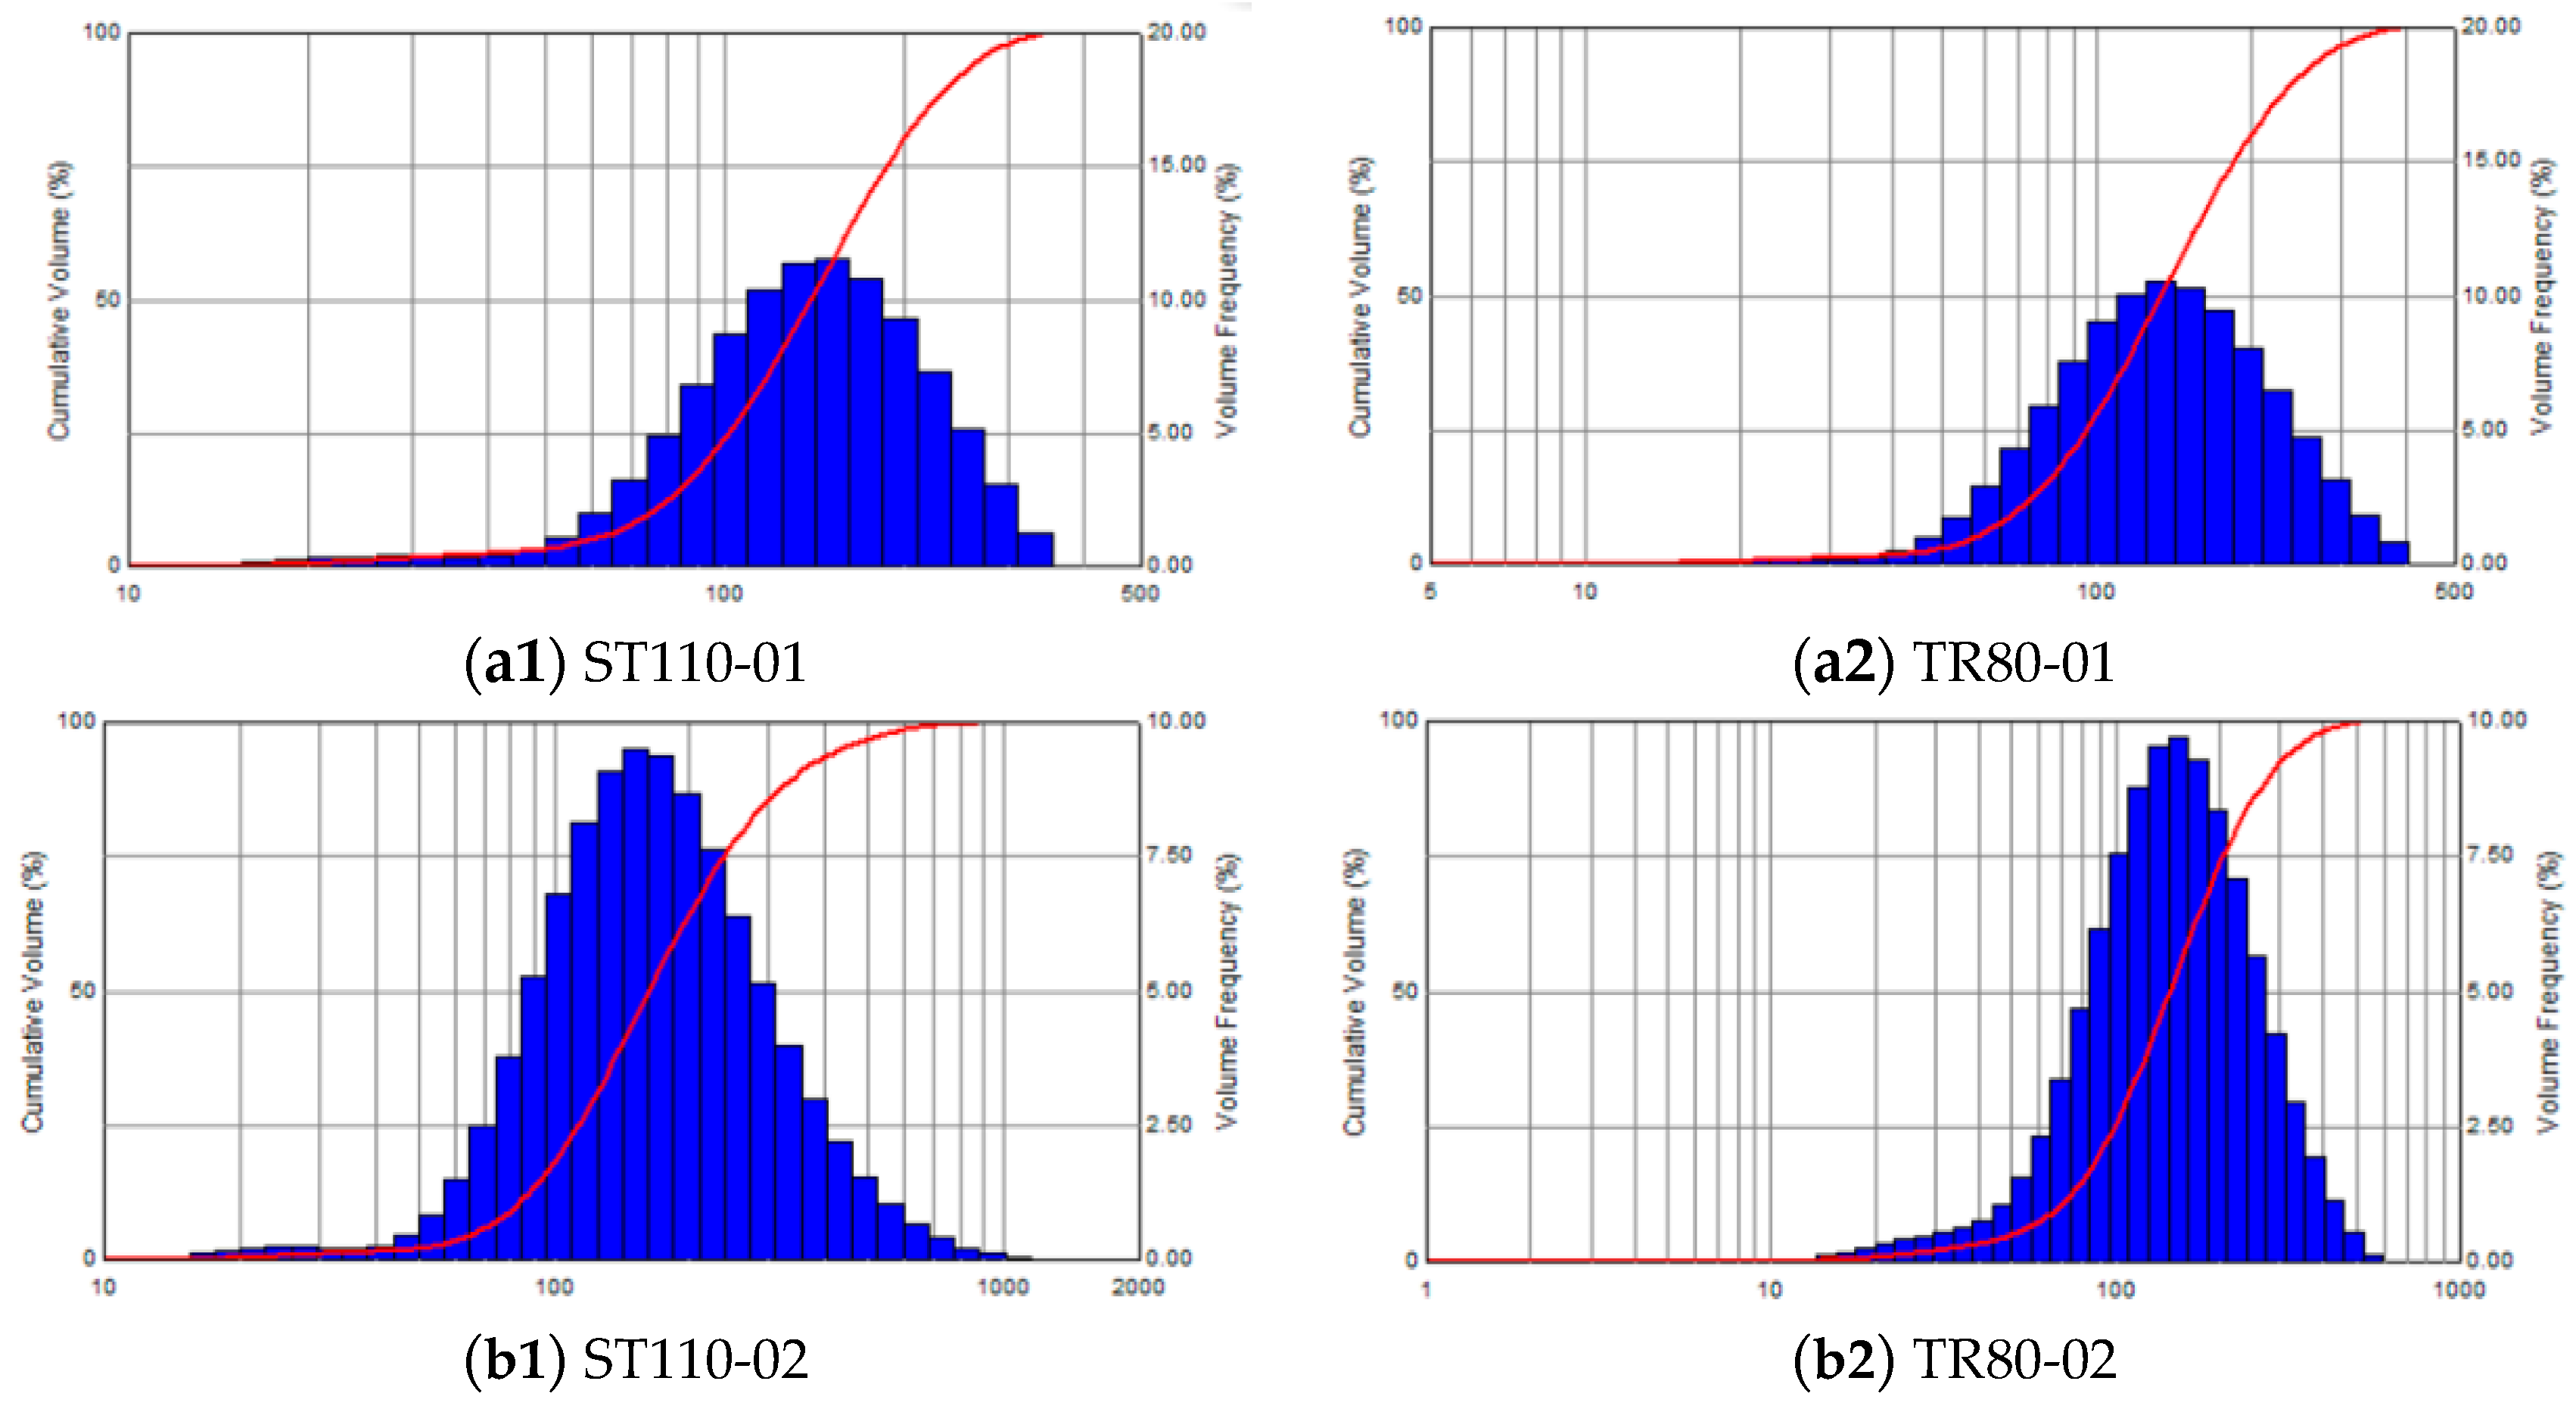
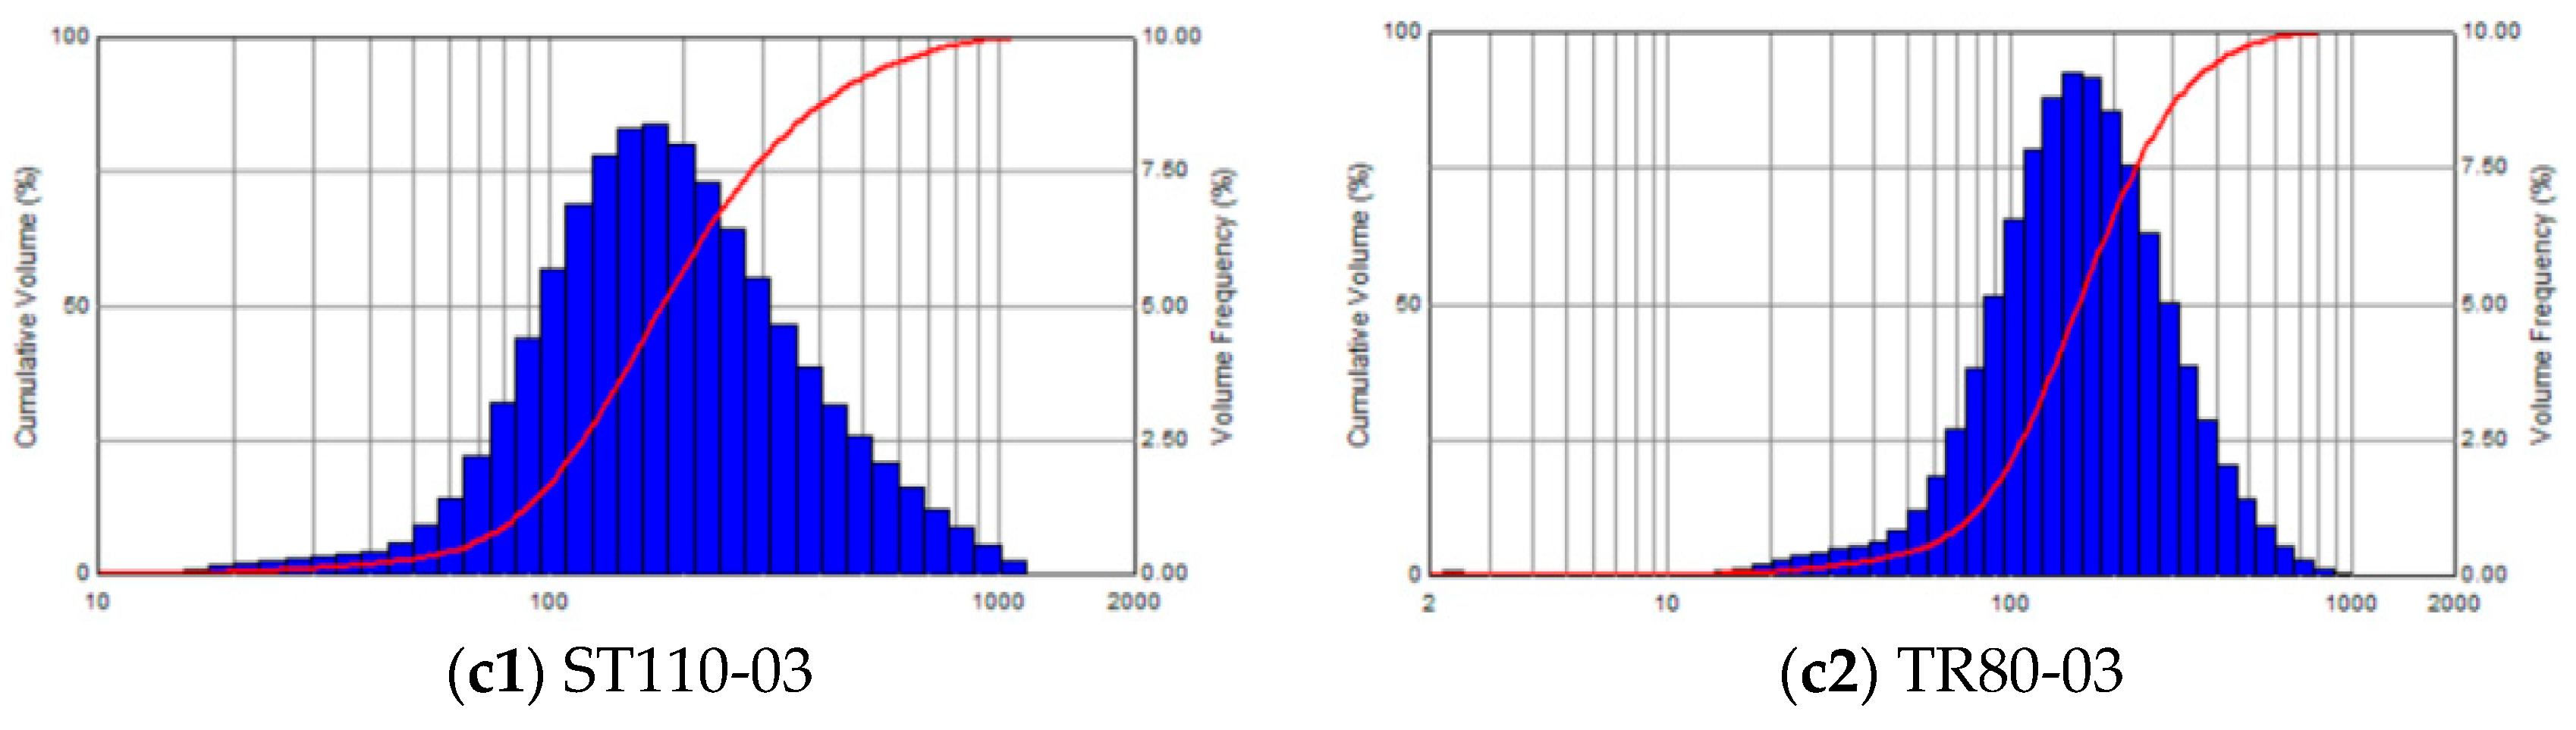
3.2.1. Droplet Size Distribution Under Different Spray Pressures

As shown in Table 3, with the increase in spray pressure from 0.25 MPa to 0.35 MPa, the droplet volume median diameter (Dv50) of each type of nozzle shows a significant decreasing trend. The Dv50 of the two types of nozzles showed an approximately linear negative correlation with the pressure, in which the ST110-03 of the ST110 nozzle showed the largest decrease of 8.8%, and the Dv50 of the TR80-01 of the TR80 nozzle decreased from 135.7 μm to 119.7 μm, with a decrease of 11.8%, which indicated that the hollow cone nozzle was more sensitive to the pressure change. A selected part of the particle size distribution test charts, Figure 17, shows the droplet volume median diameter distribution of each type of nozzle under 0.25 Mpa.

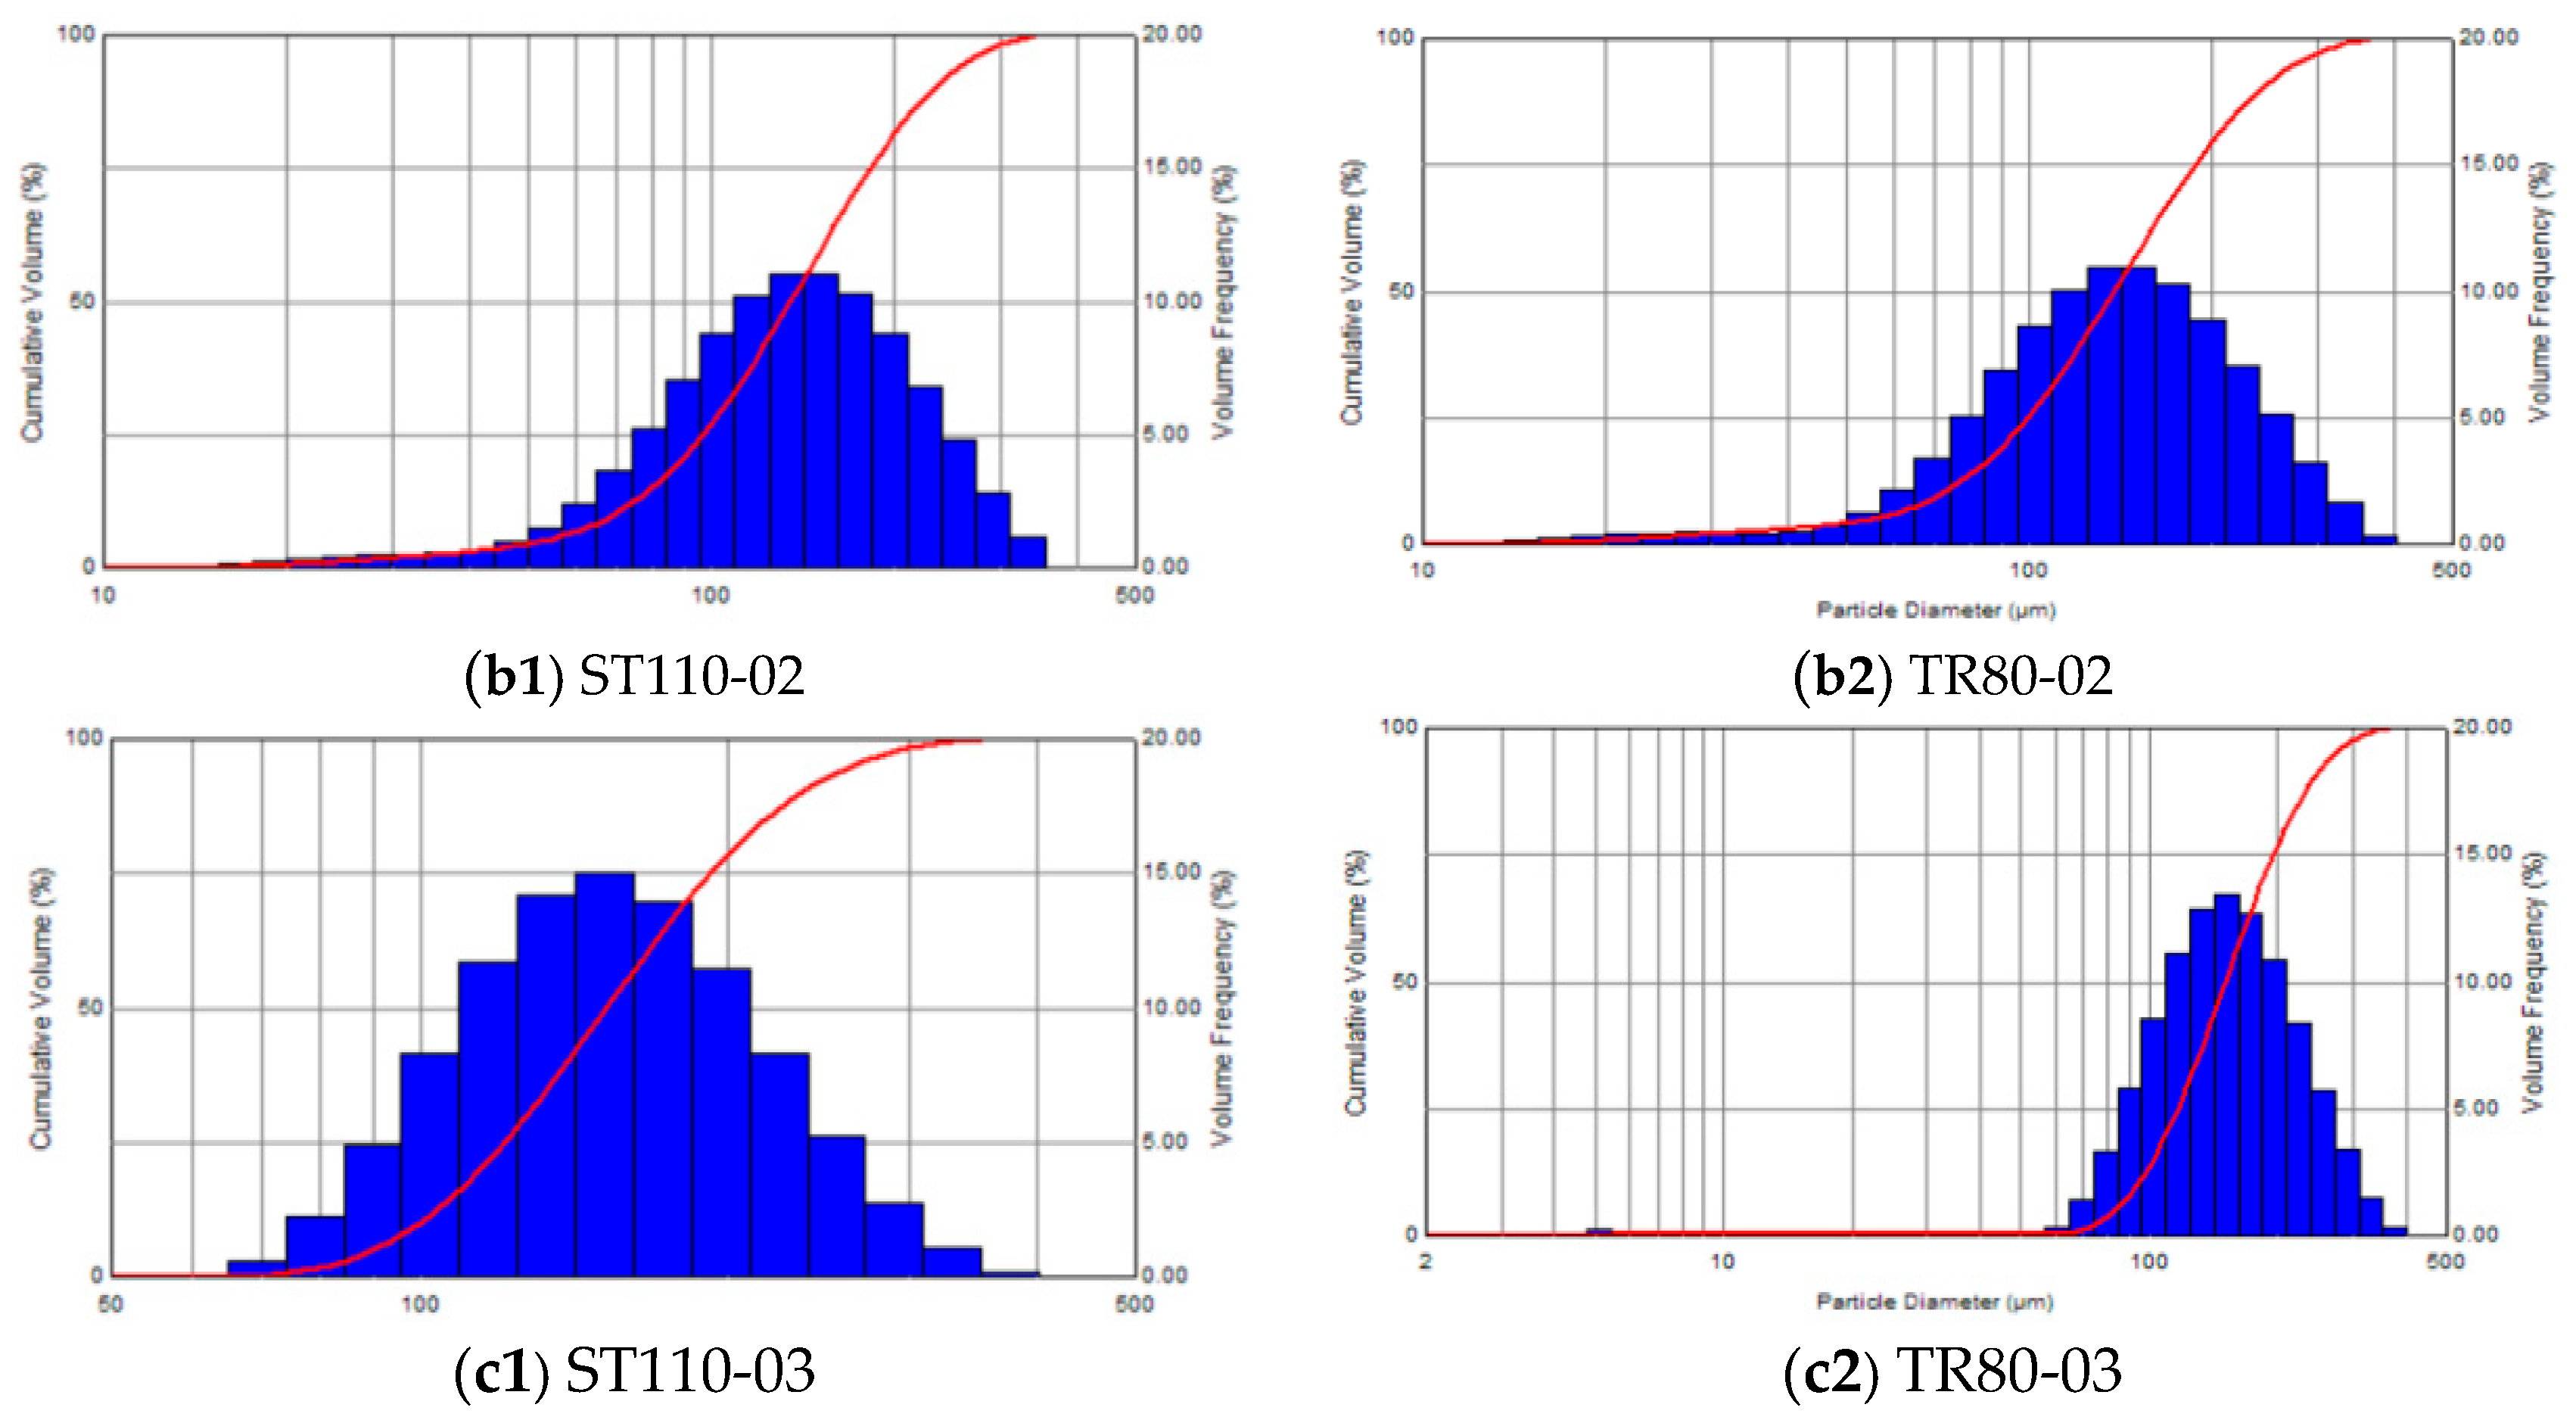
3.2.2. Droplet Size Distribution Under Different Charging Voltages

As shown in Table 4, when the electrostatic voltage increases from 6 kV to 15 kV, the droplet Dv50 decreases significantly, and the effect of electrostatic voltage on the droplet volume of the median diameter of the droplet is significant and negatively correlated, in which the Dv50 of ST110-03 decreases from 170.6 μm to 138.4 μm, with a decrease of 18.9%, which is the highest of two types of nozzles. The volume of the droplet median diameter of TR80 electrostatic nozzle decreases by about 20 μm on average, and the degree of decrease is 13.3–15.4%. The distribution of volume median diameter (VMD) for droplets from various nozzle models of the ST110 type at 6 kV is shown in Figure 18. The TR80 spray nozzle charge spray droplet size overall reduction is slightly lower than the ST110 type; when the voltage exceeds 12 kV, Dv50 change tends to flatten, which may be related to the droplet charge saturation or secondary atomization limit, proving that the electrostatic field enhances the droplet charge capacity and Coulomb force to promote droplet splitting and refinement, but there is a charge saturation refinement effect. However, there is a tendency to weaken the refinement effect after charge saturation.

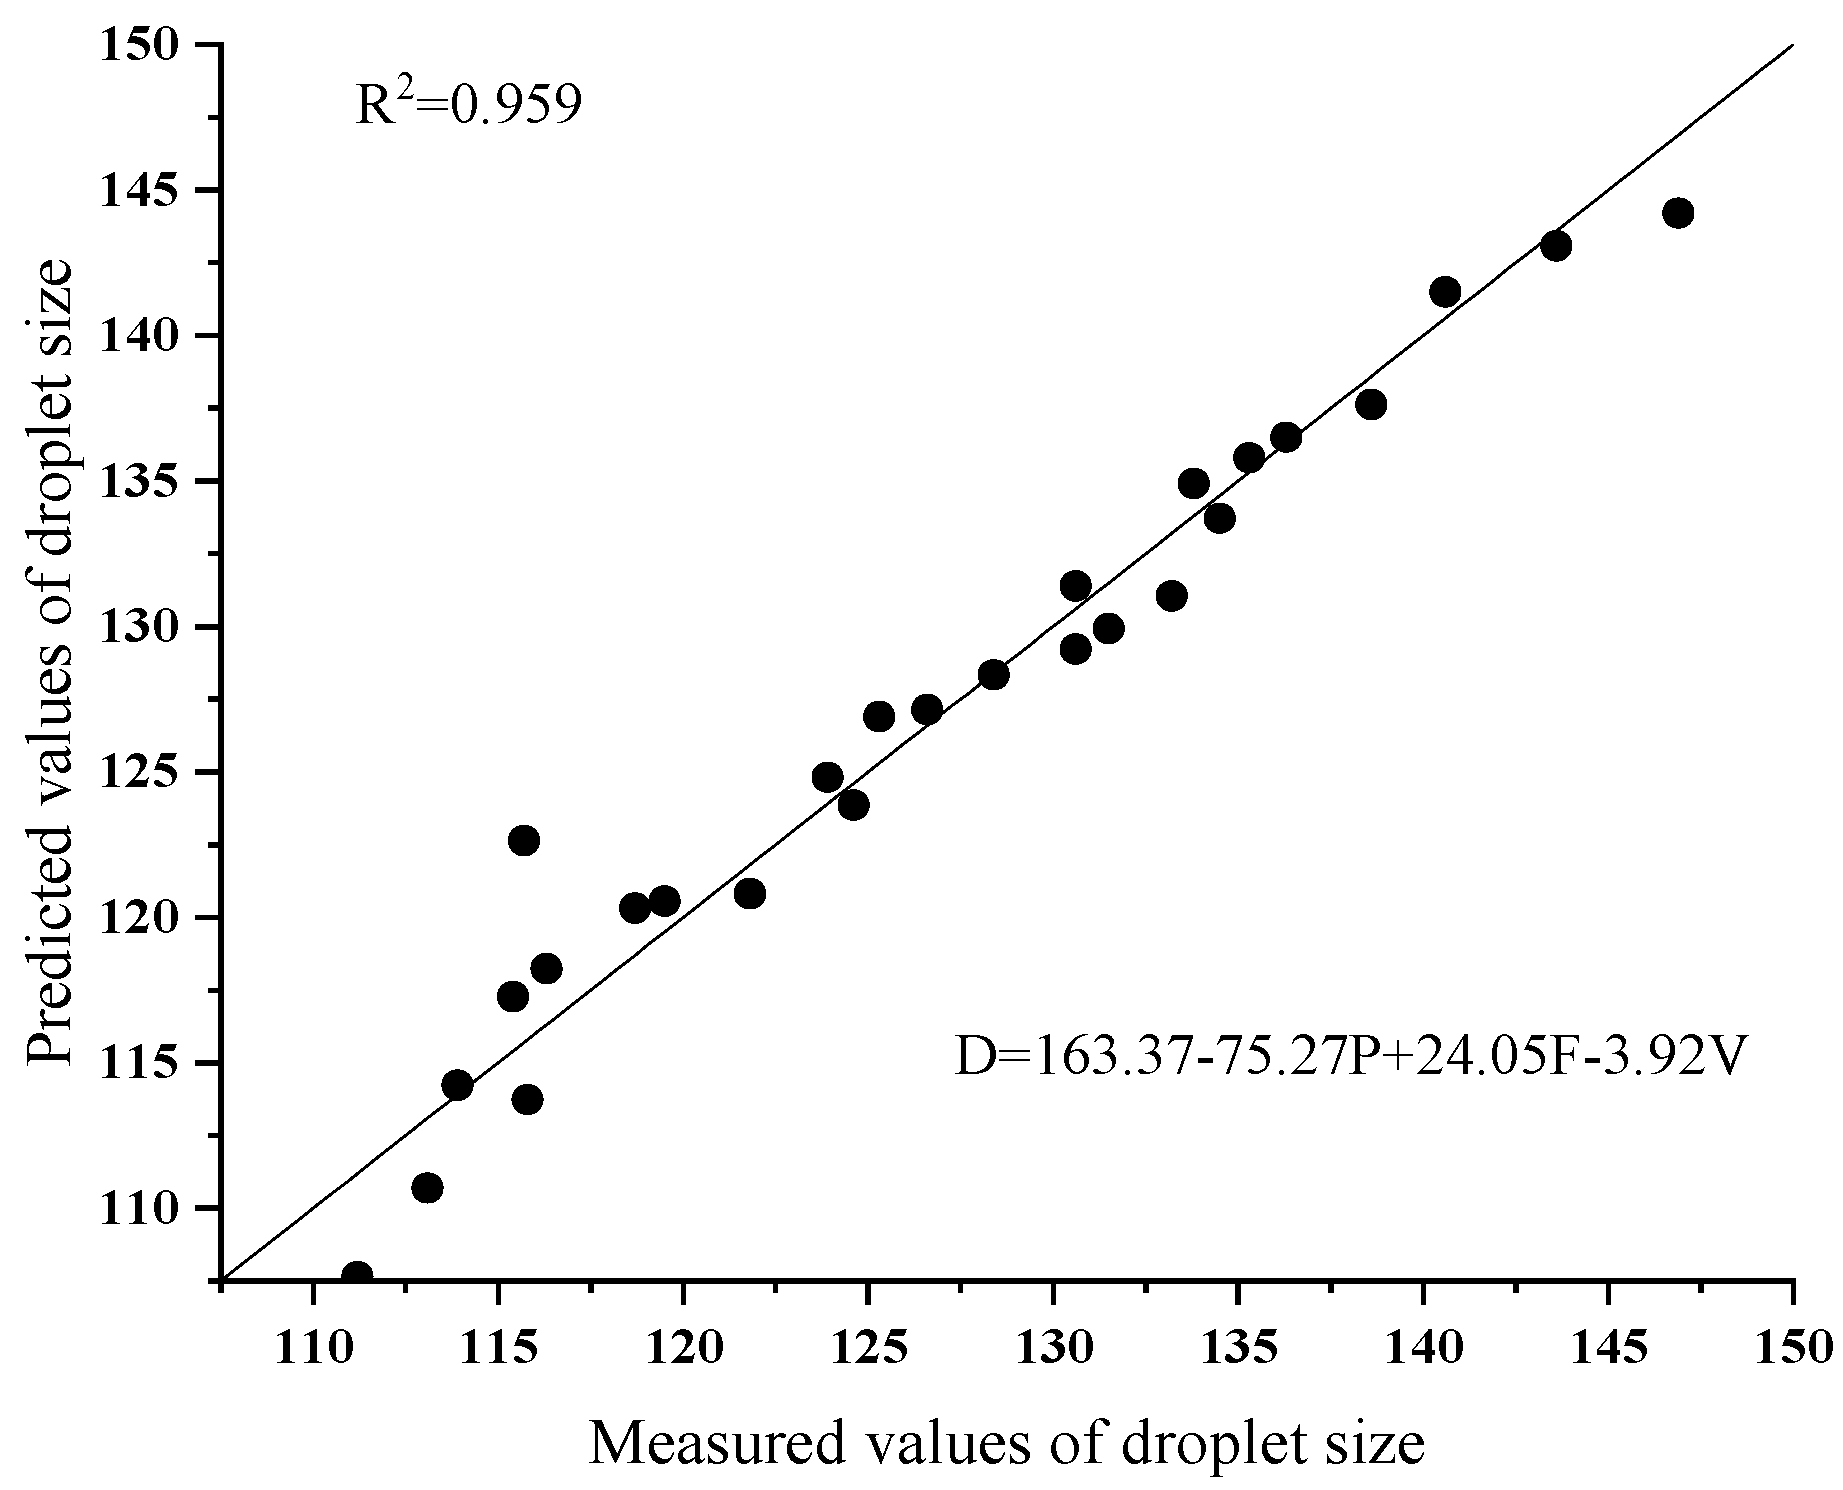
3.3. Regression Modeling of Droplet Size

With the spray flow rate F, spray pressure P, and electrostatic voltage V as independent variables, and the droplet sizes of the two spray nozzles as dependent variables, the experimental program and results are shown in Table 5. According to the multivariate linear fitting of the data in Table 5, the regression model of droplet sizes of the two spray nozzles and the prediction results are shown in Figure 19 and Figure 20. The coefficients of the fitted equations are shown in Table 6 and Table 7.
The regression model for the droplet size of the ST110 nozzle spray is expressed by Equation (2), while that of the TR80 nozzle spray is represented by Equation (3).
D S = 172.386 108.277 P + 37.136 F 3.317 V
D T = 163.374 75.265 P + 24.05 F 3.292 V
In the equations, P is pressure (MPa), F represents flow rate (L·min−1), and V corresponds to slit width (mm).
As shown in Table 6 and Table 7, spray pressure, flow rate, and electrostatic voltage exhibit significant effects on the droplet size regression models. Spray pressure is the primary factor determining droplet size in electrostatic nozzles, with a gradual decrease in droplet size as pressure increases. Flow rate acts as a secondary influencing factor, where higher flow rates similarly lead to reduced droplet sizes. Although electrostatic voltage has a comparatively weaker influence on droplet size than pressure and flow rate, under identical operating conditions, increasing electrostatic voltage demonstrates a clear trend of droplet size reduction. These experimental results align with findings from single-factor experiments, confirming the auxiliary refinement effect of electrostatic fields on droplet atomization. For the ST110 nozzle, the droplet size regression equation achieves an adjusted coefficient of determination R2adj of 0.878, while the TR80 nozzle model yields an R2adj of 0.959, indicating high reliability for both regression models.

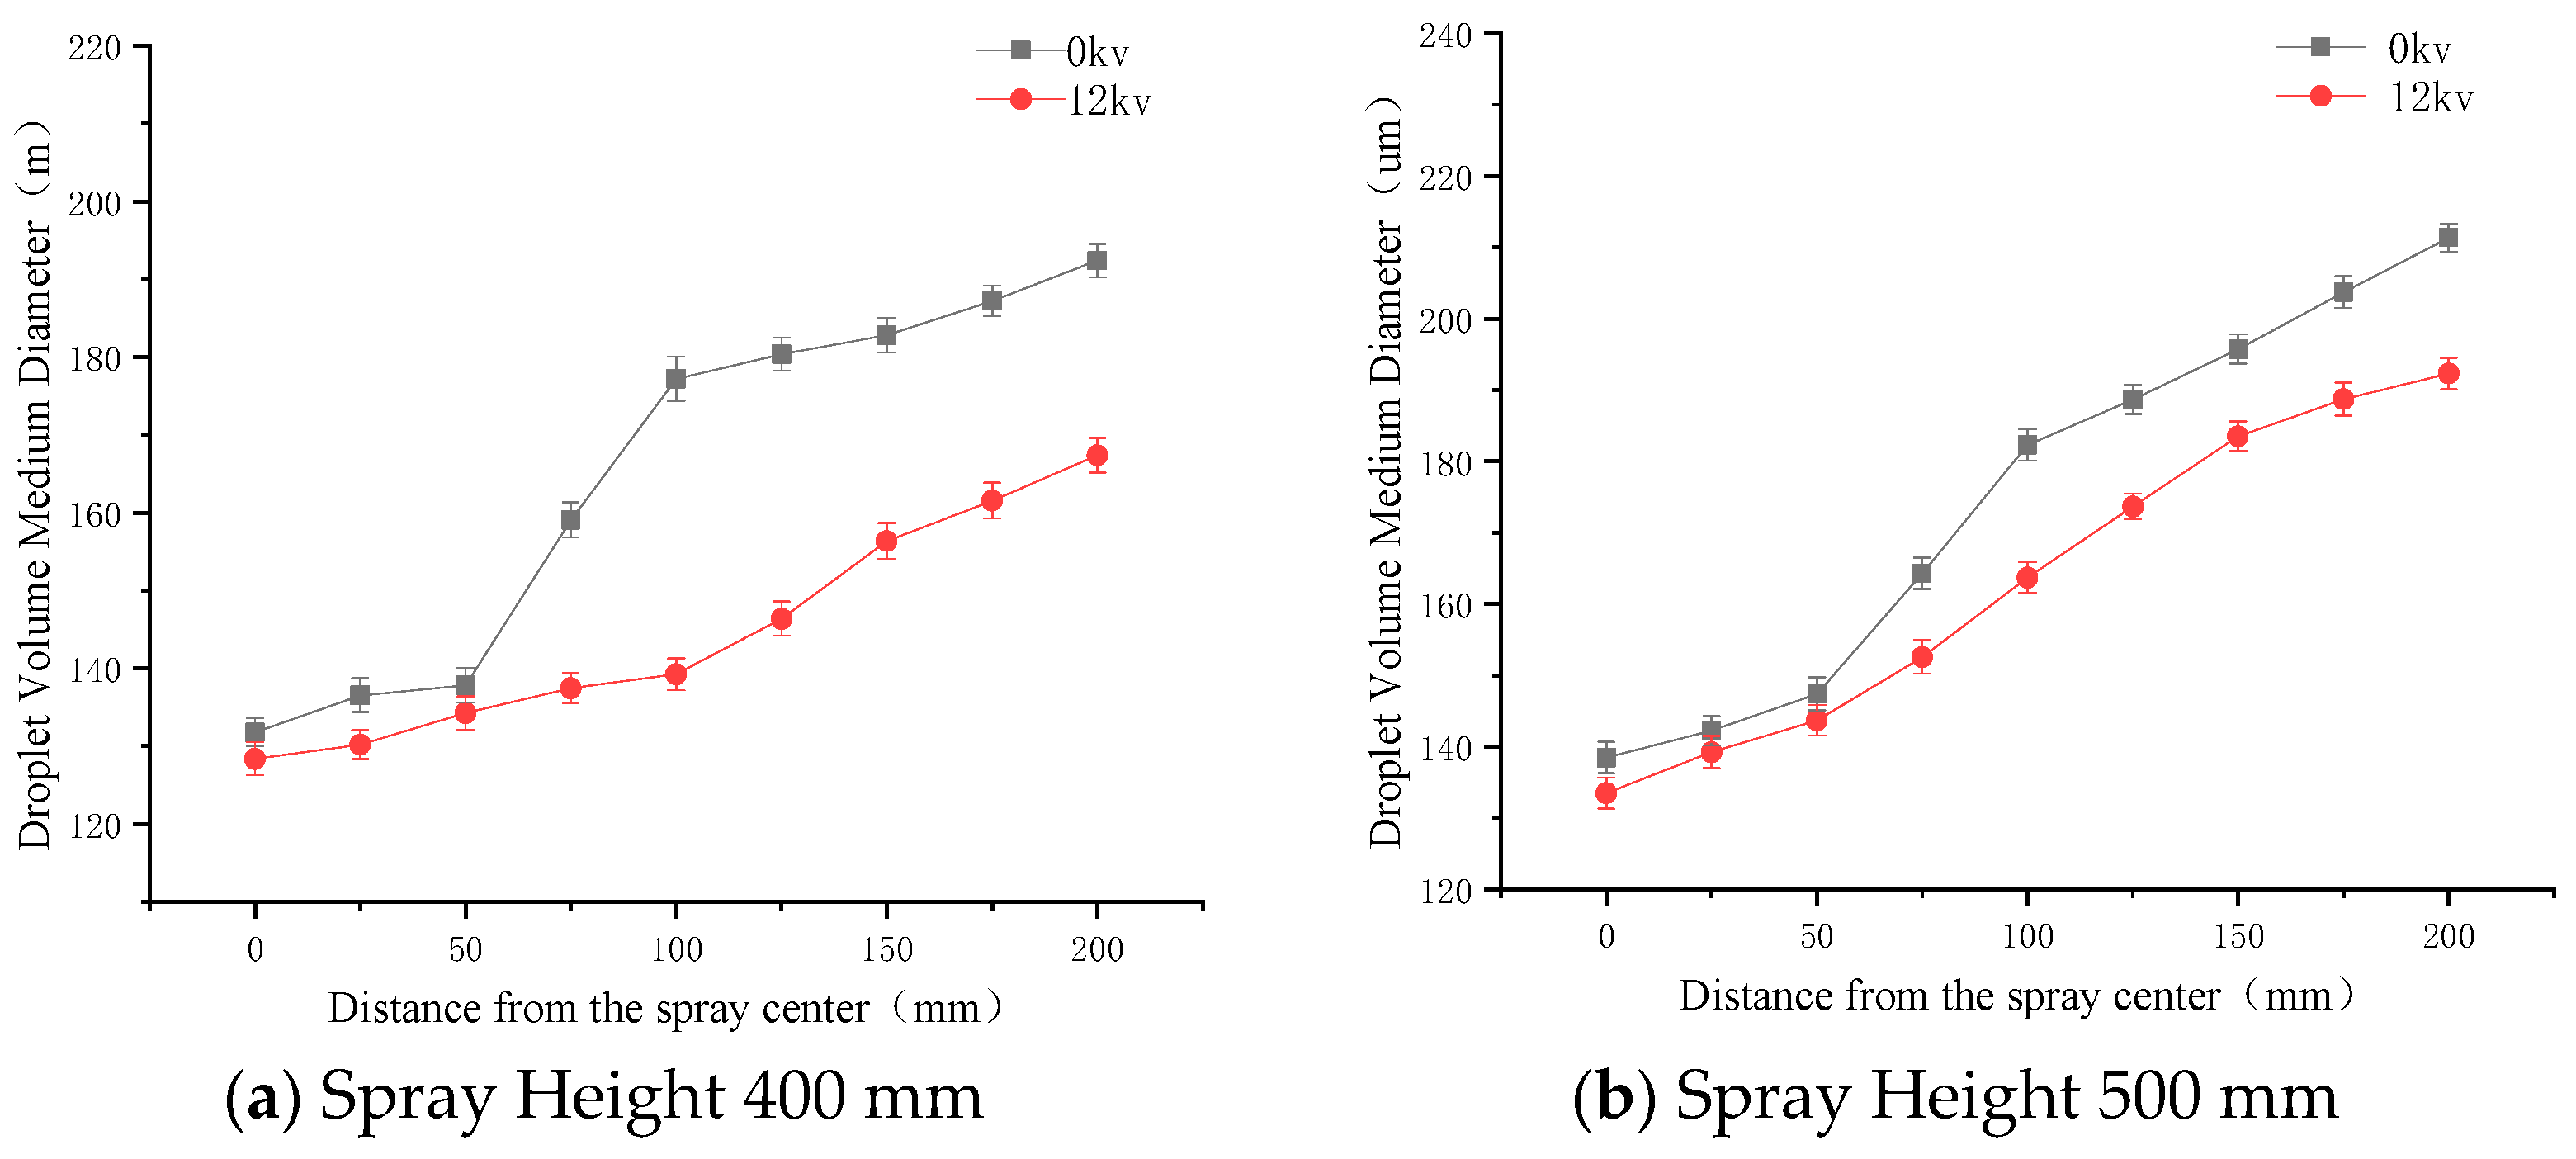
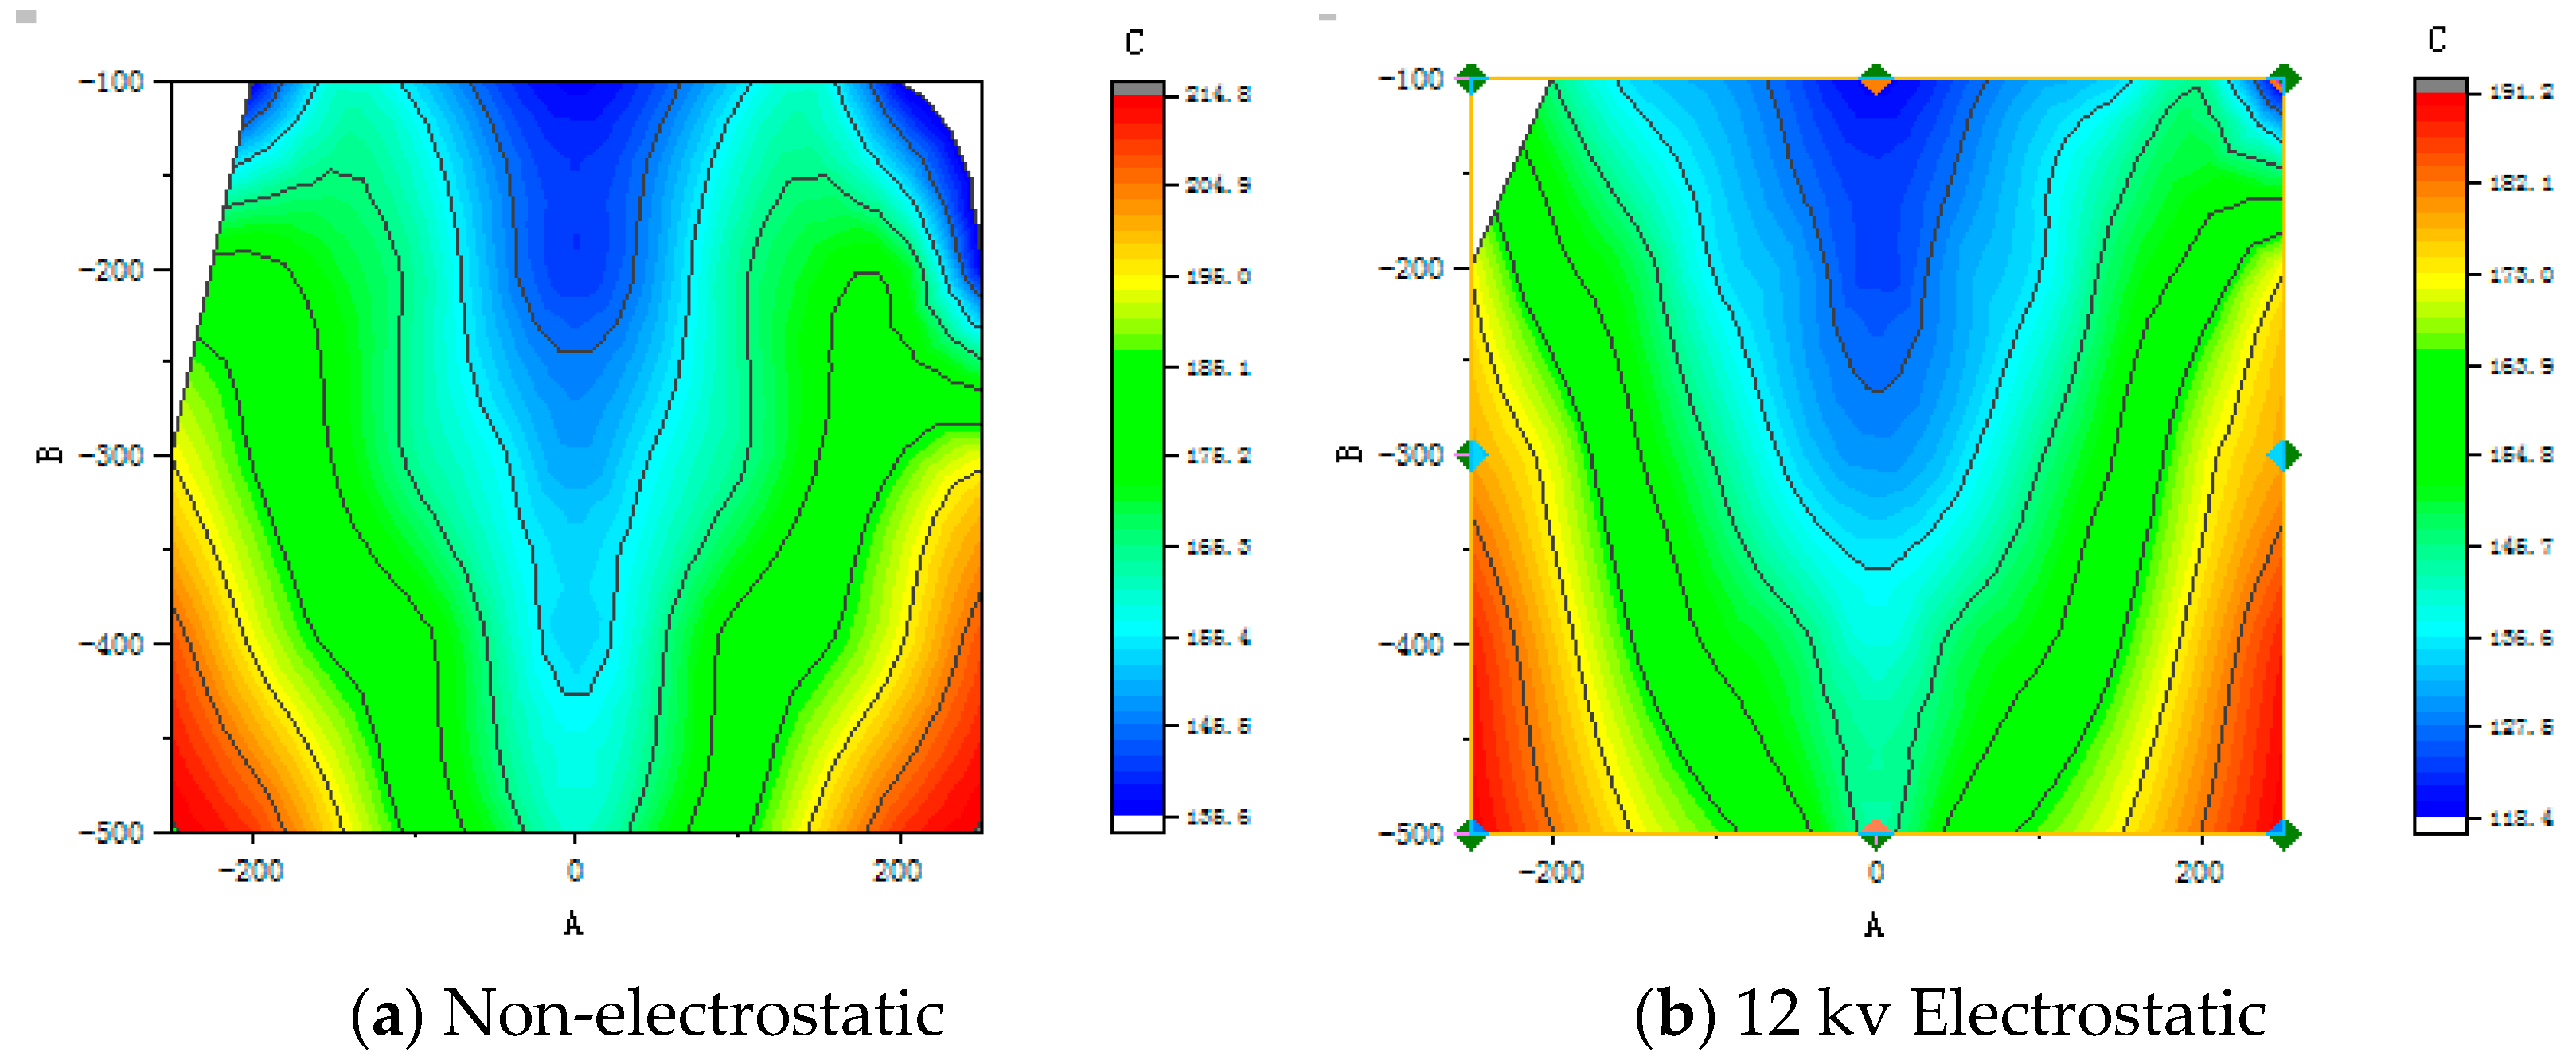
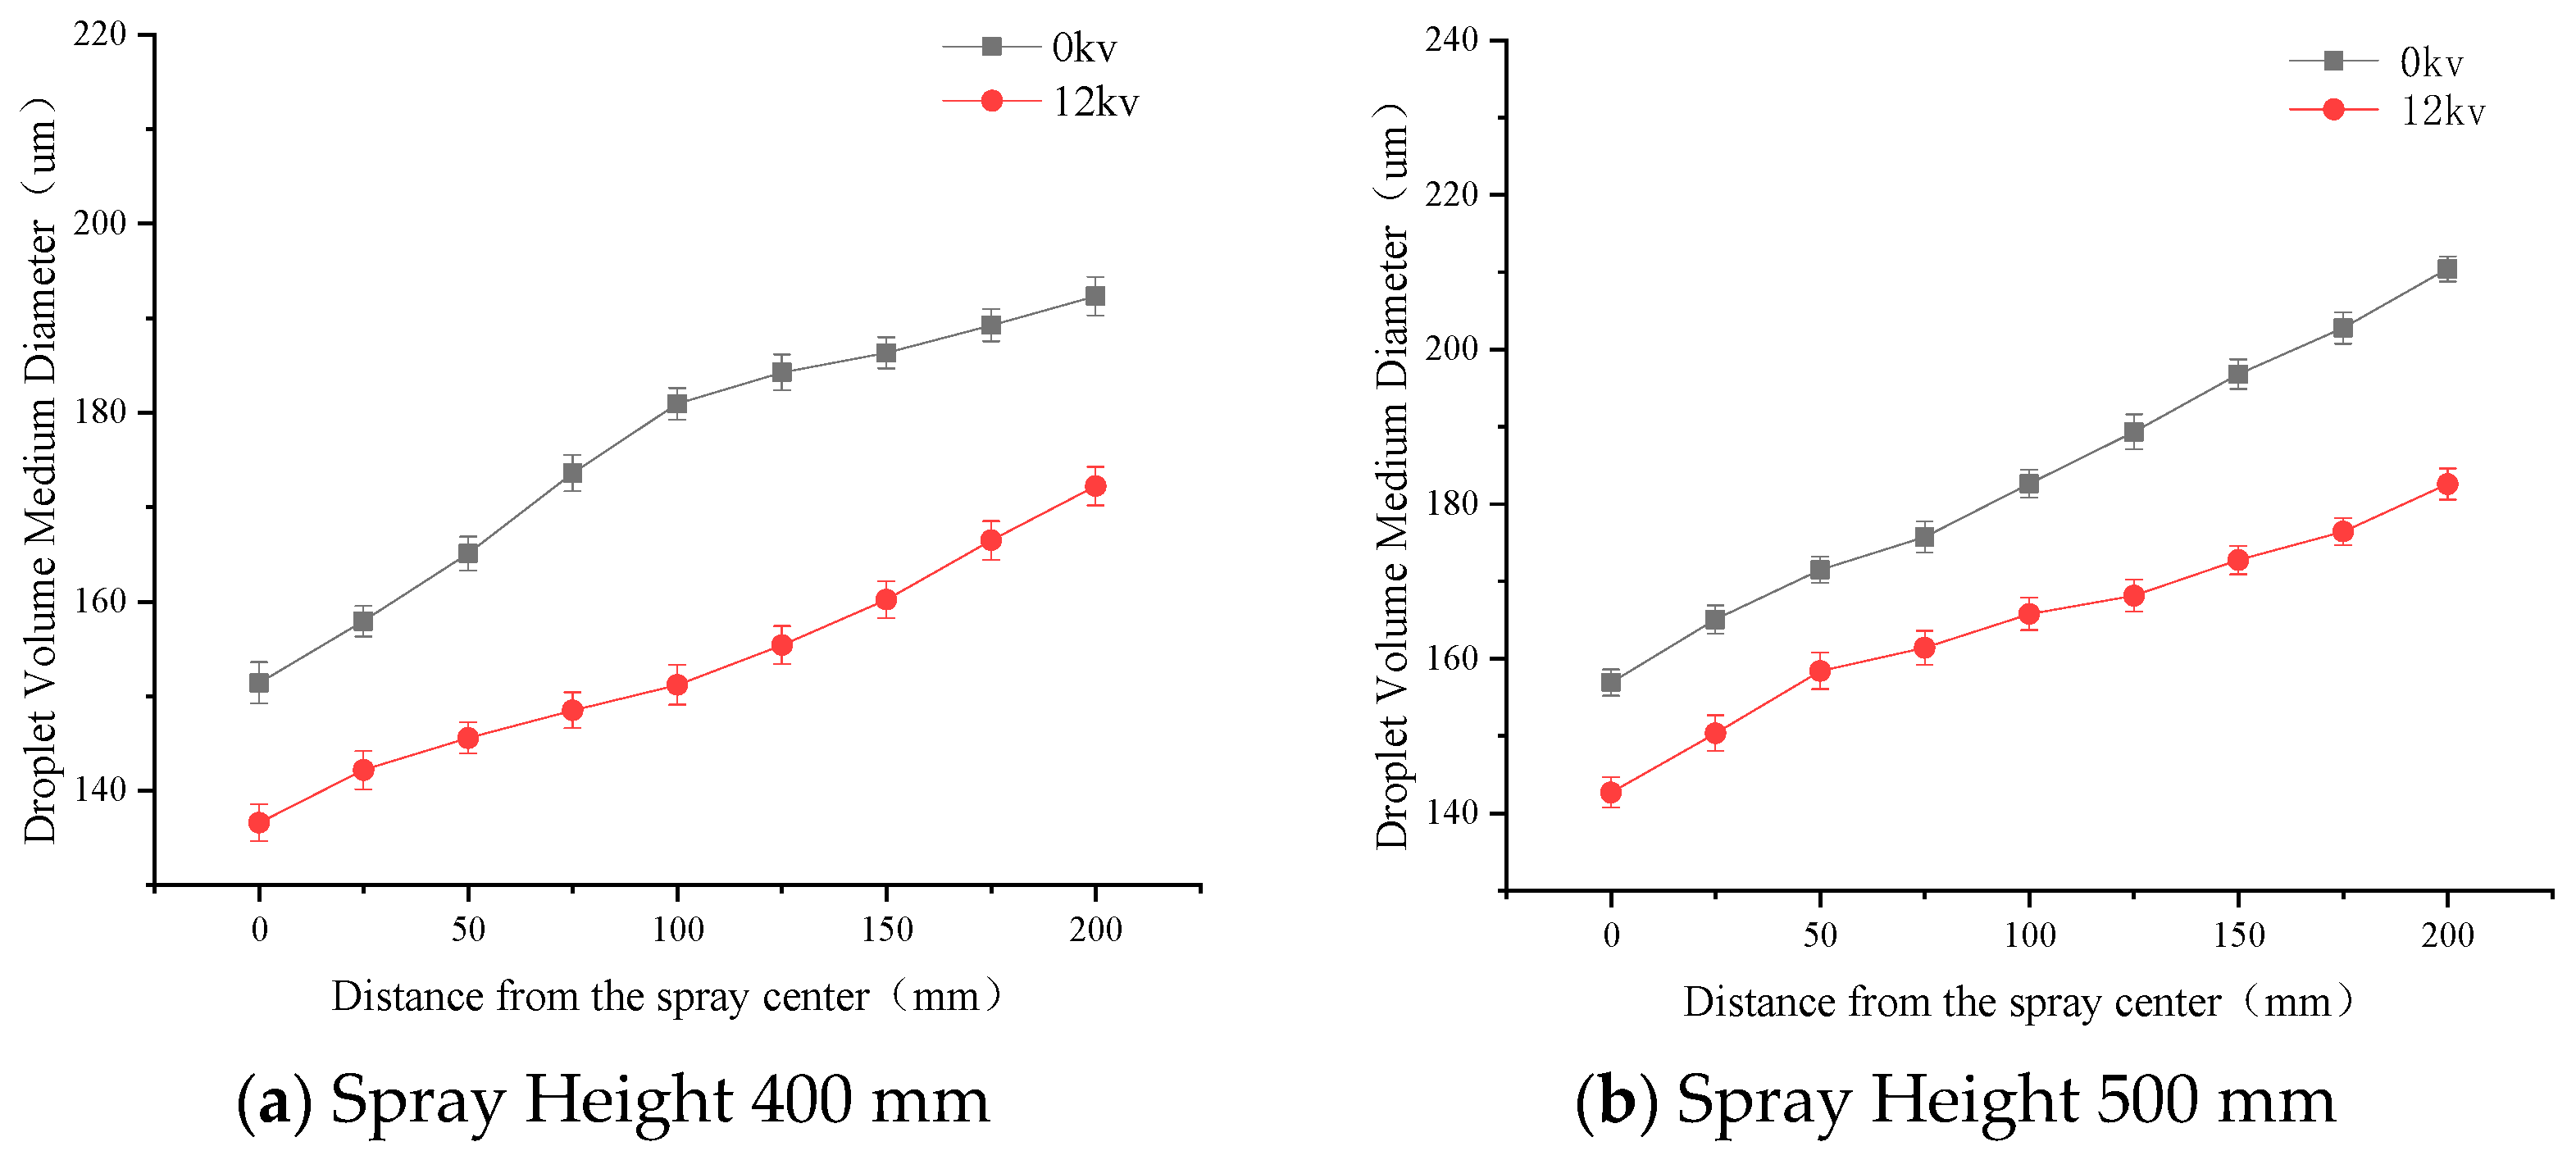
3.4. Spatial Particle Size Spectra of Electrostatic Sprays

The particle size distribution in the spray spatial field of the TR80-02 nozzle is presented in Figure 21. The TR80-015 and ST110-02 nozzles were selected from the two types of nozzles to measure the particle size spectrum of the spray flow field and to compare the particle size distribution of the two types of nozzles under electrostatic and non-electrostatic conditions.
The spatial influence trend of electrostatic effects on the volume median diameter (VMD) of droplets from the TR80-02 nozzle is shown in Figure 22. From the test results chart, it can be clearly derived that, as the TR80-type electrostatic spray nozzle joins the electrostatic field in the spray flow field, droplets in the volume of the mid-size show a significantly reduced trend; at the distance from the spray nozzle height level of 400 mm, the average droplet size reduction is of 11.8 μm, and droplet size uniformity increased by 21.2%; at the distance from the spray nozzle height level of 500 mm, the average droplet size showed a reduction of 7.08 μm, and the uniformity of the droplets increased by 11.75%.
The particle size spectrum in the spray flow field of the ST110-2 nozzle is illustrated in Figure 23. The spatial trend of electrostatic influence on the VMD of droplets from the ST110-02 nozzle is demonstrated in Figure 24. From the test results chart, it can be clearly derived that, as the ST110-type electrostatic spray nozzle joins the electrostatic field in the spray flow field, droplets in the volume of the median also show a significant reduction trend; at the spray nozzle level height of 400 mm, the droplet size was of an average of 18.16 μm, and droplet size uniformity increased by 13.6%; at the distance from the level of the spray nozzle height of 500 mm, the droplet size was of an average of 19.42 μm, and droplet size uniformity increased by 28.3%.
By analyzing the spatial particle size spectrum of the two electrostatic spray nozzles, it was found that, as the two electrostatic spray nozzles sprayed droplets in the electrostatic field, the droplet particle size has a tendency to decrease, in which the most obvious area of particle size reduction is located in the electrostatic nozzle below 0–200 mm, proving that the electric field can accelerate the droplet flow field in the early stage of the formation of the crushing effect. Moreover, the uniformity of droplet size in the spray height range of 400–500 mm below the nozzle was improved to different degrees.

4. Discussion

It is widely recognized that the application of electrostatic spray technology can significantly enhance spray atomization and deposition performance. Researchers have primarily focused on investigating the relationships between charging methods, nozzle structures, and spray quality. While atomization effectiveness is considered crucial for pest and weed control, with comparative control effects serving as validation criteria for the superiority of electrostatic spray parameters, limited research has been conducted on the charge performance and atomization characteristics under multi-factor coupled operating conditions. Additionally, maintaining droplet charge levels under special working conditions, such as the extended nozzle-to-canopy distance in aviation plant protection operations, remains a key research focus in this field.
This study innovatively designed a two-stage induction charging device to systematically analyze the interaction mechanisms among charging voltage, spray pressure, and height on droplet charge-to-mass ratio and particle size distribution. Experimental results demonstrate that, compared with existing aerial electrostatic spraying research—exemplified by the 1.18 mC/kg droplet charge-to-mass ratio achieved with the contact-charging electrostatic nozzle developed by Liao Hong’s team [24], and the 13.6% increase in average deposition density reported by Lian Qi [26] using planar electrodes, the dual-stage structure achieves enhanced charging efficiency through synergistic pre-charging and charge compensation effects. The device optimizes surface charge distribution on droplets, effectively suppressing charge escape phenomena and contributing to charge-to-mass ratio retention. Furthermore, it significantly improves the concentration uniformity of droplet size distribution within the core atomization zone. These findings validate the effectiveness of the two-stage induction structure in overcoming the charge saturation threshold inherent to conventional electrostatic spraying systems.
The theoretical significance of this study lies in revealing the dynamic equilibrium mechanism between charging efficiency and atomization characteristics under multi-parameter coupling, providing references for standardized design of aviation electrostatic spray systems. Practically, the two-stage induction device significantly reduces droplet drift loss rate, thereby enhancing pesticide utilization efficiency and ecological safety. Additionally, the response surface model constructed based on Box–Behnken design experiments can guide real-time optimization of operational parameters for plant protection drones, promoting intelligent development of precision spraying technology. From an economic benefit realization perspective, the reduction in drift miss rate directly decreases pesticide waste and potential compensation claims for phytotoxicity damage. The improvement in pesticide utilization rate means that comparable pest control efficacy can be achieved with a reduced application volume per unit area, which saves farmers direct costs. The optimization of intelligent operational parameters enhances work efficiency and consistency while reducing additional costs incurred by ineffective results due to operational errors. The combined effect of these technical advantages is expected to significantly lower the overall costs of crop protection operations and increase the economic returns of pest control measures.
This research has certain limitations. The experiments were confined to laboratory environments without fully simulating field complexities such as wind patterns and temperature/humidity fluctuations affecting charging performance. Moreover, water was used as the spray medium, leaving viscosity and conductivity’s interference with charge-atomization synergy unexplored. Future research will focus on the following: establishing quantitative mapping relationships between electrode configurations and charging efficiency through computational fluid dynamics (CFD) and multi-physics coupling simulations; conducting field trials to validate the device’s drift suppression effectiveness and deposition uniformity in real-world scenarios; and extending investigations to the charged atomization characteristics of suspension concentrates and emulsifiable concentrates to enhance device versatility.

5. Conclusions

To quantitatively analyze the effects of nozzle parameters, spray pressure, and electrostatic voltage on the charge-to-mass ratio and atomization performance of electrostatic spraying, this study integrated two-stage induction electrodes with ST-type and TR-type hydraulic nozzles. The investigation focused on the electrostatic charging effects and atomization characteristics resulting from the combination of the two-stage induction charging device with conventional hydraulic nozzles. The research conclusions are as follows:
The integrated application of an electrostatic spray charge-to-mass ratio detection system and Malvern laser particle size analyzer enables rapid and effective measurement and analysis of droplet charging and atomization characteristics in two-stage induction electrostatic spraying. Through single-factor, multi-factor, and response surface experiments, the study can systematically investigate the impacts of operational parameters such as spray pressure, flow rate, and electrostatic voltage on charging efficiency and atomization performance. This approach further clarifies the dominant controlling factors affecting electrostatic spray effectiveness and elucidates the interactive mechanisms among these variables.
Based on Box–Behnken central composite design (CCD) experimental results and the charge-to-mass ratio polynomial regression model, it was determined that the droplet charge-to-mass ratio reaches a peak value of approximately 1.62 mc/kg under the optimal parameters of 12 kV electrostatic voltage, 0.48 L/min spray flow rate, and 0.2 m spray height. Analysis of the main effect contributions to charge-to-mass ratio revealed the following order of influence: electrostatic voltage > spray height > spray flow rate. Specifically, electrostatic voltage exhibits a positive correlation with charge-to-mass ratio. Spray flow rate and spray height show negative correlations with charge-to-mass ratio. The voltage–height interaction term demonstrates a significant positive synergistic effect, indicating that increasing voltage at lower spray heights effectively mitigates the attenuation coefficient of charge-to-mass ratio.
Multiple linear regression models were established for both nozzle types to analyze the relationships among pressure, flow rate, electrostatic voltage, and droplet size. Analysis of variance (ANOVA) demonstrated that the models exhibited high significance (p < 0.0001, adjusted R2 values of 0.878 and 0.959), confirming their applicability for predicting atomized droplet size in two-stage induction electrostatic nozzles. This study provides theoretical foundations and experimental guidance for designing and manufacturing aviation electrostatic spraying devices with enhanced charging efficiency and atomization performance.

Author Contributions

J.H. and Y.L. conceived the idea of the experiment; Y.L. and C.L. performed the field test; Y.L. and C.L. analyzed the data; J.H., C.L., Y.L., Q.L., S.Z., W.Z., and Y.W. wrote and revised the paper. All authors have read and agreed to the published version of the manuscript.

Funding

This research was funded by the Heilongjiang Bayi Agricultural University “San Zong” Research Support Program Project (No. ZRCPY202205); Open Fund Project of Heilongjiang Provincial Key Research and Development Program-Major Project (2023ZX01A06); Heilongjiang Provincial Natural Science Foundation Joint Guidance Project (LH2023E106); Heilongjiang Provincial “Double First-Class” Discipline Collaborative Innovation Achievement Project (LJGXCG2023-045); China University Industry-University-Research Collaboration Innovation Fund-Funding Project (2023RY059); Heilongjiang Bayi Agricultural University Talent Introduction Scientific Research Startup Fund Project (XYB202504); Key Laboratory of Green Pesticides (Guizhou University, GPLKF202511) and Heilongjiang Provincial Undergraduate Universities Outstanding Young Teachers Basic Research Support Program (YQJH2023019).

Data Availability Statement

The original contributions presented in this study are included in the article. Further inquiries can be directed to the corresponding author(s).

Conflicts of Interest

The authors declare no conflicts of interest.

References

  1. Chen, S.D.; Liao, L.J.; Xu, X.J. Research status and trends of plant protection UAVs and key pesticide application technologies in China. J. Shenyang Agric. Univ. 2023, 54, 502–512. (In Chinese) [Google Scholar]
  2. Zheng, Y.J.; Chen, B.T.; Lyu, H.T. Advances in mechanized technology and equipment for orchard plant protection in China. Trans. Chin. Soc. Agric. Eng. 2020, 36, 110–124. (In Chinese) [Google Scholar]
  3. Wang, G.; Ou, M.; Jia, W.; Zhou, H.; Dai, S.; Dong, X.; Wang, X.; Jiang, L.; Lu, W.; Wang, M. The dynamic evaporation characteristics of thiophanate-methyl droplets and their enhancement under different wind conditions. Horticulturae 2022, 8, 721. [Google Scholar] [CrossRef]
  4. Yuan, H.Z.; Xue, X.Y.; Yan, X.J. Application and prospect of low-altitude and low-volume spraying technology for plant protection unmanned aerial vehicles. Plant Prot. 2018, 44, 152–158+180. (In Chinese) [Google Scholar]
  5. Liu, J.; Liu, X.; Zhu, X.; Yuan, S. Droplet characterisation of a complete fluidic sprinkler with different nozzle dimensions. Biosyst. Eng. 2016, 148, 90–100. [Google Scholar] [CrossRef]
  6. Lan, B.; Yang, Y.Q.; Chen, J. Factors affecting control efficacy of pesticides against rice sheath blight and rice stem borer in low-volume aerial spraying by UAV. Chin. J. Pestic. Sci. 2020, 22, 543–549. (In Chinese) [Google Scholar]
  7. Wu, D. Research on Low-Altitude and Low-Volume Spraying Technology of Plant Protection UAV. Ph.D. Thesis, Jilin Agricultural University, Changchun, China, 2019. (In Chinese). [Google Scholar]
  8. He, X.K. Progress in high-efficiency plant protection machinery and precision pesticide application technology. J. Plant Prot. 2022, 49, 389–397. (In Chinese) [Google Scholar]
  9. Cunha, J.P.; Barizon, R.R.; Ferracini, V.L. Spray drift and caterpillar and stink bug control from aerial applications with electrostatic charge and atomizer on soybean crop. Eng. Agric. 2017, 37, 1163–1170. [Google Scholar] [CrossRef]
  10. Appah, S.; Jia, W.; Ou, M.; Wang, P.; Gong, C. Investigation of optimum applied voltage, liquid flow pressure, and spraying height for pesticide application by induction charging. Appl. Eng. Agric. 2019, 35, 795–804. [Google Scholar] [CrossRef]
  11. Zhang, S.J.; Sun, X.; Gao, S.S. Application and current status analysis of electrostatic spraying in agricultural plant protection. J. Anhui Agric. Sci. 2019, 47, 15–19. (In Chinese) [Google Scholar]
  12. Gao, S.C.; Zhou, X.X.; Qin, W.C. Evaluation of adjuvant effects on droplet drift in aerial pesticide spraying using wind tunnel tests. Chin. J. Appl. Entomol. 2018, 55, 654–658. (In Chinese) [Google Scholar]
  13. Shi, X.; Chen, Y.X.; Du, Y.H. Effects of environmental wind speed and flight parameters on droplet drift characteristics of multi-rotor plant protection UAVs. J. Plant Prot. 2021, 48, 546–553. (In Chinese) [Google Scholar]
  14. Dorr, G.J.; Hewitt, A.J.; Adkins, S.W.; Hanan, J.; Zhang, H.; Noller, B. A comparison of initial spray characteristics produced by agricultural nozzles. Crop Prot. 2013, 53, 109–117. [Google Scholar] [CrossRef]
  15. Lan, Y.; Chen, S. Current status and trends of plant protection UAV and its spraying technology in China. Int. J. Precis. Agric. Aviat. 2018, 1, 1–9. [Google Scholar] [CrossRef]
  16. Xi, T.; Li, C.; Qiu, W.; Wang, H.; Lv, X.; Han, C.; Ahmad, F. Droplet deposition behavior on a pear leaf surface under wind-induced vibration. Appl. Eng. Agric. 2020, 36, 913–926. [Google Scholar] [CrossRef]
  17. Zhang, Y.L.; Huang, X.R.; Wang, L.L. Research progress and references of agricultural aerial electrostatic spraying technology abroad. Trans. Chin. Soc. Agric. Eng. 2021, 37, 50–59. (In Chinese) [Google Scholar]
  18. Jiang, Y.; Liu, J.; Li, H.; Hua, L.; Yong, Y. Droplet distribution characteristics of impact sprinklers with circular and noncircular nozzles: Effect of nozzle aspect ratios and equivalent diameters. Biosyst. Eng. 2021, 212, 200–214. [Google Scholar] [CrossRef]
  19. Wang, M.; Wang, X.; He, L. Droplet deposition distribution and control efficacy against tea green leafhopper by low-altitude and low-volume UAV spraying in tea plantations. Plant Prot. 2019, 45, 62–68+87. (In Chinese) [Google Scholar]
  20. Dong, W.H.; Guo, L.J.; Ma, X. Experimental study on stability and uniformity of multi-nozzle electrostatic spraying. J. Agric. Mech. Res. 2023, 45, 171–176. (In Chinese) [Google Scholar]
  21. Zhao, D.; Lan, Y.; Shen, W.; Wang, S.; Dixit, A. Development of a charge transfer space loop to improve adsorption performance in aerial electrostatic spray. Int. J. Agric. Biol. Eng. 2020, 13, 50–55. [Google Scholar] [CrossRef]
  22. Guo, J.; Dong, X.; Qiu, B. Analysis of the Factors Affecting the Deposition Coverage of Air-Assisted Electrostatic Spray on Tomato Leaves. Agronomy 2024, 14, 1108. [Google Scholar] [CrossRef]
  23. Liu, P. Design and Experimental Study of Agricultural Aviation Electrostatic Nozzle. Master’s Thesis, Heilongjiang Bayi Agricultural University, Daqing, China, 2014. (In Chinese). [Google Scholar]
  24. Liao, H. Design and Experimental Study of Electrostatic Spraying System Based on Multi-Rotor UAV. Master’s Thesis, Sichuan Agricultural University, Chengdu, China, 2022. (In Chinese). [Google Scholar]
  25. Wang, Y.T.; Wu, K.H. Research on electrostatic spraying system for multi-rotor plant protection UAV. Jiangsu Agric. Sci. 2020, 48, 225–230. (In Chinese) [Google Scholar]
  26. Lian, Q. Experimental Study on the Electrostatic Spraying System for Multi-Rotor UAV. Master’s Thesis, Heilongjiang Bayi Agricultural University, Daqing, China, 2016. (In Chinese). [Google Scholar]
  27. Cao, S.N.; Ou, M.X.; Jia, W.D. Numerical analysis of the influence of flight speed on UAV spray flow field. J. Agric. Mech. Res. 2020, 42, 24–29. (In Chinese) [Google Scholar]
  28. Ma, L.; Feng, C.H.; Guo, Y.W. Application status and prospects of plant protection UAVs in Sichuan Province. China Plant Prot. 2023, 43, 89–91. (In Chinese) [Google Scholar]
  29. Zhang, S.; Gu, W.; Qiu, B.; Xue, X.; Zhou, L. Design and experiment of a hydraulic lifting wind field test platform for crop protection UAS. Int. J. Agric. Biol. Eng. 2021, 14, 166–174. [Google Scholar] [CrossRef]
  30. Dai, S.; Zhang, J.; Jia, W.; Ou, M.; Zhou, H.; Dong, X.; Chen, H.; Wang, M.; Chen, Y.; Yang, S. Experimental study on the droplet size and charge-to-mass ratio of an air-assisted electrostatic nozzle. Agriculture 2022, 12, 889. [Google Scholar] [CrossRef]
  31. Gao, J.; Guo, Y.; Tunio, M.H.; Chen, X.; Chen, Z. Design of a high-voltage electrostatic ultrasonic atomization nozzle and its droplet adhesion effects on aeroponically cultivated plant roots. Int. J. Agric. Biol. Eng. 2023, 16, 30–37. [Google Scholar] [CrossRef]
  32. Pan, X.; Yang, S.; Gao, Y.; Wang, Z.; Zhai, C.; Qiu, W. Evaluation of spray drift from an electric boom sprayer: Impact of boom height and nozzle type. Agronomy 2025, 15, 160. [Google Scholar] [CrossRef]
Figure 1. Research technical roadmap.
Agronomy 15 01641 g001
Figure 2. Working principle of the two-stage induction-type electrostatic nozzle. 1. Nozzle. 2. Primary induction electrode. 3. Secondary induction electrode. 4. Ground charge flow direction. 5. High-voltage electrostatic generator. 6. Charged droplet trajectory. 7. Crop leaf.
Agronomy 15 01641 g002
Figure 3. ST110 series plant protection nozzles (flat fan type) and TR80 series plant protection nozzles (hollow cone type).
Agronomy 15 01641 g003
Figure 4. Electrode dimensional diagram. (a) Conical electrode for hollow cone nozzles. (b) Flat fan nozzle-matched wedge electrode (unit: mm).
Agronomy 15 01641 g004
Figure 5. Physical diagram of the sensing electrode. (a) Conical electrode for hollow cone nozzles. (b) Flat fan nozzle-matched wedge electrode.
Agronomy 15 01641 g005
Figure 6. Structure of droplet charge mass ratio measuring device. 1. Chemical tank. 2. Water storage. 3. Pressure gauge. 4. Electrostatic generator. 5. Electrostatic spray nozzles. 6. Staff gauge. 7. Reticulated load-body ratio collection box. 8. Copper wire mesh. 9. Gutter. 10. Ammeter. 11. Computers.
Agronomy 15 01641 g006
Figure 7. Droplet target reticulation receiver.
Agronomy 15 01641 g007
Figure 8. Schematic diagram of inductive electrostatic spray droplet size test system. 1. Medicine box. 2. Water pump. 3. Pressure gauge. 4. Electrostatic generator. 5. Electrostatic nozzle. 6. Scale ruler. 7. Laser particle size analyzer. 8. Computer.
Agronomy 15 01641 g008
Figure 9. Test device site.
Agronomy 15 01641 g009
Figure 10. Schematic diagram of sampling points in the spray flow field.
Agronomy 15 01641 g010
Figure 11. Trend diagram of the influence of electrostatic voltage on the charge-to-mass ratio.
Agronomy 15 01641 g011
Figure 12. Trend diagram of the effect of spray height on the charge-to-mass ratio.
Agronomy 15 01641 g012
Figure 13. Charge-to-mass ratio measurement experiment.
Agronomy 15 01641 g013
Figure 14. Response surface of spray flow rate, spray pressure, and spray height on droplet charge-to-mass ratio on the droplet charge-to-mass ratio. (a) Charging voltage/spray flow rate. (b) Charging voltage/spray height. (c) Spray flow rate/spray height.
Agronomy 15 01641 g014
Figure 15. Critical spray height range.
Agronomy 15 01641 g015
Figure 16. Critical voltage range.
Agronomy 15 01641 g016
Figure 17. Distribution of droplet volume median diameter (VMD) for various nozzle models at 0.25 MPa.
Agronomy 15 01641 g017aAgronomy 15 01641 g017b
Figure 18. The diameter distribution of the droplet volume of each type of ST110 under 6 kv.
Agronomy 15 01641 g018aAgronomy 15 01641 g018b
Figure 19. Droplet size regression model (ST110).
Agronomy 15 01641 g019
Figure 20. Droplet size regression model (TR80).
Agronomy 15 01641 g020
Figure 21. TR80-02 spatial droplet size distribution of the TR80-02 hollow cone nozzle spray.
Agronomy 15 01641 g021
Figure 22. Space trend diagram of the influence of static electricity on the droplet diameter of the TR80 nozzle.
Agronomy 15 01641 g022
Figure 23. Droplet size distribution in the flow field of the ST110-2 flat fan nozzle spray.
Agronomy 15 01641 g023
Figure 24. Space trend diagram of the effect of static electricity on the droplet diameter of the ST110 nozzle.
Agronomy 15 01641 g024
Table 1. Response surface test design.
FactorLevel
−101
Input voltage A (kv)51015
Flow rate B (L/min)0.480.560.63
Spray height (m)0.20.61.0
Table 2. ANOVA analysis of the response surface model.
Source of VariationSquare SumDegrees of FreedomMean SquareF-Valuep-Value
Model3.0190.334816.460.0033
X10.871210.871242.840.0012
X20.037810.03781.860.2309
X30.787510.787538.720.0016
X1X20.001610.00160.07870.7903
X1X30.052910.05292.600.1677
X2X30.000210.00020.01110.9203
X121.2211.2259.940.0006
X220.000010.00000.000809787
X320.012410.01240.60900.4705
Residual0.101750.0203
Lock of fit0.00352 18.890.0507
Total3.1214
Table 3. Data table: variation of droplet size with spray pressure for ST110 flat fan nozzle.
Nozzle ModelVolume Median Diameter Dv50 (μm)
0.25 Mpa0.27 Mpa0.29 Mpa0.31 Mpa0.33 Mpa0.35 Mpa
ST110-01138.1137.5136.5132.5130.7129.4
ST110-02163.9160.5157.5155.6152.4151.4
ST110-03180.1175.7171.6167.2165.3164.2
TR80-01135.7133.6130.9126.3120.8119.7
TR80-02145.3144.2141.6135.6133.8127.8
TR80-03155.4153.9151.9145.9140.7138.4
Table 4. Data table of the variation of droplet size with voltage for each type of nozzle.
Nozzle ModelVolume Center Diameter (Dv50) agronomaa/μm
6 kV7 kV8 kV9 kV10 kV11 kV12 kV13 kV14 kV15 kV
ST110-01134.2127.5121.8120.6118.3116.9116.2115.5115.1114.2
ST110-02154.1153.7150.2145.5140.3138.5136.2135.8135.2135.1
ST110-03170.6165.5158.5150.2145.3144.7140.2139.8138.9138.4
TR80-01131.3129.5124.6118.9115.4114.3113.1113112.8112.9
TR80-02140.6138.2134.5133.5126.6122.3119.5119.2118.3118
TR80-03150.7147.3143.6141.5136.3132.9131.5130.2129.1129
Table 5. ST110/TR80 nozzle droplet size electrostatic nozzle orthogonal test arrangement table.
Pressure
(P)/Mpa
Flow Rate
(F)/L·min−1
Voltage
(P)/kv
Droplet Size Characteristics of the ST110 Nozzle
(Ds)/μm
Droplet Size Characteristics of the TR80 Nozzle
(Dt)/μm
0.250.368123.6125.3
0.3610120.8118.7
0.3612117.6115.8
0.738153.4135.3
0.7310147.9130.6
0.7312129.8115.7
1.088162.6146.9
1.0810149.5138.6
1.0812145.3133.2
0.30.398121.8124.6
0.3910118.3115.4
0.3912116.2113.1
0.808150.2134.5
0.8010140.3126.6
0.8012136.2119.5
1.198158.5143.6
1.1910145.3136.3
1.1912140.2131.5
0.350.428118.9121.8
0.4210115.6113.9
0.4212113.7111.2
0.868145.8130.6
0.8610138.5123.9
0.8612132.5116.3
1.288152.6140.6
1.2810142.4133.8
1.2812136.5128.4
Table 6. Coefficients table of the fitting equation (ST110).
FactorUnstandardized CoefficientStandardized CoefficientValue T95% CI (Asymptotic)
Value BStandard ErrorValue Beta
(Constant)172.38610.114 17.044151.463 to 193.309
Pressure (P)−108.27725.890−0.308−4.182−161.835 to −54.719
Flow rate (F)37.1363.2120.85211.56230.492 to 43.780
Voltage (V)−3.3170.639−0.378−5.192−4.638 to −1.995
Table 7. Coefficients table of the fitting equation (TR80).
FactorUnstandardized CoefficientStandardized CoefficientValue T95% CI (Asymptotic)
Value BStandard ErrorValue Beta
(Constant)163.3744.044 40.404155.010 to 171.739
Pressure (P)−75.26510.350−0.312−7.272−96.676 to −53.854
Flow rate (F)24.0501.284−0.80318.73021.394 to 26.706
Voltage (V)−3.2920.255−0.545−12.890−3.820 to −2.763
Disclaimer/Publisher’s Note: The statements, opinions and data contained in all publications are solely those of the individual author(s) and contributor(s) and not of MDPI and/or the editor(s). MDPI and/or the editor(s) disclaim responsibility for any injury to people or property resulting from any ideas, methods, instructions or products referred to in the content.

