Article

Growth, Spectral Vegetation Indices, and Nutritional Performance of Watermelon Seedlings Subjected to Increasing Salinity Levels

by
Alfonso Llanderal
1,
Gabriela Vasquez Muñoz
1,
Malena Suleika Pincay-Solorzano
1,
Stanislaus Antony Ceasar
2 and
Pedro García-Caparros
3,*
1
Faculty of Technical Education for Development, Catholic University of Santiago of Guayaquil, Av. C. J. Arosemena Km. 1.5, Guayaquil 09014671, Ecuador
2
Division of Plant Molecular Biology and Biotechnology, Department of Biosciences, Rajagiri College of Social Sciences, Kochi 683104, India
3
Higher Engineering School, University of Almeria, 04120 Almeria, Spain
*
Author to whom correspondence should be addressed.
Agronomy 2025, 15(7), 1620; https://doi.org/10.3390/agronomy15071620
Submission received: 31 May 2025 / Revised: 29 June 2025 / Accepted: 30 June 2025 / Published: 2 July 2025
(This article belongs to the Section Horticultural and Floricultural Crops)

Abstract

The production of high-quality horticultural seedlings is essential for successful field transplantation. Nevertheless, increasing soil salinization poses a significant challenge, particularly in salt-affected regions. Watermelon seedlings were cultivated in pots with a substrate (mixture of ground blonde peat (60%), black peat (30%), and perlite (10%) with pH 5.5–6.0) within a bamboo nethouse and subjected to varying salinity levels, i.e., 2–8 dS m−1 (T1, T2, T3, and T4). At the end of the experimental period (4 weeks), the growth parameters, spectral vegetation indices, and chemical parameters of the sap and leachate were evaluated. The results demonstrated that increased salinity levels reduced the biomass of watermelon seedlings. In addition, elevated salinity levels were associated with increased values of B (48%) and NBI (46%) and decreased values of G (9%) and NGI (7%) at the end of the experimental period. The effects of the salinity levels were also evident in the sap chemical parameters, with marked increases in Cl, Ca2+, and Na+ concentrations (9.6, 3.1, and 4.9 times, respectively) and decreases in the N-NO3, P, and K+ concentrations (51, 8, and 25%, respectively). The leachate analysis reported clear increases in the values of EC and concentrations of Cl, Ca2+, and Na+ at the end of the experimental period. To validate the relevance of these findings, further research under field conditions and across a range of climatic environments is warranted.

1. Introduction

Soil salinization is a global challenge primarily caused by agricultural practices such as irrigation with brackish, drained, or polluted water, especially in arid and semi-arid regions. These conditions result in the accumulation of salt in the soil [1,2].
According to the recently launched website of the Global Framework on Water Scarcity in Agriculture (WASAG), more than 424 million hectares (MHa) of topsoil (0–30 cm) and 833 million hectares of subsoil (30–100 cm) are currently affected by salinity (https://www.fao.org/global-soil-partnership/gsasmap/en (accessed on 3 June 2025) [3]. Saline soils are characterized by the high presence of Na+ and Cl ions, which are responsible for the degradation of soil properties and consequently affect plant growth due to the osmotic stress and ionic imbalance [4,5].
Osmotic stress occurs when elevated salt concentrations in the root zone cause a reduction of the water potential of the soil solution, limiting the root system’s ability to uptake water. On the other hand, ion-specific stress occurs when an excessive uptake of ions, such as sodium (Na+) and chloride (Cl), through transpiration streams leads to their accumulation in the aboveground parts of plants, causing cytotoxicity and nutritional imbalance [6,7,8]. Both stresses affect plants in critical physiological processes, impairing their growth and consequently affecting crop yield and quality [9,10].
Spectral vegetation indices are useful for the identification of stressed conditions like salinity in horticultural crops [11,12]. Nevertheless, most of these studies have been performed on adult plants, while the spectral indices during early growth have been understudied.
Watermelon (Citrullus lanatus Thunb) is a flowering plant belonging to the Cucurbitaceae family which fruit is widely appreciated by consumers due to its sweetness and the presence of healthy bioactive compounds such as lycopene, vitamin C, and β-carotene [13]. Moreover, it is one of the most economically important global food crops, with a production of 104.6 million Tm and a global cultivation area of 3,042,931 ha in 2023 [14].
Watermelon is moderately sensitive to salinity, with a maximum salinity tolerance threshold of approximately 2.2 dS m−1 [15,16]. When the electrical conductivity (EC) of the irrigation water exceeds this threshold, watermelon plants experience reductions in photosynthesis, transpiration, and stomatal conductance. In addition, salinity adversely affects nutrient absorption, transport, assimilation, and distribution, leading to reductions in plant growth and yield [17,18]. Nevertheless, it is important to highlight that the sensitivity of the watermelon to salinity may vary according to its developmental stage [19].
In the previous literature, there has been many studies reporting the effects of increasing salinity levels in watermelon plants in terms of yield at the end of the crop cycle. For instance, Lucena et al. [20] and Martins et al. [21] reported that irrigation with EC values of 3.5 and 4.5 dS m−1 resulted in yield reductions of 25 and 50%, respectively. Nevertheless, there is a lack of research examining the effects of increased electrical conductivity in irrigation water on the physiological and nutritional performance of watermelon seedlings during the vegetative stage. This stage plays a crucial role in determining the final yield of the crop. Therefore, the present study aims to evaluate the effect of increasing salinity levels on the growth parameters, spectral vegetation index, and nutritional parameters in watermelon seedlings during the vegetative growth stage.

2. Materials and Methods

2.1. Plant Material and Experimental Conditions

The present study was conducted at the facilities of the Catholic University of Santiago of Guayaquil, Ecuador (2°11′ S, 79°54′ W). Watermelon seedlings cv. Charlestones were obtained from a local nursery and transplanted into 5 L polyethylene pots containing a mixture of ground blonde peat (60%), black peat (30%), and perlite (10%), with pH 5.5–6.0. The selection of this cultivar was based on its prevalence as the most commonly cultivated variety among local growers. The experimental period was 4 weeks, during which the pots were placed in a bamboo nethouse of 30 m2. The microclimatic conditions inside the nethouse were monitored continuously with dataloggers (model TempU 03, HOBO, Bourne, MA, USA). The recorded average, minimum, and maximum values for temperature and relative humidity during the experimental period are presented in Table 1. These values were within the optimal ranges for watermelon seedlings growth, as reported by Ferre and Rodriguez [22] (11–35 °C for temperature and 50–90% for relative humidity).

2.2. Experimental Design and Treatments

The experiment consisted of four treatments with differing salinity levels, established by adding different concentrations of NaCl to a standard Hoagland and Arnon [23] nutrient solution until achieving EC levels in the irrigation water (ECi) of 2.0 dS m−1 (T1 or control), 4 dS m−1 (T2), 6 dS m−1 (T3), and 8 dS m−1 (T4). The chemical compositions of the Hoagland and Arnon nutrient solutions were the following: macronutrients (14 NO3, 1 NH4+, 1 H2PO4, 2 SO42−, 4 Ca2+, and 2 Mg2+ expressed in mmol−1) and micronutrients (1.0 Fe, 0.5 Mn, 0.05 Zn, 0.02 Cu, 0.5 B, and 0.01 Mo expressed in mg L−1). The pH values in all saline treatments were 6. Salinity treatments started two weeks after transplanting to allow plant acclimation, during which seedlings were irrigated only with the Hoagland and Arnon nutrient solution to mitigate potential shock effects, particularly in the early vegetative growth stage. Plants were manually irrigated daily, and the ECi and pH levels were measured daily using a conductivity meter and pH meter (models Horiba Laquatwin-EC-11 and Laquatwin-pH-11, Horiba Ltd., Kyoto, Japan respectively). The experimental design consisted of four salinity treatments, four blocks, and five plants (one plant per pot), giving a total of 80 plants.

2.3. Growth Parameters

After 4 weeks of salinity stress, the seedlings were harvested, and the substrate was gently washed from the roots of five plants per treatment. The plant material was stored directly in a refrigerator at 4 °C for further determinations. Leaf number was counted directly on five plants per treatment. Leaf area index (LAI) was determined from digitized images of each plant immediately after the harvesting using the Idrisi Selva computer program (Clark Laboratories, Worcester, MA, USA), following the methodology reported by Vaesen et al. [24]. Watermelon leaves were scanned using an Epson L3110 scanner (L3110; Seiko Epson Corp., Suwa, Japan). Seedlings were then separated into roots (R), stems (S), and leaves (L), and their respective fresh weights (FWs) were measured. Total fresh weight (TFW) was calculated as the sum of the root, stem, and leaf FWs. Subsequently, the roots, stems, and leaves were oven-dried at 60 °C until they reached a constant weight to record their respective dry weights (DWs). Total dry weight (TDW) was calculated as the sum of the root, stem, and leaf DWs. These dry weights were used to calculate several plant parameters as described by Garcia-Caparros et al. [25]: leaf weight ratio (LWR; leaf DW per unit plant DW), shoot weight ratio (SWR; shoot DW per unit plant DW), and relative root weight ratio (RWR; root DW per unit plant DW). The fresh and dry weight of leaves were used to calculate the water content (WC) (−) according to the equation reported by Garcia-Caparros et al. [25]: WC = (FW − DW)/FW.

2.4. Spectral Vegetation Indices

The digitized images used for leaf area index were saved in JPG format at a resolution of 1200 dpi. From these images, we selected the images of twenty fully developed young leaves per treatment (4 leaves per plant and five plants per treatment). The software Adobe Photoshop 2020 (Adobe System Software, Dublin, Ireland) was used to obtain color grouping values for R (redness intensity), G (greenness intensity), and B (blueness intensity), according to the methodology reported by Zhao et al. [26].

2.5. Nutritional Parameters

At the end of the experimental period, the leaf samples used for the determination of the spectral vegetation indices were then directly processed for petiole sap extraction and the corresponding analysis of the chemical composition. Leaf samples were gently cleaned with a damp cloth and sectioned into 0.5 cm fragments, which were subsequently frozen at −16 °C for 24 h. Petiole sap (including xylem and phloem sap, as well as apoplastic, cytosolic, and vacuolar solutions) was extracted using a hydraulic press following the methodology described by Cadahía [27]. In the extracted petiole sap, the pH and concentrations of NO3-N, P, Cl, K+, Ca2+, and Na+ were determined. The pH value was measured using a portable pH meter (model Horiba Laquatwin-pH-11). The nitrate, potassium, sodium, and calcium concentrations were analyzed using portable ion-selective electrodes (models Horiba Laquatwin-N-NO3-11, Laquatwin-K-11, Laquatwin-Na-11, and Laquatwin-Ca-11; Horiba Ltd., Kyoto Japan). The phosphorous concentration was determined with a digital photometer (model Hanna HI 706, Hanna Instruments, Sursee, Switzerland). The chloride concentration was assessed using a digital colorimeter (model Hanna HI 753, Hanna Instruments, Sursee, Switzerland). All nutrient concentrations were expressed in ppm. Based on these values, the Cl/N, Cl/P, K/Na, and Ca/Na ratios were calculated to assess the potential nutrient antagonisms or synergies.
The volumes of nutrient solution supplied and leached per treatment were recorded throughout the experimental period. The chemical composition of the nutrient solution and leachates was analyzed weekly. The values of EC and pH were determined using a conductivity meter and pH meter (models Horiba Laquatwin-EC-11 and Laquatwin-pH-11, respectively). The chemical composition of the leachate was determined using the same methodology for the petiole sap analysis.

2.6. Statistical Analysis

A one-way analysis of variance (ANOVA) was performed, and statistical differences between treatments means were evaluated by Fisher’s least significant difference (LSD) tests at p < 0.05. The assumptions of residual normality and homogeneity of variances for ANOVA were evaluated. Data analysis was conducted using Statgraphics Plus for Windows (Statpoint Technologies Inc., Warrenton, VA, USA).

3. Results

3.1. Growth Parameters

Under increasing NaCl concentrations in the nutrient solution, watermelon seedlings showed a significant reduction in the leaf area index, as well as in fresh and dry weights of the different organs tested (leaf, stem, root, and total plant biomass). In contrast, the effect on leaf number was less pronounced, with significant differences observed only at electrical conductivity (EC) levels exceeding 6 dS m−1. The leaf water content, along with leaf and stem weight ratios, remained unchanged under increasing salinity levels in the nutrient solution. Nevertheless, the root weight ratio showed a marked decline in plants subjected to an EC of 8 dS m−1 (Table 2).

3.2. Spectral Vegetation Indices

The red color in the leaves of the watermelon seedlings remained unchanged by the increasing EC levels. Nevertheless, at the highest salinity level, the plants showed the lowest green color intensity and the highest blue color intensity. Similarly, the normalized green and blue color ratios followed the same trend as the aforementioned color variations (Table 3).

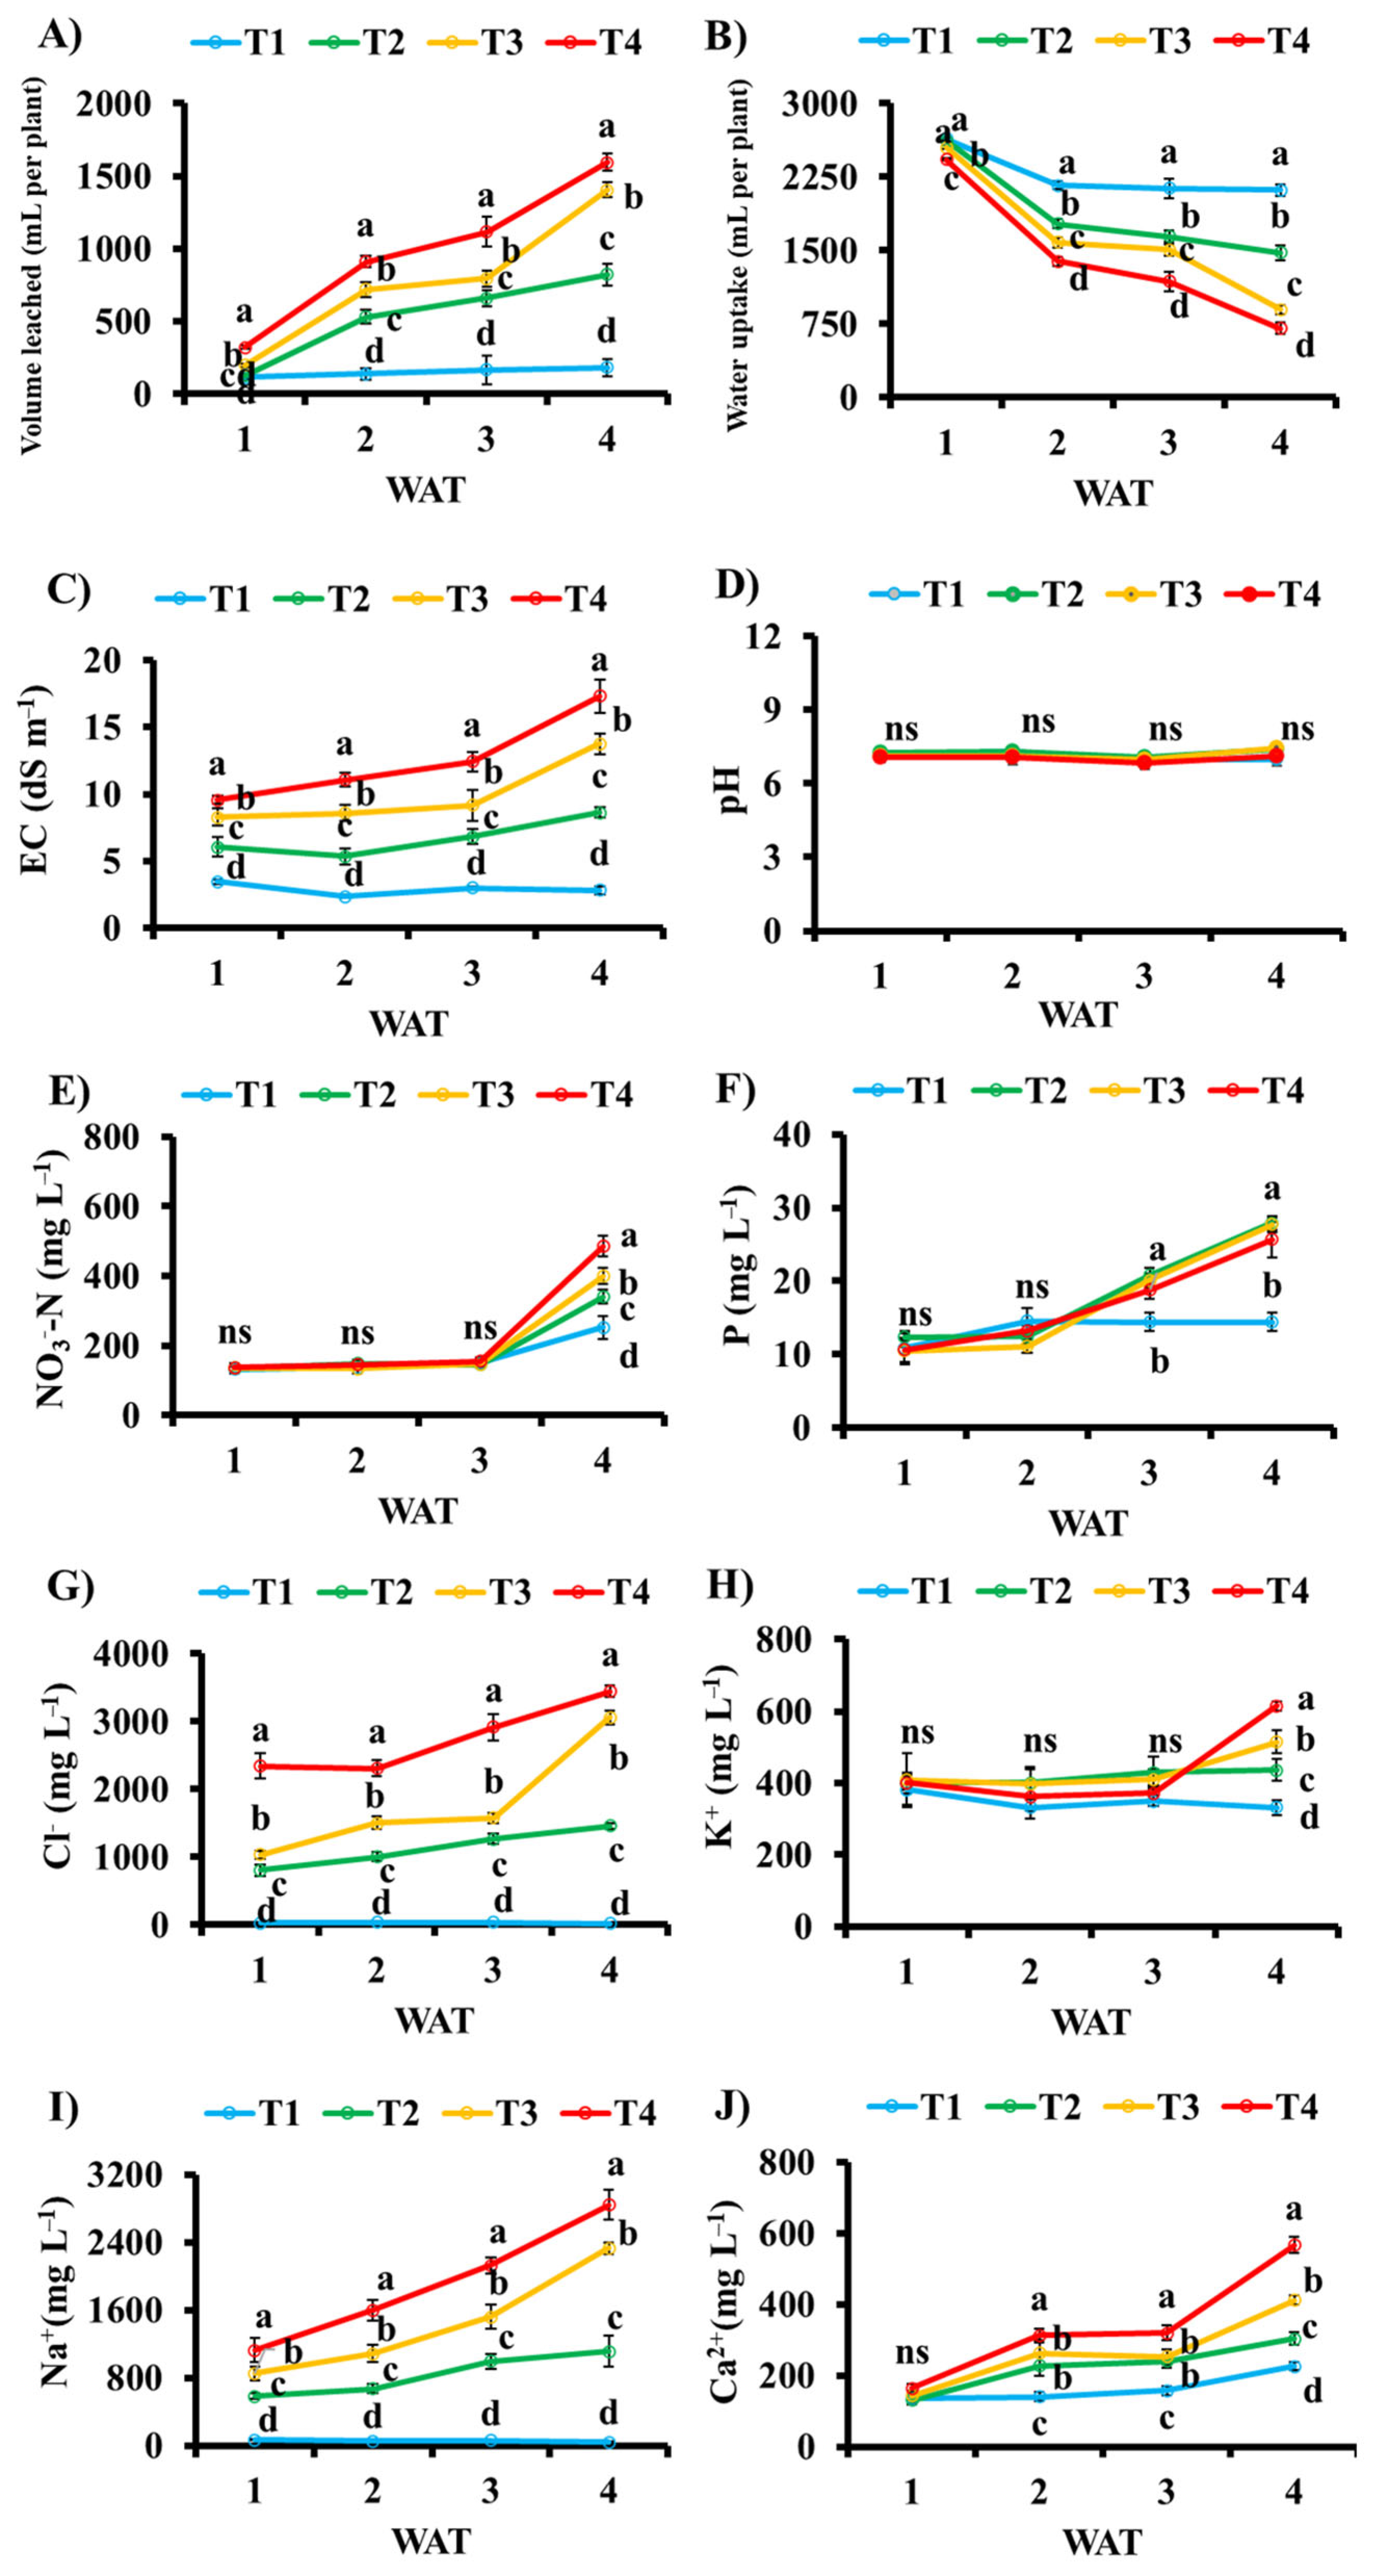
3.3. Nutritional Parameters

Under the increasing EC levels in the nutrient solution, the pH of sap in the watermelon seedlings remained unaffected. Nevertheless, the concentrations of N-NO3, P, and K+ tended to decline, while the concentrations of Cl, Ca2+, and Na+ significantly increased. Regarding the ion ratios studied, Cl/N and Cl/P showed a similar trend, increasing under higher salinity conditions, whereas K/Na and Ca/Na showed the opposite trend, decreasing with the rising salinity levels (Table 4).
The volume of leachate, water uptake, and chemical parameters of the leachate are presented in Figure 1. Throughout the experimental period, the leachate volume (Figure 1A) and leachate EC (Figure 1C) increased across all treatments, with the highest values observed in watermelon seedlings fertigated at 8 dS m−1. In contrast, water uptake (Figure 1B) showed the opposite trend, reaching its maximum value in plants fertigated at 2 dS m−1. The pH of the leachate (Figure 1D) remained unchanged around 7.1 across all treatments throughout the experimental period. The concentrations of NO3-N and K+ in the leachate (Figure 1E,H) followed a similar trend, showing a slight increase during the first three weeks without significant differences among the treatments. Nevertheless, in the last week of the experimental period, the NO3-N and K+ concentrations increased markedly, with significant differences between treatments, showing the highest value in seedlings fertigated at 8 dS m−1. The concentration of P in the leachate (Figure 1F) remained unchanged across the treatments during the first two weeks of the experimental period. Nevertheless, in the last two weeks, all treatments tended to increase, though significant differences were only observed in the treatment at the lowest salt level. The concentration of Cl and Na+ (Figure 1G,I) progressively increased throughout the experimental period, with significant differences among the treatments, showing the highest value in plants fertigated at 8 dS m−1. Similarly, the Ca2+ concentration in the leachate (Figure 1J) followed the same trend, although no significant differences were observed among the treatments during the first week of the experimental period.

4. Discussion

The results of this study demonstrated that the increasing concentrations of NaCl in the nutrient solution led to a significant reduction in the leaf area and biomass across various plant organs, as well as in the whole plant, as measured by both the fresh and dry weights. The observed reduction in the leaf area index can be considered an adaptative mechanism to salinity stress, aiming to reduce the transpirational surface area [28]. Similar reductions in the fresh and dry biomass in watermelon seedlings under increasing saline levels have been previously documented by other researchers, with values ranging from 10 to 60% using water with an EC ranging from 3.56 to 7.96 dS m−1 [29,30]. These reductions could be attributed to both the increasing osmotic potential of the nutrient solution and the specific ion effects of Na+ and Cl ions in the root zone [31,32]. No significant changes were observed in the leaf water content (LWC) and in the ratios of the leaf and stem weights, which may be due to the relatively short duration of the experimental period. Nevertheless, the observed decline in the root weight ratio under higher saline concentrations may adversely affect seedling quality and could compromise the successful establishment following transplantation into field conditions. It is important to emphasize that, while the duration of this experiment was valid for assessing early seedling responses, it did not capture long-term physiological adaptation or yield implications. Therefore, extended trials are necessary to validate these findings and assess their implications for crop performance under saline conditions.
Spectral indices can be used as a preliminary diagnostic tool but not as validated indicators of plant health [33]. In this study, the red coloration of the leaves in the watermelon seedlings remained unaffected by the increasing salinity levels in the nutrient solution. It is well established that both red reflectance values and the normalized red index (NRI) are closely associated with the leaf water status [34,35]. This observation is consistent with our findings, as no significant changes in the leaf water status in the watermelon seedlings were observed under the increasing saline conditions. Nevertheless, irrigation with the highest salinity level resulted in a significant decline in green coloration, accompanied by an increase in blue coloration. These changes were reflected in corresponding trends in the respective normalized ratios. A higher green reflectance and normalized green index represent a better health status in plants [36,37]. The observed decline in green reflectance and the normalized index under saline conditions clearly indicated that the watermelon seedlings were cultivated under stressed conditions, corroborating the observed effects of the increased NaCl concentrations in the nutrient solution. Moreover, the observed decline in green may also be ascribed to nutrient imbalances, particularly nitrogen deficiency, which is known to affect the chlorophyll content and green pigmentation [38,39]. Similarly, the observed increase in blue color and the normalized index under saline conditions can be related to phosphorus deficiency, a relationship previously documented in the literature [40,41].
The consistent decline in the concentrations of N-NO3, P, and K+, accompanied by an increase in the Cl, Ca2+, and Na+ concentrations, as well as the corresponding changes in the ionic ratios in the petiole sap of the watermelon seedlings, clearly reflect the competitive interactions between nutrients that occur under salinity conditions in crops. These interactions are primarily attributed to the antagonism between Cl and N-NO3 and between Cl and H2PO4, as well as the ionic competition between Na+ and K+ and between Ca2+ and Na+. Such nutrient imbalances and antagonistic effects under saline stress have been extensively documented by García-Caparros et al. [25], Garcia-Caparros and Lao [28], and Llanderal et al. [42,43,44]. Furthermore, it is necessary to highlight that the nutrient concentrations measured in petiole sap in the present study fell within the ranges previously shown by Hochmuth et al. [45], who reported sap concentrations of N-NO3 and K+ in watermelon within the ranges of 1000–1200 and 4000–5000 ppm, respectively. While the sap nutrient concentrations reported in this study provide valuable insights into the plant’s physiological responses to salinity, it is necessary to recognize that such measurements reflect the dynamic nutrient status rather than total nutrient pools. Therefore, future studies should complement sap analysis with comprehensive tissue mineral analysis to obtain better an understanding of nutrient distribution and accumulation under saline conditions.
In the present study, both the leachate volume per plant and its EC showed a consistent increasing trend over the course of the experimental period. Notably, the treatment subjected to the highest salinity level recorded the highest value in both parameters. This pattern reflects a direct relationship between leachate volume and its corresponding EC, suggesting that elevated salinity levels compromise the plant’s capacity to uptake water and nutrients, thereby resulting in an increased leachate volume [46,47]. As the volume of leachate increases, plant water uptake is consequently reduced, as was observed in our experiment. The higher values of EC in leachate can be attributed to the accumulation of Cl, Ca2+, and Na+ ions, which are present in the tap water used for irrigation, as previously reported by Garcia-Caparros et al. [48]. The progressive accumulation of these ions in the leachate over the experimental period further supports this interpretation. In addition, the observed differences in the NO3-N, P, and K concentrations in the leachate among the treatments, particularly towards the end of the experimental period, clearly reflect the detrimental impact of the increasing saline concentration in the nutrient solution on the uptake of essential macronutrients. This pattern is consistent with previous findings that highlight the inhibition of nutrient uptake in plants exposed to saline stress [49,50].

5. Conclusions

The main findings of this experiment, summarized in Figure 2, indicated that irrigation with increasing NaCl concentrations in the nutrient solution significantly reduced both the fresh and dry biomass across various plant organs, as well as the leaf area index in watermelon seedlings. Based on these results, we recommend a maximum salinity threshold of ≤3 dS m−1 for nursery irrigation to maintain at least 80% of the biomass recorded in the control watermelon seedlings. In terms of spectral indices, elevated salinity levels increased the B and NBI at the end of the experimental period, whereas, in the case of G and NGI, the trend was the opposite. The effects of the salinity levels were also evident in the sap chemical parameters, with marked increases in the Cl, Ca2+, and Na+ concentrations, as well as in the Cl/N and Cl/P ratios. Conversely, significant decreases were observed in the N-NO3, P, and K+ concentrations, along with reduced K/Na and Ca/Na ratios. Regarding the leachate analysis, the increasing EC levels in the nutrient solution were associated with a clear reduction in plant water uptake capacity, along with increases in the leachate volume; leachate EC; and concentrations of Cl, Ca2+, and Na+. While these results clearly evidenced the adverse effects of salinity on nutrient uptake and biomass generation in watermelon seedlings, further research in the field and across varying climatic conditions is necessary to validate the broader applicability of these findings. Additionally, further studies should consider the potential mitigating effects of foliar applications of nitrogen and potassium fertilizers, as well as increasing the concentrations of these fertilizers in the nutrient solution, as potential strategies to alleviate salinity-induced stress during the vegetative growth stage of watermelon seedlings.

Author Contributions

A.L.: funding acquisition, supervision, project administration, and writing—original draft preparation; G.V.M.: formal analysis, data curation, and investigation; M.S.P.-S.: formal analysis; S.A.C.: data curation; P.G.-C.: project administration and writing—original draft preparation. All authors have read and agreed to the published version of the manuscript.

Funding

This research received no external funding.

Data Availability Statement

The original contributions presented in the study are included in the article, and further inquiries can be directed to the corresponding author.

Conflicts of Interest

The authors declare no conflicts of interest.

References

  1. Tarolli, P.; Luo, J.; Park, E.; Barcaccia, G.; Masin, R. Soil salinization in agriculture: Mitigation and adaptation strategies combining nature-based solutions and bioengineering. iScience 2024, 27, 108830. [Google Scholar] [CrossRef] [PubMed]
  2. Shokri, N.; Hassani, A.; Sahimi, M. Multi-scale soil salinization dynamics from global to pore scale: A review. Rev. Geophys. 2024, 62, e2023RG000804. [Google Scholar] [CrossRef]
  3. Garcia-Caparros, P.; Al-Azzawi, M.J.; Flowers, T.J. Economic uses of salt-tolerant plants. Plants 2023, 12, 2669. [Google Scholar] [CrossRef] [PubMed]
  4. Ondrasek, G.; Rengel, Z. Environmental salinization processes: Detection, implications & solutions. Sci. Total Environ. 2021, 754, 142432. [Google Scholar] [PubMed]
  5. Ashraf, M.; Munns, R. Evolution of approaches to increase the salt tolerance of crops. Crit. Rev. Plant Sci. 2022, 41, 128–160. [Google Scholar] [CrossRef]
  6. Ludwiczak, A.; Osiak, M.; Cárdenas-Pérez, S.; Lubińska-Mielińska, S.; Piernik, A. Osmotic stress or ionic composition: Which affects the early growth of crop species more? Agronomy 2021, 11, 435. [Google Scholar] [CrossRef]
  7. Amin, I.; Rasool, S.; Mir, M.A.; Wani, W.; Masoodi, K.Z.; Ahmad, P. Ion homeostasis for salinity tolerance in plants: A molecular approach. Physiol. Plant. 2021, 171, 578–594. [Google Scholar] [CrossRef]
  8. Fu, H.; Yang, Y. How plants tolerate salt stress. Curr. Issues Mol. Biol. 2023, 45, 5914–5934. [Google Scholar] [CrossRef]
  9. Verma, O.; Sharma, S.; Kumar, V.; Singh, T.; Kumar, R.; Auji, R. Salinity stress effect on staple food crops and novel mitigation strategies. Biologia 2024, 79, 2359–2374. [Google Scholar] [CrossRef]
  10. Zhang, H.; Yu, C.; Zhang, Q.; Qiu, Z.; Zhang, X.; Hou, Y.; Zang, J. Salinity survival: Molecular mechanisms and adaptive strategies in plants. Front. Plant Sci. 2025, 16, 1527952. [Google Scholar] [CrossRef]
  11. Tola, E.; Al-Gaadi, K.A.; Madugundu, R.; Zeyada, A.M.; Edrris, M.K.; Edrees, H.F.; Mahjoop, O. The use of spectral vegetation indices to evaluate the effect of grafting and salt concentration on the growth performance of different tomato varieties grown hydroponically. Horticulturae 2025, 11, 368. [Google Scholar] [CrossRef]
  12. Taha, M.F.; Mao, H.; Wang, Y.; ElManawy, A.I.; Elmasry, G.; Wu, L.; Menon, M.S.; Niu, Z.; Huang, T.; Qiu, Z. High-throughput analysis of leaf chlorophyll content in aquaponically grown lettuce using hyperspectral reflectance and RGB images. Plants 2024, 13, 392. [Google Scholar] [CrossRef] [PubMed]
  13. Maoto, M.M.; Beswa, D.; Jideani, A.I. Watermelon as a potential fruit snack. Int. J. Food Prop. 2019, 22, 355–370. [Google Scholar] [CrossRef]
  14. FAO Statistics. 2023. Available online: https://www.fao.org/statistics/en (accessed on 23 June 2025).
  15. Yan, Y.; Wang, S.; Wei, M.; Gong, B.; Shi, Q. Effect of different rootstocks on the salt stress tolerance in watermelon seedlings. Hortic. Plant J. 2018, 4, 239–249. [Google Scholar] [CrossRef]
  16. do Ó, L.M.G.; Cova, A.M.W.; de Azevedo Neto, A.D.; da Silva, N.D.; Silva, P.C.C.; Santos, A.L.; Gheyi, H.R.; da Silva, L.L. Osmotic adjustment, production, and post-harvest quality of mini watermelon genotypes differing in salt tolerance. Sci. Hortic. 2022, 306, 111463. [Google Scholar] [CrossRef]
  17. da Silva, S.S.; de Lima, G.S.; de Lima, V.L.A.; Gheyi, H.R.; dos Anjos Soares, L.A.; Moreira, R.C.L.; Fernandes, P.D.; Andrade, E.M.G.A.; Pinheiro, F.W.A. Salinity management strategies and potassium fertilization in watermelon (‘Citrullus lanatus’) cultivation. Aust. J. Crop Sci. 2020, 14, 1601–1607. [Google Scholar] [CrossRef]
  18. Bantis, F.; Koukounaras, A. Ascophyllum nodosum and silicon-based biostimulants differentially affect the physiology and growth of watermelon transplants under abiotic stress factors: The case of salinity. Plants 2023, 12, 433. [Google Scholar] [CrossRef]
  19. da Silva, S.S.; de Lima, G.S.; de Lima, V.L.A.; Gheyi, H.R.; dos Anjos Soares, L.A.; Oliveira, J.P.M.; Araujo, C.A.; Gomes, J.A. Production and quality of watermelon fruits under salinity mangement strategies and nitrogen fertilization. Semin. Cienc. Agrar. 2020, 41, 2923–2936. [Google Scholar] [CrossRef]
  20. Lucena, R.R.M.; Negreiros, M.Z.; Medeiros, J.F.; Grangeiro, L.C.; Marrocos, S.T.P. Crescimento e acúmulo de macronutrientes em melancia ‘Quetzale’ cultivada sob diferentes níveis de salinidade da água de irrigação. Rev. Caatinga 2011, 24, 34–42. [Google Scholar]
  21. Martins, D.C.; da Saúde de Sousa Ribeiro, M.; de Souza Neta, M.L.; da Silva, R.T.; Gomes, L.P.; Guedes, R.A.A.; de Assis de Oliveira, F. Desenvolvimento inicial de cultivares de melancia sob estresse salino. Agropecu. Cient. No SemiÁrido 2013, 8, 62–68. [Google Scholar]
  22. Ferre, F.C.; Rodríguez, E.J.F. El cultivo de sandía apirena injertada, bajo invernadero, en el litoral mediterráneo español; Caja Rural de Almería: Almeria, Spain, 2000; 315p. [Google Scholar]
  23. Hoagland, D.R.; Arnon, D.I. The Water-Culture Method for Growing Plants Without Soil; Circular 347; Agricultural Experiment Station: Berkeley, CA, USA, 1938; pp. 1–35. [Google Scholar]
  24. Vaesen, K.; Gilliams, S.; Nackaerts, K.; Coppin, P. Ground-measured spectral signatures as indicators of ground cover and leaf area index: The case of paddy rice. Field Crops Res. 2001, 69, 13–25. [Google Scholar] [CrossRef]
  25. García-Caparrós, P.; Llanderal, A.; Pestana, M.; Correia, P.J.; Lao, M.T. Tolerance mechanisms of three potted ornamental plants grown under moderate salinity. Sci. Hortic. 2016, 201, 84–91. [Google Scholar] [CrossRef]
  26. Zhao, K.; Ye, Y.; Ma, J.; Huang, L.; Zhuang, H. Detection and dynamic variation characteristics of rice nitrogen status after anthesis based on the RGB color index. Agronomy 2021, 11, 1739. [Google Scholar] [CrossRef]
  27. Cadahía, C. El análisis de la savia como índice de fertilización; Manuales de la Ciencia Actual; CSIC: Madrid, Spain, 1973.
  28. Garcia-Caparros, P.; Lao, M.T. The effects of salt stress on ornamental plants and integrative cultivation practices. Sci. Hortic. 2018, 240, 430–439. [Google Scholar] [CrossRef]
  29. Colla, G.; Roupahel, Y.; Cardarelli, M.; Rea, E. Effect of salinity on yield, fruit quality, leaf gas exchange, and mineral composition of grafted watermelon plants. HortScience 2006, 41, 622–627. [Google Scholar] [CrossRef]
  30. Silva, E.G.D.; Silva, A.F.D.; Lima, J.D.S.; Silva, M.D.F.C.D.; Maia, J.M. Vegetative development and content of calcium, potassium, and sodium in watermelon under salinity stress on organic substrates. Pesqui. Agropecu. Bras. 2017, 52, 1149–1157. [Google Scholar] [CrossRef]
  31. Valenzuela, F.J.; Reineke, D.; Leventini, D.; Chen, C.C.L.; Barrett-Lennard, E.G.; Colmer, T.D.; Dodd, I.; Shabala, S.; Brown, P.; Bazihizina, N. Plant responses to heterogeneous salinity: Agronomic relevance and research priorities. Ann. Bot. 2022, 129, 499–518. [Google Scholar] [CrossRef]
  32. Joshi, S.; Nath, J.; Singh, A.K.; Pareek, A.; Joshi, R. Ion transporters and their regulatory signal transduction mechanisms for salinity tolerance in plants. Physiol. Plant. 2022, 174, e13702. [Google Scholar] [CrossRef]
  33. Delalieux, S.; Somers, B.; Verstraeten, W.W.; Van Aardt, J.A.N.; Keulemans, W.; Coppin, P. Hyperspectral indices to diagnose leaf biotic stress of apple plants, considering leaf phenology. Int. J. Remote Sens. 2009, 30, 1887–1912. [Google Scholar] [CrossRef]
  34. Seelig, H.D.; Hoehn, A.; Stodieck, L.S.; Klaus, D.M.; Adams, W.W.; Emery, W.J. The assessment of leaf water content using leaf reflectance ratios in the visible, near-, and short-wave-infrared. Int. J. Remote Sens. 2008, 29, 3701–3713. [Google Scholar] [CrossRef]
  35. Junttila, S.; Hölttä, T.; Saarinen, N.; Kankare, V.; Yrttimaa, T.; Hyyppä, J.; Vastaranta, M. Close-range hyperspectral spectroscopy reveals leaf water content dynamics. Remote Sens. Environ. 2022, 277, 113071. [Google Scholar] [CrossRef]
  36. Qiao, L.; Tang, W.; Gao, D.; Zhao, R.; An, L.; Li, M.; Sun, H.; Song, D. UAV-based chlorophyll content estimation by evaluating vegetation index responses under different crop coverages. Comput. Electron. Agric. 2022, 196, 106775. [Google Scholar] [CrossRef]
  37. Pokovai, K.; Mészáros, J.; Balog, K.; Koós, S.; Árvai, M.; Fodor, N. Optical leaf area assessment supports chlorophyll estimation from UAV images. Smart Agric. Technol. 2025, 11, 100894. [Google Scholar] [CrossRef]
  38. Devadas, R.; Lamb, D.W.; Backhouse, D.; Simpfendorfer, S. Sequential application of hyperspectral indices for delineation of stripe rust infection and nitrogen deficiency in wheat. Precis. Agric. 2015, 16, 477–491. [Google Scholar] [CrossRef]
  39. Burns, B.W.; Green, V.S.; Hashem, A.A.; Massey, J.H.; Shew, A.M.; Adviento-Borbe, M.A.A.; Milad, M. Determining nitrogen deficiencies for maize using various remote sensing indices. Precis. Agric. 2022, 23, 791–811. [Google Scholar] [CrossRef]
  40. Qiao, B.; He, X.; Liu, Y.; Zhang, H.; Zhang, L.; Liu, L.; Reineke, A.-J.; Liu, W.; Müller, J. Maize characteristics estimation and classification by spectral data under two soil phosphorus levels. Remote Sens. 2022, 14, 493. [Google Scholar] [CrossRef]
  41. Peng, X.; Chen, D.; Zhou, Z.; Zhang, Z.; Xu, C.; Zha, Q.; Wang, F.; Hu, X. Prediction of the nitrogen, phosphorus and potassium contents in grape leaves at different growth stages based on UAV multispectral remote sensing. Remote Sens. 2022, 14, 2659. [Google Scholar] [CrossRef]
  42. Llanderal, A.; García-Caparrós, P.; Contreras, J.I.; Segura, M.L.; Lao, M.T. Evaluation of the nutrients variability in sap of different petiole samples in tomato plant. Commun. Soil Sci. Plant Anal. 2018, 49, 745–750. [Google Scholar] [CrossRef]
  43. Llanderal, A.; García-Caparrós, P.; Segura, M.L.; Contreras, J.I.; Lao, M.T. Nutritional changes in petiole sap over space and time in a tomato crop greenhouse. J. Plant Nutr. 2019, 42, 1205–1217. [Google Scholar] [CrossRef]
  44. Llanderal, A.; García-Caparrós, P.; Pérez-Alonso, J.; Contreras, J.I.; Segura, M.L.; Reca, J.; Lao, M.T. Approach to petiole sap nutritional diagnosis method by empirical model based on climatic and growth parameters. Agronomy 2020, 10, 188. [Google Scholar] [CrossRef]
  45. Hochmuth, G.; Maynard, D.; Vavrina, C.; Hanlon, E.; Simonne, E. Plant tissue analysis and interpretation for vegetable crops in Florida. In Nutrient Management of Vegetable and Row Crops Handbook; University of Florida Press: Gainesville, FL, USA, 2012; pp. 45–92. [Google Scholar]
  46. Santos, M.G.; Moreira, G.S.; Pereira, R.; Carvalho, S.M. Assessing the potential use of drainage from open soilless production systems: A case study from an agronomic and ecotoxicological perspective. Agric. Water Manag. 2022, 273, 107906. [Google Scholar] [CrossRef]
  47. Jasik, M.; Kormanek, M.; Staszel-Szlachta, K.; Małek, S. Leachate tables as a tool for monitoring changes in physical and chemical parameters of the peat substrate in the cells of nursery containers. Forests 2023, 14, 2398. [Google Scholar] [CrossRef]
  48. García-Caparrós, P.; Llanderal, A.; Rodríguez, J.C.; Maksimovic, I.; Urrestarazu, M.; Lao, M.T. Rosemary growth and nutrient balance: Leachate fertigation with leachates versus conventional fertigation. Sci. Hortic. 2018, 242, 62–68. [Google Scholar] [CrossRef]
  49. Ehtaiwesh, A.F. The effect of salinity on nutrient availability and uptake in crop plants. Sci. J. Appl. Sci. Sabratha Univ. 2022, 9, 55–73. [Google Scholar]
  50. Balasubramaniam, T.; Shen, G.; Esmaeili, N.; Zhang, H. Plants response mechanisms to salinity stress. Plants 2023, 12, 2253. [Google Scholar] [CrossRef]
Figure 1. Effect of the increasing salinity levels in the nutrient solution on the volume leached and water uptake per plant and chemical parameters of leachate (EC in dS m−1, pH, and nutrient concentration expressed in mg L−1). Data represent the mean ± SD (n = 5). WAT: weeks after transplanting. Different letters indicate significant differences according to the LSD test at p < 0.05. ns indicates non-significant.
Agronomy 15 01620 g001
Figure 2. Layout of watermelon seedling changes under increasing saline concentrations in the nutrient solution.
Agronomy 15 01620 g002
Table 1. Microclimatic conditions inside the bamboo nethouse during the experimental period (October–November 2024).
Temperature (°C)Relative Humidity (%)
Average25.5871.19
Minimum19.8048.80
Maximum35.4089.40
Table 2. Effects of increasing salinity levels in the nutrient solution on the biomass parameters. Leaf number (LN), leaf area index (LAI), leaf fresh weight (LFW), stem fresh weight (SFW), root fresh weight (RFW), total fresh weight (TFW), leaf dry weight (LDW), stem dry weight (SDW), root dry weight (RDW), total dry weight (TDW), leaf water content (LWC), leaf weight ratio (LWR), stem weight ratio (SWR), and root weight ratio (RWR).
LN (n°)LAI (cm2)LFW (g)SFW (g)RFW (g)TFW (g) LDW (g)SDW (g)RDW (g)TDW (g)LWC (g/g)LWR (-)SWR (-)RWR (-)
T153.25 ± 5.06 a5348.33 ± 566.96 a121.6 ± 9.50 a97.50 ± 6.66 a18.50 ± 3.87 a236.40 ± 19.32 a11.64 ± 1.09 a8.96 ± 2.22 a5.31 ± 0.58 a25.91 ± 2.68 a0.90 ± 0.03 a0.45 ± 0.06 a0.36 ± 0.05 a0.19 ± 0.03 a
T251.20 ± 4.49 a3831.06 ± 239.05 b70.60 ± 4.87 b83.13 ± 2.77 b10.38 ± 1.14 b164.25 ± 13.31 b6.23 ± 0.59 b7.49 ± 0.95 a2.70 ± 0.34 b16.42 ± 1.22 b0.92 ± 0.04 a0.38 ± 0.07 a0.46 ± 0.04 a0.16 ± 0.02 a
T330.80 ± 3.03 b1950.31 ± 190.82 c47.33 ± 1.53 c42.60 ± 5.39 c8.67 ± 1.43 c98.59 ± 4.66 c4.27 ± 0.31 c4.09 ± 0.35 b1.17 ± 0.20 c9.53 ± 0.56 c0.91 ± 0.03 a0.45 ± 0.07 a0.43 ± 0.04 a0.12 ± 0.02 b
T425.75 ± 2.55 b1469.91 ± 214.38 d41.40 ± 2.63 c33.75 ± 1.15 d6.88 ± 1.63 d82.03 ± 4.09 d3.59 ± 0.15 c3.59 ± 0.62 b1.00 ± 0.24 c7.4 ± 0.87 d0.91 ± 0.04 a0.50 ± 0.08 a0.38 ± 0.04 a0.12 ± 0.02 b
Different letters indicate significant differences according to the LSD test at p < 0.05.
Table 3. Effects of the increasing salinity levels in the nutrient solution on the spectral vegetation indices (-: dimensionless). R = red, G = green, B = blue, normalized red index (NRI) = R/(R + G + B), normalized green index (NGI) = G/(R + G + B), and normalized blue index (NBI) = B/(R + G + B).
Red (-)Green (-)Blue (-)NRI (-) NGI (-)NBI (-)
T133.72 ± 1.78 a55.20 ± 0.84 a13.00 ± 0.75 d0.34 ± 0.01 a0.53 ± 0.01 a0.13 ± 0.01 d
T235.25 ±1.01 a55.48 ± 0.83 a15.24 ± 0.65 c0.33 ± 0.01 a0.52 ± 0.01 b0.14 ± 0.01 c
T336.83 ± 2.70 a56.24 ± 1.99 a17.64 ± 0.39 b0.33 ± 0.01 a0.50 ± 0.01 b0.16 ± 0.01 b
T432.45 ± 0.64 a50.19 ± 1.93 b19.34 ± 0.34 a0.31 ± 0.01 b0.49 ± 0.01 c0.19 ± 0.01 a
Different letters indicate significant differences according to the LSD test at p < 0.05.
Table 4. Effects of the increasing salinity levels in the nutrient solution on the sap parameters: pH, nutrient concentrations, and nutrient ratios.
pHN-NO3 (ppm)P (ppm) Cl (ppm)K+ (ppm)Ca2+ (ppm) Na+ (ppm) Cl/NCl/PK/NaCa/Na
T16.32 ± 0.11 a1300.61 ± 79.19 a359.90 ± 42.12 a743.35 ± 182.98 d4730.11 ± 183.67 a221.05 ± 43.28 c160.00 ± 15.59 d0.56 ± 0.05 d2.06 ± 0.40 d30.43 ± 3.98 a1.23 ± 0.16 a
T26.18 ± 0.08 a858.02 ± 45.16 b255.42 ± 32.38 b2040.00 ± 219.70 c4107.50 ± 145.77 b417.50 ± 15.00 b320.00 ± 18.61 c2.41 ± 0.35 c7.65 ± 0.77 c12.77 ± 0.69 b1.31 ± 0.13 a
T36.22 ± 0.04 a711.27 ± 42.24 c132.66 ± 25.82 c5387.50 ± 687.23 b3700.29 ± 105.77 c438.40 ± 33.16 b465.35 ± 36.93 b7.48 ± 0.78 b40.21 ± 12.71 b 7.99 ± 0.67 c0.96 ± 0.08 b
T46.49 ± 0.12 a592.73 ± 38.56 d59.40 ± 15.02 d7162.50 ± 381.61 a3550.22 ± 100.00 d695.00 ± 67.58 a788.12 ± 126.77 a12.50 ± 0.84 a126.05 ± 26.05 a4.85 ± 0.45 d0.95 ± 0.08 b
Different letters indicate significant differences according to the LSD test at p < 0.05.
Disclaimer/Publisher’s Note: The statements, opinions and data contained in all publications are solely those of the individual author(s) and contributor(s) and not of MDPI and/or the editor(s). MDPI and/or the editor(s) disclaim responsibility for any injury to people or property resulting from any ideas, methods, instructions or products referred to in the content.

