
Agronomic Experiments and Analysis of Garlic Mechanization-Friendly Cultivation Patterns in China


Abstract
1. Introduction
2. Materials and Methods
2.1. Experimental Sites and Data Sources
2.2. Experimental Materials and Methods
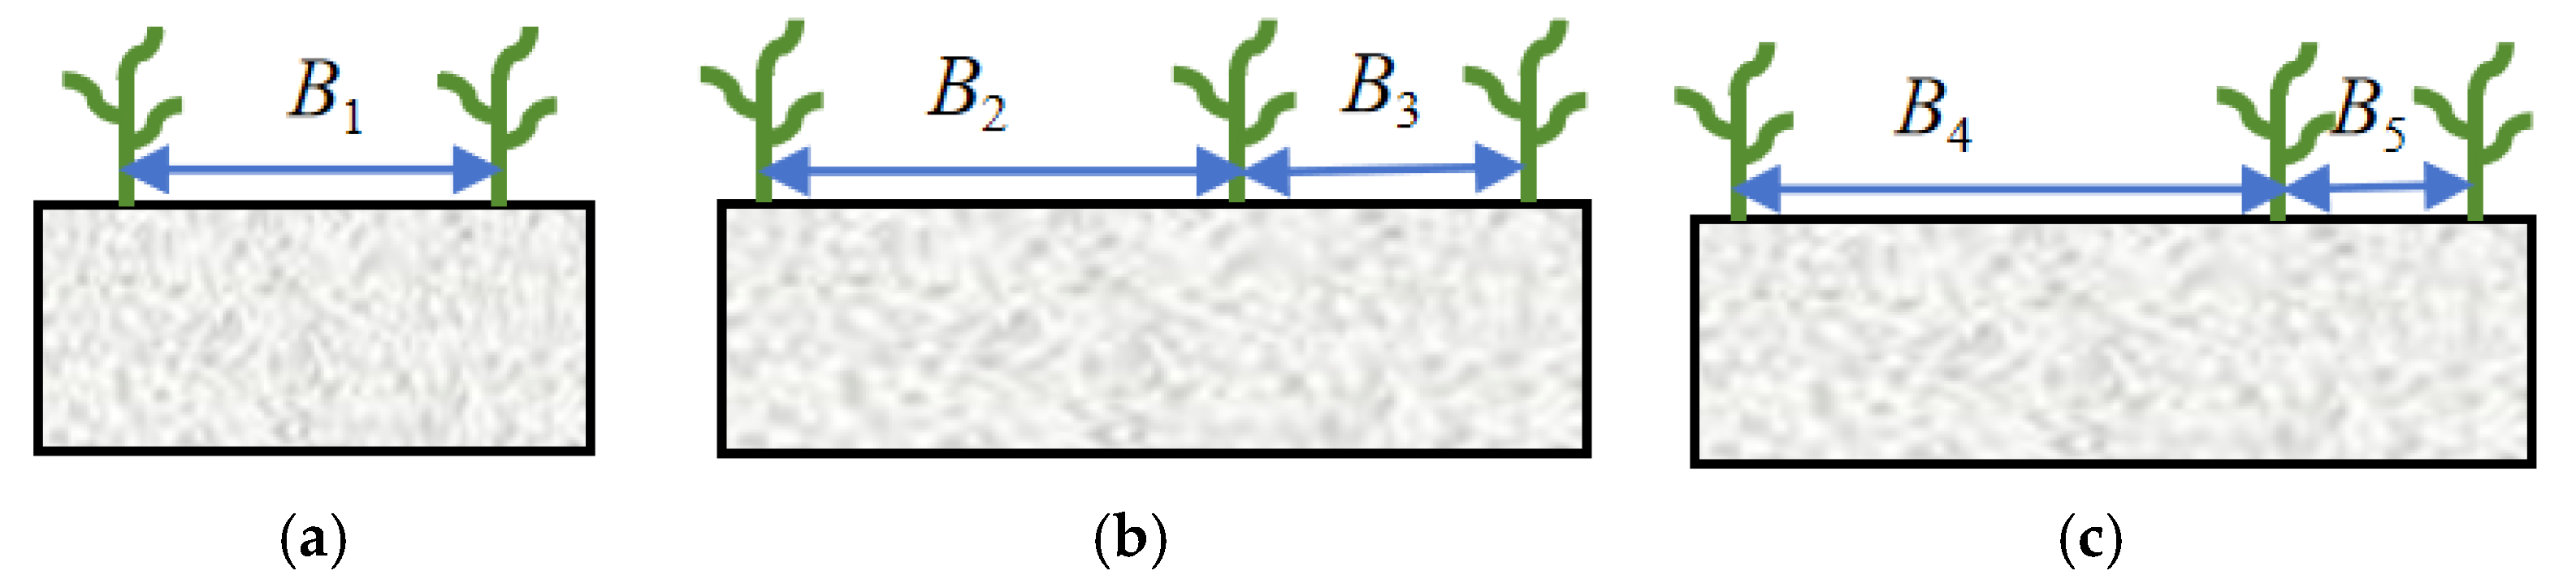
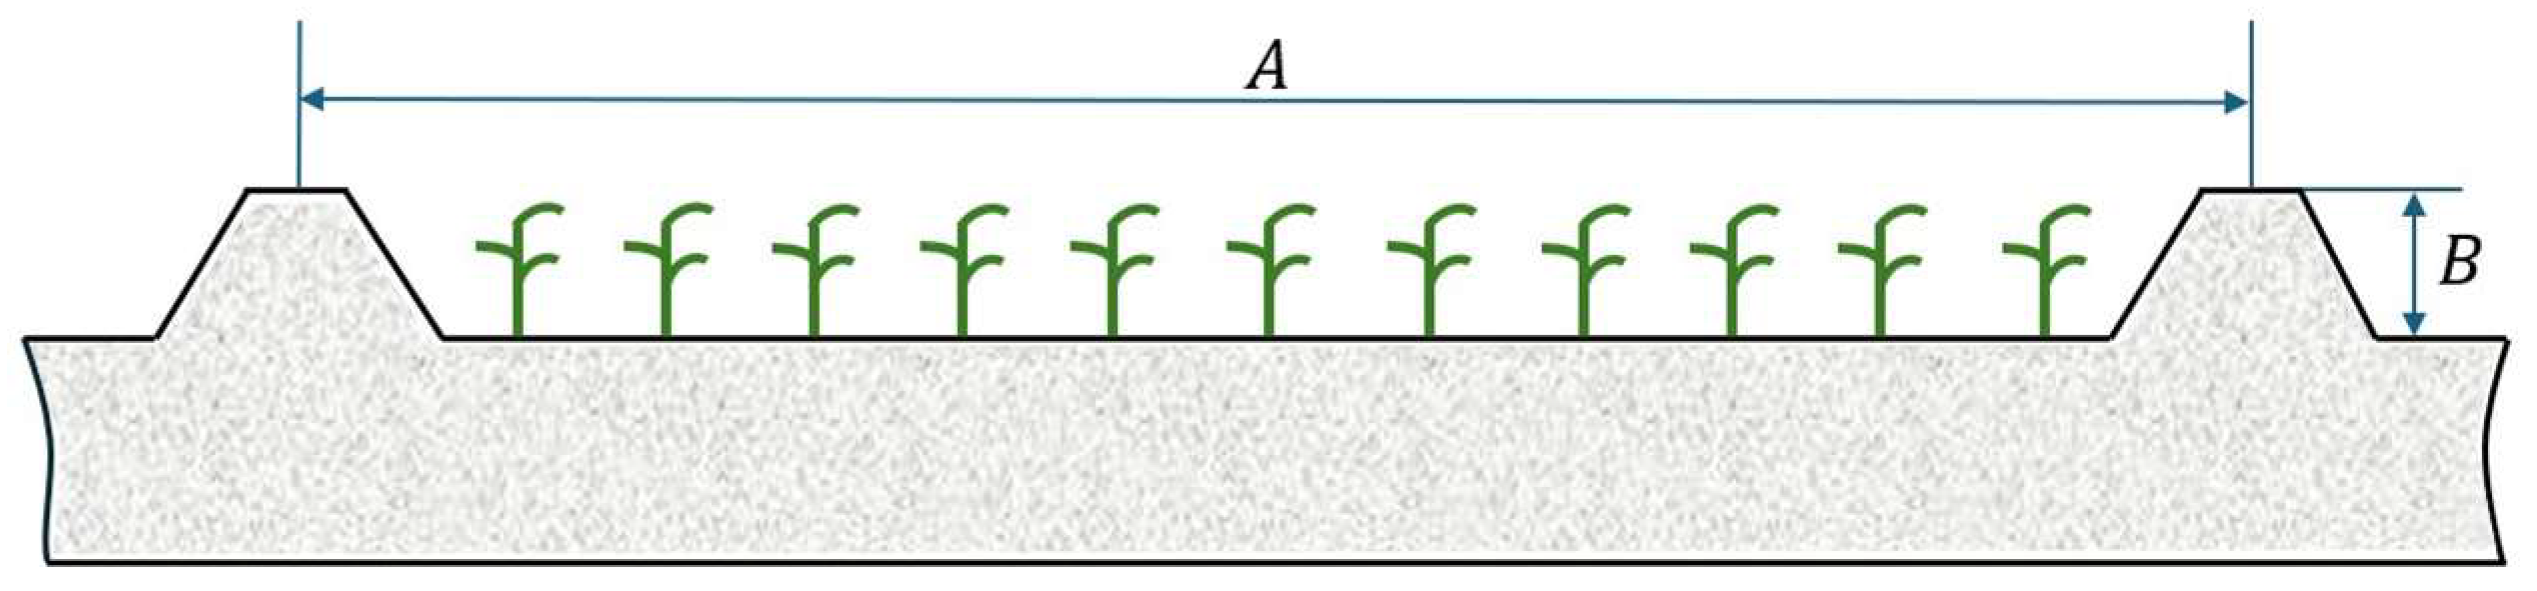
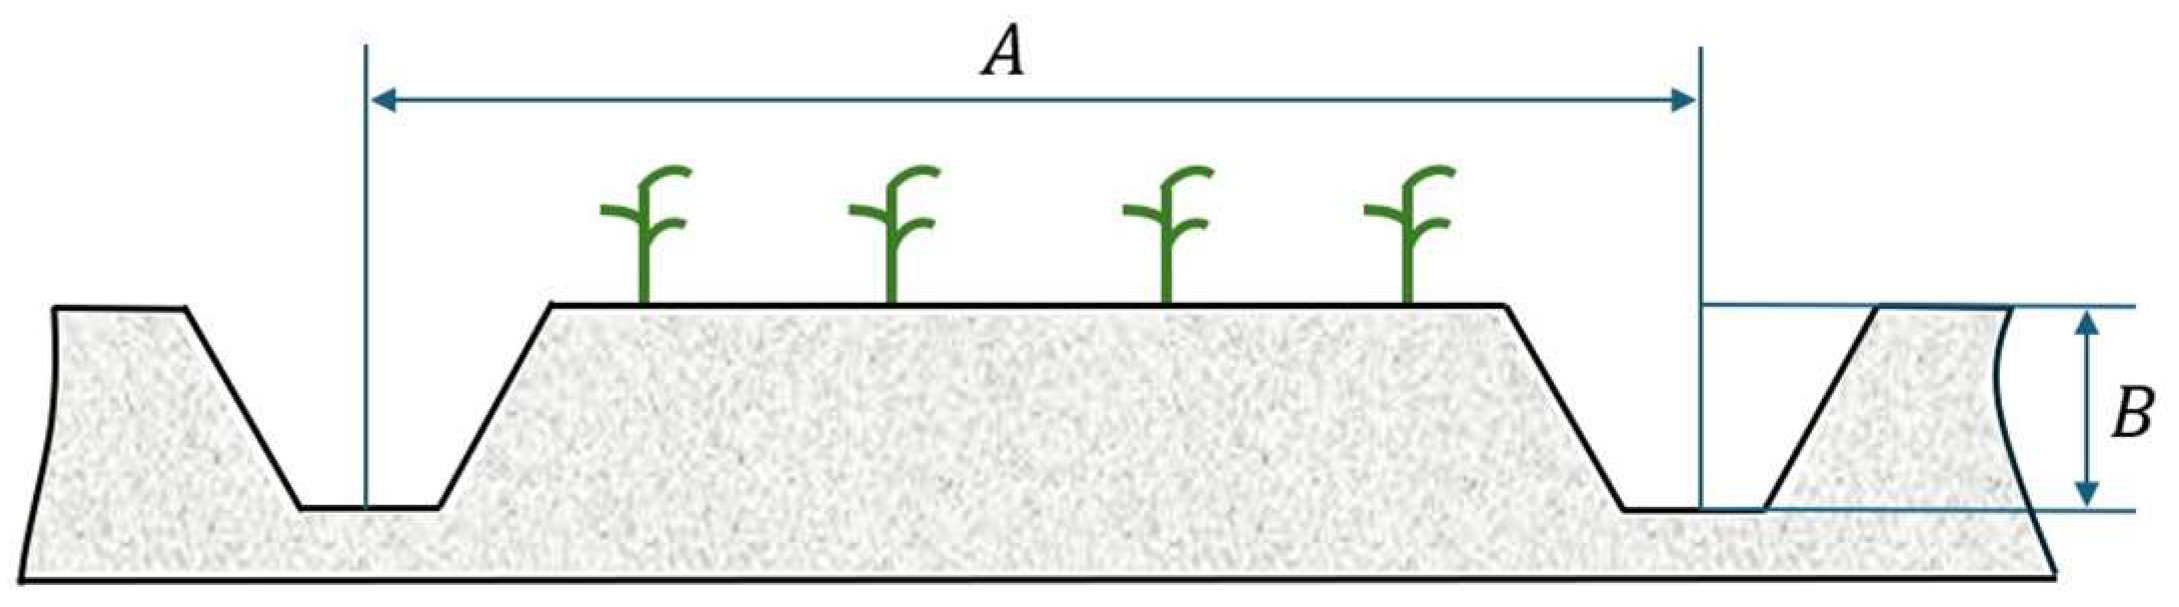
2.3. Cultivation Mode
2.4. Experimental Indicators
2.5. Statistical Product and Service Solutions (SPSS)
3. Results and Discussion
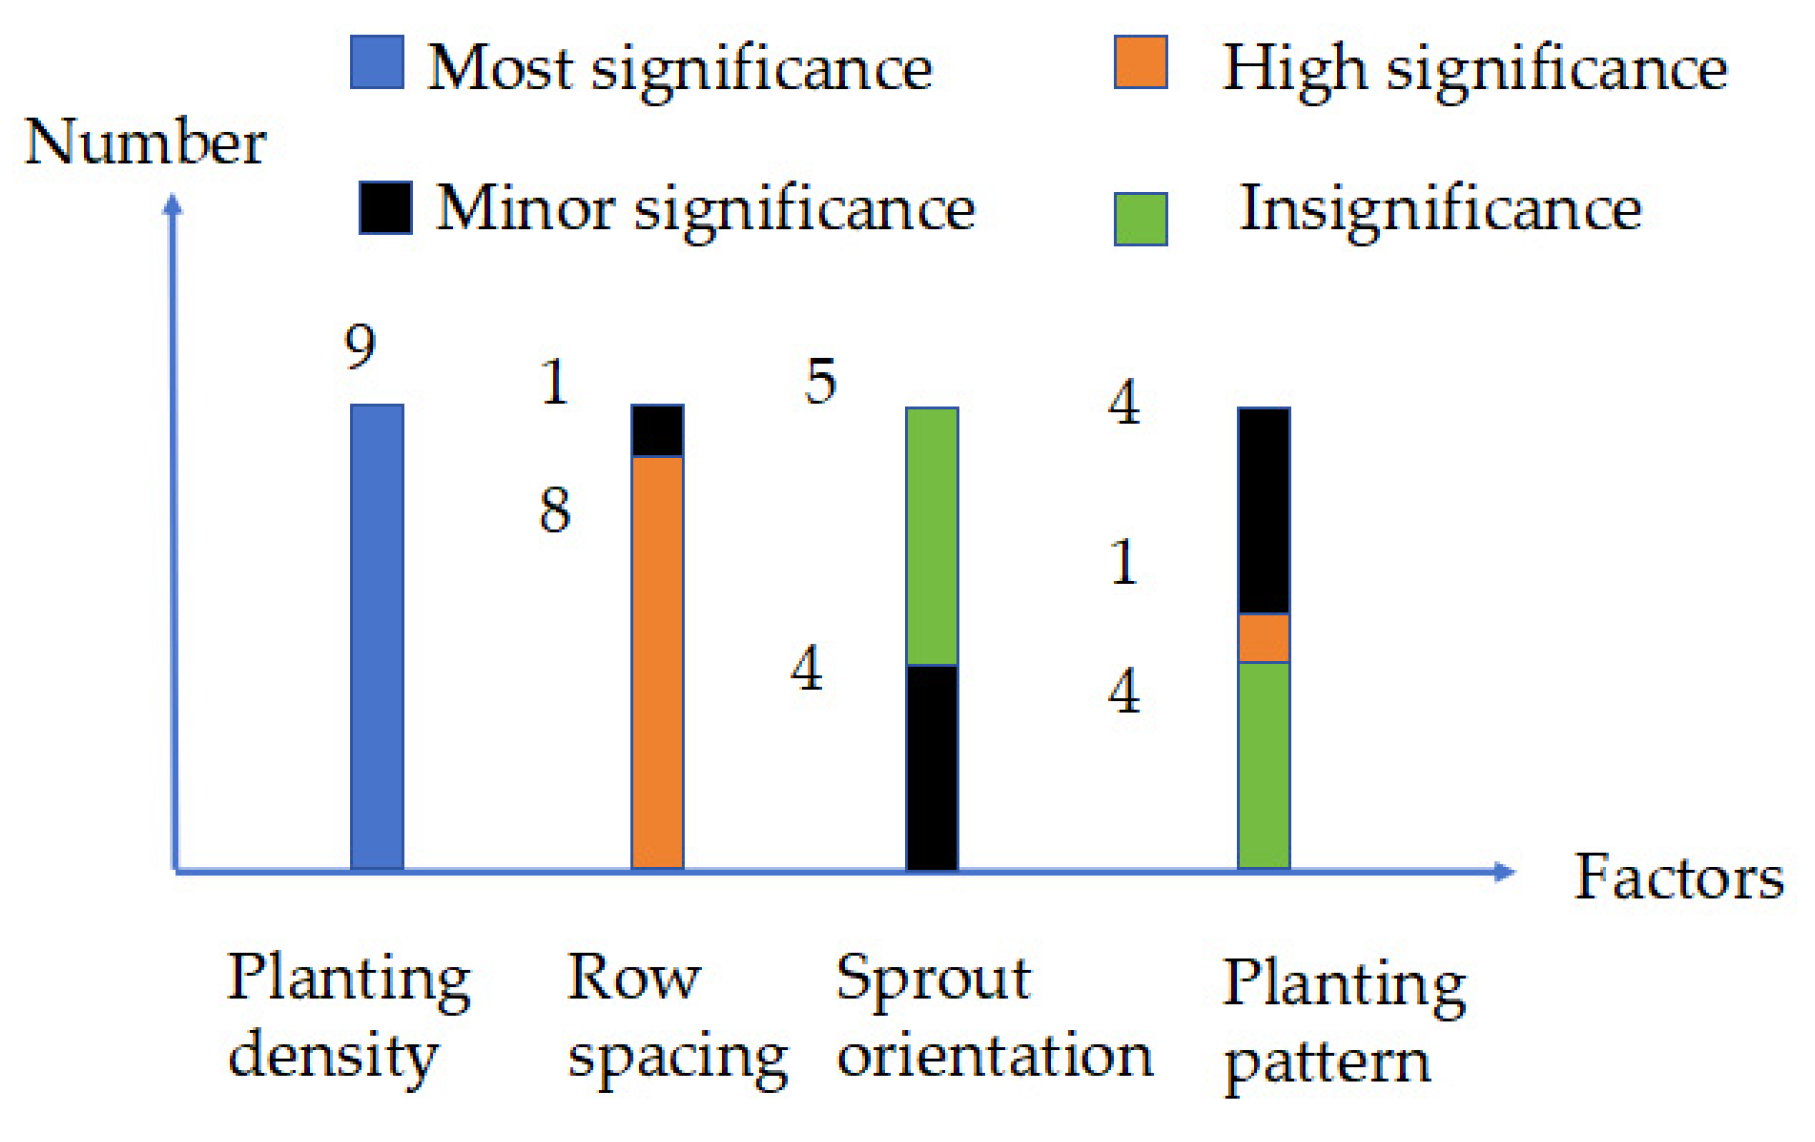
3.1. Analysis Results of the Importance of Four Factors
3.2. Jinxiang County Experimental Results and Discussion
3.3. Jinan City Experimental Results and Analysis
3.4. Pizhou Experimental Results and Analysis
4. Conclusions
Author Contributions
Funding
Institutional Review Board Statement
Informed Consent Statement
Data Availability Statement
Acknowledgments
Conflicts of Interest
Appendix A. Dataset

| Serial No. | Sprout Orientation | Planting Pattern | Planting Density/10,000 Plants per Hectare | Row Spacing/cm | Garlic Bulb Yield per Hectare/kg | ||
|---|---|---|---|---|---|---|---|
|
District 1 |
District 2 |
District 3 | |||||
| 1 | 0–45° | Ridge cropping | 36.75 | 18 | 23,699 | 22,918 | 24,146 |
| 2 | 0–45° | Small ridge | 39.75 | 22 + 14 | 23,396 | 23,799 | 23,499 |
| 3 | 0–45° | Large ridge | 42.75 | 26 + 10 | 24,329 | 24,921 | 24,808 |
| 4 | 45–90° | Ridge cropping | 39.75 | 26 + 10 | 23,067 | 23,826 | 23,166 |
| 5 | 45–90° | Small ridge | 42.75 | 18 | 23,820 | 24,864 | 24,247 |
| 6 | 45–90° | Large ridge | 36.75 | 22 + 14 | 22,934 | 22,944 | 23,130 |
| 7 | 90° | Ridge cropping | 42.75 | 22 + 14 | 23,714 | 24,140 | 23,769 |
| 8 | 90° | Small ridge | 36.75 | 26 + 10 | 23,044 | 23,596 | 22,593 |
| 9 | 90° | Large ridge | 39.75 | 18 | 24,328 | 24,438 | 23,600 |
| 215,515 | 212,445 | 209,004 | 216,060 | ||||
| 211,998 | 212,858 | 213,119 | 211,325 | ||||
| 213,222 | 215,432 | 218,612 | 213,350 | ||||
| 23,946.11 | 2,3605 | 23,222.67 | 24,006.67 | ||||
| 23,555.33 | 23,650.89 | 23,679.89 | 23,480.56 | ||||
| 23,691.33 | 23,936.89 | 24,290.22 | 23,705.56 | ||||
| 390.7778 | 331.8889 | 1067.556 | 526.1111 | ||||
| Serial No. | Sprout Orientation | Planting Pattern | Planting Density/ 10,000 Plants per Hectare | Row Spacing/cm | Garlic Bulb Yield per Hectare/kg | ||
|---|---|---|---|---|---|---|---|
|
District 1 |
District 2 |
District 3 | |||||
| 1 | 0–45° | Ridge cropping | 36.75 | 18 | 23,354 | 23,660 | 24,217 |
| 2 | 0–45° | Small ridge | 39.75 | 22 + 14 | 23,997 | 24,070 | 24,675 |
| 3 | 0–45° | Large ridge | 42.75 | 26 + 10 | 25,465 | 25,485 | 25,278 |
| 4 | 45–90° | Ridge cropping | 39.75 | 26 + 10 | 23,949 | 23,316 | 24,147 |
| 5 | 45–90° | Small ridge | 42.75 | 18 | 25,304 | 25,301 | 25,304 |
| 6 | 45–90° | Large ridge | 36.75 | 22 + 14 | 23,263 | 23,139 | 23,536 |
| 7 | 90° | Ridge cropping | 42.75 | 22 + 14 | 24,370 | 24,389 | 24,998 |
| 8 | 90° | Small ridge | 36.75 | 26 + 10 | 24,163 | 24,263 | 24,619 |
| 9 | 90° | Large ridge | 39.75 | 18 | 24,839 | 24,788 | 25,025 |
| 220,201 | 216,400 | 214,214 | 221,792 | ||||
| 217,259 | 221,696 | 218,806 | 216,437 | ||||
| 221,454 | 220,818 | 225,894 | 220,685 | ||||
| 24,466.78 | 24,044.44 | 23,801.56 | 24,643.56 | ||||
| 24,139.89 | 24,632.89 | 24,311.78 | 24,048.56 | ||||
| 24,606 | 24,535.33 | 25,099.33 | 24,520.56 | ||||
| 466.1111 | 588.4444 | 1297.778 | 595 | ||||
| Serial No. | Sprout Orientation | Planting Pattern | Planting Density/10,000 Plants per Hectare | Row Spacing/cm | Garlic Bulb Yield per Hectare/kg | ||
|---|---|---|---|---|---|---|---|
|
District 1 |
District 2 |
District 3 | |||||
| 1 | 0–45° | Ridge cropping | 36.75 | 18 | 23,652 | 23,962 | 23,353 |
| 2 | 0–45° | Small ridge | 39.75 | 22 + 14 | 23,696 | 24,547 | 24,097 |
| 3 | 0–45° | Large ridge | 42.75 | 26 + 10 | 24,998 | 25,151 | 25,151 |
| 4 | 45–90° | Ridge cropping | 39.75 | 26 + 10 | 23,605 | 23,950 | 24,322 |
| 5 | 45–90° | Small ridge | 42.75 | 18 | 24,559 | 25,101 | 25,020 |
| 6 | 45–90° | Large ridge | 36.75 | 22 + 14 | 23,152 | 23,288 | 23,116 |
| 7 | 90° | Ridge cropping | 42.75 | 22 + 14 | 24,288 | 24,874 | 24,795 |
| 8 | 90° | Small ridge | 36.75 | 26 + 10 | 23,227 | 24,520 | 24,092 |
| 9 | 90° | Large ridge | 39.75 | 18 | 24,156 | 24,899 | 24,897 |
| 218,607 | 216,801 | 212,362 | 219,599 | ||||
| 216,113 | 218,859 | 218,169 | 215,853 | ||||
| 219,748 | 218,808 | 223,937 | 219,016 | ||||
| 24,289.67 | 24,089 | 23,595.78 | 24,399.89 | ||||
| 24,012.56 | 24,317.67 | 24,241 | 23,983.67 | ||||
| 24,416.44 | 24,312 | 24,881.89 | 24,335.11 | ||||
| 403.8889 | 228.6667 | 1286.111 | 416.2222 | ||||
| Serial No. | Sprout Orientation | Planting Pattern | Planting Density/10,000 Plants per Hectare | Row Spacing/cm | Garlic Bulb Yield per Hectare/kg | ||
|---|---|---|---|---|---|---|---|
|
District 1 |
District 2 |
District 3 | |||||
| 1 | 0–45° | Ridge cropping | 36.75 | 18 | 20,957 | 20,673 | 21,080 |
| 2 | 0–45° | Small ridge | 39.75 | 22 + 14 | 20,958 | 21,596 | 21,419 |
| 3 | 0–45° | Large ridge | 42.75 | 26 + 10 | 22,589 | 22,427 | 22,314 |
| 4 | 45–90° | Ridge cropping | 39.75 | 26 + 10 | 21,201 | 21,007 | 21,244 |
| 5 | 45–90° | Small ridge | 42.75 | 18 | 22,146 | 22,288 | 22,586 |
| 6 | 45–90° | Large ridge | 36.75 | 22 + 14 | 20,939 | 20,548 | 20,933 |
| 7 | 90° | Ridge cropping | 42.75 | 22 + 14 | 21,235 | 21,771 | 22,110 |
| 8 | 90° | Small ridge | 36.75 | 26 + 10 | 20,756 | 21,391 | 21,502 |
| 9 | 90° | Large ridge | 39.75 | 18 | 21,540 | 21,877 | 21,857 |
| 194,013 | 191,278 | 188,779 | 195,004 | ||||
| 192,892 | 194,642 | 192,699 | 191,509 | ||||
| 194,039 | 195,024 | 199,466 | 194,431 | ||||
| 21,557 | 21,253.11 | 20,975.44 | 21,667.11 | ||||
| 21,432.44 | 21,626.89 | 21,411 | 21,278.78 | ||||
| 21,559.89 | 21,669.33 | 22,162.89 | 21,603.44 | ||||
| 127.4444 | 416.2222 | 1187.444 | 388.3333 | ||||
| Serial No. | Sprout Orientation | Planting Pattern | Planting Density/10,000 Plants per Hectare | Row Spacing/cm | Garlic Bulb Yield per Hectare/kg | ||
|---|---|---|---|---|---|---|---|
|
District 1 |
District 2 |
District 3 | |||||
| 1 | 0–45° | Ridge cropping | 36.75 | 18 | 21,570 | 20,737 | 21,377 |
| 2 | 0–45° | Small ridge | 39.75 | 22 + 14 | 21,306 | 21,195 | 21,329 |
| 3 | 0–45° | Large ridge | 42.75 | 26 + 10 | 22,267 | 22,567 | 22,773 |
| 4 | 45–90° | Ridge cropping | 39.75 | 26 + 10 | 21,376 | 21,202 | 21,137 |
| 5 | 45–90° | Small ridge | 42.75 | 18 | 22,215 | 21,717 | 22,012 |
| 6 | 45–90° | Large ridge | 36.75 | 22 + 14 | 20,966 | 20,194 | 20,861 |
| 7 | 90° | Ridge cropping | 42.75 | 22 + 14 | 21,953 | 21,728 | 21,570 |
| 8 | 90° | Small ridge | 36.75 | 26 + 10 | 21,389 | 21,148 | 21,216 |
| 9 | 90° | Large ridge | 39.75 | 18 | 22,016 | 21,949 | 21,880 |
| 195,121 | 192,650 | 189,458 | 195,473 | ||||
| 191,680 | 193,527 | 193,390 | 191,102 | ||||
| 194,849 | 195,473 | 198,802 | 195,075 | ||||
| 21,680.11 | 21,405.56 | 21,050.89 | 21,719.22 | ||||
| 21,297.78 | 21,503 | 21,487.78 | 21,233.56 | ||||
| 21,649.89 | 21,719.22 | 22,089.11 | 21,675 | ||||
| 382.3333 | 313.6667 | 1038.222 | 485.6667 | ||||
| Serial No. | Sprout Orientation | Planting Pattern | Planting Density/10,000 Plants per Hectare | Row Spacing/cm | Garlic Bulb Yield per Hectare/kg | ||
|---|---|---|---|---|---|---|---|
|
District 1 |
District 2 |
District 3 | |||||
| 1 | 0–45° | Ridge cropping | 36.75 | 18 | 20,708 | 21,334 | 20,686 |
| 2 | 0–45° | Small ridge | 39.75 | 22 + 14 | 21,352 | 20,914 | 21,527 |
| 3 | 0–45° | Large ridge | 42.75 | 26 + 10 | 22,468 | 22,313 | 22,403 |
| 4 | 45–90° | Ridge cropping | 39.75 | 26 + 10 | 21,049 | 21,111 | 20,963 |
| 5 | 45–90° | Small ridge | 42.75 | 18 | 22,119 | 22,125 | 22,033 |
| 6 | 45–90° | Large ridge | 36.75 | 22 + 14 | 20,187 | 21,248 | 20,067 |
| 7 | 90° | Ridge cropping | 42.75 | 22 + 14 | 21,744 | 21,459 | 21,215 |
| 8 | 90° | Small ridge | 36.75 | 26 + 10 | 21,256 | 20,735 | 21,342 |
| 9 | 90° | Large ridge | 39.75 | 18 | 22,012 | 21,539 | 21,966 |
| 193,705 | 19,0269 | 187,563 | 194,522 | ||||
| 190,902 | 193,403 | 192,433 | 189,713 | ||||
| 193,268 | 194,203 | 197,879 | 193,640 | ||||
| 21,522.78 | 21,141 | 20,840.33 | 21,613.56 | ||||
| 21,211.33 | 21,489.22 | 21,381.44 | 21,079.22 | ||||
| 21,474.22 | 21,578.11 | 21,986.56 | 21,515.56 | ||||
| 311.4444 | 437.1111 | 1146.222 | 534.3333 | ||||
| Serial No. | Sprout Orientation | Planting Pattern | Planting Density/10,000 Plants per Hectare | Row Spacing/cm | Garlic Bulb Yield per Hectare/kg | ||
|---|---|---|---|---|---|---|---|
|
District 1 |
District 2 |
District 3 | |||||
| 1 | 0–45° | Ridge cropping | 36.75 | 18 | 22,320 | 22,423 | 22,594 |
| 2 | 0–45° | Small ridge | 39.75 | 22 + 14 | 22,708 | 22,360 | 22,901 |
| 3 | 0–45° | Large ridge | 42.75 | 26 + 10 | 23,928 | 23,977 | 23,735 |
| 4 | 45–90° | Ridge cropping | 39.75 | 26 + 10 | 22,481 | 22,923 | 22,807 |
| 5 | 45–90° | Small ridge | 42.75 | 18 | 23,433 | 23,459 | 23,924 |
| 6 | 45–90° | Large ridge | 36.75 | 22 + 14 | 21,984 | 22,286 | 22,370 |
| 7 | 90° | Ridge cropping | 42.75 | 22 + 14 | 23,492 | 23,182 | 23,063 |
| 8 | 90° | Small ridge | 36.75 | 26 + 10 | 22,726 | 22,425 | 23,130 |
| 9 | 90° | Large ridge | 39.75 | 18 | 23,463 | 23,344 | 23,513 |
| 206,946 | 205,285 | 202,258 | 208,473 | ||||
| 205,667 | 207,066 | 206,500 | 204,346 | ||||
| 208,338 | 208,600 | 212,193 | 208,132 | ||||
| 22,994 | 22,809.44 | 22,473.11 | 23,163.67 | ||||
| 22,851.89 | 23,007.33 | 22,944.44 | 22,705.11 | ||||
| 23,148.67 | 23,177.78 | 23,577 | 23,125.78 | ||||
| 296.7778 | 368.3333 | 1103.889 | 458.5556 | ||||
| Serial No. | Sprout Orientation | Planting Pattern | Planting Density/10,000 Plants per Hectare | Row Spacing/cm | Garlic Bulb Yield per Hectare/kg | ||
|---|---|---|---|---|---|---|---|
|
District 1 |
District 2 |
District 3 | |||||
| 1 | 0–45° | Ridge cropping | 36.75 | 18 | 22,307 | 22,587 | 22,320 |
| 2 | 0–45° | Small ridge | 39.75 | 22 + 14 | 22,243 | 22,475 | 22,873 |
| 3 | 0–45° | Large ridge | 42.75 | 26 + 10 | 23,975 | 23,903 | 24,074 |
| 4 | 45–90° | Ridge cropping | 39.75 | 26 + 10 | 22,735 | 22,641 | 22,831 |
| 5 | 45–90° | Small ridge | 42.75 | 18 | 23,621 | 23,701 | 23,454 |
| 6 | 45–90° | Large ridge | 36.75 | 22 + 14 | 21,616 | 22,269 | 21,849 |
| 7 | 90° | Ridge cropping | 42.75 | 22 + 14 | 23,150 | 23,106 | 23,322 |
| 8 | 90° | Small ridge | 36.75 | 26 + 10 | 22,187 | 22,237 | 22,936 |
| 9 | 90° | Large ridge | 39.75 | 18 | 22,934 | 22,888 | 23,730 |
| 206,757 | 204,999 | 200,308 | 207,542 | ||||
| 204,717 | 205,727 | 205,350 | 202,903 | ||||
| 206,490 | 207,238 | 212,306 | 207,519 | ||||
| 22,973 | 22,777.67 | 22,256.44 | 23,060.22 | ||||
| 22,746.33 | 22,858.56 | 22,816.67 | 22,544.78 | ||||
| 22,943.33 | 23,026.44 | 23,589.56 | 23,057.67 | ||||
| 226.6667 | 248.7778 | 1333.111 | 515.4444 | ||||
| Serial No. | Sprout Orientation | Planting Pattern | Planting Density/10,000 Plants per Hectare | Row Spacing/cm | Garlic Bulb Yield per Hectare/kg | ||
|---|---|---|---|---|---|---|---|
|
District 1 |
District 2 |
District 3 | |||||
| 1 | 0–45° | Ridge cropping | 36.75 | 18 | 22,349 | 22,022 | 22,405 |
| 2 | 0–45° | Small ridge | 39.75 | 22 + 14 | 22,923 | 22,828 | 22,588 |
| 3 | 0–45° | Large ridge | 42.75 | 26 + 10 | 23,855 | 23,901 | 23,706 |
| 4 | 45–90° | Ridge cropping | 39.75 | 26 + 10 | 22,926 | 22,454 | 22,020 |
| 5 | 45–90° | Small ridge | 42.75 | 18 | 23,631 | 24,048 | 23,386 |
| 6 | 45–90° | Large ridge | 36.75 | 22 + 14 | 22,012 | 22,183 | 22,594 |
| 7 | 90° | Ridge cropping | 42.75 | 22 + 14 | 23,106 | 22,563 | 23,132 |
| 8 | 90° | Small ridge | 36.75 | 26 + 10 | 22,704 | 22,446 | 22,514 |
| 9 | 90° | Large ridge | 39.75 | 18 | 23,247 | 22,932 | 23,435 |
| 206,577 | 20,2977 | 201,229 | 207,455 | ||||
| 205,254 | 207,068 | 205,353 | 203,929 | ||||
| 206,079 | 207,865 | 211,328 | 206,526 | ||||
| 22,953 | 22,553 | 22,358.78 | 23,050.56 | ||||
| 22,806 | 23,007.56 | 22,817 | 22,658.78 | ||||
| 22,897.67 | 23,096.11 | 23,480.89 | 22,947.33 | ||||
| 147 | 543.1111 | 1122.111 | 391.7778 | ||||
References
- Shekhar, S.; Prakash, P.; Singha, P.; Prasad, K.; Singh, S.K. Modeling and optimization of ultrasound-assisted extraction of bioactive compounds from Allium sativum leaves using response surface methodology and artificial neural network coupled with genetic algorithm. Foods 2023, 12, 1925. [Google Scholar] [CrossRef] [PubMed]
- Singh, M.; Mahajan, V.; Benke, A.P.; Mokat, D.N. Garlic: Botany, Chemistry, and Uses. In Handbook of Spices in India: 75 Years of Research and Development; Springer: Berlin/Heidelberg, Germany, 2023; pp. 2543–2589. [Google Scholar]
- Kushwah, A.; Kumar, A.; Kumar, S. Predictive modelling with machine learning of garlic clove for novel designed solar drying system. Sol. Energy 2024, 284, 113070. [Google Scholar] [CrossRef]
- Jiang, X.; Liang, J.; Jiang, S.; Zhao, P.; Tao, F.; Li, J.; Li, X.; Zhao, D. Garlic polysaccharides: A review on their extraction, isolation, structural characteristics, and bioactivities. Carbohydr. Res. 2022, 518, 108599. [Google Scholar] [CrossRef] [PubMed]
- Farm Bee: Analysis Report on China’s Garlic Industry in 2025. 2025. Available online: https://max.book118.com/html/2025/0125/8043127106007025.shtm (accessed on 1 March 2016).
- Yu, Z.; Yang, K.; Hu, Z.; Peng, B.; Gu, F.; Ling, Y.; Yang, M. Parameter optimization and simulation analysis of floating root cutting mechanism for garlic harvester. Comput. Electron. Agric. 2023, 204, 107521. [Google Scholar] [CrossRef]
- Lm, D.; Lee, H.S.; Kim, J.H.; Moon, D.J.; Moon, T.I.; Yu, S.H.; Park, Y.J. Bucket Size Optimization for Metering Device in Garlic Planter Using Discrete Element Method. Agriculture 2023, 13, 1199. [Google Scholar] [CrossRef]
- Li, Y.; Wang, C.; Wang, T.; Zhang, L.; Cao, J.; Wang, Y.; Song, C.; Zhu, W.; Guo, L.; Hui, P. Design and experiment of a type hole wheel garlic seed metering device. Proceedings of the Institution of Mechanical Engineers, Part C. J. Mech. Eng. Sci. 2024, 238, 1203–1217. [Google Scholar] [CrossRef]
- Elwakeel, E.A.; Elbeltagi, A.; Dewidar, Z.A.; Salem, A.; Abdenne, M.A. Development and laboratory evaluation of a novel IoT-based electric-driven metering system for high precision garlic planter. PLoS ONE 2025, 20, e0317203. [Google Scholar] [CrossRef] [PubMed]
- Chen, J.; Zhou, B.; Jia, J.; Chen, Z.; Yu, C.; Cai, S. Design and parameters optimization of root cutting tool based on garlic numerical simulation model. J. Food Process Eng. 2021, 44, e13753. [Google Scholar] [CrossRef]
- Shirwal, S.; Mani, I.; Sirohi, N.; Kumar, A. Development and evaluation of carrot harvester. AMA-Agric. Mech. Asia Afr. Lat. Am. 2015, 46, 28–34. Available online: https://www.researchgate.net/publication/279334985_Development_and_Evaluation_of_Carrot_Harvester (accessed on 1 March 2016).
- Li, H.; Gao, J.; Wang, Y.; Zhang, Q.; LÜ, D.; Fu, J. Design and experiment of Chain-spoon Type Precision Seed-metering Device for Garlic Based on DEM-MBD Coupling. Trans. Chin. Soc. Agric. Mach. 2024, 55, 147–159. [Google Scholar] [CrossRef]
- Li, T.; Zhang, H.; Han, X.; Li, Y.; Hou, J.; Shi, G. Design and experiment of missing seed detection and the reseeding device for spoon chain garlic seeders. Trans. Chin. Soc. Agric. Eng. 2022, 38, 24–32. [Google Scholar] [CrossRef]
- Cui, R.; Wang, X.; Xin, J.; Sun, L.; Wu, C. Design and experiment of Arc Duck-billed Garlic Seed Planter. Trans. Chin. Soc. Agric. Mach. 2022, 53, 120–130. [Google Scholar] [CrossRef]
- Li, Y.; Liu, Q.; Li, T.; Wu, Y.; Niu, Z.; Hou, J. Design and experiments of garlic bulbil orientation adjustment device using Jetson Nano processor. Trans. Chin. Soc. Agric. Eng. 2021, 37, 35–42. [Google Scholar] [CrossRef]
- Wang, Y.; Wang, L.; Yin, W.; Su, L.; Xu, K.; Liang, J. Impact of Diversified Cropping-Fallow Systems To Break the Bottleneck of Continuous Cultivation of Purple Garlic (Allium sativum L.). J. Soil Sci. Plant Nutr. 2025, 25, 3916–3927. [Google Scholar] [CrossRef]
- Ko, D.Y.K.; Chae, S.H.; Moon, H.W.; Kim, H.J.; Seong, J.; Lee, M.S.; Ku, K.M. Agrivoltaic Farming Insights: A Case Study on the Cultivation and Quality of Kimchi Cabbage and Garlic. Agronmy 2023, 13, 2625. [Google Scholar] [CrossRef]
- Zhang, H.; Xiao, F.; He, W.; Chai, Z.; Ewe, H.T. Multiyear Automated Mapping and Price Analysis of Garlic in Main Planting Areas of China Using Time-Series Remote Sensing Images. IEEE J. Sel. Top. Appl. Earth Obs. Remote Sens. 2022, 15, 5222–5233. [Google Scholar] [CrossRef]
- Liu, J.; Yuan, J.; Cui, J.; Liu, Y.; Liu, X. Contour Resampling-Based Garlic Clove Bud Orientation Recognition for High-Speed Precision Seeding. Agriculture 2022, 12, 1334. [Google Scholar] [CrossRef]


| Level | Sprout Orientation | Planting Pattern | Planting Density/10,000 Plants per Hectare | Row Spacing/cm |
|---|---|---|---|---|
| 1 | 0–45° facing up | Ridge cropping | 36.75 | 18/22 + 14/26 + 10 |
| 2 | 45–90° facing up | Small ridge | 39.75 | 18/22 + 14/26 + 10 |
| 3 | 90° | Large ridge | 42.75 | 18/22 + 14/26 + 10 |
| Level | Sprout Orientation | Planting Pattern | Planting Density/10,000 Plants per Hectare | Row Spacing/cm |
|---|---|---|---|---|
| 1 | 0–45° | Ridge cropping | 36.75 | 18 |
| 2 | 0–45° | Small ridge | 39.75 | 22 + 14 |
| 3 | 0–45° | Large ridge | 42.75 | 26 + 10 |
| 4 | 45–90° | Ridge cropping | 39.75 | 26 + 10 |
| 5 | 45–90° | Small ridge | 42.75 | 18 |
| 6 | 45–90° | Large ridge | 36.75 | 22 + 14 |
| 7 | 90° | Ridge cropping | 42.75 | 22 + 14 |
| 8 | 90° | Small ridge | 36.75 | 26 + 10 |
| 9 | 90° | Large ridge | 39.75 | 18 |
| Source | Type III Sum of Squares | df | Mean Square | F-Value | p Value |
|---|---|---|---|---|---|
| Corrected Model | 7,708,459.852a | 8 | 963,557.481 | 5.780 | <0.01 |
| Intercept | 15,205,234,823.148 | 1 | 15,205,234,823.148 | 91,215.416 | <0.01 |
| Sprout orientation | 708,344.963 | 2 | 354,172.481 | 2.125 | 0.148 |
| Planting pattern | 582,156.074 | 2 | 291,078.037 | 1.746 | 0.203 |
| Planting density | 516,3701.407 | 2 | 2,581,850.704 | 15.488 | <0.01 |
| Row spacing | 1,254,257.407 | 2 | 627,128.704 | 3.762 | 0.043 |
| Error | 3,000,526.000 | 18 | 166,695.889 | ||
| Total | 15,215,943,809.000 | 27 | |||
| Corrected Total | 10,708,985.852 | 26 |
| Source | Type III Sum of Squares | df | Mean Square | F-Value | p Value |
|---|---|---|---|---|---|
| Corrected model | 12,290,970.667a | 8 | 1,536,371.333 | 17.882 | <0.01 |
| Intercept | 16,080,283,681.333 | 1 | 16,080,283,681.333 | 187,158.980 | <0.01 |
| Sprout orientation | 103,0496.222 | 2 | 515,248.111 | 5.997 | <0.01 |
| Planting pattern | 1,790,267.556 | 2 | 895,133.778 | 10.418 | <0.01 |
| Planting density | 7,694,392.889 | 2 | 3,847,196.444 | 44.778 | <0.01 |
| Row spacing | 1,775,814.000 | 2 | 887,907.000 | 10.334 | <0.01 |
| Error | 1,546,520.000 | 18 | 85,917.778 | ||
| Total | 16,094,121,172.000 | 27 | |||
| Corrected total | 13,837,490.667 | 26 |
| Source | Type III Sum of Squares | df | Mean Square | F-Value | p Value |
|---|---|---|---|---|---|
| Corrected model | 9,420,364.000a | 8 | 1,177,545.500 | 8.668 | <0.01 |
| Intercept | 15,864,013,445.333 | 1 | 15,864,013,445.333 | 116,782.322 | <0.01 |
| Sprout orientation | 767,968.222 | 2 | 383,984.111 | 2.827 | 0.086 |
| Planting pattern | 306,148.667 | 2 | 153,074.333 | 1.127 | 0.346 |
| Planting density | 7,443,396.222 | 2 | 3,721,698.111 | 27.397 | <0.01 |
| Row spacing | 902,850.889 | 2 | 451,425.444 | 3.323 | 0.059 |
| Error | 2,445,166.667 | 18 | 135,842.593 | ||
| Total | 15,875,878,976.000 | 27 | |||
| Corrected total | 11,865,530.667 | 26 |
| Source | Type III Sum of Squares | df | Mean Square | F-Value | p Value |
|---|---|---|---|---|---|
| Corrected model | 8,315,554.000a | 8 | 1,039,444.250 | 13.755 | <0.01 |
| Intercept | 12,499,849,301.333 | 1 | 12,499,849,301.333 | 165,411.127 | <0.01 |
| Sprout orientation | 95,293.556 | 2 | 47,646.778 | 0.631 | 0.544 |
| Planting pattern | 944,256.889 | 2 | 472,128.444 | 6.248 | <0.01 |
| Planting density | 6,495,209.556 | 2 | 3,247,604.778 | 42.976 | <0.01 |
| Row spacing | 780,794.000 | 2 | 390,397.000 | 5.166 | 0.017 |
| Error | 1,360,230.667 | 18 | 75,568.370 | ||
| Total | 12,509,525,086.000 | 27 | |||
| Corrected total | 9,675,784.667 | 26 |
| Source | Type III Sum of Squares | df | Mean Square | F-Value | p Value |
|---|---|---|---|---|---|
| Corrected model | 7,466,365.852a | 8 | 933,295.731 | 14.726 | <0.01 |
| Intercept | 12,530,248,981.481 | 1 | 12,530,248,981.481 | 197,705.446 | <0.01 |
| Sprout orientation | 813,223.185 | 2 | 406,611.593 | 6.416 | <0.01 |
| Planting pattern | 463,902.741 | 2 | 231,951.370 | 3.660 | 0.046 |
| Planting density | 4,891,137.185 | 2 | 2,445,568.593 | 38.587 | <0.01 |
| Row spacing | 1,298,102.741 | 2 | 649,051.370 | 10.241 | <0.01 |
| Error | 1,140,810.667 | 18 | 63,378.370 | ||
| Total | 12,538,856,158.000 | 27 | |||
| Corrected total | 8,607,176.519 | 26 |
| Source | Type III Sum of Squares | df | Mean Square | F-Value | p Value |
|---|---|---|---|---|---|
| Corrected model | 8,840,942.667a | 8 | 1,105,117.833 | 10.837 | <0.01 |
| Intercept | 12,368,130,208.333 | 1 | 12,368,130,208.333 | 121,281.809 | <0.01 |
| Sprout orientation | 505,397.556 | 2 | 252,698.778 | 2.478 | 0.112 |
| Planting pattern | 960,678.222 | 2 | 480,339.111 | 4.710 | 0.023 |
| Planting density | 5,918,358.222 | 2 | 2,959,179.111 | 29.018 | <0.01 |
| Row spacing | 1,456,508.667 | 2 | 728,254.333 | 7.141 | <0.01 |
| Error | 1,835,612.000 | 18 | 101,978.444 | ||
| Total | 12,378,806,763.000 | 27 | |||
| Corrected total | 10,676,554.667 | 26 |
| Source | Type III Sum of Squares | df | Mean Square | F-Value | p Value |
|---|---|---|---|---|---|
| Corrected Model | 7,696,790.074a | 8 | 962,098.759 | 18.723 | <0.01 |
| Intercept | 14,280,746,088.926 | 1 | 14,280,746,088.926 | 277,908.218 | <0.01 |
| Sprout orientation | 396,583.185 | 2 | 198,291.593 | 3.859 | 0.040 |
| Planting pattern | 611,642.296 | 2 | 305,821.148 | 5.951 | <0.01 |
| Planting density | 5,522,556.963 | 2 | 2,761,278.481 | 53.735 | <0.01 |
| Row spacing | 1,166,007.630 | 2 | 583,003.815 | 11.345 | <0.01 |
| Error | 924,958.000 | 18 | 51,386.556 | ||
| Total | 14,289,367,837.000 | 27 | |||
| Corrected Total | 8,621,748.074 | 26 |
| Source | Type III Sum of Squares | df | Mean Square | F-Value | p Value |
|---|---|---|---|---|---|
| Corrected model | 10,214,468.667a | 8 | 1,276,808.583 | 16.879 | <0.01 |
| Intercept | 14,143,685,381.333 | 1 | 14,143,685,381.333 | 186,978.885 | <0.01 |
| Sprout orientation | 273,200.667 | 2 | 136,600.333 | 1.806 | 0.193 |
| Planting pattern | 289,860.222 | 2 | 144,930.111 | 1.916 | 0.176 |
| Planting density | 8,065,174.222 | 2 | 4,032,587.111 | 53.311 | <0.01 |
| Row spacing | 1,586,233.556 | 2 | 793,116.778 | 10.485 | <0.01 |
| Error | 1,361,578.000 | 18 | 75,643.222 | ||
| Total | 14,155,261,428.000 | 27 | |||
| Corrected total | 11,576,046.667 | 26 |
| Source | Type III Sum of Squares | df | Mean Square | F-Value | p Value |
|---|---|---|---|---|---|
| Corrected model | 8,099,293.333a | 8 | 1,012,411.667 | 13.488 | <0.01 |
| Intercept | 14,141,213,633.333 | 1 | 14,141,213,633.333 | 188,404.467 | <0.01 |
| Sprout orientation | 99,220.667 | 2 | 49,610.333 | 0.661 | 0.528 |
| Planting pattern | 1,528,297.556 | 2 | 764,148.778 | 10.181 | <0.01 |
| Planting density | 5,729,548.222 | 2 | 2,864,774.111 | 38.168 | <0.01 |
| Row spacing | 742,226.889 | 2 | 371,113.444 | 4.944 | 0.019 |
| Error | 1,351,039.333 | 18 | 75,057.741 | ||
| Total | 14,150,663,966.000 | 27 | |||
| Corrected total | 9,450,332.667 | 26 |
Disclaimer/Publisher’s Note: The statements, opinions and data contained in all publications are solely those of the individual author(s) and contributor(s) and not of MDPI and/or the editor(s). MDPI and/or the editor(s) disclaim responsibility for any injury to people or property resulting from any ideas, methods, instructions or products referred to in the content. |
© 2025 by the authors. Licensee MDPI, Basel, Switzerland. This article is an open access article distributed under the terms and conditions of the Creative Commons Attribution (CC BY) license (https://creativecommons.org/licenses/by/4.0/).
Share and Cite
Jiang, C.; Gu, F.; Zhu, Z.; Hu, Z.; Wang, Q. Agronomic Experiments and Analysis of Garlic Mechanization-Friendly Cultivation Patterns in China. Agronomy 2025, 15, 1614. https://doi.org/10.3390/agronomy15071614
Jiang C, Gu F, Zhu Z, Hu Z, Wang Q. Agronomic Experiments and Analysis of Garlic Mechanization-Friendly Cultivation Patterns in China. Agronomy. 2025; 15(7):1614. https://doi.org/10.3390/agronomy15071614
Chicago/Turabian StyleJiang, Chunxia, Fengwei Gu, Zhengbo Zhu, Zhichao Hu, and Qingqing Wang. 2025. "Agronomic Experiments and Analysis of Garlic Mechanization-Friendly Cultivation Patterns in China" Agronomy 15, no. 7: 1614. https://doi.org/10.3390/agronomy15071614
APA StyleJiang, C., Gu, F., Zhu, Z., Hu, Z., & Wang, Q. (2025). Agronomic Experiments and Analysis of Garlic Mechanization-Friendly Cultivation Patterns in China. Agronomy, 15(7), 1614. https://doi.org/10.3390/agronomy15071614