Article

Effects of Biochar-Based Fertilizers on Fenlong-Ridging Soil Physical Properties, Nutrient Activation, Enzyme Activity, Bacterial Diversity, and Sugarcane Yield

1
Guangxi Key Laboratory of Sugarcane Biology, College of Agriculture, Guangxi University, 100 Daxue Rd., Nanning 530004, China
2
Key Laboratory of Crop Cultivation and Tillage, College of Agriculture, Guangxi University, 100 Daxue Rd., Nanning 530004, China
3
Cash Crop Research Institute, Guangxi Academy of Agricultural Sciences, Nanning 530007, China
4
Department of Soil, Water, and Ecosystem Sciences/Indian River Research and Education Center, Institute of Food and Agricultural Sciences, University of Florida, Fort Pierce, FL 34945, USA
*
Authors to whom correspondence should be addressed.
These authors contributed equally to this work and should be regarded as co-first authors.
Agronomy 2025, 15(7), 1594; https://doi.org/10.3390/agronomy15071594
Submission received: 25 May 2025 / Revised: 22 June 2025 / Accepted: 27 June 2025 / Published: 29 June 2025
(This article belongs to the Section Soil and Plant Nutrition)

Abstract

Biochar-based fertilizers can improve soil structure and fertility. However, their efficiency is affected by the raw materials of biochar. The effects of biochar-based fertilizers on the soil microenvironment under Fenlong-ridging conditions remain unclear. This study aimed to evaluate the effects of biochar-based fertilizers derived from sugarcane filter mud and rice straw on soil physicochemical properties, microbial communities, and sugarcane yield under Fenlong-ridging in Guangxi’s acidic red soil (Hapludults). A two-year field experiment (2021–2022) was conducted on a clay loam soil classified as Hapludults (USDA Soil Taxonomy) in the same experimental plots using three fertilizer applications—conventional chemical fertilization (CK), straw biochar-based fertilizer (T1), and sugar filter mud biochar-based fertilizer (T2)to determine the responses of soil physicochemical properties and bacterial community diversity to different biochar-based fertilizers and evaluate benefits to the soil environment and sugarcane yield. Soil samples (0–20 cm depth) revealed that T1 and T2 reduced bulk density by 2.31% and increased porosity by 2.00–2.31% versus CK. Notably, T2 exhibited 4.1-fold higher specific surface area than T1, driving stronger soil–bacterial interactions: it enhanced soil moisture (7.17–13.05%) and pH (17.89–24.14% in 2021; 8.68–11.57% in 2022), thereby promoting nutrient availability (N, P, K), organic matter (SOM), and sucrase activity. Microbiome analysis showed T2 enriched Gemmatimonadota and Sphingomonas (beneficial taxa) while suppressing Acidothermus. The results of RDA and Spearman correlation analysis indicated that the bacterial community structure was mainly affected by soil pH, TN, AP, and SOM. Consequently, T2 increased sugarcane yield by 5.63–11.16% over T1 through synergistic soil–microbial improvements. Future studies involving multi-site and long-term experiments are needed to confirm the broader applicability and stability of these findings. This study provides a theoretical basis for the positive regulation of sugar filter mud biochar-based fertilizers in the soil environment, bacterial community structure, and sugarcane yield.

1. Introduction

Sugarcane (Sacharum spp. hybrids) is an important economic tropical crop that is widely cultivated, accounting for 80% of the world’s sugar production, and a crucial source of biofuel for ethanol production [1,2,3]. China is an important sugarcane-growing country, with a sugarcane yield of more than 90% of the total sugar crop yield in 2021 [4]. China is also an important sugar importer owing to its large population and limited land [1]. Continuous sugarcane cropping is commonly observed in traditional agricultural systems but causes problems, such as a shallow plough layer, soil degradation and acidification, and an imbalance of soil nutrients [2,5,6,7], thus severely reducing the sugarcane yield [5,8]. The excessive application of chemical fertilizers is also used to increase sugarcane yield, but the overuse of chemical fertilizers also causes problems, especially reduced soil nutrient absorption efficiency and deterioration in soil quality. Thus, the application of chemical fertilizers alone is inadequate to produce the desired results. Therefore, a sustainable sugarcane cultivation method is necessary.
Biochar can improve soil physicochemical properties, organic matter content, and microbial diversity [9]. Biochar is a carbon-rich material produced by the thermal decomposition of biomass under anaerobic or oxygen-limited conditions. Biochar has been widely utilized as a soil amendment and fertilizer because of its unique and beneficial characteristics, such as its specific surface area, rich porous structure, and high stability [10,11,12,13]. In most agricultural planting systems, biochar is applied in conjunction with chemical fertilizers to fulfill the nutrient needs of crop growth [14,15]. The intrinsic structure and properties of biochar can directly or indirectly affect the soil microecological environment by altering its physicochemical properties and nutrient availability in the soil [16]. Biochar enhances soil aggregation, improves aggregate stability, and decreases penetration resistance and soil strength [17]. Compared with the results of complete fertilization control, biochar application significantly increases soil organic matter content, cane stem height, and stem weight [18]. Butphu et al. [19] reported that biochar combined with fertilizer dramatically improves the nutrient absorption and yield of sugarcane, improving fertilizer utilization efficiency. Therefore, the use of biochar-based fertilizers improves soil organic matter, soil properties, sugarcane production, and long-term management costs [20]. Notably, the application of biochar and biochar-based fertilizers is costly for the cultivation of staple crops. Thus, selecting a low-cost and optimal biochar feedstock for the growth of specific crops according to the properties of biochar and biochar-based fertilizers is necessary.
Sugar filter mud is the main type of solid waste produced in the sugar-making process; for example, 0.25 kg of mud is produced when making 1 kg of sucrose [21]. Sugar filter mud is rich in organic matter, cane fiber, protein, and calcium phosphate [22] and is a suitable feedstock for biochar. Therefore, the preparation of biochar and biochar-based fertilizers is a valuable measure of the resource utilization of sugar filter mud. Filter mud biochar has the characteristics of high raw material concentration and low cost. However, the effects of biochar application on soil and crops vary depending on the raw materials, preparation technology, and soil type. Rice straw biochar increases the phosphorus adsorption of brown soil, but peanut shell biochar and corn straw biochar have the opposite effect [23]. Wang et al. [24] demonstrated that the effect of straw biochar is better than that of wood biochar on soil pH, organic matter content, and P and K availability. A meta-analysis [25] reported that the application of herbaceous biochar to increase bacterial diversity was more prominent than that of biochar from wood, manure, and lignocellulosic waste. He et al. [26] demonstrated that the effects of tobacco straw biochar-based fertilizers on soil bacterial community components and structure were better than those of bamboo biochar-based fertilizers, including an increase in the Chao 1 index. A reduction in the relative abundance of Proteobacteria under bamboo biochar-based fertilizers was reported, and Actinobacteria increased compared with that under rice straw biochar-based fertilizers [27]. Hence, the effects of different biochars must be further verified [28]. However, only a few studies have investigated how the sugar filter mud biochar affects soil properties, soil enzymes, and microorganisms of sugarcane.
Biochar combined with deep tillage can significantly promote the formation and stability of large aggregates and enhance carbon fixation and organic carbon accumulation, improving soil structure [29,30]. The positive effects of biochar combined with deep tillage in wheat [31], maize [32], tobacco [33], and sugarcane [34] have been reported. Chen et al. [29] demonstrated that biochar under deep tillage is more favorable for reducing soil nutrient leaching and bulk density and improving bacterial structure and crop yield than conventional tillage. Fenlong-ridging is a new conservation tillage technology developed in China, and its tillage depth can be more than 40 cm by using a “spiral drill” [35]. Compared with the conventional method, Fenlong-ridging improved the soil structure and total porosity, increasing the available water for crop growth, and crop yield in maize [36,37,38], rice, and sugarcane. Xiao et al. [34] demonstrated that rice biochar application under Fenlong-ridging tillage increases soil porosity, nutrient availability, soil organic matter content, and sugarcane yield, and decreases soil bulk density when compared with those under traditional tillage. However, only a few studies have investigated the interactions between sugar filter mud biochar and Fenlong-ridging, including in sugarcane.
We hypothesized that biochar-based fertilizers prepared from sugar filter mud regulate the bacterial community by improving soil physical properties, increasing the availability of soil nutrients, and adjusting soil enzyme activity, thus promoting sugarcane growth and yield. To test this hypothesis, we conducted a 2-year field experiment at Guangxi University. Field trials were conducted on Fenlong-ridged sugarcane (first ratoon in 2021 and second ratoon in 2022) by using three fertilizer applications: standard chemical fertilizers (CK), straw biochar-based fertilizers (T1), and sugar filter mud biochar-based fertilizers (T2). We analyzed the changes in soil physicochemical properties (e.g., soil bulk density, porosity, water and nutrient content, and enzyme activity) and the responses of the bacterial community to the application of biochar-based fertilizers and identified the correlations between these parameters and sugarcane yield. The results may provide a theoretical basis and technical support for the efficient cultivation system and sustainable development of sugarcane.

2. Materials and Methods

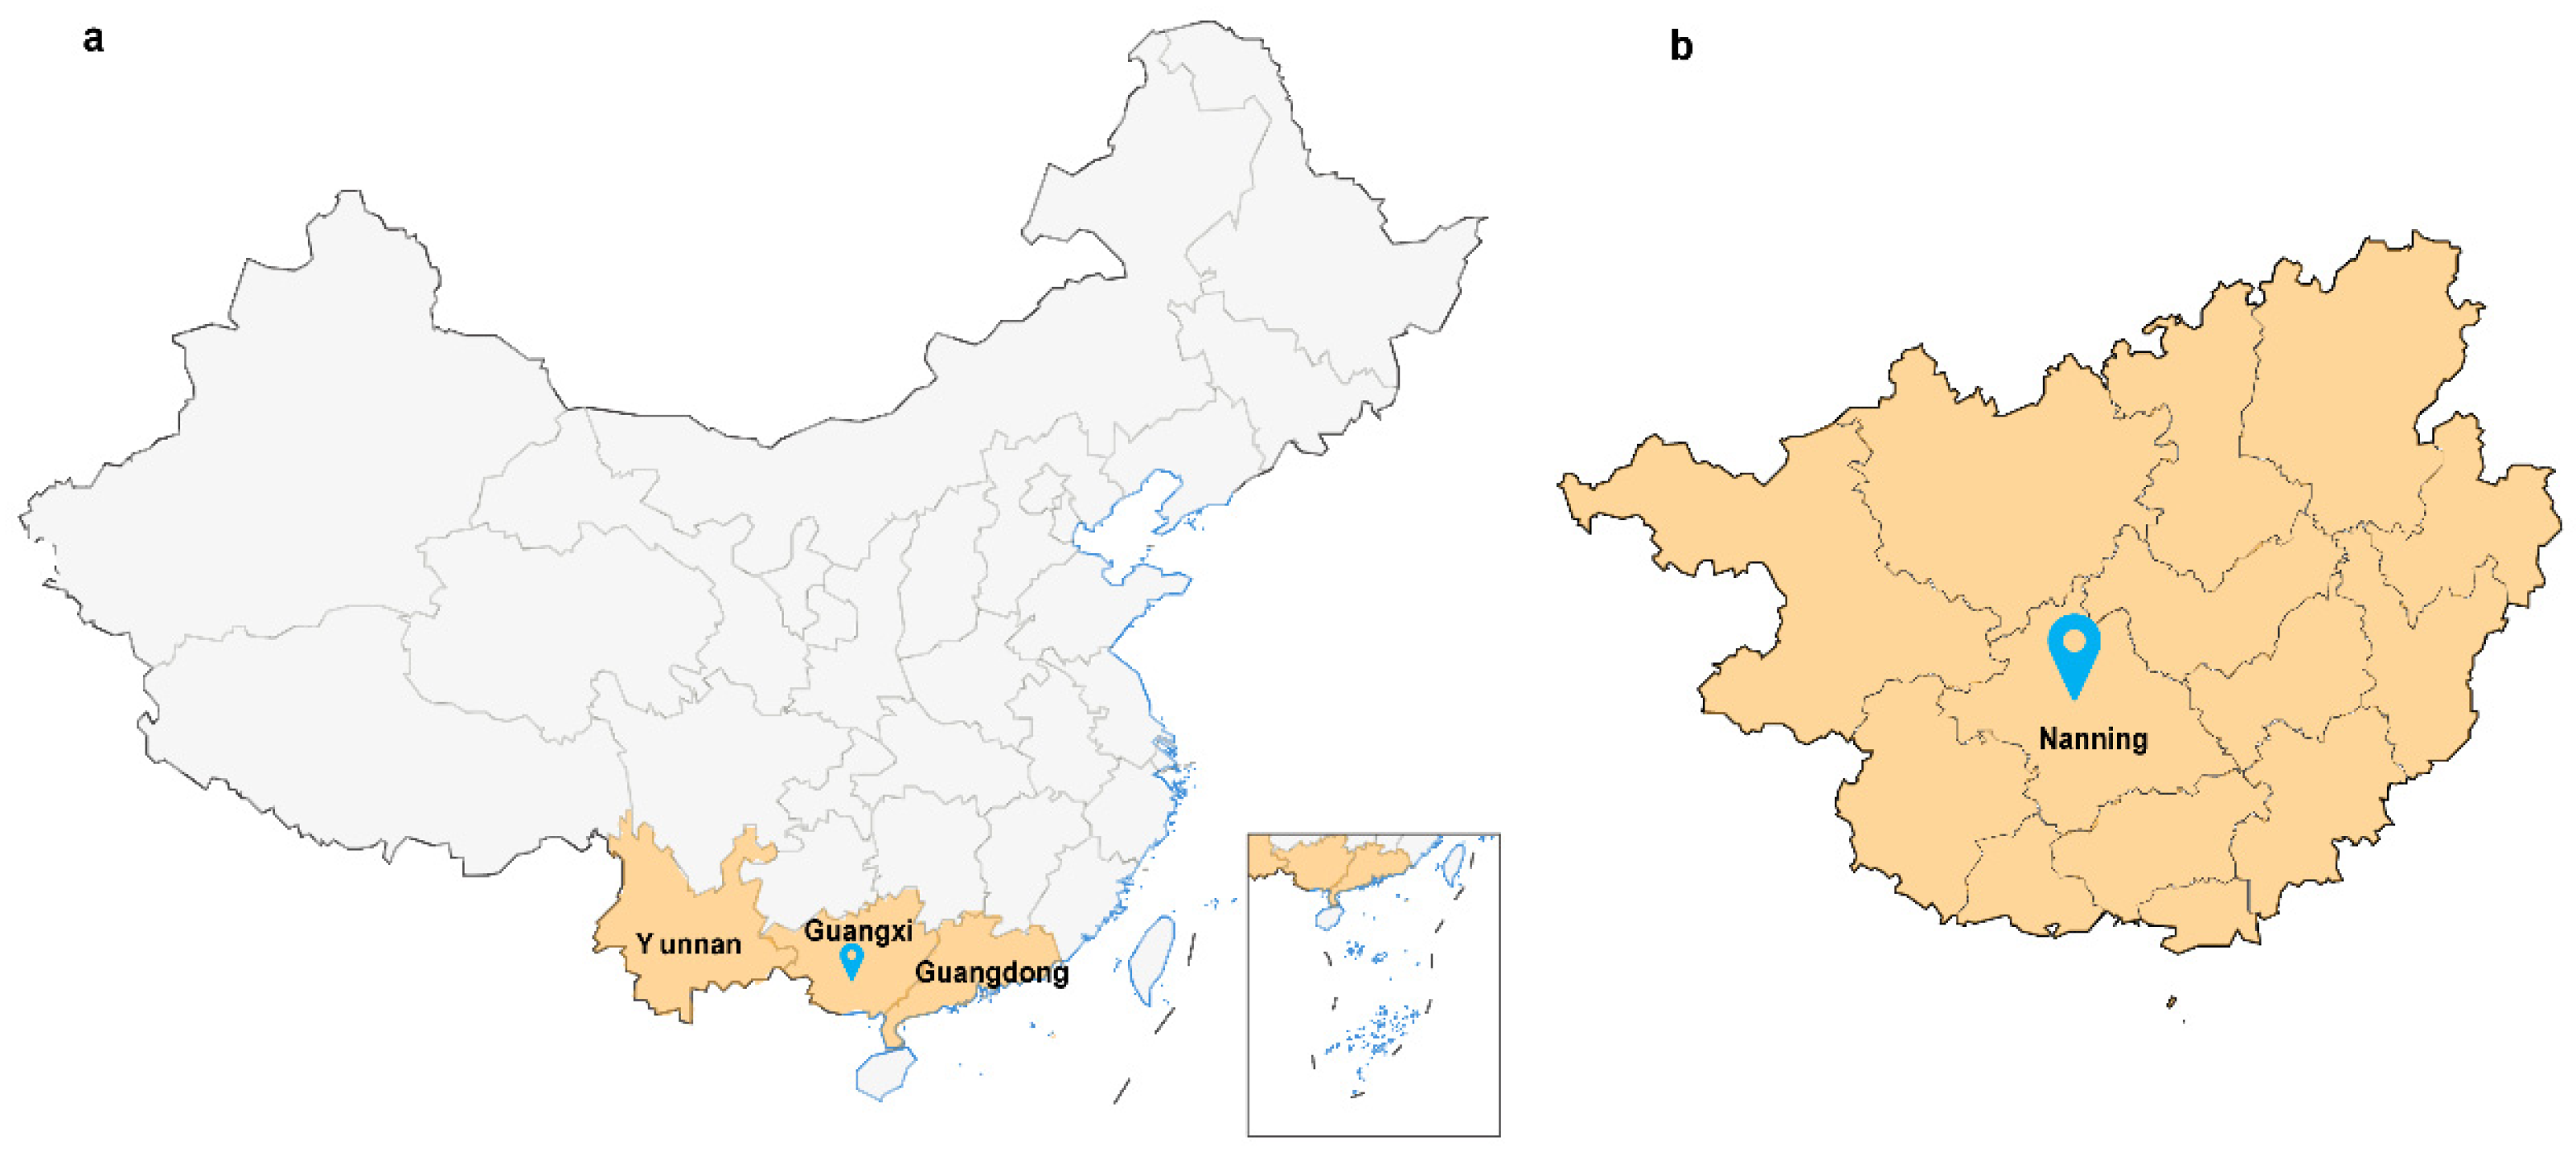
2.1. Experimental Site

Field experiments were conducted in Guangxi University, China (E 108°77′, N 22°50′), in the 2021 and 2022 cropping seasons (Figure 1). The area resembles a South Asian tropical monsoon climate, with a mean temperature of approximately 22.7 °C and average annual rainfall of 995 mm (Figure 2). The soil in the area is classified as red loam without historical application of biochar fertilizers. The soil texture was clay loam(USDA classification: 32% clay, 41% silt, 27% sand), with dominant minerals including quartz (45%), kaolinite (30%), and iron oxides (15%). The basic soil properties of the 0–20 cm soil layer are presented in Table 1.

2.2. Experimental Design

Fenlong-ridging, which could reach a soil depth of 40–50 cm, was adopted to complete cane land preparation. The biochar-based fertilization experiments were set up in a completely randomized single-factorial design with three replicates. There were three treatments: chemical fertilizer (control treatment, this treatment is a conventional fertilization measure used in most sugarcane production), straw biochar-based fertilizer, and sugar filter mud biochar-based fertilizer. The straw biochar was produced from rice straw (Oryza sativa L.), a common crop residue in Guangxi, with cellulose, hemicellulose, and lignin contents of 32%, 24%, and 18%, respectively (Guangxi China Hannong Biomass Technology Co., Ltd., Nanning, Guangxi, China). Sugar filter mud biochar was made by our team using the existing patent (CN201810946932.3). Particulate biochar mass was ground to pass through a 2 mm sieve, then mixed uniformly with all chemical fertilizers to obtain biochar-based fertilizers, respectively. Biochar application rates were both 3000 kg ha−1. The basic physical and chemical properties of biochar are shown in Table 2. Crop management included manual weeding, natural rainfall-dependent irrigation, and no additional organic amendments during the trial to isolate biochar effects.
The field experiment included 9 plots, and each plot size was 10.8 m2 (1.8 m × 6 m) and contained four rows with pathways of 1 m to separate plots. In this study, sugarcane (Guitang 42, a widely planted hybrid sugarcane cultivar in Guangxi) was planted by a double-bud planting method with a plant density of 140,000 plants ha−1 in 2020. The experiment was repeated in the same place, and the first ratoon (in 2021) and second ratoon (in 2022) were used as the research material. One-third of the total amount of a fertilizer was applied as a basal dose in the planting ditch (in April), and the remaining fertilizer was side-dressed along cane rows in equal doses during the tillering stage (in June). Thereinto, biochar-based fertilizers were used in 2021 and 2022. Weeds were controlled by hand hoeing, and water management relied on nature in the Fenlong-ridging cane field.

2.3. Measurements and Methods

2.3.1. Characterization of Biochar

Two kinds of biochar were crushed to pass 80 mesh for the analysis of surface morphology and specific surface area, respectively. The surface morphology of biochar was analyzed by a scanning electron microscope (SEM) (Phenom Pro G4, Phenom World, Eindhoven, The Netherlands). The specific surface area of biochar was determined by an automated surface area analyzer (ASAP2460, Micromeritics Instrument Corp, Norcross, GA, USA) by using the method of Brunauer, Emmett, and Teller (BET). The specific surface area of the material was calculated accurately by the existing mathematical formulas and models after determining the isotherm of nitrogen adsorption–desorption.
Two kinds of biochar were characterized by SEM and a specific surface area analyzer. SEM results showed a clear difference in surface morphology between straw biochar and sugar filter mud (Figure 3). The surface of straw biochar was slightly rough, with few pores and some platy particles attached (Figure 3a). Sugar filter mud biochar was distributed in irregular clumps, and its rough surface had quite a few distinct apertures (Figure 3b). More apertures would produce a larger specific surface area. The results of the specific surface area also showed a stark difference between the two biochar types. A considerable specific surface area of sugar filter mud biochar can be seen, and it was more than four times that of straw biochar (Table 3). This indicated that sugar filter mud biochar would have a strong adsorption performance and provide many attachment sites for elements.

2.3.2. Agronomic Traits and Yield Measurement

The first ratoon was harvested on 5 March 2022 and the second ratoon on 2 January 2023. Meanwhile, the agronomic traits, yield, and quality were measured. Effective stems with a length of 1 m or more were collected by cutting stems as close to the soil as possible, and the number of effective stems was recorded in plots. Plant height (on-ground sugarcane base to sugarcane growth point), stem diameter (average diameter of above-ground third internode, middle internode, and top-down seventh internode of sugarcane), and single stem weight were measured by randomly selecting ten effective canes. The sugarcane yield was determined as follows:
Y i e l d t   h a 1 = t h e   n u m b e r   o f   e f f e c t i v e   s t e m s   ( p l a n t   h a 1 ) × s i n g l e   s t e m   w e i g h t   ( k g   p l a n t 1 )
Sugar content was determined by the Institute of Sugarcane Research (Guangxi Academy of Agricultural Sciences).

2.3.3. Soil Sampling

Soil samples from 0–20 cm soil layers were taken with three replicates at each plot in the sugarcane mature stage (10 December 2022 and 3 January 2023). The fresh soil samples were transported in ice bags to the laboratory and kept at −80 °C until analysis. Sub-soil samples were air dried for measuring soil chemical properties.

2.3.4. Soil Physical and Chemical Analysis

Fresh soil samples were used to analyze the physical properties. Soil water content was measured by the oven-drying method [39]. Soil wet bulk density was measured by the core sampling method using a ring knife [39]. The soil porosity was determined as follows:
S o i l   p o r o s i t y % = 1 s o i l   w e t   b u l k   d e n s i t y g   c m 3 s o i l   s p e c i f i c   g r a v i t y g   c m 3 × 100
The standard value of 2.65 g cm−3 was used as the soil specific gravity [40].
Air-dried soil samples were ground to pass a 0.8 mm sieve to analyze the chemical properties. The soil pH was measured on a pH meter (pH meter FE28-BIO, Mettler-Toledo Instruments (Shanghai) Co., Ltd., Shanghai, China) in deionized water without carbon dioxide at a soil-to-solution ratio of 1:5 [39].
SOM was measured using the external heating method with potassium dichromate oxidation [41]. AN was measured using the alkaline hydrolysable diffusion method [41]. AP was measured using the molybdenum antimony colorimetric method with hydrochloric acid and sulfuric acid [41]. AK was extracted using 0.5 mol·L−1 ammonium acetate and measured using flame photometry (AP-1200 flame photometry, Shanghai AOPU Analytical Instruments Co., Ltd., Shanghai, China) [41]. TP and TK of the soil were analyzed by digesting the ashed samples in a muffle furnace. TN was measured on an infrared heating digestion instrument (PD60, Changsha Zerom Instrument and Meter Co., Ltd., Changsha, China) and K9840 Automatic Kjeldahl Apparatus (Hanon Technology, Jinan, China).
The soil enzyme activities were evaluated according to Guan [42]. The soil samples were incubated together with substrates specific to each enzyme and buffer solution, respectively. The activities of urease, sucrase and acid phosphatase were expressed in mg of ammonia 1 g of dry soil−1 24 h−1 (mg ammonia·g−1 air-dried soil·24 h−1), mg of glucose 1 g of dry soil−1 24 h−1 (mg glucose·g−1 air-dried soil·24 h−1), and mg of phenol 1 g of dry soil−1 24 h−1 (mg phenol·g−1 air-dried soil·24 h−1), respectively.

2.3.5. Soil Bacteria Analysis

Microbial genomic DNA extracts from soil samples in 2021 were evaluated using a FastDNA® spin kit (MP bio, Santa Ana, CA, USA), while those from 2022 were evaluated using a MoBio PowerSoil® DNA Isolation Kit (Carlsbad, CA, USA, MoBio Laboratories). DNA quality assays were performed on 1% agarose gels and qualified; pollution-free DNA was used for subsequent processing. Small-fragment library construction and high-throughput sequencing were performed on the Mi-Seq platform.
For samples from 2021, the raw 16S rRNA of the V4 region was quality filtered, denoised, and merged, and non-chimeric sequences were removed using the DADA2 of QIIME to obtain the operational taxonomic units (OTUs). For samples in 2022, the V4–V5 region of the bacterial 16S rRNA gene was amplified using primers 515F (5′-GTGCCAGCMGCCGCGGTAA-3′) and 907R (5′-CCGTCAATTCCTTTGAGTTT-3′), and PCR products were electrophoresed on a 2% agarose gel. Quality control of the raw data was performed using QIIME with the Deblur algorithm, which removed adapter sequences and low-quality reads. The sequences of the bacteria were assigned to the OTUs at 97% shared identity using the Uparse software (Uparse v7.0.1001, http://www.drive5.com/uparse/, accessed on 25 July 2023). Taxonomic classification was based on the SILVA (http://www.arb-silva.de, Release 132, accessed on 25 July 2023) ribosomal RNA gene database. Alpha diversity indices, beta diversity analysis, principal coordinate analysis, non-metric multidimensional scaling, redundancy analysis (RDA), and Spearman’s rank correlation heatmaps were constructed using Wekemo BioIncloud (https://www.bioincloud.tech, accessed on 25 July 2023).

2.4. Statistical Analysis

Data were tested for normality and then statistically analyzed using analysis of variance (ANOVA) by SPSS 26.0 (SPSS Inc., Chicago, IL, USA). The significance of the differences between average values was based on Duncan’s multiple range test (DMRT) at p ≤ 0.05, following one-way ANOVA. The values are means ± standard deviation. Figures were prepared using Origin 2021 (Origin Lab, Northampton, MA, USA) and Adobe Illustrator 2021 (Adobe, Mountain View, CA, USA).

3. Results

3.1. Soil Bulk Density, Porosity, and Soil Water Content

The physical soil properties were significantly changed by the biochar-based fertilizer in the mature stage, mainly in the second-year ratoon (2022) (Figure 4). Compared with CK, soil bulk density and porosity in the first-year ratoon (2021) showed nonsignificant changes after applying the biochar-based fertilizer, while in 2022, significant changes were observed (Figure 4). Bulk density under T1 and T2 was 2.33% lower than that under CK, and soil porosity under T1 and T2 increased by 2.00% and 2.31% compared with CK in the mature stage of 2022, respectively. There was no significant difference in soil bulk density and porosity between T1 and T2. Biochar accumulation in the field can be one possible reason for the improvement of soil bulk density and porosity after applying the biochar-based fertilizer in 2022. Soil water content was observably affected by the biochar-based fertilizer in the mature stage. The water content of soil increased in the order T2 > T1 > CK (Figure 4). In 2021, compared with CK, soil water content T1 and T2 significantly increased by 4.29% and 7.17%, while in 2022, it significantly increased by 10.46% and 13.05%, respectively. Soil water content in 2022 was lower than in 2021, which may be related to precipitation. These results showed that the biochar-based fertilizer had a positive impact on soil bulk density, porosity, and water content, and that performance was consistent in both the straw biochar-based fertilizer and sugar filter mud biochar-based fertilizer application.
Biochar-based fertilizers significantly improved soil pore structure (Table 4). Compared with CK, biochar-based fertilizers increased macropores by 22.4% (T1) and 40.8% (T2), and mesopores by 7.5% (T2) while reducing micropores by 17.8% to 31.1%. The 7.5% increase in mesopores induced by T2 (the primary water storage reservoir available to plants) was directly correlated with the 7.17% higher soil moisture content observed at the mature stage.

3.2. Soil pH

Soil pH was significantly affected by biochar-based fertilizer, increasing in the order T2 > T1 > CK (Figure 5). In 2021, compared with CK, soil pH under T1 and T2 significantly increased by 17.89% and 24.14%, while in 2022, it significantly increased by 8.68% 11.57%, respectively. There was no noticeable difference in soil pH between T1 and T2, including in 2021 and 2022.

3.3. Soil Available and Total Nutrients

There were noticeable effects of different kinds of biochar application on soil nutrient contents (Table 5). In the mature stage, the availability of nutrients and SOM content were in order of T2 > T1 > CK. Soil nutrient content under T1 was similar to that of CK in 2021, while TP and TK contents under T1 in 2022 were 19.44% and 9.07% higher than those under CK, respectively, and significant differences were observed. Compared with CK, TN, TP, and TK content under T2 in 2021 significantly increased by 16.25%, 32.5%, and 12.02% respectively, when in 2022, it increased by 14.67%, 19.44%, and 10.36%, respectively. In comparison with T1 treatment, soil total nutrient content under T2 increased in 2022; TN, TP, and TK content increased by 17.71%, 17.78%, and 10.69%, respectively. Biochar-based fertilizers could improve the availability of soil nutrients. AN and AK under the biochar-based fertilizer application significantly increased when compared with CK. AN under T1 and T2 was 6.07–19.68% and 7.31–21.60% higher than that under CK, respectively. While AK under T1 and T2 increased by 42.00–21.15% and 43.99–32.93%, respectively, in comparison with CK. Compared with CK, AP under T1 significantly increased by 6.93% in 2021, while under T2, it significantly increased by 11.69% and 20.76%, respectively, in 2021 and 2022. When compared with T1 treatment, AP under T2 observably increased by 4.45% in 2021. Compared with CK, SOM content under T1 in 2022 increased by 15.81%, while that under T2 increased by 6.82% and 22.72%, respectively, in 2021 and 2022. SOM content under T2 was 4.41% and 5.97% higher than that under T1 treatment, respectively, in 2021 and 2022.

3.4. Soil Enzyme Activity

From the results of the analysis of soil physicochemical properties in 2021 and 2022, significant differences were mainly found in 2022. Therefore, the soil enzyme activities were further analyzed in 2022, and the results are shown in Table 6. Sucrase activity of soil increased with the biochar application, and under T1 and T2, it increased by 16.44% and 16.70%, respectively, compared with CK. The change of sucrase activity between T1 and T2 was nonsignificant. No significant difference was observed in the activity of urease and acid phosphatase among the three treatments.

3.5. Bacteria

3.5.1. Alpha Diversity

To further explore the effects of different biochar-based fertilizers on the soil microenvironment, we investigated the rhizosphere bacterial community structure and composition. We measured the ACE, Chao 1, and Shannon indices to evaluate the alpha diversity of the bacterial communities under different fertilizer treatments. The ACE and Chao 1 indices were used to indicate the abundance of the bacterial community. The Shannon index was used to indicate the diversity of the bacterial community, which was positively correlated with abundance and diversity.
The rhizosphere soil under T2 showed a high abundance and diversity of bacteria in 2021 and 2022 (Table 7). However, among the three treatments, the differences in the alpha diversity indices were nonsignificant.

3.5.2. Relative Abundance of Major Bacterial Taxa

The common and unique OTUs based on the 16s rRNA sequences of the soil samples were analyzed. In 2021, 11,104 OTUs were collectively identified from all soil samples, of which 1292 OTUs were common across all samples (Figure 6a). The relative frequencies of unique OTUs were as follows: T2 (2007) > CK (1478) >T1 (1089). In 2022, 9914 OTUs were identified; of those OTUs, 4154 were common across all soil samples (Figure 6b). The occurrence of total OTUs was as follows: T2 (7677) > T1 (6843) > CK (6741). Thus, the soil in T2 had the highest number of OTUs.
There were 40 phyla, 86 classes, 213 orders, 336 families, and 610 genera in all bacterial communities in the first ratoon, and 36 phyla, 99 classes, 244 orders, 386 families, and 736 genera in the second ratoon (Figure 7). The dominant phyla in 2021 were consistent with those in 2022, mainly including Proteobacteria (26.47–34.23%), Acidobacteriota (21.41–27.63%), Actinobacteriota (5.17–15.22%), Chloroflexi (3.35–10.84%), Verrucomicrobiota (1.10–4.80%), and Gemmatimonadota (2.58–4.77%). Other dominant phyla changed from Firmicutes, Crenarchaeota, and Bacteroidetes in 2021 to Plantctomycetota, Myxococcus, and Armatimonadota in 2022.
The bacterial phyla and genera with high relative abundances (top 20) in 2022 were selected for differential analysis, and the results show significant differences in abundance (Figure 8). Three bacterial phyla with high relative abundances showed significant differences among the fertilizer treatments (Figure 8). Compared with those of CK, the relative abundances of Gemmatimonadota and Latescibacterota in T2 significantly increased by 48.48% and 116.92% and were 47.77% and 97.11% higher than those in T1, respectively. Methylomirabilota was upregulated by 114.37% in T2 compared with that in T1.
Four bacterial genera with high relative abundances showed noticeable differences among the three fertilizer applications (Figure 8). In comparison with those of CK, Sphingomonas was upregulated by 35.22% under T1, and Vicinamibacteraceae was upregulated by 125.77%, and under T2, Acidothermus was downregulated by 39.55%. When compared with T1 treatment, the relative abundance of Bradyrhizobium under T2 significantly decreased by 24.67%.
In the mature stage, 25 bacterial biomarkers were exposed to different fertilizer treatments in 2022 (Figure 9). The occurrence of bacteria among the treatments was as follows: T2 (17 biomarkers), T1 (six biomarkers), and CK (two biomarkers). At the genus level, bacterial biomarkers were identified as four genera (Sinomonas, Hirschia, Methylobacterium_Methylorubrum, KI89A_clade) under T1 and six genera (DS_100, Agromyces, WX65, SM1A02, MND1, PLTA13) under T2.

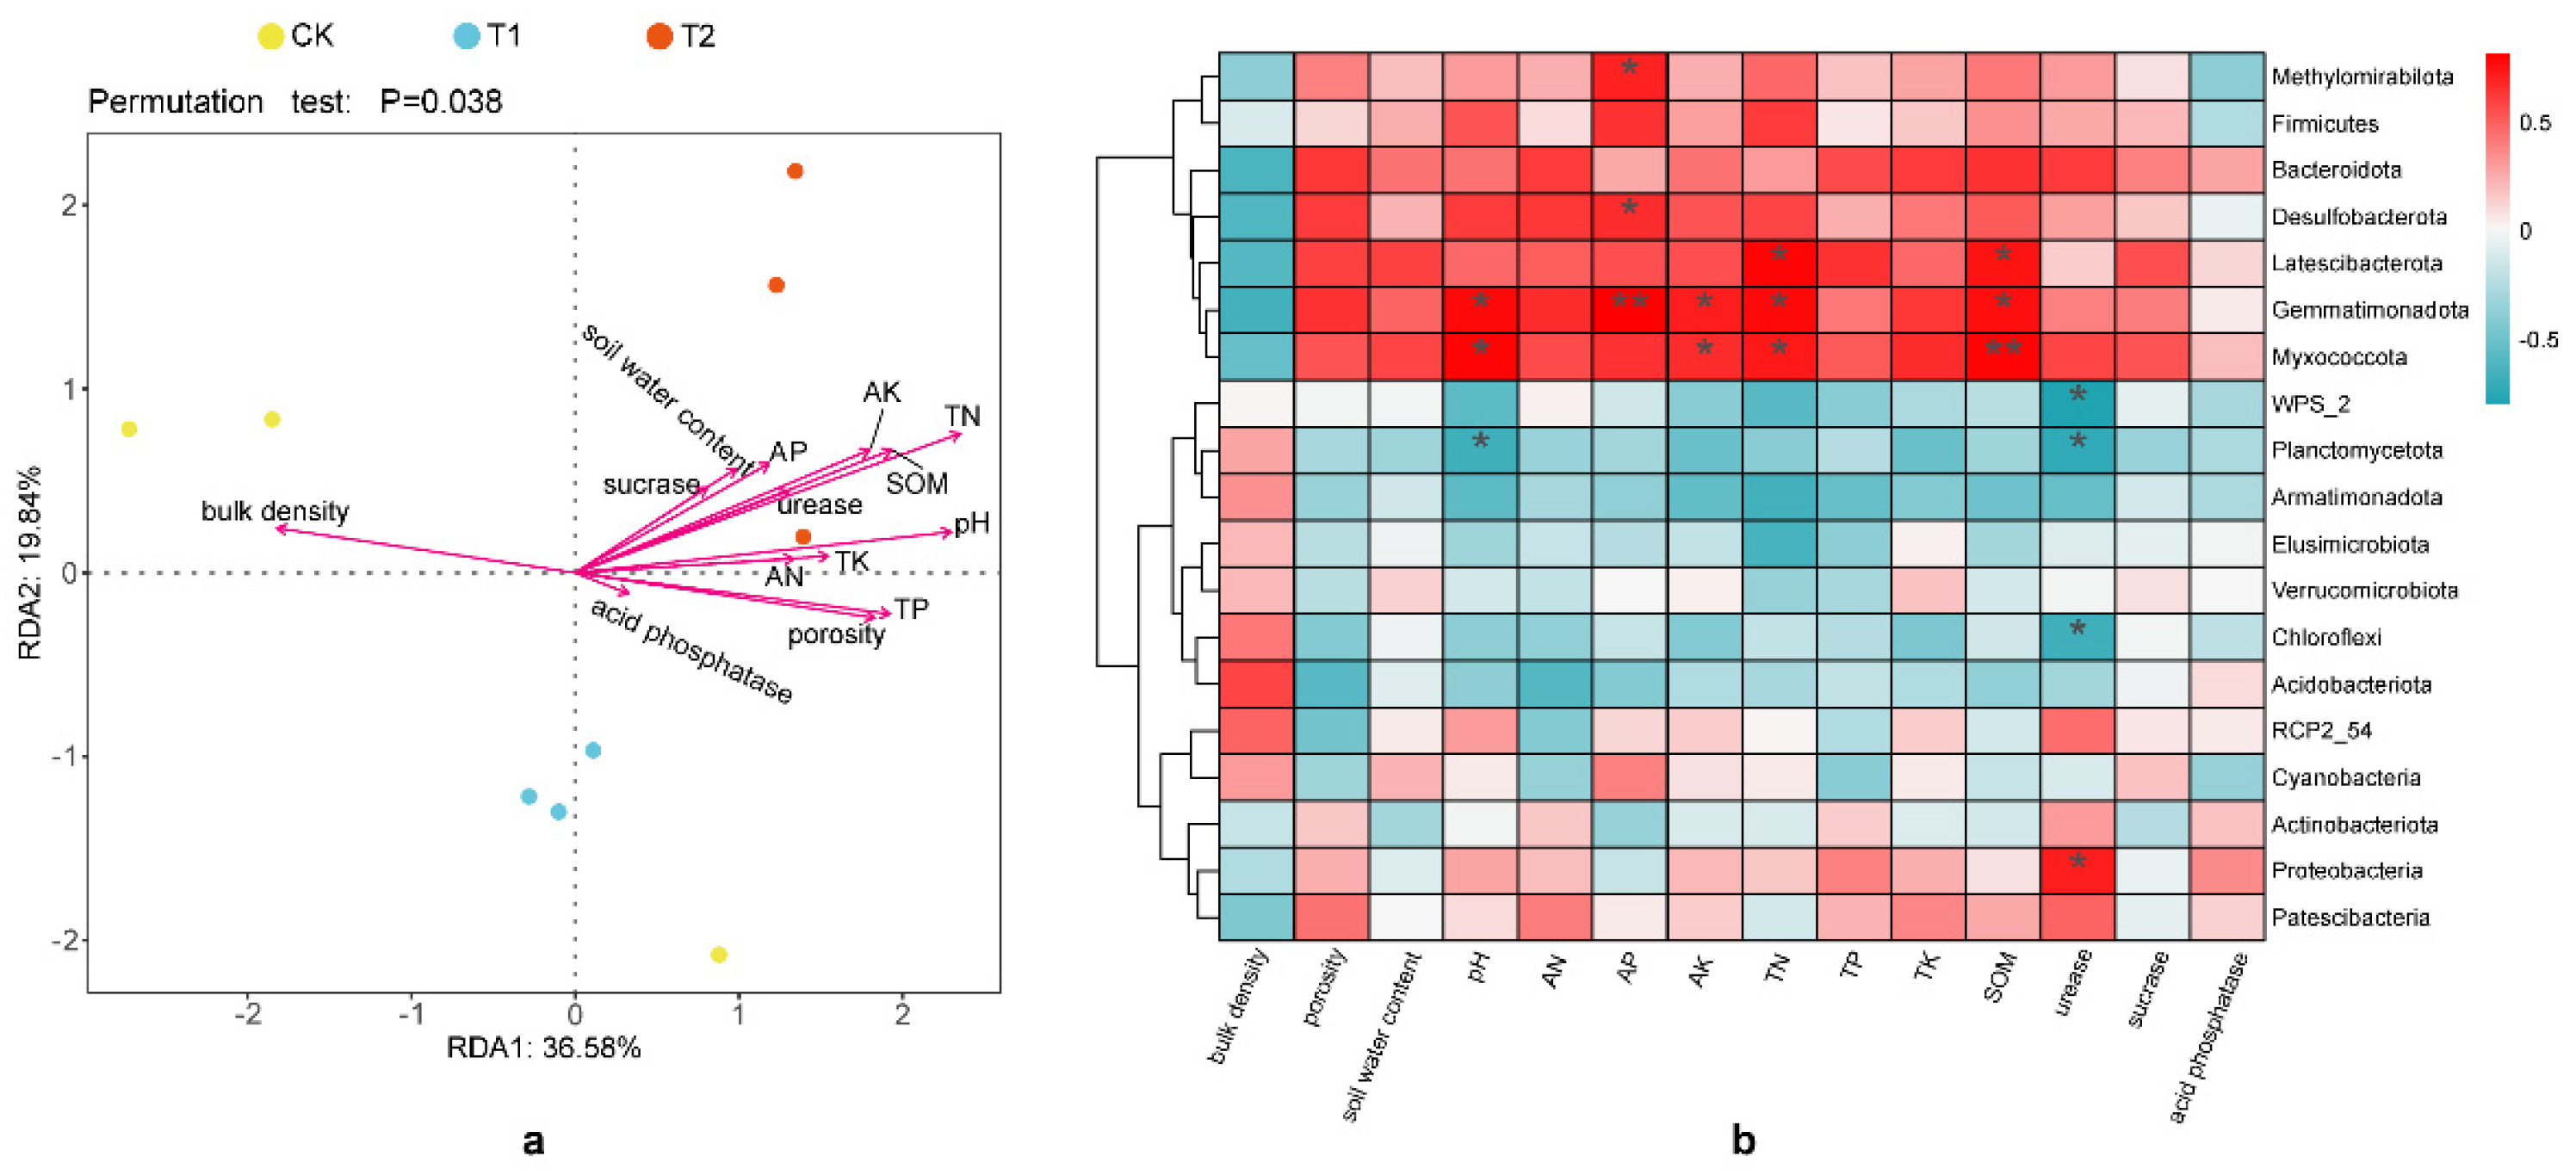
3.5.3. Associations Between Soil Bacterial Community and Environmental Factors

The relationship between the bacterial community and environmental factors in the rhizosphere soil in 2022 was further analyzed. RDA was used to evaluate the influence of environmental factors on the soil bacterial community composition in the sugarcane rhizosphere soil at the phylum level (Figure 10a). The first and second axes of RDA explained 36.58% and 19.84% of the variation in the soil bacterial community affected by environmental factors, respectively. The first axis in Figure 10a was negatively correlated with soil bulk density (R2 = 0.61) and positively correlated with other soil properties, including soil water content (R2 = 0.38), porosity (R2 = 0.61), pH (R2 = 0.76), TN (R2 = 0.82), TP (R2 = 0.64), TK (R2 = 0.51), AN (R2 = 0.44), AP (R2 = 0.44), AK (R2 = 0.64), SOM (R2 = 0.68), urease (R2 = 0.46), sucrase (R2 = 0.31), and acid phosphatase (R2 = 0.11). The second axis was positively correlated with soil bulk density, water content, pH, TN, TK, AN, AP, AK, SOM, urease, and sucrase activity, and negatively correlated with soil porosity, TP, and acid phosphatase activity. Soil pH (p = 0.02), TN (p = 0.007), TP (p = 0.046), AK (p = 0.048), and SOM (p = 0.03) significantly affected the bacterial community under different fertilizer applications (p < 0.05), indicating that soil pH, TN, TP, AK, and SOM were the major environmental factors affecting bacterial community structure.
The Spearman correlation heatmap of the bacterial communities with soil properties, including the relative abundances of the top 20 bacteria at the phylum level, is shown in Figure 10b. The results of the Spearman’s rank correlation heatmap showed that Gemmatimonadota and Myxococcota were positively correlated with soil pH, TN, AK, and SOM. Planctomycetota was negatively correlated with soil pH, and Latescibacterota was positively correlated with soil TN and SOM.
To further understand the relationship between bacterial communities and environmental factors, a Spearman correlation heatmap between bacterial genera of the top 20 relative abundances and soil indices in 2022 was drawn, and the cluster on the left was the phylum (Figure 11). Vicinamibacteraceae was positively correlated with soil porosity, pH, TN, AN, AP, and SOM, and negatively correlated with soil bulk density. TK10 and Sphingomonas were positively correlated with soil porosity, AN, and TK, and negatively correlated with soil bulk density. Rhodanobacter was positively correlated with urease activity. Acidothermus was positively correlated with soil bulk density and negatively correlated with soil porosity, water content, pH, TN, TK, AP, AK, and SOM content. Actinospica was negatively correlated with pH, TN, TP, TK, AK, and SOM content. JG30_KF_AS9 and Subgroup_2 were positively correlated with soil bulk density and negatively correlated with soil porosity and AN. WD2101_soil_group was negatively correlated with soil pH and urease activity. The results showed that Acidothermus, Sphingomonas, and Vicinamibacteraceae were the major bacterial genera that responded to environmental changes.

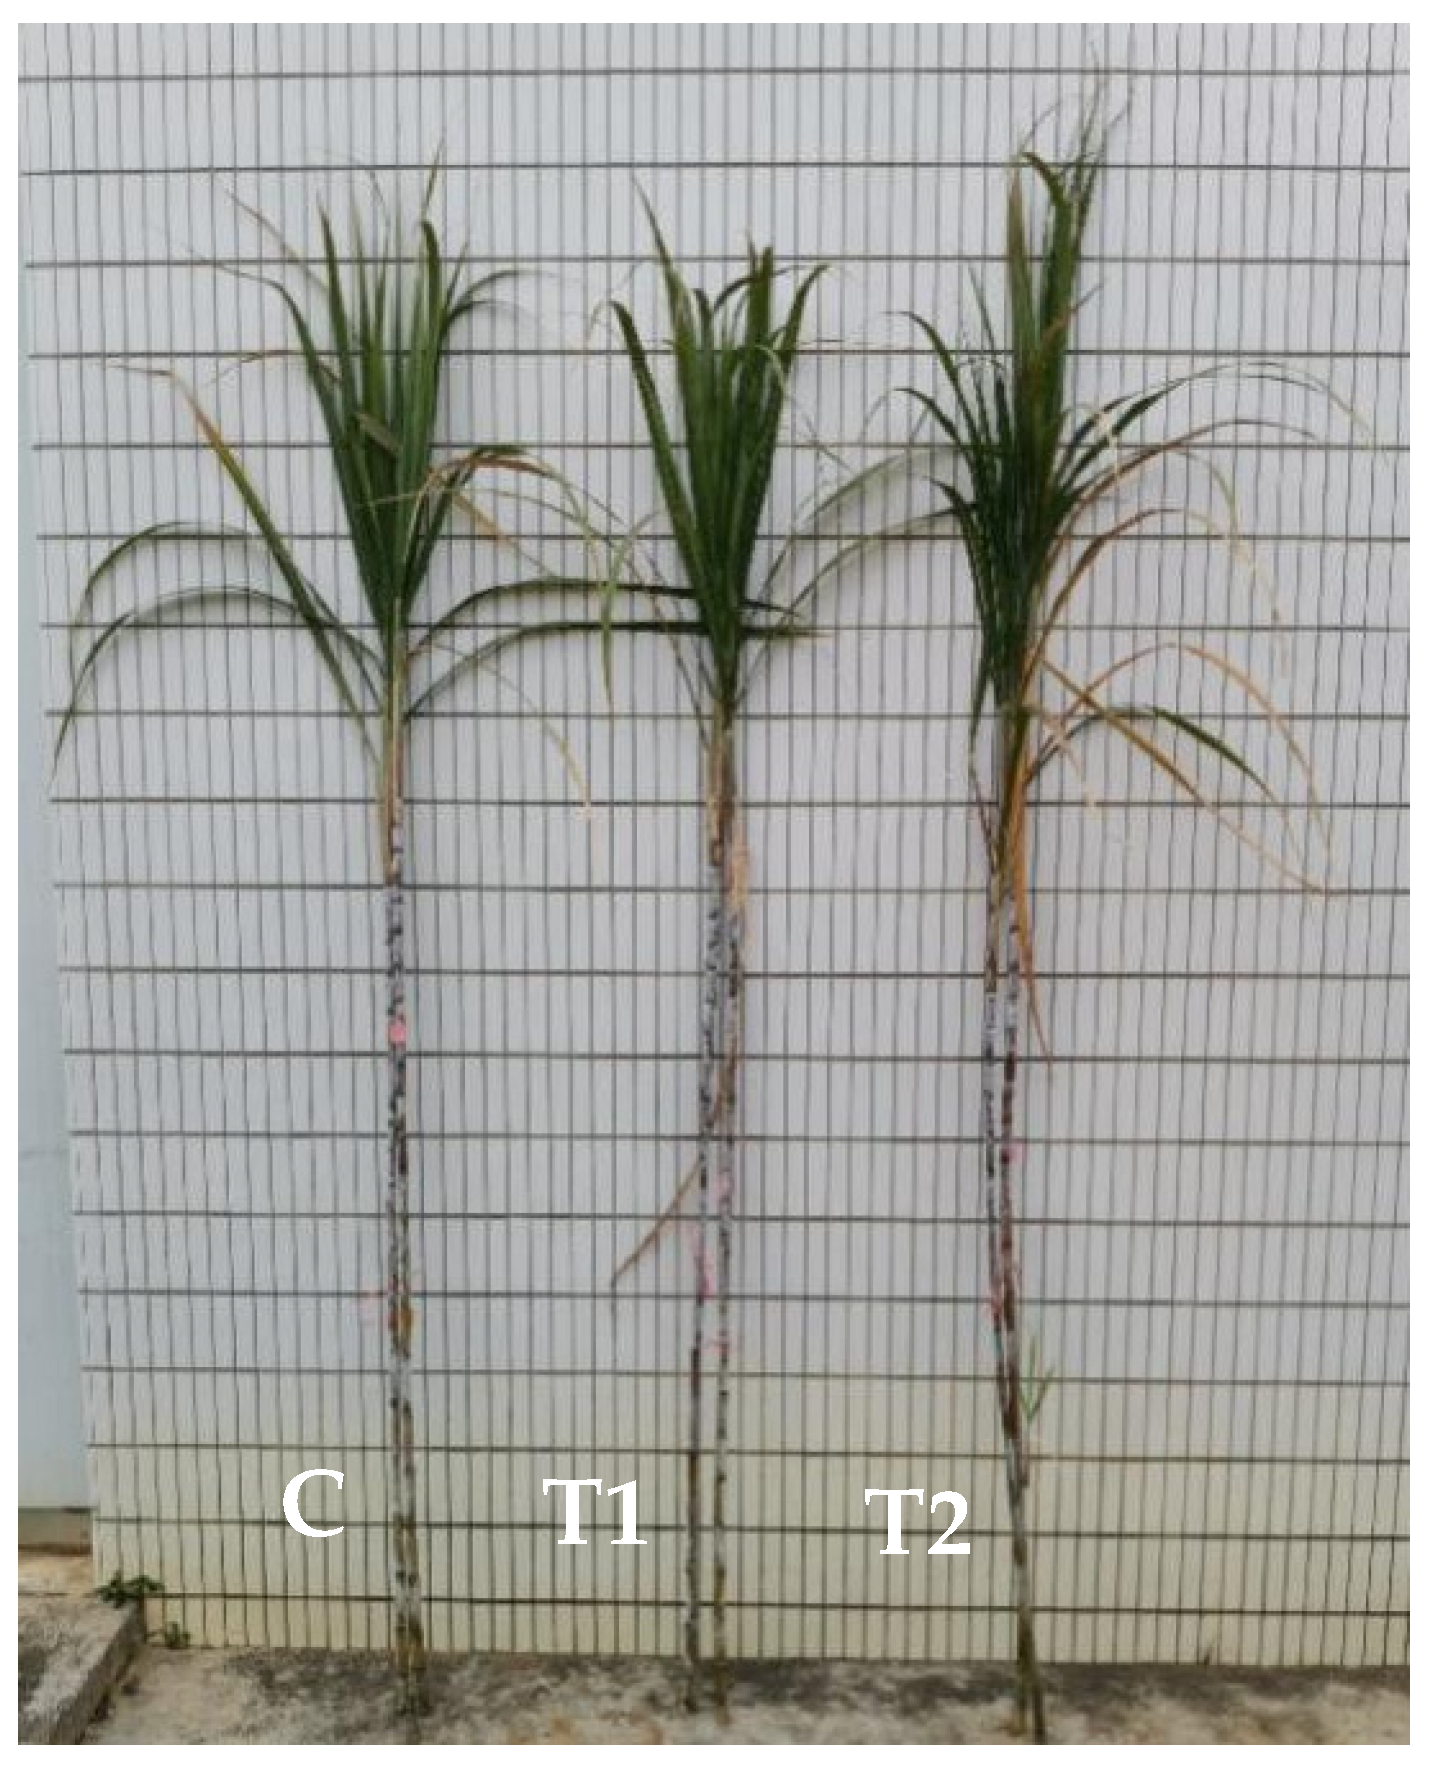
3.6. Agronomic Traits and Yield

Agronomic traits varied from fertilizer to fertilizer in different degrees. The values of plant height, stem diameter, single stem weight, and number of effective stems followed the following order among all treatments: SFM > T1 > CK (Table 8). The results indicated that biochar of sugar filter mud made a great impact on sugarcane agronomic traits.
Compared with CK in 2021, plant height under T1 and T2 increased by 0.82% and 1.38%, respectively, and the difference was significant (Table 8). In 2022, there was no noticeable difference in plant height among the three treatments, possibly because of the large degree of variation in the sample (Figure 12). Stem diameter under T2 significantly increased and was 2.60–4.86% and 2.24–5.86% higher than that under CK and T1 treatment, respectively. The variation trend in the single stem weight was the same as that in stem diameter, and that under T2 was 6.38–6.22% and 5.49–5.13%, respectively, compared with CK and T1 treatment. The effect of the biochar-based fertilizer on the number of effective stems was mainly in second year. In 2021, the differences were nonsignificant, while effective stem number under T1 and T2 increased by 12.35% and 6.45%, respective as compared with CK in 2022. And that under T1 was 5.54% higher than that under T1 treatment, and significant differences were observed in 2022.
In addition, biochar-based fertilizer can improve sugarcane yield, and the value of yield was in order of SFM > T1 > CK. Compared with CK, sugarcane yield under T1 was nonsignificantly different in 2021, but noticeably increased by 7.37% in 2022. T2 significantly increased sugarcane yield, which was 7.22–19.36% higher than that under CK. When compared with T1 treatment, sugarcane yield under T2 increased by 5.63–11.16%, and a significant difference was observed. Sugar content was affected by the biochar application in the short term (in 2021), which under T1 and T2 significantly increased by 6.45% and 7.75%, respectively, compared with CK. No significant difference was observed in 2022. This may be because sugar accumulation in sugarcane, a genetic control process, is too complex to achieve long-term improvement of sugar by the biochar-based fertilizer.

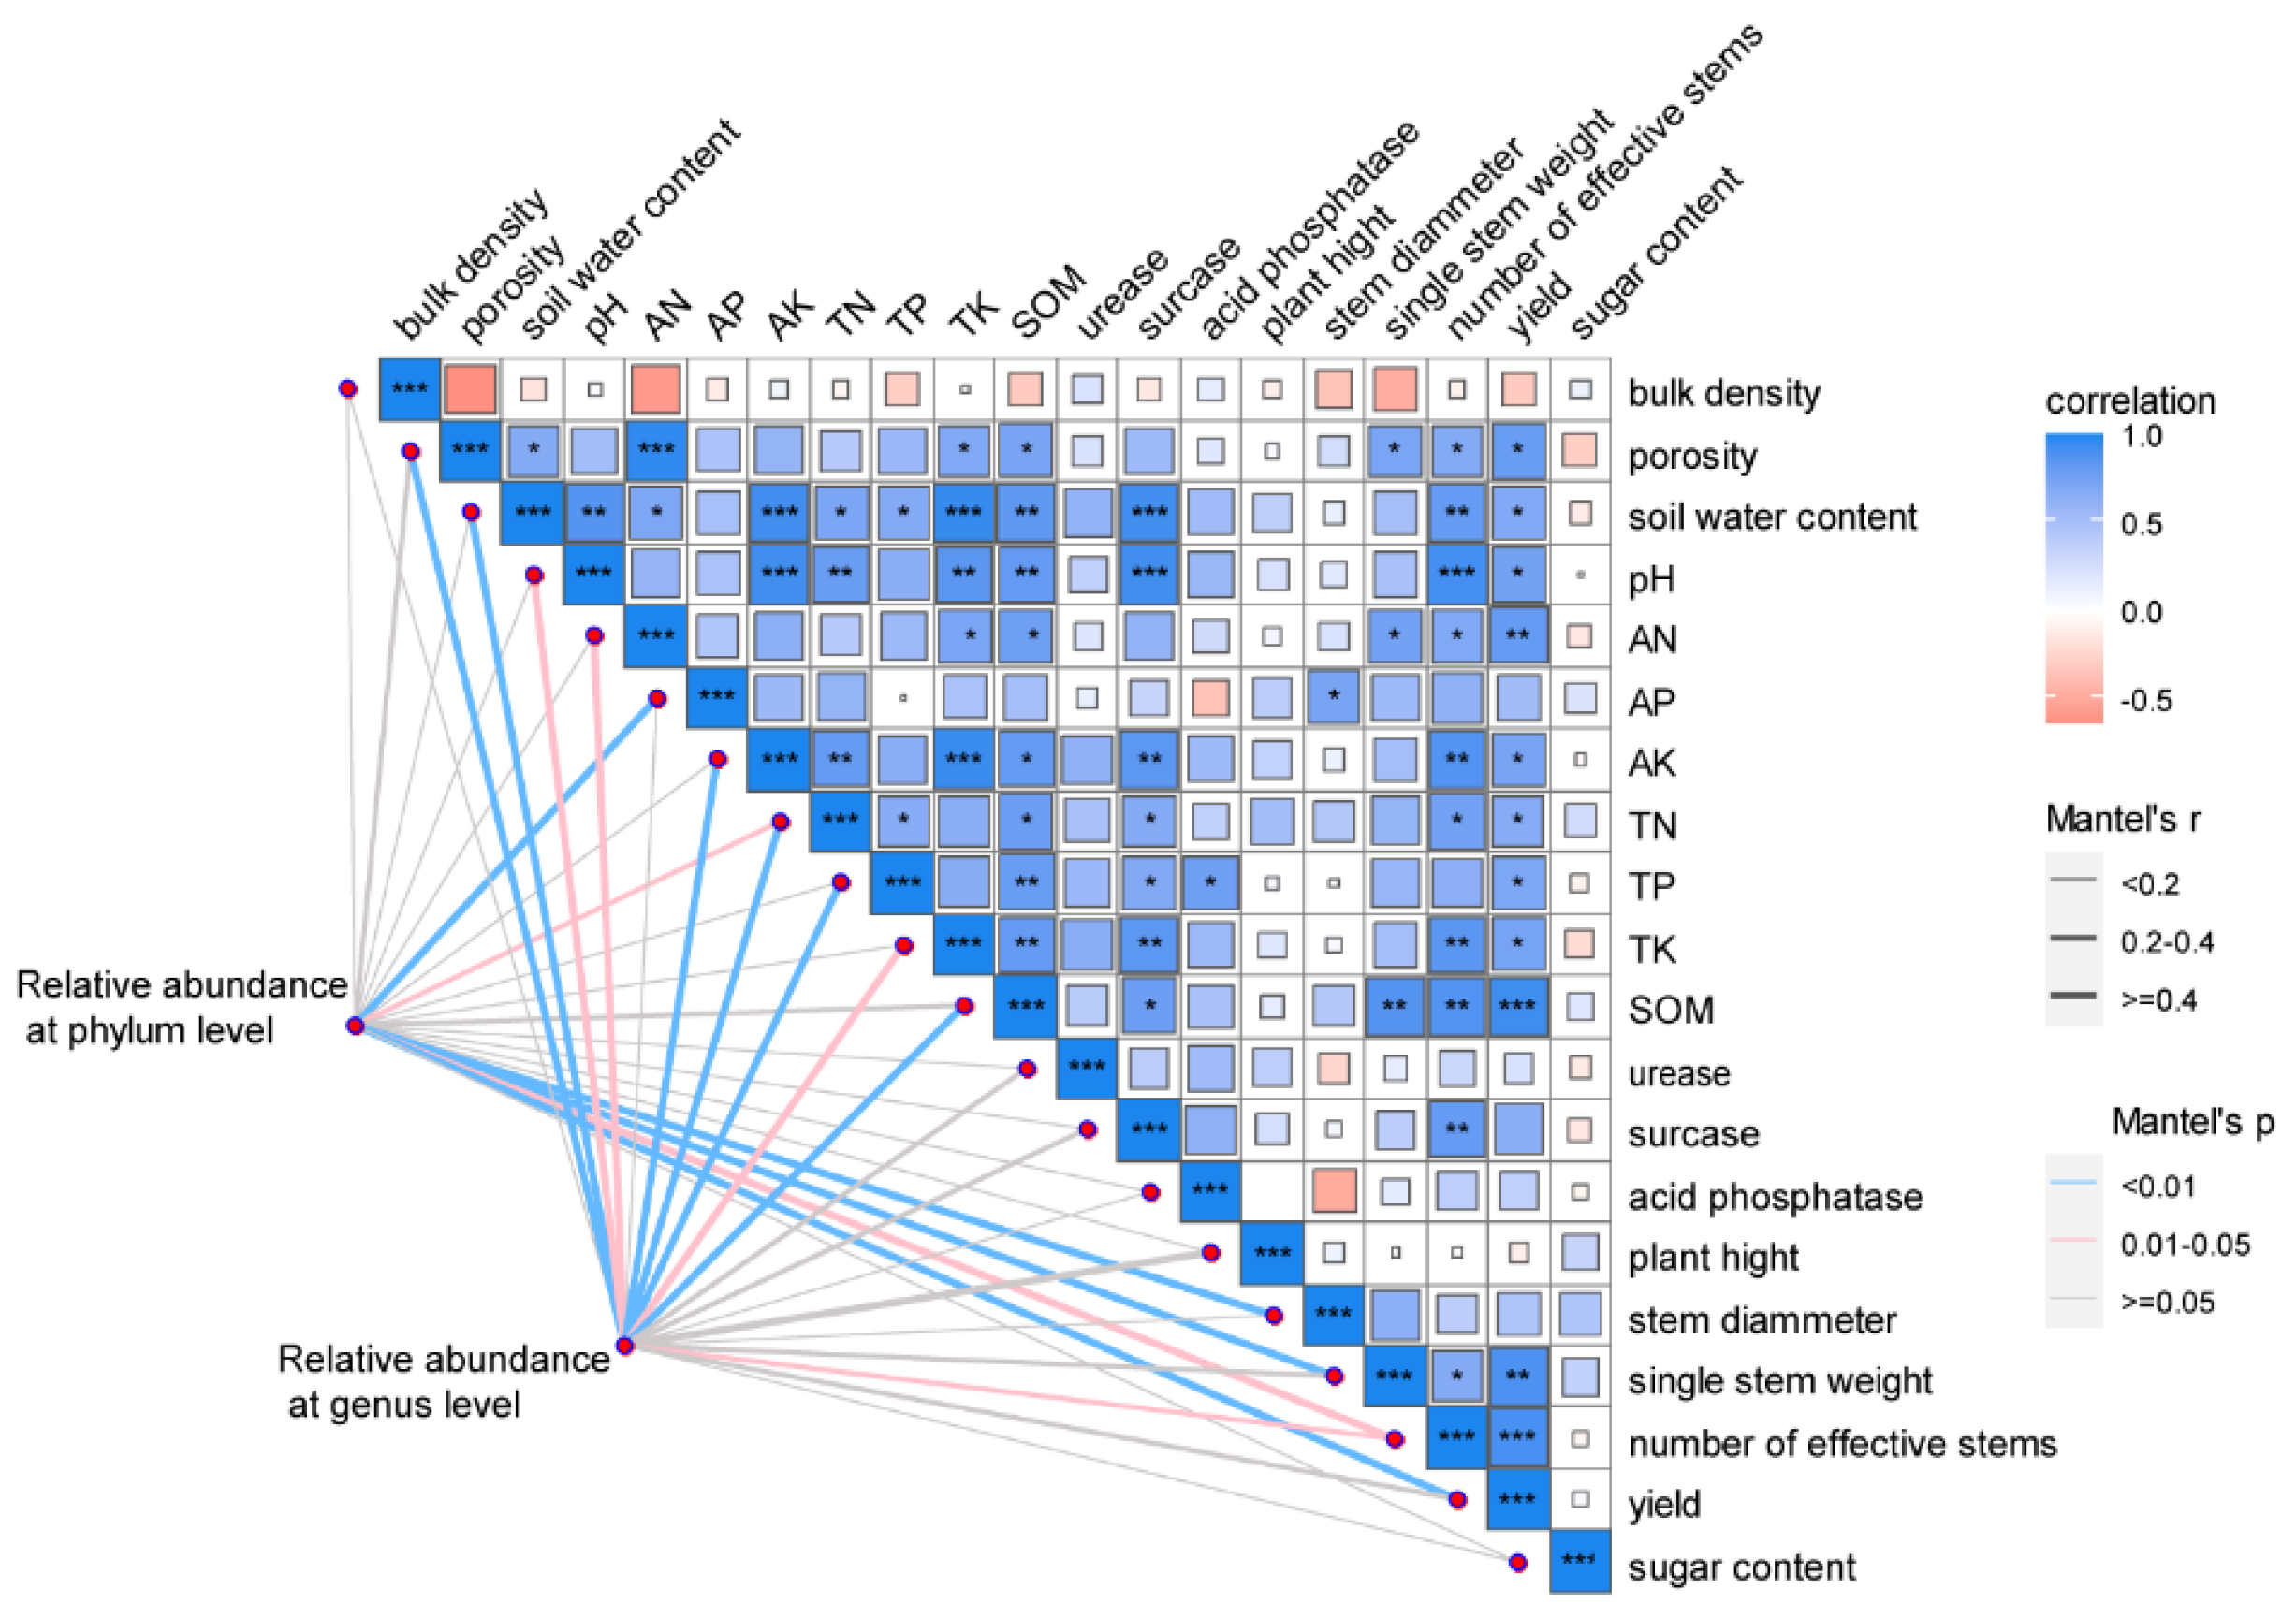
3.7. Correlation Analysis

To further understand the effect of sugar filter mud biochar-based fertilizers on sugarcane yield, we analyzed the correlations between soil environmental factors and sugarcane yield and their relationship with different bacterial phyla (including Gemmatimonadota, Latescibacterota, and Methylomirabilota) and genera (including Acidothermus, Sphingomonas, and Vicinamibacteraceae). As shown in Figure 13, the sugarcane stem yield was significantly and positively correlated with soil porosity, water content, pH, AN, AK, total nutrients, and SOM content. Among the yield component factors, the number of effective stems was also significantly and positively correlated with soil sucrase activity, and single stem weight was significantly and positively correlated with soil porosity, AN, and SOM. Among the soil physical and chemical indices, AN was positively correlated with soil porosity and water content; AK was positively correlated with soil water content, pH, and sucrase activity; and SOM was positively correlated with soil porosity, water content, pH, and sucrase activity. The relative abundance of different bacterial phyla was significantly correlated with agronomic traits and stem yield, while that of different bacterial genera was significantly correlated with soil physicochemical indices.

4. Discussion

4.1. Biochar-Based Fertilizers Improved Soil More than Chemical Fertilizers

Biochar has been widely used as a soil conditioner and fertilizer owing to its unique and advantageous structural characteristics [10,11,12,13]. Yang et al. [45] demonstrated an increase in pH and SOM content in tea orchard soil with the application of biochar-based fertilizers compared with the soil under chemical fertilization. In our study, bulk density under T1 and T2 was 2.33% lower than that under CK, and soil porosity under T1 and T2 increased by 2.00% and 2.31% compared with CK in the mature stage of 2022, respectively. Wu et al. [46], revealed that biochar-based fertilizers from tobacco stem and bamboo feedstocks significantly increased soil pH. In our study, compared with CK, soil pH under T1 and T2 significantly increased by 17.89% and 24.14%, while in 2022, it significantly increased by 8.68% and 11.57%, respectively. Many studies have revealed the positive effects of the application of biochar and biochar-based fertilizers on the soil environment, including enhancing the capacity of soil cation exchange and water and nutrient retention, improving the soil organic matter content and microbial community structure, and facilitating root growth and crop yield [47,48,49]. In our study, in 2021, compared with CK, soil water content T1 and T2 significantly increased by 4.29% and 7.17%, while in 2022, it significantly increased by 10.46% and 13.05%, respectively. Biochar has a porous structure, high specific surface area, and hydrophilic functional groups, which are conducive to stimulating an increase in soil porosity [50] and forming tiny soil aggregate structures from the combination of biochar-based fertilizers and soil, delaying the loss of water and nutrients in the soil. In our study, the surface of straw biochar was slightly rough, with few pores and some platy particles attached (Figure 3a). Sugar filter mud biochar was distributed in irregular clumps, and its rough surface had quite a few distinct apertures (Figure 3b). The increase in macropores under T2 (Table 4) directly corroborates improved soil structure, facilitating root growth and gas exchange—key factors in sugarcane’s response to Fenlong-ridging [34]. More apertures would produce a larger specific surface area. The intrinsic characteristics of biochar, including ash, carbonates, and negative functional groups, can promote the regulation of soil acidity/alkalinity. Notably, environmental factors may limit large increases in soil porosity [25,51,52].
Additionally, the inherent nutrients of biochar allow biochar-based fertilizers to input large amounts of foreign N, K, P, and carbon into the soil [34]. In this study, TP and TK content under T1 in 2022 were significantly, 19.44% and 9.07%, higher than those under CK, respectively. And compared with CK, TN, TP, and TK content under T2 in 2021 significantly increased by 16.25%, 32.5%, and 12.02%, when in 2022, it increased by 14.67%, 19.44%, and 10.36%, respectively. Biochar enhanced soil nitrification [53] and NH4-N absorbance, reducing its loss and increasing the availability of N [54]. Therefore, the increase in the soil nutrient content after applying biochar-based fertilizers was attributed to the import of exogenous nutrients from biochar into the soil and the reduction in leaching loss by the gradual release of the nutrients in biochar-based fertilizers, being adsorbed in the pore structure of biochar [55], the high activity of sucrase and microorganisms, and the enhanced mineralization of organic matter. In this study, sucrase activity of soil increased with the biochar application, and under T1 and T2, it increased by 16.44% and 16.70%, respectively, compared with CK. Owing to their unique pore structure and abundant organic matter, these fertilizers also enhanced metal retention [55,56] and stimulated the activity of enzymes and microorganisms involved in soil nutrient cycling [57,58].
However, in this study, we found that biochar-based fertilizer application had a nonsignificant effect on soil bacterial alpha diversity in 2021 and 2022. Xiang et al. [59] posited that soil characteristics, particularly the carbon-to-nitrogen ratio, dominate changes in alpha diversity indices. In our study, the soil carbon-to-nitrogen ratio under each treatment was similar, possibly resulting in a nonsignificant difference in alpha diversity. The stability in alpha diversity alongside functional shifts can be attributed to functional redundancy within microbial communities, where distinct taxa perform similar ecological roles [60]. In this study, the data support this mechanism: Despite unchanged diversity indices (Shannon: CK = 5.2 ± 0.3, T1 = 5.1 ± 0.4, T2 = 5.3 ± 0.2), we observed significant increases in sucrase activity (↑ 16.4–16.7%) and nutrient cycling efficiency (e.g., 32.5% TP increase). This indicates that biochar enriched functionally specialized taxa without altering overall diversity, consistent with studies showing functional redundancy in soil microbiomes under organic amendments [61].
Furthermore, we found that biochar-based fertilizers regulated bacterial composition in 2022, for example, by increasing the relative abundance of Sphingomonas, a beneficial bacterium for fixing nitrogen; dissolving phosphate; and promoting plant growth. According to the biochar feedstock, the extent of regulation by the biochar-based fertilizer was inconsistent.
In summary, our results, consistent with those in the literature, showed that biochar-based fertilizers were more beneficial than chemical fertilizers in improving soil physical properties, nutrient activation, enzyme activity, and bacterial structure.

4.2. Sugar Filter Mud Biochar-Based Fertilizers Improved Soil More than Straw Biochar-Based Fertilizers

Biochar can be produced from various feedstocks, including organic and industrial wastes, plant-based materials, and wood-based products. The raw material is a crucial factor affecting the application of biochar-based fertilizers to the soil environment and crop growth [62,63]. In the literature, the effects of straw biochar-fertilizers on soil properties, soil pH, organic matter content, and microbial community structure are known to be better than those of bamboo biochar-fertilizers (He et al. [26]; Wu et al. [46]). Wu et al. [46] demonstrated that compared with those under corn straw biochar, soil acid phosphatase activity increased, and the activity of urease and invertase decreased under paddy straw biochar. The differences in the impacts of different biochar raw materials on the soil environment were also demonstrated by Liu et al. [64], who showed that compared with corn biochar, rape straw biochar increased the soil pH, diversity, and abundance of the bacterial community. In our study, the improvement in soil physical indices (i.e., soil porosity and water content) after the application of sugar filter mud biochar-based fertilizers was relatively higher than that of straw biochar-based fertilizers, but without noticeable differences among the different raw materials. In an existing study, a meta-analysis showed consistent results with similar magnitudes of increase in soil physical indexes [25]. Furthermore, raw materials, soil texture, climatic factors, and experimental conditions may affect soil physical properties after the application of biochar-based fertilizers [25,51,52], and biochar-based fertilizers were reported to significantly increase the availability of nutrients and the contents of AN and SOM in soil under Fenlong-ridging tillage [34].
In our study, the effects of biochar-based fertilizers on the soil chemical properties of the two raw materials were slightly different. Compared with those of T1, higher magnitudes of increases in soil nutrient content and sucrase activity, especially AP, TN, and SOM, were observed under T2. The reason for this difference may be that sugar filter mud biochar has a rough surface with more pores and a larger specific surface area than straw biochar. Therefore, under Fenlong-ridging tillage, there was an increase in opportunities for sugar filter mud biochar-based fertilizers to promote the formation of soil aggregates and adsorption of nutrients [51], enhancing the soil fertilizer retention ability. Moreover, the pH and mineral elements of sugar filter mud biochar were higher than those of straw biochar, which can provide a favorable soil environment for stimulating the growth of microorganisms and improving nutrient availability [65,66]. After applying biochar-based fertilizers, sucrase activity increased and was the highest under the T2. Sucrase is involved in the degradation of sucrose and metabolism of organic matter and plays a vital role in the enhancement of soil soluble nutrients [67]. Hence, the application of sugar filter mud biochar-based fertilizers may supply exogenous sucrose and absorb substrate for enzymatic reaction by the porous structure and adsorptive properties, providing additional binding sites for soil sucrase to improve enzyme activity, thus promoting nutrient activation and accumulation of SOM.
Changes in the bacterial community were mainly affected by the characteristics of the biochar-based fertilizers and their effects on the soil. On the one hand, the unique surface area and pore structure of biochar provide a habitat for bacteria that limits their exposure to harmful conditions. On the other hand, biochar-based fertilizers are rich in nutrients and show improved porosity, water retention, pH, and the interception of nutrients in the soil, which positively influence the growth and activity of bacteria in the soil [68,69,70]. According to the biochar feedstock, the characteristics of the biochar-based fertilizers and their application effects could change. We found that T2 had a relatively better impact on rhizosphere soil bacterial diversity and abundance in 2 years than T1, probably because of the similar carbon-to-nitrogen ratio in the soil. In all three treatments, the bacterial community phyla in the rhizosphere soil mainly consisted of Proteobacteria, Acidobacteria, Actinobacteria, and Chloroflexi, and our results are consistent with those of Liu et al. [71], who studied the changes in soil bacteria of sugarcane under Fenlong-ridging. A meta-analysis conducted by Xu et al. [72] showed a positive response of Gemmatimonadota to the biochar application. Ibrahim et al. [73] also demonstrated that the relative abundance of Gemmatimonadota under a combination of a fertilizer and cow manure biochar or pig manure biochar was higher than that under biochar alone.
At the phylum level, a significant increase in Gemmatimonadota, Latescibacterota, and Methylomirabilota in 2022 was observed under T2 compared with that under T1. A possible reason for this difference is that these characteristics prefer high pH and nutrient-rich soil environments [74,75,76]. We also found Methylomirabilota, Rokubacteriales, and WX65 in the soil in 2022, within the order Rokubacteriales. Studies have shown that Gemmatimonadota, Latescibacterota, and Methylomirabilota tend to prefer neutral and alkaline soil environments [74,75,76]. Additionally, soil physicochemical properties are important factors that affect the bacterial community [77]. Ivanova et al. [76] observed that the relative abundance of Rokubacteriales is positively correlated with pH and TN. The results of the RDA in our study were similar for 2022 and showed that pH, TN, AK, and SOM significantly affected the bacterial community (p < 0.05). The effects of biochar-based fertilizer application on the microbial community were also notable (p = 0.038 < 0.05). Gemmatimonadota was positively correlated with pH, TN, AP, AK, and SOM; Latescibacterota was positively correlated with TN and SOM; and Methylomirabilota was positively correlated with AP.
At the genus level, the correlation between the microbial community and soil environmental factors was further analyzed for 2022. We found that sugar filter mud biochar-based fertilizers affected the soil environment mainly by Acidothermus, Sphingomonas, and Vicinamibacteraceae. Acidothermus, within the phylum Actinobacteria, was negatively correlated with soil pH and positively correlated with bulk density. Sphingomonas and Vicinamibacteraceae are beneficial bacteria. Sphingomonas belongs to the phylum Proteobacteria and is advantageous for improving the stress resistance of plants [78]. Sphingomonas is mostly involved in nitrogen fixation and mineralization [79]. Yi et al. [80] identified that the growth of Vicinamibacteraceae, within the phylum Acidobacteriota, is related to AN content. Increases in the relative abundance of Sphingomonas and Vicinamibacteraceae after the biochar-based fertilizer application were reported, and these were positively correlated with available nutrients in the soil [45,80,81], which is consistent with our results. Compared with those under T1, the relative abundances of Acidothermus and Sphingomonas under T2 were slightly lower, and Vicinamibacteraceae showed the opposite trend. This result might be attributed to the greater improvement in nutrition, water, and air conditions of the soil under T2 (sugar filter mud biochar-based fertilizers) than under T1 [68,69,70]. Furthermore, the regulation of bacterial communities can help activate nutrients and increase soil availability.
Our results demonstrate that sugar filter mud biochar-based fertilizers (T2) significantly improve soil properties and sugarcane yield compared to straw biochar (T1) and conventional fertilization (CK), primarily due to T2’s higher specific surface area (18.79 vs. 4.43 m2 g−1) and nutrient-rich composition. These characteristics enhanced soil porosity, nutrient retention, and microbial activity, aligning with prior studies on biochar’s role in tropical soils [72,73]. Overall, sugar filter mud biochar-based fertilizers improved soil structure and nutrient storage, sequentially regulated the activity of enzymes and the abundance of beneficial bacteria, and increased the availability of nutrition more than straw biochar-based fertilizers.

4.3. Sugar Filter Mud Biochar-Based Fertilizers Were the Most Beneficial in Improving Sugarcane Yield

Crop yield and quality are vital for agricultural production. Biochar-based fertilizers have a remarkable application value in increasing crop yield and quality. Biochar-based fertilizer application under Fenlong-ridging presented a stronger root system and higher yield in sugarcane than traditional methods and is a promising new farm management practice for sustainably increasing sugarcane yield in the red soil region of South China [34]. Biochar combined with chemical fertilizers improved soil fertility and sugarcane growth, increasing stem weight and yield [18,19,34]. Biochar-based fertilizers under Fenlong-ridging tillage significantly improved soil physical and chemical properties, increased soil storage for nutrients, and enhanced root growth and nutrient uptake, leading to increased sugarcane yield [34]. In this study, compared with those of chemical fertilizers, the soil microenvironment and nutrient availability improved, and sugarcane yield increased (1.50–19.36%) after the application of the two biochar-based fertilizers (T1 and T2). Thus, biochar was shown to maintain favorable soil conditions, prevent nutrient loss, and promote microbial growth and activity. Furthermore, the comprehensive positive effects of T2 were greater than those of T1, particularly with respect to TN, AP, SOM content, and bacterial community, which might be attributed to the inherent characteristics of sugar filter mud biochar. Thus, the highest crop yield was observed under T2, the sugar filter mud biochar-based fertilizer.
Sugarcane yield is determined by the weight of a single stem and the number of effective stems. Appropriate fertilization can promote the formation of effective tillers, increasing sugarcane yield. In 2021, a significant increase in yield was observed under T2, which mainly contributed to stem weight. In 2022, T1 and T2 significantly increased sugarcane yield compared with that in 2021, mainly contributing to stem weight and the number of effective stems. Changes in the physical and chemical properties of the soil and the microbial community can affect the formation of stalks from sugarcane tillers. Studies have shown that increasing the nitrogen [82] and water content of the soil can improve the tillering rate of sugarcane. In 2021, the contents of TN, TP, TK, AP, and SOM under T2 were higher than those under CK and T1, resulting in the strongest soil fertility for absorption and utilization of sugarcane. Consequently, sugarcane under T2 was the thickest and most productive. In 2022, compared with that under CK, soil quality under T1 improved, which supported the tillering of sugarcane into stems. Furthermore, soil fertility under T2 remained at the highest level, especially in AP, TN, and SOM. The results of the correlation analysis between yield and environmental factors in 2022 showed that sugarcane stem yield was significantly correlated with soil porosity, water content, pH, nutrient availability, and SOM. Among the yield components, the environmental factors had a greater effect on the number of effective stems than on the weight of a single stem (Figure 13). In an existing study, regulating the community of beneficial and pathogenic microorganisms in the soil improved soil fertility to indirectly promote sugarcane tillering [83,84]. Interannual variability was observed: 2021 had 25% higher rainfall than 2022 (Figure 2), leading to greater residue decomposition and nutrient mineralization. This likely contributed to the higher sugarcane yield in 2021 (143.10 t/ha for T2 vs. 111.86 t/ha in 2022). Biochar’s water retention capacity mitigated yield loss in the drier year (2022), with T2 maintaining a 13.05% higher soil water content than CK (Figure 4c). Therefore, the sugar filter mud biochar-based fertilizers regulated the soil bacterial community to activate the nutrition of the soil by improving soil structure and preventing nutrient loss. N and K were activated by Acidothermus, Sphingomonas, and Vicinamibacteraceae, while P was activated by Gemmatimonadota, Latescibacterota, and Methylomirabilota. Finally, the growth and yield of the sugarcane were augmented.
Sugar filter mud biochar-based fertilizers were the most beneficial in improving the soil microenvironment and increasing the sugarcane yield under experimental conditions. However, the mechanism of action of biochar-based fertilizers is complex, and their application is affected by the type of crop and soil. A limitation of this study was its scope: we studied only soil physicochemical properties and bacterial communities in the red soil area of China under Fenlong-ridging. Thus, further research could examine the effects of different experimental conditions on fungi and the internal transcribed spacer. While sugar filter mud biochar-based fertilizers showed agronomic benefits, its large-scale adoption depends on economic viability. Sugar filter mud, a byproduct of sugar refining, offers a low-cost feedstock, but pyrolysis energy costs and logistics require evaluation. A preliminary cost analysis suggests that yield increases of 5.6–11.2% could offset production expenses, though region-specific assessments are needed to confirm profitability for smallholders. Additionally, the mechanism of long-term application of sugar filter mud biochar-based fertilizers on soil–microorganism–crop systems requires further research to modify it according to the mechanism to develop favorable and environmentally friendly sugar filter mud biochar-based fertilizers for sugarcane planting. The 2-year study limits conclusions about long-term effects. Biochar’s stability may promote sustained carbon sequestration [11], but repeated applications could alter nutrient leaching patterns. For instance, while T2 reduced bulk density by 2.3%, its high porosity might accelerate leaching in high-rainfall regions. In the future, we will research multi-year trials with lysimeters to monitor N/P/K fluxes.

5. Conclusions

Biochar-based fertilizers had positive effects on soil properties and sugarcane yield under Fenlong-ridging. By improving the soil structure and nutrient retention, they can regulate the abundance of bacterial communities to increase nutrient availability in the soil, promoting nutrient uptake and increasing sugarcane production. However, these effects partly depend on the raw materials of biochar. The findings of this study showed that the comprehensive benefits of T2 (sugar filter mud biochar-based fertilizer) were better than those of T1 (straw biochar-based fertilizer), probably because of the inherent characteristics of sugar filter mud biochar (e.g., the larger the specific surface area, the higher the mineral element and SOM contents and alkalinity). Nonsignificant differences were observed in the alpha diversity of the soil bacterial community among the treatments. T2 significantly increased the abundance of Gemmatimonadota, Latescibacterota, Methylomirabilota, and Vicinamibacteraceae and decreased Acidothermus to increase AN, AP, and AK. Additionally, T2 had a higher sugarcane yield than T1 and can be considered a promising fertilizer for sustainably increasing sugarcane yield under Fenlong-ridging in the red soil area of South China (Figure 14). However, to validate robustness and enable practical implementation, large-scale multi-site trials across Guangxi’s sugarcane belt are warranted. Economic viability necessitates partnerships with sugar mills to optimize biochar production from filter mud waste streams. The efficacy of T2 should also be evaluated for broader application in other economically vital acidic tropical crops (e.g., pineapple, cassava). Furthermore, future research must prioritize long-term monitoring to assess the persistence of soil carbon sequestration facilitated by T2 and conduct detailed fungal community profiling. These investigations are crucial for refining T2’s role within sustainable, high-productivity sugarcane cultivation systems and understanding its long-term ecological impacts.

Author Contributions

Conceptualization: B.W. and S.L.; methodology: S.Z., L.Y., B.W., S.L. and Z.L.; formal analysis and investigation: S.Z., P.L., L.Y., S.H., M.W., X.H., W.Z., J.X. and Z.L.; data curation: P.L., M.W., W.Z. and J.X.; validation: Z.L.; writing—original draft preparation: S.Z., L.Y. and S.L.; writing—review and editing: S.Z., P.L., L.Y., Z.H. and Z.L.; resources: B.W., S.H., Z.H. and Z.L.; funding acquisition: S.L.; supervision: S.L. All authors have read and agreed to the published version of the manuscript.

Funding

This work was supported by the Science and Technology Major Project of Guangxi (Guike AA20302020-3, Guike AA17204037-4, Guike AA22117006), Science and Technology Major Project of Chongzuo (FA2020006), and the National Natural Science Foundation of China (Grant No. 31871689, 31860159).

Data Availability Statement

Data available upon request from the authors.

Acknowledgments

We appreciate the partial support of Guangxi University and the Guangxi Academy of Science.

Conflicts of Interest

The authors declare no competing interests.

References

  1. Singh, R.K.; Singh, P.; Li, H.-B.; Song, Q.-Q.; Guo, D.-J.; Solanki, M.K.; Verma, K.K.; Malviya, M.K.; Song, X.-P.; Lakshmanan, P.; et al. Diversity of Nitrogen-Fixing Rhizobacteria Associated with Sugarcane: A Comprehensive Study of Plant-Microbe Interactions for Growth Enhancement in Saccharum spp. BMC Plant Biol. 2020, 20, 220. [Google Scholar] [CrossRef]
  2. Pang, Z.; Dong, F.; Liu, Q.; Lin, W.; Hu, C.; Yuan, Z. Soil Metagenomics Reveals Effects of Continuous Sugarcane Cropping on the Structure and Functional Pathway of Rhizospheric Microbial Community. Front. Microbiol. 2021, 12, 627569. [Google Scholar] [CrossRef]
  3. Thomaz, E.L.; Marcatto, F.S.; Antoneli, V. Soil Erosion on the Brazilian Sugarcane Cropping System: An Overview. Geogr. Sustain. 2022, 3, 129–138. [Google Scholar] [CrossRef]
  4. State Statistics Bureau. China Statistical Yearbook 2023; China Statistics Press: Beijing, China, 2023; ISBN 978-7-5230-0190-5.
  5. Pang, Z.; Tayyab, M.; Kong, C.; Liu, Q.; Liu, Y.; Hu, C.; Huang, J.; Weng, P.; Islam, W.; Lin, W.; et al. Continuous Sugarcane Planting Negatively Impacts Soil Microbial Community Structure, Soil Fertility, and Sugarcane Agronomic Parameters. Microorganisms 2021, 9, 2008. [Google Scholar] [CrossRef]
  6. Tian, L.; Shi, S.; Ma, L.; Lam-Son, P.T.; Tian, C. Community Structures of the Rhizomicrobiomes of Cultivated and Wild Soybeans in Their Continuous Cropping. Microbiol. Res. 2020, 232, 126390. [Google Scholar] [CrossRef]
  7. Lei, H.; Liu, A.; Hou, Q.; Zhao, Q.; Guo, J.; Wang, Z. Diversity Patterns of Soil Microbial Communities in the Sophora Flavescens Rhizosphere in Response to Continuous Monocropping. BMC Microbiol. 2020, 20, 272. [Google Scholar] [CrossRef]
  8. Gui, Y.; Li, H.; Wei, J.; Mao, L.; Zhang, R.; Ou, H.; Zhu, K.; Zhao, P.; Zhou, H.; Liu, X. Effects of biochar on soil nutrients, enzyme activities and microbial diversity of ratoon sugarcane in dry slope land. J. South Agric. 2022, 53, 776–784. [Google Scholar]
  9. Razzaghi, F.; Obour, P.B.; Arthur, E. Does Biochar Improve Soil Water Retention? A Systematic Review and Meta-Analysis. Geoderma 2020, 361, 114055. [Google Scholar] [CrossRef]
  10. Kamau, S.; Karanja, N.K.; Ayuke, F.O.; Lehmann, J. Short-Term Influence of Biochar and Fertilizer-Biochar Blends on Soil Nutrients, Fauna and Maize Growth. Biol. Fertil. Soils 2019, 55, 661–673. [Google Scholar] [CrossRef]
  11. Wan, Z.; Sun, Y.; Tsang, D.C.W.; Khan, E.; Yip, A.C.K.; Ng, Y.H.; Rinklebe, J.; Ok, Y.S. Customised Fabrication of Nitrogen-Doped Biochar for Environmental and Energy Applications. Chem. Eng. J. 2020, 401, 126136. [Google Scholar] [CrossRef]
  12. Shen, Y.; Yuan, R. Pyrolysis of Agroforestry Bio-Wastes with Calcium/Magnesium Oxides or Carbonates—Focusing on Biochar as Soil Conditioner. Biomass Bioenergy 2021, 155, 106277. [Google Scholar] [CrossRef]
  13. Xia, H.; Riaz, M.; Tang, X.; Yan, L.; El-Desouki, Z.; Li, Y.; Wang, X.; Cuncang, J. Insight into Mechanisms of Biochar-Fertilizer Induced of Microbial Community and Microbiology of Nitrogen Cycle in Acidic Soil. J. Environ. Manag. 2023, 336, 117602. [Google Scholar] [CrossRef]
  14. Lima, I.; Marshall, W.E. Utilization of Turkey Manure as Granular Activated Carbon: Physical, Chemical and Adsorptive Properties. Waste Manag. 2005, 25, 726–732. [Google Scholar] [CrossRef]
  15. Chan, K.Y.; Van Zwieten, L.; Meszaros, I.; Downie, A.; Joseph, S. Agronomic Values of Greenwaste Biochar as a Soil Amendment. Aust. J. Soil Res. 2007, 45, 629–634. [Google Scholar] [CrossRef]
  16. Chen, W.; Zhang, W.; Meng, J. Advances and prospects in research of biochar utilization in agriculture. Sci. Agric. Sin. 2013, 46, 3324–3333. [Google Scholar]
  17. Baiamonte, G.; Crescimanno, G.; Parrino, F.; De Pasquale, C. Effect of Biochar on the Physical and Structural Properties of a Sandy Soil. Catena 2019, 175, 294–303. [Google Scholar] [CrossRef]
  18. Fallah, N.; Yang, Z.; Tayyab, M.; Zhang, C.; Abubakar, A.Y.; Lin, Z.; Pang, Z.; Allison, A.; Zhang, H. Depth-Dependent Influence of Biochar Application on the Abundance and Community Structure of Diazotrophic under Sugarcane Growth. PLoS ONE 2021, 16, e0253970. [Google Scholar] [CrossRef]
  19. Butphu, S.; Rasche, F.; Cadisch, G.; Kaewpradit, W. Eucalyptus Biochar Application Enhances Ca Uptake of Upland Rice, Soil Available P, Exchangeable K, Yield, and N Use Efficiency of Sugarcane in a Crop Rotation System. J. Plant Nutr. Soil Sci. 2020, 183, 58–68. [Google Scholar] [CrossRef]
  20. Todd, J.; Glaz, B.; Irey, M.S.; Zhao, D.; Hu, C.-J.; El-Hout, N. Sugarcane Genotype Selection on a Sand Soil with and without Added Mill Mud. Agron. J. 2014, 106, 315–323. [Google Scholar] [CrossRef]
  21. Li, L.; You, X.; Sun, J.; Li, Z.; He, X. Review on utilization of sugarcane field wastes and sugar refining byproducts. Food Ind. 2013, 34, 170–173. [Google Scholar]
  22. Lin, Q.; Wei, F.; Lin, H.; Chen, T.; Zhou, Z. Present situation and countermeasure research of filter mud disposal of raw sugar mill in Guangxi. Yunnan Chem. Technol. 2019, 46, 69–70. [Google Scholar]
  23. Liu, H.; Zhang, W.; Li-Jiang, G.; Wang, Q.; Cheng, R.; Zhang, S. Effects of different biochars on phosphorus adsorption and desorption in brown soil. Soils 2023, 55, 1198–1206. [Google Scholar]
  24. Wang, J.; Xia, H.; Li, Y.; Wang, X.; Jiang, C. Effects of biochar from different feedstocks on soil nitrogen transformation and physicochemical properties in acid red soil. J. Huazhong Agric. Univ. 2022, 41, 61–70. [Google Scholar]
  25. Singh, H.; Northup, B.K.; Rice, C.W.; Prasad, P.V.V. Biochar Applications Influence Soil Physical and Chemical Properties, Microbial Diversity, and Crop Productivity: A Meta-Analysis. Biochar 2022, 4, 8. [Google Scholar] [CrossRef]
  26. He, L.; Zhong, Z.; Yang, H. Effects on Soil Quality of Biochar and Straw Amendment in Conjunction with Chemical Fertilizers. J. Integr. Agric. 2017, 16, 704–712. [Google Scholar] [CrossRef]
  27. Ibrahim, M.M.; Zhang, H.; Guo, L.; Chen, Y.; Heiling, M.; Zhou, B.; Mao, Y. Biochar Interaction with Chemical Fertilizer Regulates Soil Organic Carbon Mineralization and the Abundance of Key C-Cycling-Related Bacteria in Rhizosphere Soil. Eur. J. Soil Biol. 2021, 106, 103350. [Google Scholar] [CrossRef]
  28. Ding, Y.; Liu, Y.; Liu, S.; Li, Z.; Tan, X.; Huang, X.; Zeng, G.; Zhou, L.; Zheng, B. Biochar to Improve Soil Fertility. A Review. Agron. Sustain. Dev. 2016, 36, 36. [Google Scholar] [CrossRef]
  29. Chen, W.; Li, P.; Li, F.; Xi, J.; Han, Y. Effects of Tillage and Biochar on Soil Physiochemical and Microbial Properties and Its Linkage with Crop Yield. Front. Microbiol. 2022, 13, 929725. [Google Scholar] [CrossRef]
  30. Zhang, Y.; Guo, Y.; Zhang, L.; Liu, T.; Ji, Y. Effects of biochar combined with subsoiling on soil aggregates and organic carbon. Bull. Soil Water Conserv. 2022, 42, 368–375+385. [Google Scholar]
  31. Wang, M.; Tong, H.; Han, Y.; Li, P.; Chen, W.; Bi, Q. Effects of Deep Tillage and Fertilization on Wheat Yield and Physicochemical Properties of Lime Concretion Black Soil. Chin. J. Soil Sci. 2022, 53, 1431–1439. [Google Scholar]
  32. Jiang, B.; Xu, X.; Zhang, D.; Li, W.; Liang, S.; Xu, H.; Wang, Y.; Bai, X. Effect of biochar and tillage on nitrogen absorption and yield of maize under reduced fertilizer. J. Northeast Agric. Univ. 2019, 50, 23–31. [Google Scholar]
  33. Lu, H.; Zhang, X.; Li, L.; Fan, Y.; Zhang, M.; Zhang, Y.; Yan, X.; Liang, T.; Zhai, Z.; Daai, H. Effects of biochar on tobacco yield, quality and soil nutrients under deep tillage and green manure treatments. Tob. Sci. Technol. 2021, 54, 14–22. [Google Scholar]
  34. Xiao, J.; Zhu, S.; Han, S.; Wei, B.; He, Z.; Li, Z.; Li, R.; Wang, L.; Chen, L.; Li, S. Fenlong-Ridging Deep Tillage Integrated with Biochar and Fertilization to Improve Sugarcane Growth and Yield. Agronomy 2023, 13, 2395. [Google Scholar] [CrossRef]
  35. Wei, B. Fenlong cultivation-the fourth set of farming methods invented in China. Agric. Sci. Technol. 2017, 18, 2045–2048+2052. [Google Scholar]
  36. Wei, B.; Gan, X.; Li, Y.; Shen, Z.; Zhou, L.; Zhou, J.; Liu, B.; Lao, C.; Hu, P. Effects of once Fenlong cultivation on soil properties and rice yield and quality for 7 consecutive years. Agric. Sci. Technol. 2017, 18, 2365–2371. [Google Scholar]
  37. He, J.; Shi, W.; Liu, F.; Ma, Q.; Yang, Y.; Yang, J.; Cui, Y.; Chen, Y. Effects of Fenlong cultivation on soil key physical properties in arid areas. Agric. Res. Arid Areas 2023, 41, 195–201+228. [Google Scholar]
  38. Zhu, S.; Xiao, J.; Han, S.; Li, X.; Li, Z.; Wei, B.; Zhang, D.; Wang, R.; Li, R.; Yang, L.; et al. Transcriptomics Combined with Photosynthetic Physiology and Leaf Structure Analysis Revealed Increased Sugarcane Yield by Fenlong-Ridging. Agronomy 2023, 13, 1196. [Google Scholar] [CrossRef]
  39. Dao, J.; Fan, X.; Li, F.; Deng, J. Sugarcane Nutrition Management and Detection Technology; China Agriculture Press: Beijing, China, 2018; ISBN 978-7-109-24555-6. [Google Scholar]
  40. Bao, K. Soil Mineralogy; Science Press: Beijing, China, 2000. [Google Scholar]
  41. Bao, S. Soil Agrochemical Analysis, 3rd ed.; China Agriculture Press: Beijing, China, 2000. [Google Scholar]
  42. Guan, S. Soil Enzyme and Its Research Method; China Agriculture Press: Beijing, China, 1986. [Google Scholar]
  43. Bluman, A.G. Elementary Statistics: A Step by Step Approach, 6th ed.; McGraw Hill Higher Education: New York, NY, USA, 2007. [Google Scholar]
  44. Parks, D.H.; Tyson, G.W.; Hugenholtz, P.; Beiko, R.G. STAMP: Statistical Analysis of Taxonomic and Functional Profiles. Bioinformatics 2014, 30, 3123–3124. [Google Scholar] [CrossRef]
  45. Yang, W.; Li, C.; Wang, S.; Zhou, B.; Mao, Y.; Rensing, C.; Xing, S. Influence of Biochar and Biochar-Based Fertilizer on Yield, Quality of Tea and Microbial Community in an Acid Tea Orchard Soil. Appl. Soil Ecol. 2021, 166, 104005. [Google Scholar] [CrossRef]
  46. Wu, F.; Tong, C.; Zhang, W.; Liu, D.; He, Z.; Mao, Y. Effects of tobacco stalk biochar- and bamboo biochar-based fertilizers on carbon, nitrogen, and microbes in soil of tobacco field. Fujian J. Agric. Sci. 2023, 38, 109–115. [Google Scholar]
  47. Chen, Y.; Shinogi, Y.; Taira, M. Influence of Biochar Use on Sugarcane Growth, Soil Parameters, and Groundwater Quality. Aust. J. Soil Res. 2010, 48, 526–530. [Google Scholar] [CrossRef]
  48. Agegnehu, G.; Srivastava, A.K.; Bird, M.I. The Role of Biochar and Biochar-Compost in Improving Soil Quality and Crop Performance: A Review. Appl. Soil Ecol. 2017, 119, 156–170. [Google Scholar] [CrossRef]
  49. Hu, L.; Yang, Y.; Liu, X.H.; Li, S.; Li, K.; Deng, H. Effects of Bagasse Biochar Application on Soil Organic Carbon Fixation in Manganese-Contaminated Sugarcane Fields. Chem. Biol. Technol. Agric. 2023, 10, 46. [Google Scholar] [CrossRef]
  50. Głąb, T.; Palmowska, J.; Zaleski, T.; Gondek, K. Effect of Biochar Application on Soil Hydrological Properties and Physical Quality of Sandy Soil. Geoderma 2016, 281, 11–20. [Google Scholar] [CrossRef]
  51. Blanco-Canqui, H. Biochar and Soil Physical Properties. Soil Sci. Soc. Am. J. 2017, 81, 687–711. [Google Scholar] [CrossRef]
  52. Islam, M.U.; Jiang, F.; Guo, Z.; Peng, X. Does Biochar Application Improve Soil Aggregation? A Meta-Analysis. Soil Tillage Res. 2021, 209, 104926. [Google Scholar] [CrossRef]
  53. Berglund, L.M.; DeLuca, T.H.; Zackrisson, O. Activated Carbon Amendments to Soil Alters Nitrification Rates in Scots Pine Forests. Soil Biol. Biochem. 2004, 36, 2067–2073. [Google Scholar] [CrossRef]
  54. Mandal, S.; Thangarajan, R.; Bolan, N.S.; Sarkar, B.; Khan, N.; Ok, Y.S.; Naidu, R. Biochar-Induced Concomitant Decrease in Ammonia Volatilization and Increase in Nitrogen Use Efficiency by Wheat. Chemosphere 2016, 142, 120–127. [Google Scholar] [CrossRef]
  55. Liu, Y.; Lu, H.; Yang, S.; Wang, Y. Impacts of Biochar Addition on Rice Yield and Soil Properties in a Cold Waterlogged Paddy for Two Crop Seasons. Field Crops Res. 2016, 191, 161–167. [Google Scholar] [CrossRef]
  56. Forján, R.; Asensio, V.; Rodríguez-Vila, A.; Covelo, E.F. Contribution of Waste and Biochar Amendment to the Sorption of Metals in a Copper Mine Tailing. Catena 2016, 137, 120–125. [Google Scholar] [CrossRef]
  57. Lin, Y.; Munroe, P.; Joseph, S.; Henderson, R.; Ziolkowski, A. Water Extractable Organic Carbon in Untreated and Chemical Treated Biochars. Chemosphere 2012, 87, 151–157. [Google Scholar] [CrossRef] [PubMed]
  58. Schulz, H.; Dunst, G.; Glaser, B. Positive Effects of Composted Biochar on Plant Growth and Soil Fertility. Agron. Sustain. Dev. 2013, 33, 817–827. [Google Scholar] [CrossRef]
  59. Xiang, Y.; Liu, Y.; Niazi, N.K.; Bolan, N.; Zhao, L.; Zhang, S.; Xue, J.; Yao, B.; Li, Y. Biochar Addition Increased Soil Bacterial Diversity and Richness: Large-Scale Evidence of Field Experiments. Sci. Total Environ. 2023, 893, 164961. [Google Scholar] [CrossRef] [PubMed]
  60. Louca, S.; Polz, M.F.; Mazel, F.; Albright, M.B.N.; Huber, J.A.; O’Connor, M.I.; Ackermann, M.; Hahn, A.S.; Srivastava, D.S.; Crowe, S.A.; et al. Function and Functional Redundancy in Microbial Systems. Nat. Ecol. Evol. 2018, 2, 936–943. [Google Scholar] [CrossRef]
  61. Chen, Y.; Sun, R.; Sun, T.; Liang, Y.; Jiang, Y.; Sun, B. Organic Amendments Shift the Phosphorus-Correlated Microbial Co-Occurrence Pattern in the Peanut Rhizosphere Network during Long-Term Fertilization Regimes. Appl. Soil Ecol. 2018, 124, 229–239. [Google Scholar] [CrossRef]
  62. Sun, J.; He, F.; Pan, Y.; Zhang, Z. Effects of Pyrolysis Temperature and Residence Time on Physicochemical Properties of Different Biochar Types. ACTA Agric. Scand. Sect. B Soil Plant Sci. 2017, 67, 12–22. [Google Scholar] [CrossRef]
  63. Li, S.; Harris, S.; Anandhi, A.; Chen, G. Predicting Biochar Properties and Functions Based on Feedstock and Pyrolysis Temperature: A Review and Data Syntheses. J. Clean. Prod. 2019, 215, 890–902. [Google Scholar] [CrossRef]
  64. Liu, M.; Zhu, J.; Yang, X.; Fu, Q.; Hu, H.; Huang, Q. Biochar Produced from the Straw of Common Crops Simultaneously Stabilizes Soil Organic Matter and Heavy Metals. Sci. Total Environ. 2022, 828, 154494. [Google Scholar] [CrossRef]
  65. Li, X.; Wei, B.; Xu, X.; Zhou, J. Effect of Deep Vertical Rotary Tillage on Soil Properties and Sugarcane Biomass in Rainfed Dry-Land Regions of Southern China. Sustainability 2020, 12, 10199. [Google Scholar] [CrossRef]
  66. Wang, H.; Wu, Y.; Liu, J.; Xue, J. A review of research advances in the effects of biochar on soil nitrogen cycling and its functional microorganisms. J. Ecol. Rural Environ. 2022, 38, 689–701. [Google Scholar]
  67. Ge, T.; Nie, S.; Wu, J.; Shen, J.; Xiao, H.; Tong, C.; Huang, D.; Hong, Y.; Iwasaki, K. Chemical Properties, Microbial Biomass, and Activity Differ between Soils of Organic and Conventional Horticultural Systems under Greenhouse and Open Field Management: A Case Study. J. Soils Sediments 2011, 11, 25–36. [Google Scholar] [CrossRef]
  68. Farrell, M.; Kuhn, T.K.; Macdonald, L.M.; Maddern, T.M.; Murphy, D.V.; Hall, P.A.; Singh, B.P.; Baumann, K.; Krull, E.S.; Baldock, J.A. Microbial Utilisation of Biochar-Derived Carbon. Sci. Total Environ. 2013, 465, 288–297. [Google Scholar] [CrossRef] [PubMed]
  69. Alharby, H.F.; Fahad, S. Melatonin Application Enhances Biochar Efficiency for Drought Tolerance in Maize Varieties: Modifications in Physio-Biochemical Machinery. Agron. J. 2020, 112, 2826–2847. [Google Scholar] [CrossRef]
  70. Danish, S.; Zafar-ul-Hye, M.; Fahad, S.; Saud, S.; Brtnicky, M.; Hammerschmiedt, T.; Datta, R. Drought Stress Alleviation by ACC Deaminase Producing Achromobacter Xylosoxidans and Enterobacter Cloacae, with and without Timber Waste Biochar in Maize. Sustainability 2020, 12, 6286. [Google Scholar] [CrossRef]
  71. Liu, H.; Wei, B.; Dnag, K.; Peng, J.; Li, J.; Dong, Y. Effect of deep vertical rotary tillage on microbial community in sugar cane soil. Chin. J. Trop. Crops 2022, 43, 597–605. [Google Scholar]
  72. Xu, W.; Xu, H.; Delgado-Baquerizo, M.; Gundale, M.J.; Zou, X.; Ruan, H. Global Meta-Analysis Reveals Positive Effects of Biochar on Soil Microbial Diversity. Geoderma 2023, 436, 116528. [Google Scholar] [CrossRef]
  73. Ibrahim, M.M.; Tong, C.; Hu, K.; Zhou, B.; Xing, S.; Mao, Y. Biochar-Fertilizer Interaction Modifies N-Sorption, Enzyme Activities and Microbial Functional Abundance Regulating Nitrogen Retention in Rhizosphere Soil. Sci. Total Environ. 2020, 739, 140065. [Google Scholar] [CrossRef]
  74. Mujakić, I.; Piwosz, K.; Koblížek, M. Phylum Gemmatimonadota and Its Role in the Environment. Microorganisms 2022, 10, 151. [Google Scholar] [CrossRef]
  75. Farag, I.F.; Youssef, N.H.; Elshahed, M.S. Global Distribution Patterns and Pangenomic Diversity of the Candidate Phylum “Latescibacteria” (WS3). Appl. Environ. Microbiol. 2017, 83, e00521-17. [Google Scholar] [CrossRef]
  76. Ivanova, A.A.; Oshkin, I.Y.; Danilova, O.V.; Philippov, D.A.; Ravin, N.V.; Dedysh, S.N. Rokubacteria in Northern Peatlands: Habitat Preferences and Diversity Patterns. Microorganisms 2022, 10, 11. [Google Scholar] [CrossRef]
  77. Marschner, P.; Yang, C.-H.; Lieberei, R.; Crowley, D.E. Soil and Plant Specific Effects on Bacterial Community Composition in the Rhizosphere. Soil Biol. Biochem. 2001, 33, 1437–1445. [Google Scholar] [CrossRef]
  78. Gopalakrishnan, S.; Srinivas, V.; Prakash, B.; Sathya, A.; Vijayabharathi, R. Plant Growth-Promoting Traits of Pseudomonas geniculata Isolated from Chickpea Nodules. 3 Biotech 2015, 5, 653–661. [Google Scholar] [CrossRef] [PubMed]
  79. Duan, Y.; Zhang, L.; Yang, J.; Zhang, Z.; Awasthi, M.K.; Li, H. Insight to Bacteria Community Response of Organic Management in Apple Orchard-Bagasse Fertilizer Combined with Biochar. Chemosphere 2022, 286, 131693. [Google Scholar] [CrossRef] [PubMed]
  80. Yi, M.; Zhang, L.; Qin, C.; Lu, P.; Bai, H.; Han, X.; Yuan, S. Temporal Changes of Microbial Community Structure and Nitrogen Cycling Processes during the Aerobic Degradation of Phenanthrene. Chemosphere 2022, 286, 131709. [Google Scholar] [CrossRef]
  81. Yin, S.; Suo, F.; Zheng, Y.; You, X.; Li, H.; Wang, J.; Zhang, C.; Li, Y.; Cheng, Y. Biochar-Compost Amendment Enhanced Sorghum Growth and Yield by Improving Soil Physicochemical Properties and Shifting Soil Bacterial Community in a Coastal Soil. Front. Environ. Sci. 2022, 10, 1036837. [Google Scholar] [CrossRef]
  82. Vasantha, S.; Gupta, C.; Shekinah, D.E. Physiological Studies on Tiller Production and Its Senescence in Sugarcane–Response Comparison between Plant and Ratoon Crops. Indian J. Agric. Sci. 2014, 84, 24–27. [Google Scholar] [CrossRef]
  83. Meesilp, N.; Jaisil, P.; Milintawisamai, N.; Niamsanit, S. Effects of a Formulated Bio-Product Containing the Nitrogen Fixing Bacterial Strain Enterobacter Oryzae 3LSO1 on Sugarcane Growth. Sugar Tech 2016, 18, 242–248. [Google Scholar] [CrossRef]
  84. Wayne, D. Breeding for tolerance to biotic stress in sugarcane. Guangxi Agric. Sci. 2010, 41, 91–94. [Google Scholar]
Figure 1. A map of the main provinces of sugarcane production in China, shown in orange (a), and the study area (Guangxi University, Nanning, Guangxi), shown In blue (b).
Agronomy 15 01594 g001
Figure 2. Monthly rainfall (mm) and average temperature (°C) in Nanning from March 2021 to January 2023.
Agronomy 15 01594 g002
Figure 3. SEM results of straw biochar (a) and sugar filter mud biochar (b).
Agronomy 15 01594 g003
Figure 4. The effects of the biochar-based fertilizer application on soil bulk density (a), porosity (b), and water content (c). The values are presented as mean ± standard deviation. Letters indicate a significant difference between the treatments, which was analyzed using a Duncan test (p < 0.05). CK, chemical fertilizer; T1, straw biochar-based fertilizer; T2, sugar filter mud biochar-based fertilizer.
Agronomy 15 01594 g004
Figure 5. The effects of the biochar-based fertilizer application on soil pH. The values are presented as mean ± standard deviation. Letters indicate a significant difference between the treatments, which was analyzed using a Duncan test (p < 0.05). CK, chemical fertilizer; T1, straw biochar-based fertilizer; T2, sugar filter mud biochar-based fertilizer.
Agronomy 15 01594 g005
Figure 6. The Venn diagram of the number of OTUs in bacterial communities in the rhizosphere soil of sugarcane in 2021 (a) and 2022 (b), respectively. CK, chemical fertilizer; T1, straw biochar-based fertilizer; T2, sugar filter mud biochar-based fertilizer.
Agronomy 15 01594 g006
Figure 7. Relative abundance of the bacterial community at the phylum level in sugarcane root soil in 2021 (a) and 2022 (b). CK, chemical fertilizer; T1, straw biochar-based fertilizer; T2, sugar filter mud biochar-based fertilizer.
Agronomy 15 01594 g007
Figure 8. Differences in relative abundance (%) at the phylum and genus level in 2022, analyzed using STAMP 2.0.0 software with ANOVA and Tukey–Kramer test (p < 0.05) [43,44]. CK, chemical fertilizer; T1, straw biochar-based fertilizer; T2, sugar filter mud biochar-based fertilizer.
Agronomy 15 01594 g008
Figure 9. Lefse analysis to identify differential bacteria in 2022 among different treatments. c, class; o, order; f, family; g, genus. CK, chemical fertilizer; T1, straw biochar-based fertilizer; T2, sugar filter mud biochar-based fertilizer.
Agronomy 15 01594 g009
Figure 10. RDA (a) and Spearman correlation heatmap (b) of bacterial communities with environmental factors at the phylum level in 2022. The corresponding values of the heatmap is the Spearman correlation coefficient (p < 0.05 *, p < 0.01 **). CK, chemical fertilizer; T1, straw biochar-based fertilizer; T2, sugar filter mud biochar-based fertilizer.
Agronomy 15 01594 g010
Figure 11. Spearman’s rank correlation heatmap was used to evaluate the correlation between the bacteria community and soil physicochemistry at the genus level, in maturation during 2022. The corresponding values of the heatmap is the Spearman correlation coefficient (p < 0.05 *, p < 0.01 **, p < 0.001 ***).
Agronomy 15 01594 g011
Figure 12. Sugarcane growth and development in the mature stage of 2022 under three fertilizer applications. CK, chemical fertilizer; T1, straw biochar-based fertilizer; T2, sugar filter mud biochar-based fertilizer.
Agronomy 15 01594 g012
Figure 13. Correlations between soil environmental factors and relative abundance of bacteria at the phylum and genus level in 2022. Pairwise comparisons of environmental factors are shown in the triangle, with a color gradient denoting Spearman’s correlation coefficient (p < 0.05 *, p < 0.01 **, p < 0.001 ***). The relative abundance of bacterial phyla and genera was related to each environmental factor by Mantel tests. At the phylum level, the relative abundance includes Gemmatimonadota, Latescibacterota, and Methylomirabilota, and at the genus level, relative abundance includes Acidothermus, Sphingomonas, and Vicinamibacteraceae. The edge width corresponds to the Mantel’s r statistic for the corresponding distance correlations, and the edge color indicates the statistical significance.
Agronomy 15 01594 g013
Figure 14. A theoretical model of sugar filter mud biochar-based fertilizer to increase sugarcane yield under Fenlong-ridging. The left symbol represents T2 vs. CK, while the right one represents T2 vs. T1. CK, chemical fertilizer; T1, straw biochar-based fertilizer; T2, sugar filter mud biochar-based fertilizer.
Agronomy 15 01594 g014
Table 1. The physical and chemical properties of different soil layers at the experimental site at Guangxi University, China.
Soil PropertiesValueUnit
pH4.10
Bulk density1.01g·cm−3
Soil porosity44.00%
Soil organic matter (SOM)16.21g·kg−1
Total nitrogen (TN)0.58g·kg−1
Total phosphorus (TP)0.44g·kg−1
Total potassium (TK)6.43g·kg−1
Available nitrogen (AN)31.68mg·kg−1
Available phosphorus (AP)9.84mg·kg−1
Available potassium (AK)99.15mg·kg−1
Table 2. The biochar-based fertilizers at the experiment.
Treatment *Source of BiocharBiochar Properties
Water Content
%
pHTN
%
TP
%
TK
%
SOM
%
Chemical fertilizersNo biochar
Straw biochar-based fertilizersProduced from the pyrolysis of straw at 250 °C for 12 h.31.17.2145.70.860.193.96
Sugar filter mud biochar-based fertilizersProduced from the pyrolysis of the solid waste of the sugar-making process at 250 °C for 12 h.5.287.3923.090.70.215.38
* Three treatments were controlled using the same amount of the chemical fertilizer in the same crop season, including 225 kg N ha−1, 98 kg P2O ha−1, and 187 kg K2O ha−1 in 2021, while 225 kg N ha−1, 120 kg P2O ha−1, and 225 kg K2O ha−1 were used in 2022, respectively. The following fertilizers were used: potassium sulfate type compound fertilizer (used in 2021), urea (used in 2022), calcium magnesium phosphate fertilizer, and potassium chloride (Yara International Co., Ltd., Shanghai, China).
Table 3. Specific surface area of biochar.
Biochar TypeSpecific Surface Area of Biochar (m2 g−1)
Straw biochar4.43
Sugar filter mud biochar18.79
Table 4. Pore size distribution (% of total porosity) under different treatments.
TreatmentMacropores (>50 μm)Mesopores (0.5–50 μm)Micropores (<0.5 μm)
CK15.2 ± 1.852.3 ± 3.132.5 ± 2.4
T118.6 ± 2.1 *54.7 ± 2.926.7 ± 1.9 *
T221.4 ± 2.3 *56.2 ± 3.0 *22.4 ± 2.1 *
* Significant difference vs. CK (p < 0.05).
Table 5. The effects of the biochar-based fertilizer application on soil nutrient contents.
Crop SeasonTreatmentTN
g kg−1
TP
g kg−1
TK
g kg−1
AN
mg kg−1
AP
mg kg−1
AK
mg kg−1
SOM
g kg−1
2021CK0.80 ± 0.04 b0.40 ± 0.03 b7.49 ± 0.49 b60.59 ± 0.68 b14.29 ± 0.19 c129.70 ± 5.65 b17.96 ± 0.30 b
T10.79 ± 0.06 b0.45 ± 0.03 b7.58 ± 0.10 b64.27 ± 0.74 a15.28 ± 0.03 b184.18 ± 3.88 a18.37 ± 0.40 b
T20.93 ± 0.05 a0.53 ± 0.02 a8.39 ± 0.34 a65.02 ± 0.71 a15.96 ± 0.14 a186.76 ± 6.41 a19.18 ± 0.35 a
2022CK0.75 ± 0.04 b0.56 ± 0.04 b3.86 ± 0.11 b73.11 ± 3.30 b121.47 ± 2.57 b138.67 ± 8.02 b18.22 ± 0.40 c
T10.80 ± 0.06 ab0.67 ± 0.02 a4.21 ± 0.09 a87.50 ± 3.05 a120.64 ± 5.20 b168.00 ± 17.78 a21.10 ± 0.14 b
T20.86 ± 0.02 a0.67 ± 0.02 a4.26 ± 0.02 a88.90 ± 1.21 a146.69 ± 18.55 a184.33 ± 12.39 a22.36 ± 0.39 a
The values are presented as mean ± standard deviation. Letters indicate a significant difference between the treatments, which was analyzed using a Duncan test (p < 0.05). CK, chemical fertilizer; T1, straw biochar-based fertilizer; T2, sugar filter mud biochar-based fertilizer.
Table 6. The effects of the biochar-based fertilizer application on activities of urease, sucrase, and acid phosphatase in 2022.
TreatmentUreaseSucraseAcid Phosphatase
CK0.4078 ± 0.0136 a5.6885 ± 0.1751 b0.2276 ± 0.0151 a
T10.4206 ± 0.0029 a6.6236 ± 0.2577 a0.2616 ± 0.0243 a
T20.4318 ± 0.0297 a6.6383 ± 0.5424 a0.2459 ± 0.0165 a
The values are presented as mean ± standard deviation. Letters indicate a significant difference between the treatments, which was analyzed using a Duncan test (p < 0.05). CK, chemical fertilizer; T1, straw biochar-based fertilizer; T2, sugar filter mud biochar-based fertilizer.
Table 7. The effects of the biochar-based fertilizer application on the abundance and diversity of bacteria.
Crop SeasonTreatmentACEChao1Shannon
2021CK1858.33 ± 55.82 a1812.18 ± 108.42 a9.61 ± 0.07 a
T11860.67 ± 35.85 a1513.07 ± 459.91 a8.59 ± 1.19 a
T21900.33 ± 42.06 a1855.26 ± 257.25 a8.95 ± 0.73 a
2022CK4835.74 ± 480.93 a4746.50 ± 351.86 a10.36 ± 0.31 a
T15326.07 ± 122.50 a5165.92 ± 93.87 a10.60 ± 0.06 a
T25958.16 ± 206.55 a5745.28 ± 233.35 a10.90 ± 0.03 a
The data obtained were normally distributed, and the values are presented as mean ± standard deviation. Letters indicate a significant difference between the treatments, which was analyzed using a Wilcox test (p < 0.05). CK, chemical fertilizer; T1, straw biochar-based fertilizer; T2, sugar filter mud biochar-based fertilizer.
Table 8. The effects of biochar application on agronomic traits, yield, and quality during the harvest period of sugarcane.
Crop SeasonTreatmentPlant Height
(cm)
Stem Diameter
(mm)
Single Stem Weight
(kg plant−1)
Number of Effective Stems
(plant ha−1)
Yield
(t ha−1)
Sugar Content
(%)
2021CK308.58 ± 1.22 b31.10 ± 0.30 b2.35 ± 0.05 b56,949 ± 323 a133.47 ± 3.08 b20.01 ± 0.16 b
T1311.10 ± 1.15 a31.21 ± 0.31 b2.37 ± 0.04 b57,128 ± 273 a135.47 ± 2.63 b21.3 ± 0.15 a
T2312.85 ± 1.06 a31.91 ± 0.20 a2.5 ± 0.04 a57,329 ± 407 a143.10 ± 2.44 a21.56 ± 0.01 a
2022CK313.33 ± 9.07 a27.56 ± 0.06 b1.93 ± 0.03 b4856 ± 950 c93.72 ± 1.64 c17.40 ± 0.15 a
T1314.00 ± 3.61 a27.30 ± 0.11 b1.95 ± 0.03 b51,700 ± 520 b100.63 ± 0.69 b17.10 ± 0.24 a
T2315.67 ± 3.06 a28.90 ± 0.27 a2.05 ± 0.04 a5456 ± 1041 a111.86 ± 2.67 a17.43 ± 0.15 a
The values are presented as mean ± standard deviation. Letters indicate a significant difference between the treatments, which was analyzed using a Duncan test (p < 0.05). CK, chemical fertilizer; T1, straw biochar-based fertilizer; T2, sugar filter mud biochar-based fertilizer.
Disclaimer/Publisher’s Note: The statements, opinions and data contained in all publications are solely those of the individual author(s) and contributor(s) and not of MDPI and/or the editor(s). MDPI and/or the editor(s) disclaim responsibility for any injury to people or property resulting from any ideas, methods, instructions or products referred to in the content.

