Article

Effect of Compost Addition on Carbon Mineralization and Kinetic Characteristics in Three Typical Agricultural Soils

1
College of Agriculture, Henan University of Science and Technology, Luoyang 471000, China
2
College of Resources and Environment, Shanxi Agricultural University, Taiyuan 030031, China
3
Jiangsu Rotam Chemistry Co., Ltd., Suzhou 215300, China
*
Authors to whom correspondence should be addressed.
Agronomy 2025, 15(7), 1559; https://doi.org/10.3390/agronomy15071559
Submission received: 10 May 2025 / Revised: 23 June 2025 / Accepted: 25 June 2025 / Published: 26 June 2025

Abstract

Soil carbon is a crucial component of the global carbon cycle, and carbon mineralization is influenced by various factors. However, there is a lack of systematic analyses on the responses of carbon mineralization in different soil types to the addition of exogenous organic matter. This study investigates the effects of compost addition on the mineralization and kinetic characteristics of soil carbon across three typical agricultural soils: paddy soil, black soil, and cinnamon soil. A 210-day incubation study was conducted with four treatments: Control (un-amended soil), R (soil + straw), R1M (soil + straw + low compost application rate), R2M (soil + straw + high compost application rate). The results showed that the CO2 emission rates of the three soils were higher during the early stage (1–37 days) and decreased afterward. The CO2 emission rates of the paddy soil and the black soil were significantly higher than those of the cinnamon soil. The addition of compost significantly increased both the CO2 emission rate and the cumulative release of CO2, especially in the R2M treatment. At the end of the incubation, the SOC contents were higher in the R2M treatment than in the Control for all three soils (p < 0.05), with the most notable increase in the cinnamon soil (60.93%). Compost addition significantly enhanced the active carbon pool (Ca), slow carbon pool (Cs), and potentially mineralizable carbon pool (Cp), while decreasing the mineralization rate (ka) of the Ca, but the effect on the mineralization rate (ks) of the Cs and mineralization entropy (Cm) varied by soil types. The ks of the paddy soil was significantly reduced by 23.08% under the R1M and R2M treatments compared with the Control and R treatment. The ks of the black soil was significantly increased by 59.52% under the R2M treatment compared with the Control. The ks of the cinnamon soil was elevated considerably by 79.31% under the R2M treatment compared with the Control, R, and R1M treatments (averaging 0.29 × 10⁻² d), and the ks of the paddy soil and black soil were significantly higher than those of the cinnamon soil under the R2M treatment. The Cm was significantly higher in the organic material added treatments than in the Control for the black soil and the paddy soil, but showed a higher value in the R treatment than in the R2M and Control for the cinnamon soil. In conclusion, compost addition stimulated soil carbon mineralization and improved the SOC content, especially in the cinnamon soil, while reducing the mineralization rate of the active carbon pool across the three soils. The mineralization rate of the slow carbon pool and the changes in mineralization entropy were dependent on soil types, primarily related to the initial soil nutrient contents, pH, and particle compositions. These findings offer valuable insights for managing the soil carbon pool in agricultural ecosystems.

1. Introduction

Soil organic carbon is an important component of the global carbon cycle. As the largest carbon pool in terrestrial ecosystems, soil carbon storage is two to three times greater than that of the atmosphere [1,2,3]. Soil organic carbon mineralization refers to the process in which soil organic matter is transformed into carbon dioxide (CO2) and other gases through microbial activities. The rate and dynamic changes directly affect soil nutrient release, greenhouse gas emissions, and the maintenance of soil quality [4,5]. Soil organic carbon mineralization is affected by a variety of factors, including soil texture [6], nutrient status [7,8,9], microbial activity [10], and the addition of exogenous organic matter [11,12]. Wang et al. [13] demonstrated that the mineralization rate of organic carbon varied significantly among soils with different fertility levels. Specifically, soils with higher fertility exhibited a higher mineralization rate and released more carbon, while those with lower fertility had a lower rate and released less carbon. Li et al. [14] found that the rate constant k of soil organic carbon mineralization was not affected by soil nutrients, pH, or particle composition, but was strongly related to soil parent material. Wu et al. [15] found that the mineralization parameters of different soil types were significantly different; the higher the organic carbon content, the greater the mineralization amount. When the organic carbon and nutrient content were not significantly different, the mineralization amount of acid red paddy soil was greater than that of neutral Wuzha soil. Li et al. [16] studied the effect of exogenous carbon addition on the organic carbon mineralization of red soil and sandy soil. They found that both the mineralization rate and the accumulated mineralization amount of organic carbon were significantly higher in sandy soil than in red soil. This was primarily attributed to the higher clay content in red soil, which enhanced the physical protection of organic carbon through the interaction with clay particles. Mamedov et al. [17] found that soil texture, especially clay content, had a significant effect on the mineralization rate of organic carbon. Wu et al. [18] studied the effects of biochar addition on CO2 emissions from different soils and found that acidic soil with a lower pH had higher CO2 emissions and mineralization than alkaline soil during incubation. Therefore, the different soil types play a crucial role in the process of soil organic carbon mineralization. However, most studies focus on the effects of a single soil type or fertilization treatment, and there remains a lack of systematic research on the comprehensive effects of exogenous material addition on carbon mineralization across different soils.
With the continuous changes in agricultural practices, the return of straw and the application of compost have garnered increasing attention as key strategies for enhancing soil quality. There were significant differences in the response of carbon mineralization to the addition of organic materials across different soils. Zhao et al. [19] found that long-term straw return to the field significantly increased soil organic carbon in cinnamon soil, which effectively enhanced the turnover rate of the soil organic carbon pool and the soil potential mineralizable carbon pool. Li et al. [20] discovered that the mineralization rate and cumulative CO2 emissions in black soil increased under the addition of different organic materials. Hu et al. [21] noted that the cumulative release of CO2 from paddy soil increased dramatically with the straw return, which promoted soil organic carbon mineralization. However, there is a lack of systematic differential analysis on the responses of carbon mineralization in different soils to the addition of exogenous organic materials, and how to regulate the mineralization process of varying soil organic carbon remains a key issue in current research.
In this study, we conducted an incubation approach using three typical agricultural soils with distinct textures (paddy soil, black soil, and cinnamon soil), by amending these soils with compost and straw. We systematically analyzed the organic carbon mineralization characteristics under uniform incubation conditions. We hypothesize that the addition of compost will significantly influence soil organic carbon mineralization and its kinetic characteristics, with these effects varying across different soil types. This study reveals the response mechanism of soil carbon mineralization dynamics to compost addition across different soil types. The findings provide both theoretical foundations for managing agricultural soil carbon pools and practical insights for mitigating climate change, enhancing soil fertility, and optimizing agrarian practices.
In summary, previous studies have typically examined the effects of compost addition on carbon mineralization within a single soil type. Our study innovates by providing a comprehensive comparison across three distinct agricultural soils: paddy soil, black soil, and cinnamon soil. Through a systematic analysis of how compost addition influences carbon mineralization and its kinetic characteristics in these diverse soil types, we uncover unique mechanisms governing soil carbon dynamics. This approach not only enriches the theoretical framework of soil carbon cycles but also offers practical guidance for developing more targeted soil carbon management strategies.

2. Materials and Methods

2.1. Site Description and Soil Sampling

Based on the Chinese soil classification system, three typical soil types were selected: paddy soil, black soil, and cinnamon soil, which were collected from farmland in different regions of China. Specific sampling locations and soil background information were as follows: The black soil was collected from the farmland near the Long-term Experimental Station of Middle Black Soil Fertility in Gongzhuling, Jilin Province (43°30′ N, 124°48′ E), with a farming history of over 15 years of soybean-corn rotation and an average annual precipitation of 625 mm, yearly temperature of 7.2 °C. The cinnamon soil was gathered from the Ziguiyuan Agroecological Base in Luoyang, Henan Province (34°83′ N, 112°43′ E), with a cultivation history of over 15 years of corn and wheat double cropping and an average annual precipitation of 550 mm, as well as an annual temperature of 15.4 °C. The paddy soil was obtained from Zhangshu Road farmland in Yuhang District, Hangzhou, Zhejiang Province (30°20′ N, 120°14′ E), with a history of over 15 years of rice cultivation, an average annual precipitation of 1550 mm, as well as an annual temperature of 17.6 °C. Composite soil samples were collected in 2023, mixed from 20 soil cores in each region, at a sampling depth of 0–20 cm with a diameter of 3–4 cm. Plant residues and small stones were removed. The samples were air-dried, ground through a 2 mm sieve, sealed, and stored at a room temperature of 24 °C.
In order to better integrate with the international soil classification system, we supplemented the following comparison table to compare the “paddy soil”, “black soil”, and “cinnamon soil” in the China soil classification system with the corresponding soil types in the FAO soil classification system in detail (Table 1):
The compost was produced using thermophilic composting of pig manure and corn straw with microbial inoculants. Elemental analysis (vario MACRO cube, Elementar Analysensysteme GmbH, Hanau, Germany) showed that the compost contained 460.78 g/kg total carbon and 17.43 g/kg total nitrogen.
Wheat straw (Triticum aestivum L., above-ground biomass) was collected at physiological maturity. After grain removal and natural drying, the straw was homogenized by cutting into 1 cm segments, followed by grinding in a mortar and sieving through a 1 mm mesh. Elemental analysis (vario MACRO cube, Elementar Analysensysteme GmbH, Hanau, Germany) showed the prepared straw contained 405.54 g/kg total carbon and 10.68 g/kg total nitrogen.

2.2. Incubation Setting up

The incubation was established in 800 mL jars with a cylindrical, flat-bottomed, uncovered box containing 100 g of soil. There is a small hole of 6 mm in diameter at the top of the jar for aeration. Four treatments were set up in this experiment: un-amended (Control), straw amended (R), straw + low compost application rate (R1M), and straw + high compost application rate (R2M). The study followed a completely randomized design with three replicates. The amount of straw added was 4.08 g/kg soil, which was equivalent to 9.18 t/ha of straw returned to the field. The amount of compost in R1M was 3.82 g/kg, and that in R2M was 7.64 g/kg. First, straw was added to the R, R1M, and R2M treatments, and compost was added to the R1M and R2M treatments, then thoroughly mixed with the soil. Water was added to all treatments to bring the soil moisture to 50% of the soil’s water holding capacity (WHC), and the soils were placed in a refrigerator at 4 °C for 2 days of pre-incubation to allow the soil moisture to diffuse evenly and stimulate microbial activity. Then, the soils were taken out of the refrigerator, and water was added again to bring the soil moisture to 60% of WHC. All samples were placed in a ventilated, light-proof, constant-temperature (25 °C) and constant-humidity (75%) incubator (MGC-350, Zhengzhou Shengyuan Instrument Co., Ltd., Zhengzhou, China). The soil moisture was adjusted weekly by weighing to maintain the initial level, and the incubation lasted for 210 days.

2.3. Soil Sample Analysis

The basic soil properties were analyzed prior to establishing the incubation: pH (electrode, 1:2.5 soil-water), particle size (hydrometer), total nitrogen (Kjeldahl-H2SO4), alkaline hydrolyzable nitrogen (diffusion), total phosphorus (HClO4-H2SO4 digestion, molybdenum blue), available phosphorus (NaHCO3 extraction, molybdenum antimony), total potassium (NaOH fusion, flame photometry), available potassium (NH4OAc extraction, flame photometry), and soil organic carbon (K2Cr2O7 oxidation, external heating). Data are shown in Table 2. During the incubation, soil samples were collected at 0, 90, and 210 days, and the soil organic carbon contents for each date were measured. The SOC0, SOC90, and SOC210 denote soil organic carbon content at incubation stages 0, 90, and 210 days, respectively.

2.4. Determination of Carbon Dioxide Release Rate

On days 1, 2, 3, 5, 7, 10, 12, 15, 18, 26, 37, 47, 58, 90, 120, 150, 180, and 210 of incubation, 1 mL of gas was extracted from the jars. The CO2 concentration was measured using a gas chromatograph (GC7900, Shanghai Jingketianmei Scientific Instrument Co., Ltd., Shanghai, China) equipped with a TCD detector, HP-1 column, and high-purity H2 as the carrier gas.
The calculation of CO2 release rate used the following formula:
F = W C O 2 × V 1 × M c × V m
where F is the CO2 emissions, mg·kg−1·day−1; Wco2 is the CO2 percentage, %; V1 is the incubation volume, mL; Mc is the CO2 molar mass, g/mol; and Vm is the gas standard molar volume, L/mol.
Given the 210-day incubation period of this experiment, the two-reservoir exponential model was selected to fit the cumulative CO2 release data. This model showed a significantly higher fitting accuracy (R2 > 0.99) compared to the first-order kinetic equation, thus offering a more reliable representation of the CO2 release dynamics over the prolonged experimental duration:
Ct = Ca (1 − e−ka t) + Cs (1 − e−ks t)
where Ct is the amount of CO2 released by the soil at time t (g/kg); and Ca represents the active carbon pool (g/kg), which is the readily mineralizable portion of soil organic carbon. Cs represents the slow carbon pool (g/kg), the more stable fraction of soil organic carbon that mineralizes at a slower rate. ka and ks are the mineralization rates (d−1) for the active and slow carbon pools, respectively. Cp is the potentially mineralizable carbon pool (g/kg), calculated as the sum of Ca and Cs (Cp = Ca + Cs), which represents the total organic carbon in the soil that can be mineralized. Cr is the stable carbon pool (g/kg), calculated as the difference between the initial total organic carbon content (SOC0) and Cp (Cr = SOC0 − Cp), representing the relatively stable organic carbon that is not easily mineralized. Cm is the mineralization entropy, calculated as the ratio of Cp to SOC0 (Cm = Cp/SOC0), which characterizes the soil’s carbon sequestration capacity, expressed as a percentage (%) [22].
The cumulative CO2 release was calculated as follows:
C = F i + F i 1 2 × ( t i t i 1 )
where C is the cumulative release of CO2 (g/kg), i is the sampling time, and ti − ti−1 is the interval between two adjacent samples (day).

2.5. Statistics

Microsoft Excel 2016 was utilized for preliminary data calculations. The Shapiro–Wilk test and Q-Q plot were used to assess the normal distribution, while the Levene test was used to evaluate the homogeneity of variance across different incubation times, treatments, and soil types using SPSS 21.0 software. After confirming that the data met the criteria for normal distribution and homogeneity of variance, variance analysis and Duncan’s multiple comparison tests were performed. The dual-carbon-pool model was defined using the R-4.3.2 software package “minpack. lm.” The cumulative CO2 release data under different incubation times were fitted using the “nls. lm” function, and parameters related to carbon mineralization were extracted. Pearson correlation analysis of organic carbon and carbon mineralization parameters at different incubation times was performed using the R-4.3.2 software’s “corrplot” package. The Mantel test correlation analysis was carried out by using the “mantel_test” function in the “linkET” package to analyze the effects of soil basic physicochemical properties and particle composition on soil carbon mineralization parameters. The experimental data were plotted using Origin 2021 software (OriginLab, Northampton, MA, USA).

3. Results

3.1. Differences in Basic Physicochemical Properties and Particle Composition of Soil Before Incubation

The basic physicochemical properties (Table 2) and particle composition (Table 3) varied significantly among different soil types. The total nitrogen, available phosphorus, available potassium, and organic carbon contents in these soils were as follows: black soil > paddy soil > cinnamon soil. The paddy soil showed the highest contents of total potassium and alkali hydrolyzable nitrogen, which were 8.43 g/kg and 166.11 mg/kg, respectively. The soil pH was as follows: cinnamon soil (7.38) > black soil (6.89) > paddy soil (5.35). For soil particle size fractions, the black soil had a significantly higher content of particles > 0.05 mm compared with the paddy soil and the cinnamon soil (p < 0.05). The cinnamon soil had a considerably higher content of particles in the 0.01~0.05 mm range compared with the paddy soil and black soil (p < 0.05). There was no significant difference in the content of particles in the 0.005~0.01 mm and 0.001~0.002 mm ranges among the different soils. For particles < 0.001 mm, it showed that paddy soil > black soil > cinnamon soil, with significant differences observed among the different soil types (p < 0.05).

3.2. Characteristics of CO2 Emission Rates from Different Types of Soil

Figure 1 shows the temporal characteristics of CO2 emission rates for the three types of soil under different treatments. As observed in Figure 1, under various treatments, the CO2 emission rates of the three soils showed a trend of rapid mineralization in the early stage (1~37 days) and gradually slowed down until stabilizing in the later stage. The CO2 emission rates of the paddy soil and the black soil were generally higher than those of the cinnamon soil (Figure 1).
In the paddy soil, the emission rates of the R, R1M, and R2M treatments significantly increased by 121.87%, 138.39%, and 65.08%, respectively, compared with the Control on the first day (p < 0.05), which indicated that exogenous organic matter (R, R1M, R2M) can significantly promote the mineralization of organic carbon in the paddy soil, especially in the early stage of incubation. On the second day of incubation, the emission rate of the R2M treatment was significantly higher than that of other treatments. Then, the CO2 emission rates of the R1M and R2M treatments gradually decreased after 15 days of incubation, but remained significantly higher than those of the Control. By the end of the incubation, the CO2 emission rates of the R1M and the R2M treatments were significantly increased by 174.56% and 181.14%, respectively, compared with the Control, indicating that the R1M and R2M treatments promoted carbon mineralization more persistently in the paddy soil over the long-term incubation period.
The CO2 emission rates of the black soil showed different patterns. On the first day, the R and R1M treatments significantly decreased by 29.86% and 23.81%, respectively, compared with the Control (p < 0.05), while the R2M treatment increased by 6.79%, which indicated that the R and R1M treatments inhibited the mineralization of organic carbon in the black soil at the initial stage of incubation. After 3~7 days of incubation, the CO2 emission rates of the R, R1M, and R2M treatments gradually increased and were significantly higher than those of the Control. From the 30th to 120th day of incubation, the CO2 emission rates were ranked as R2M > R1M > R > Control, with significant differences among the treatments. In the late incubation period (after 150 days), the CO2 emission rate of the R2M treatment remained high, while the R and R1M treatments tended to be stable, and the difference with the Control gradually decreased.
For the cinnamon soil, the CO2 emission rates of the R, R1M, and R2M treatments were higher than those of the Control during the entire incubation process. From the 1~3 days of incubation, the CO2 emission rate of the R2M treatment significantly increased by 39.71% and 31.15% compared with the R and R1M treatments, respectively. After 15 days, the CO2 emission rate of each treatment gradually decreased and tended to be flat. During the 22~180 days of incubation, the CO2 emission rates of the R1M and R2M treatments were always significantly higher than those of the R treatment. By the end of the incubation, the CO2 emission rate of the R2M treatment was significantly increased by 87.50% compared with the Control, and there was no significant difference among the Control, R, and R1M treatments, which indicated that the R2M treatment had the most persistent effect on soil carbon mineralization in the cinnamon soil.
The two-way ANOVA revealed that soil types, treatments, and their interaction had a significant effect on the average CO2 emission rate (p < 0.001). The average CO2 emission rates for the three soil types followed the order R2M > R1M > R > Control, with significant differences observed among the four treatments. For the Control, R1M, and R2M treatments, the paddy soil and black soil exhibited significantly higher average CO2 emission rates than the cinnamon soil. Under the R treatment, the average CO2 emission rates of the three soils were ordered as black soil > paddy soil > cinnamon soil, with significant differences noted among the different soils.

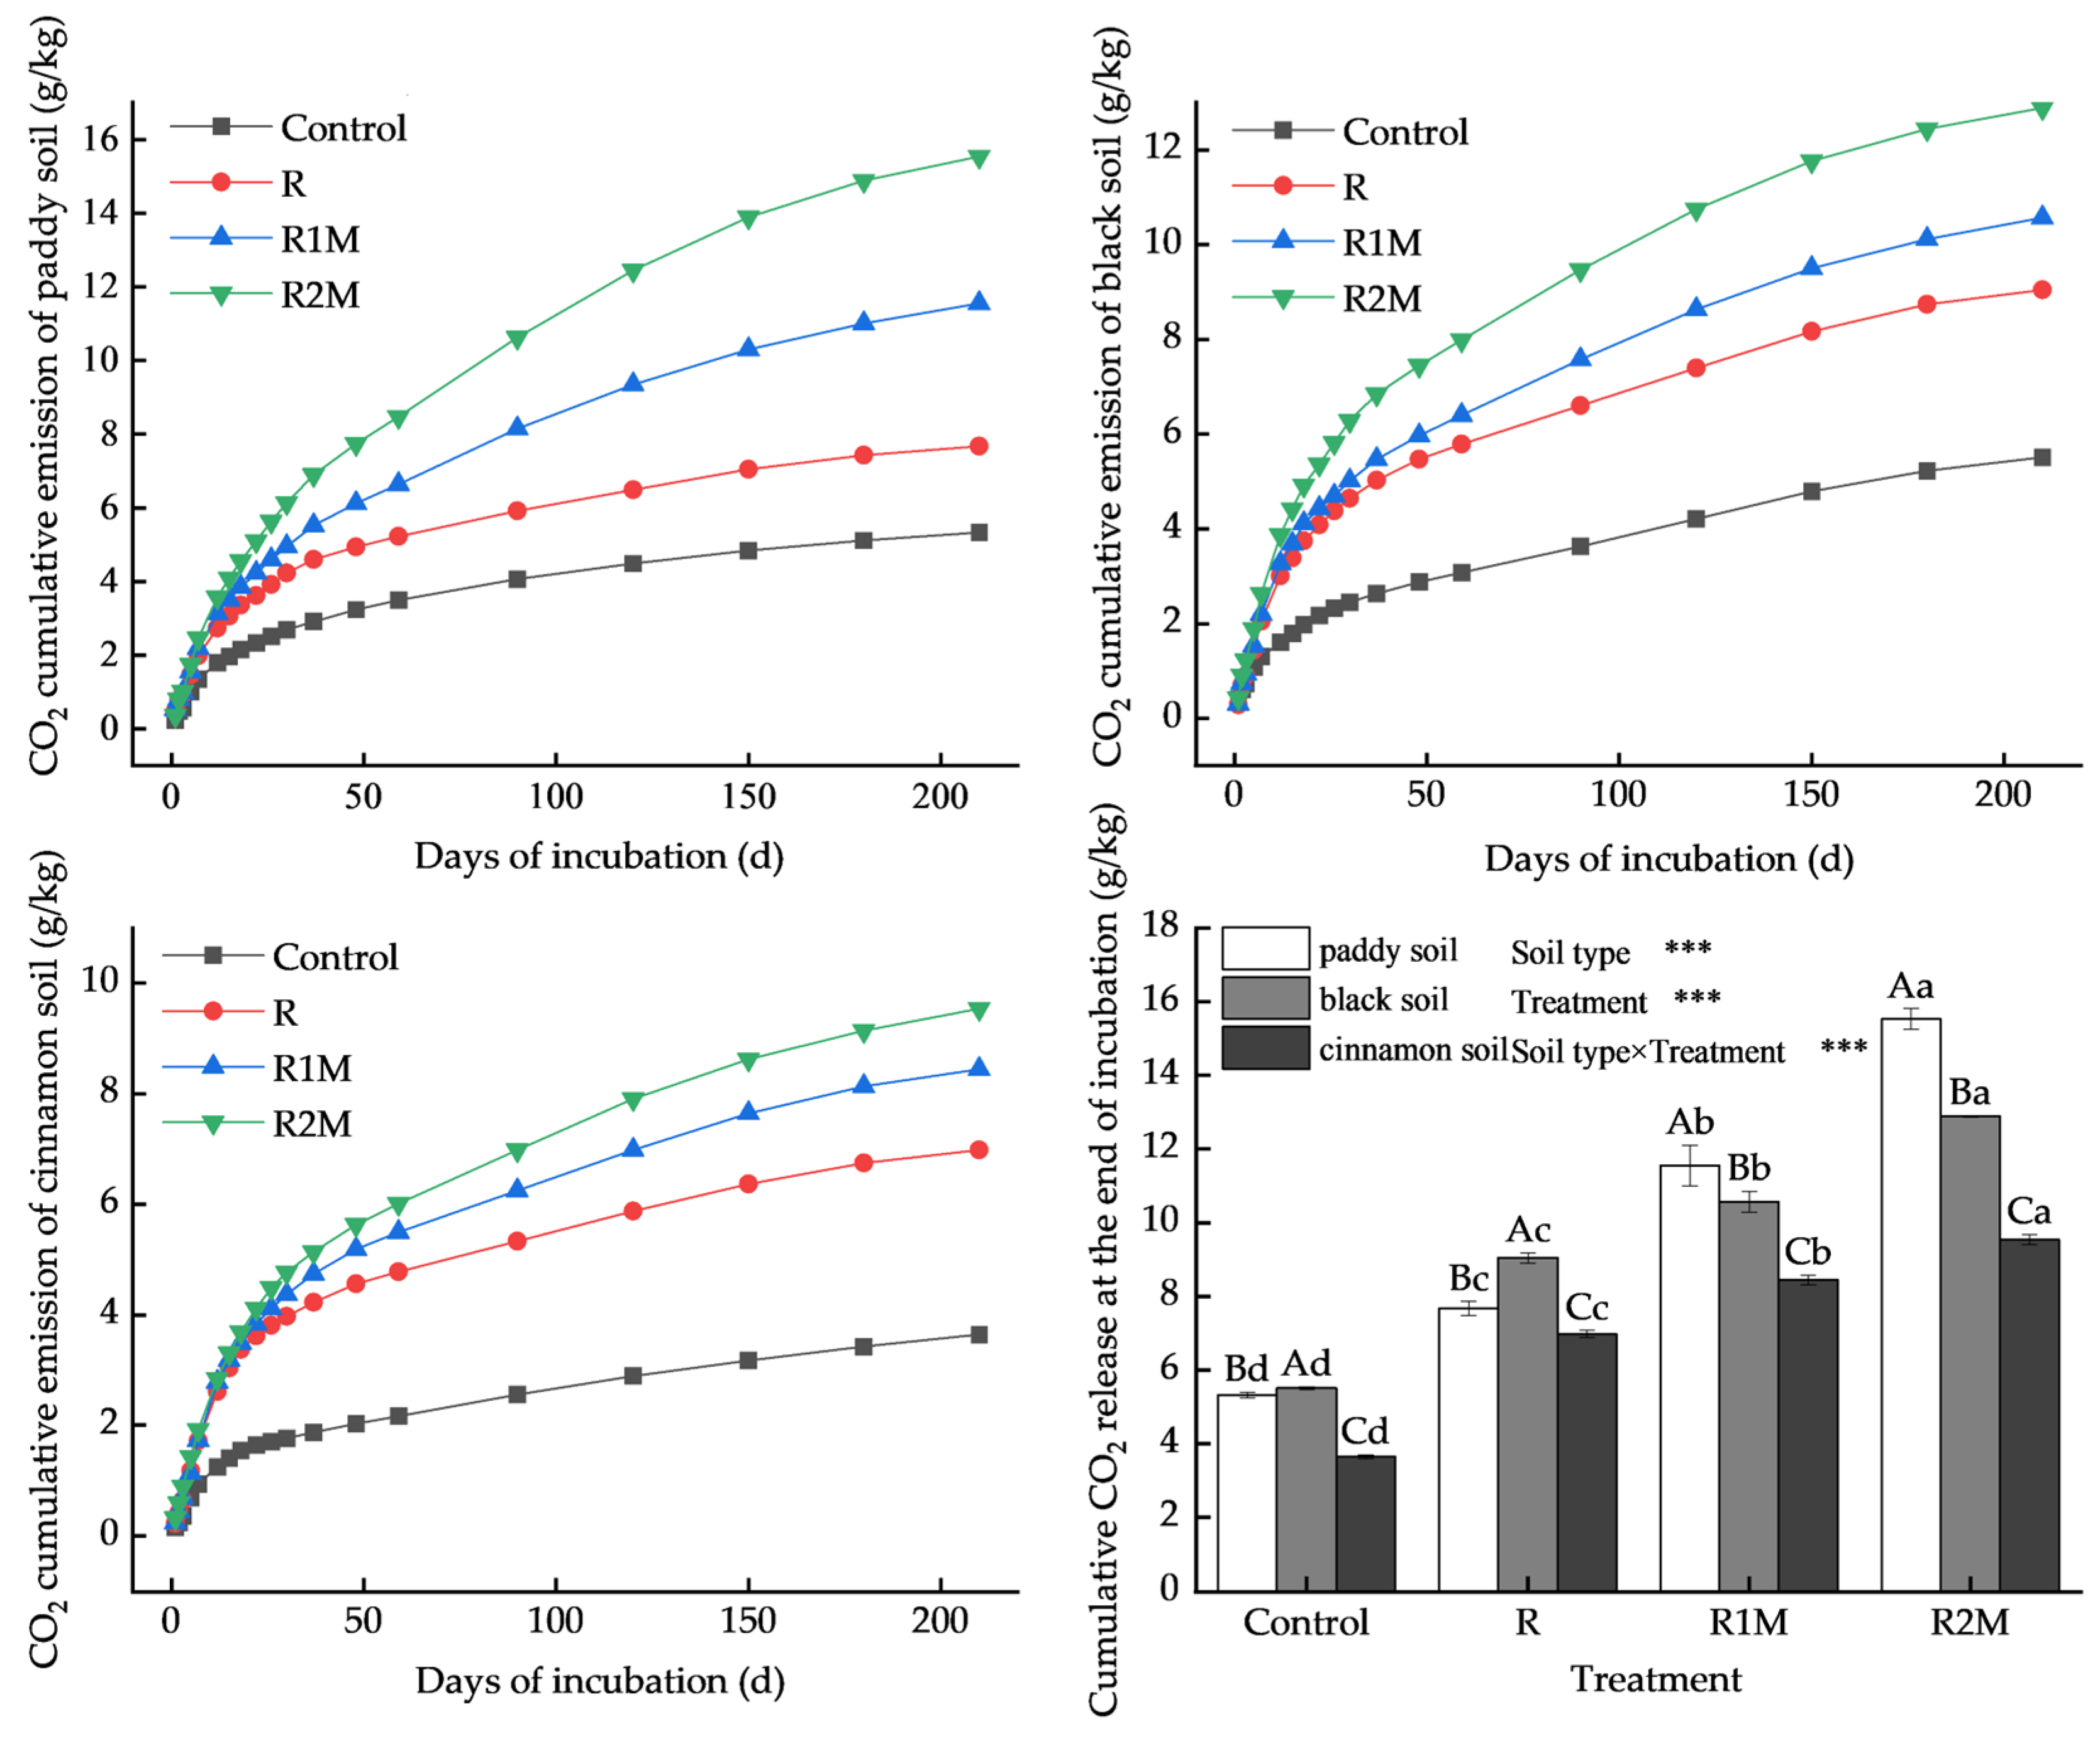
3.3. Cumulative CO2 Emissions from Different Types of Soil

Figure 2 exhibits the characteristics of CO2 accumulation and emission from different types of soil under different treatments. During the 210 days of incubation, the cumulative CO2 emission from the three soils under different treatments increased along with the incubation period. This increase was rapid in the early stage (1~37 days) and tended to slow down in the later stage. At the end of incubation, the three soils displayed the following order: R2M > R1M > R > Control (p < 0.05), indicating that the addition of exogenous organic matter (R2M and R1M) significantly enhanced the mineralization of soil organic carbon. Under the R2M treatment, the cumulative CO2 emissions were 15.53 g/kg for the paddy soil, 12.88 g/kg for the black soil, and 9.54 g/kg for the cinnamon soil, increasing significantly by 191.92%, 133.76%, and 162.09% compared with the Control, respectively. In comparison to the Control, the R1M treatment resulted in the cumulative CO2 emissions that increased by 117.10%, 91.83%, and 131.87% for the three soils, respectively. Under both the R1M and R2M treatments, the cumulative CO2 emissions followed the order paddy soil > black soil > cinnamon soil. In contrast, under the Control and R treatments, the order was black soil > paddy soil > cinnamon soil. The two-way ANOVA showed that soil types, treatments, and their interaction had a significant effect on the cumulative CO2 emission (p < 0.001).

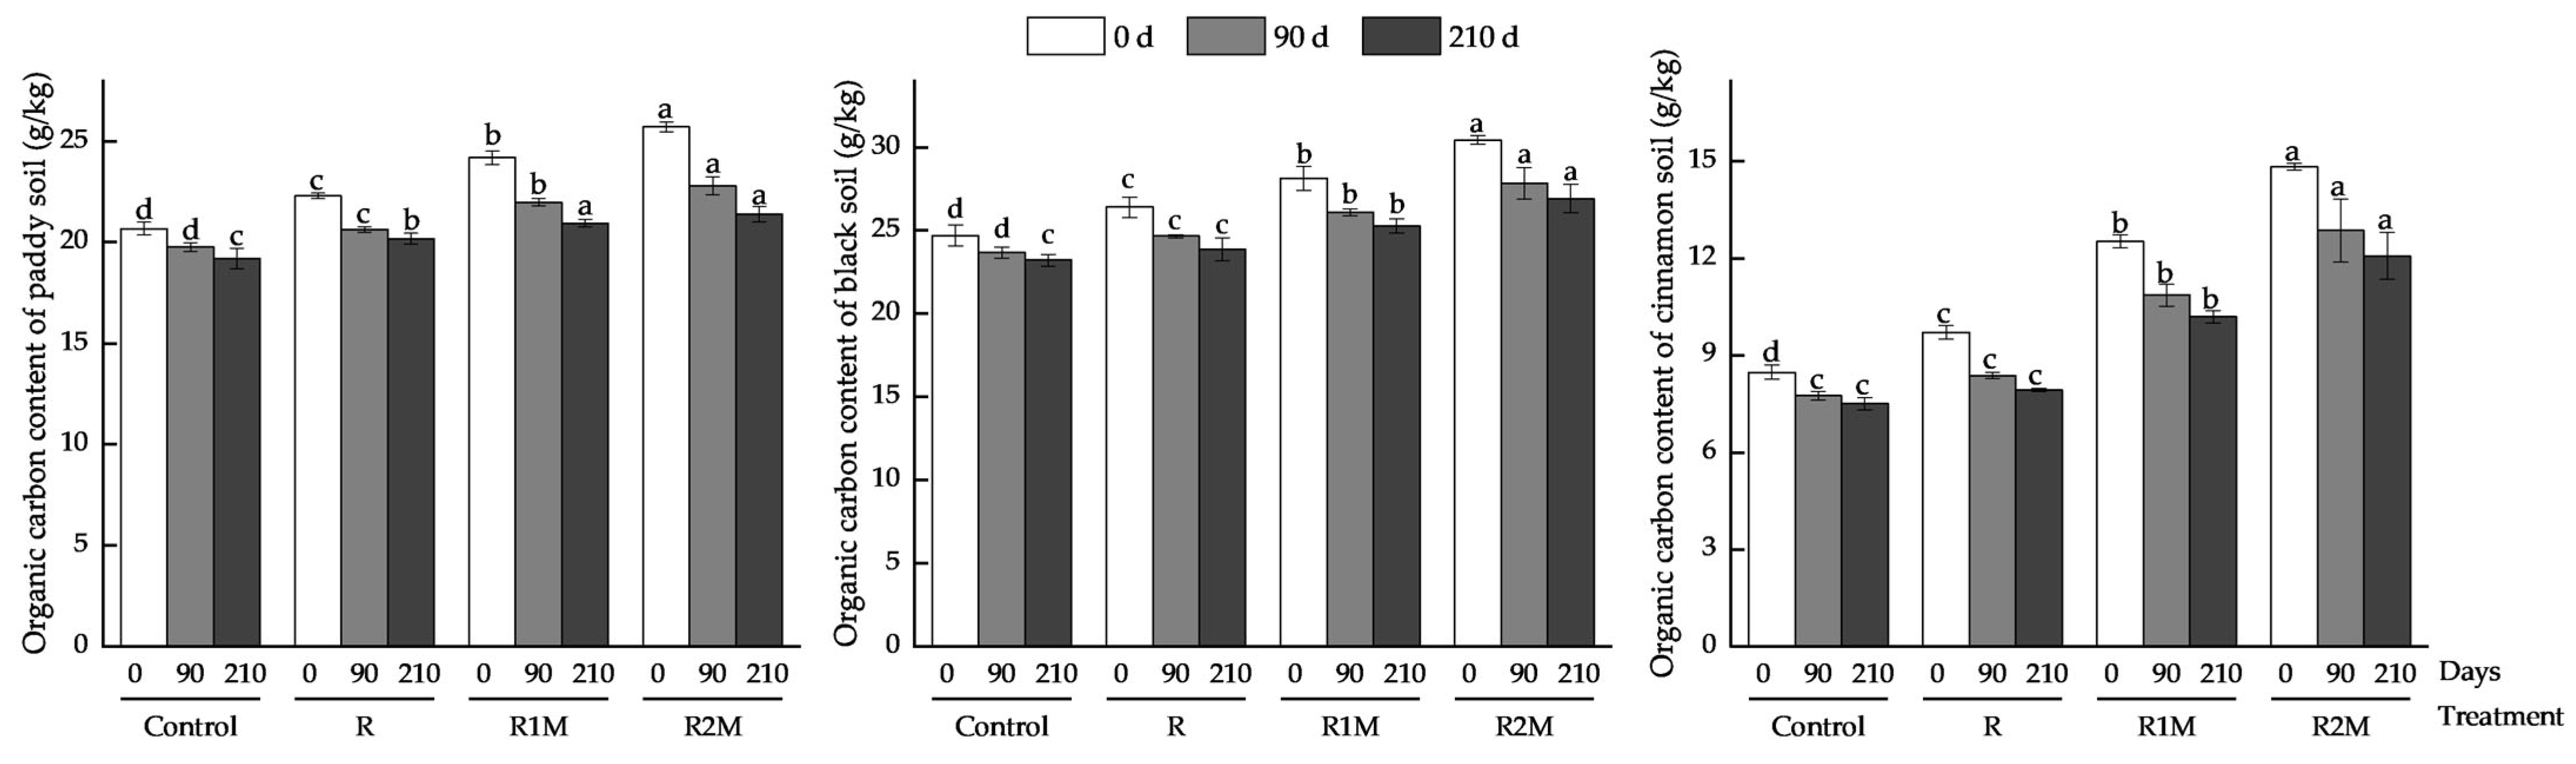
3.4. Organic Carbon Content of Different Types of Soil

Figure 3 displays the organic carbon content of different soil types under various treatments. In the three soil types, the organic carbon content of different treatments decreased as incubation progressed, with differences observed among the treatments (Figure 3). At 0 days of incubation, the organic carbon contents of the three soils showed R2M > R1M > R > Control, with significant differences among the treatments. Specifically, under the R2M treatment, the organic carbon contents in the paddy soil, black soil, and cinnamon soil were significantly higher than the Control by 24.37%, 23.25%, and 74.88%, respectively, indicating that the R2M treatment had the most significant effect on soil organic carbon content at the initial stage of incubation, particularly in the cinnamon soil. At 90 and 210 days post-incubation, the organic carbon contents of the three soil types were essentially the same as those at 0 days. At 90 days of incubation, under the R2M treatment, the organic carbon content of the paddy soil and black soil increased significantly by 15.38% and 17.62% compared with the Control, respectively. For the cinnamon soil, under the R2M treatment, the organic carbon content significantly increased by 59.36% relative to both the Control and R treatments (averaging 8.07 g/kg). At 210 days of incubation, the organic carbon content of the paddy soil under the R1M and R2M treatments (averaging 21.16 g/kg) showed significant increases of 10.21% and 4.91% compared with the Control and R treatment, respectively. For the black, the organic carbon content under the R1M and R2M treatments significantly increased by 7.31% and 14.36%, compared with the Control and R treatments (averaging 23.54 g/kg), respectively. Additionally, the organic carbon content of the cinnamon soil under the R1M and R2M treatments significantly increased by 32.12% and 56.35% compared with the Control and R treatments (averaging 7.72 g/kg), respectively, which indicated that both the R1M and R2M treatments could increase the soil organic carbon during long-term incubation, with the R2M treatment having the most significant effect on cinnamon soil.

3.5. Mineralization Parameters of Organic Carbon in Different Types of Soil

Soil carbon mineralization parameters showed significant differences among different soil types and treatments (Table 4). For the three soil types, the R, R1M, and R2M treatments significantly increased the active carbon pool (Ca), the slow carbon pool (Cs), and the potentially mineralizable carbon pool (Cp) compared with the Control.
In the paddy soil and cinnamon soil, the Ca increased significantly by 82.61% and 169.23% in the R, R1M, and R2M treatments (averaging 0.84 g/kg and 1.05 g/kg) compared with the Control, respectively. In the black soil, the Ca was highest in the R2M treatment (1.20 g/kg), followed by the R and R1M treatments (averaging 1.04 g/kg). The R2M treatment significantly increased the Ca by 179.07% compared with the Control.
The Cs in the paddy soil, black soil, and cinnamon soil were highest under the R2M treatment (4.45 g/kg, 3.10 g/kg, and 2.40 g/kg), with significant differences existing among the three soils. In the paddy soil, compared with the Control, the Cs increased significantly by 283.62%, 165.52%, and 36.21% in the R2M, R1M, and R treatments, respectively. For the black soil, there was no significant difference in the Cs between the R2M and R1M treatments. However, the R2M treatment significantly increased the Cs by 68.48% compared with the Control. In the cinnamon soil, the R2M, R1M, and R treatments showed no significant difference in the Cs (averaging 2.42 g/kg), but these treatments significantly increased the Cs by 76.64% compared with the Control. Cp and Cs exhibited consistent regularity across different soils and under various treatments.
The Cr in the three soils followed the order R2M > R1M > R > Control. For the R2M treatment, the Cr was ranked as black soil > paddy soil > cinnamon soil. In the paddy soil, the Cr significantly increased by 5.88% under the R, R1M, and R2M treatments (averaging 20.18 g/kg) compared with the Control. In the black soil and cinnamon soil, the Cr significantly increased by 15.72% and 75.50% under the R2M treatments, respectively, compared with the Control and R treatments (averaging 22.58 g/kg and 6.49 g/kg). Additionally, the Cr showed a significant difference between the R1M and R2M treatments.
In the paddy soil, the Cm showed the order R2M > R1M > R> Control, and there were significant differences among the treatments, with the R2M treatment being 163.18% higher than the Control. The black soil exhibited a comparable Cm pattern to the paddy soil, yet R2M, R1M, and R treatments (averaging 13.85%) showed no significant differences and were 50.05% higher than the Control. For the cinnamon soil, the Cm showed no significant difference between the Control and the R1M and R2M treatments. However, the Cm under the R2M treatment was 34.89% lower than the R treatment (p < 0.05). Under the R2M treatment, the Cm ranked as cinnamon soil > paddy soil > black soil, with significant differences among the soils. In contrast, under other treatments, there was no significant difference between the paddy soil and the black soil.
For the paddy soil, the ka of the under R and R2M treatments (averaging 1.01 × 10⁻¹ d) significantly decreased by 21.09% compared with the Control. The R1M treatment showed no significant difference in the ka compared with the other treatments. The ks in the R1M and R2M treatments (averaging 0.70 × 10⁻² d) were significantly reduced by 23.08% compared with the Control and R. In the black soil, the ka under the R, R1M, and R2M treatments (averaging 0.91 × 10⁻¹ d) decreased significantly by 46.78% compared with the Control. Meanwhile, the ks under the R2M treatment increased substantially by 59.52% compared with the Control. There was no significant difference between the R1M and R2M treatments regarding the ks. In the cinnamon soil, the ka decreased significantly under the R, R1M, and R2M treatments compared with the Control, with the R1M showing the most significant decrease (37.39%). The ks under the R2M treatment increased by 79.31% compared with the Control, R, and R1M treatments (averaging 0.29 × 10⁻² d). The ks of the paddy soil and black soil were significantly higher than those of the cinnamon soil under the R2M treatment. This indicates that the effects of different treatments on mineralization rate constants vary according to soil types.
The two-way ANOVA showed that soil types, treatments, and their interaction had a significant effect on Ca, ka, Cs, ks, Cp, Cr, and Cm (p < 0.01).

3.6. Correlation Between Organic Carbon and Mineralization Parameters at Different Incubation Times

Correlation analysis showed (Figure 4) that among the three soil types, the SOC0, SOC90, and SOC210 contents were significantly positively correlated (r ≥ 0.92, p < 0.001), and the Ca was significantly positively correlated with the SOC0, SOC90, and SOC210 (r ≥ 0.60, p < 0.05). The Cs in both the paddy soil and black soil were significantly positively correlated with the SOC0, SOC90, and SOC210 (r ≥ 0.81, p < 0.01), while the Cs in the cinnamon soil was not significantly positively correlated with the SOC0, SOC90, and SOC210. The ks for the black soil and cinnamon soil were significantly positively correlated with the SOC0 and SOC90, while the ks for the paddy soil was significantly negatively correlated with the SOC0 and SOC90. The Cp was significantly positively correlated with the SOC0, SOC90, and SOC210 in the paddy soil and black soil (r ≥ 0.65, p < 0.05), while Cp in the cinnamon soil was not significantly positively correlated with the SOC90 and SOC210. There was a significant negative correlation between the Ca and ks in the paddy soil (r = −0.85, p < 0.001), while there was no significant positive correlation between the Ca and ks in the black soil and cinnamon soil. There was a significant positive correlation between the ks and Cr in the black soil and cinnamon soil (r ≥ 0.79, p < 0.01) and a significant negative correlation between the ks and Cr in the paddy soil (r = −0.60, p < 0.05).

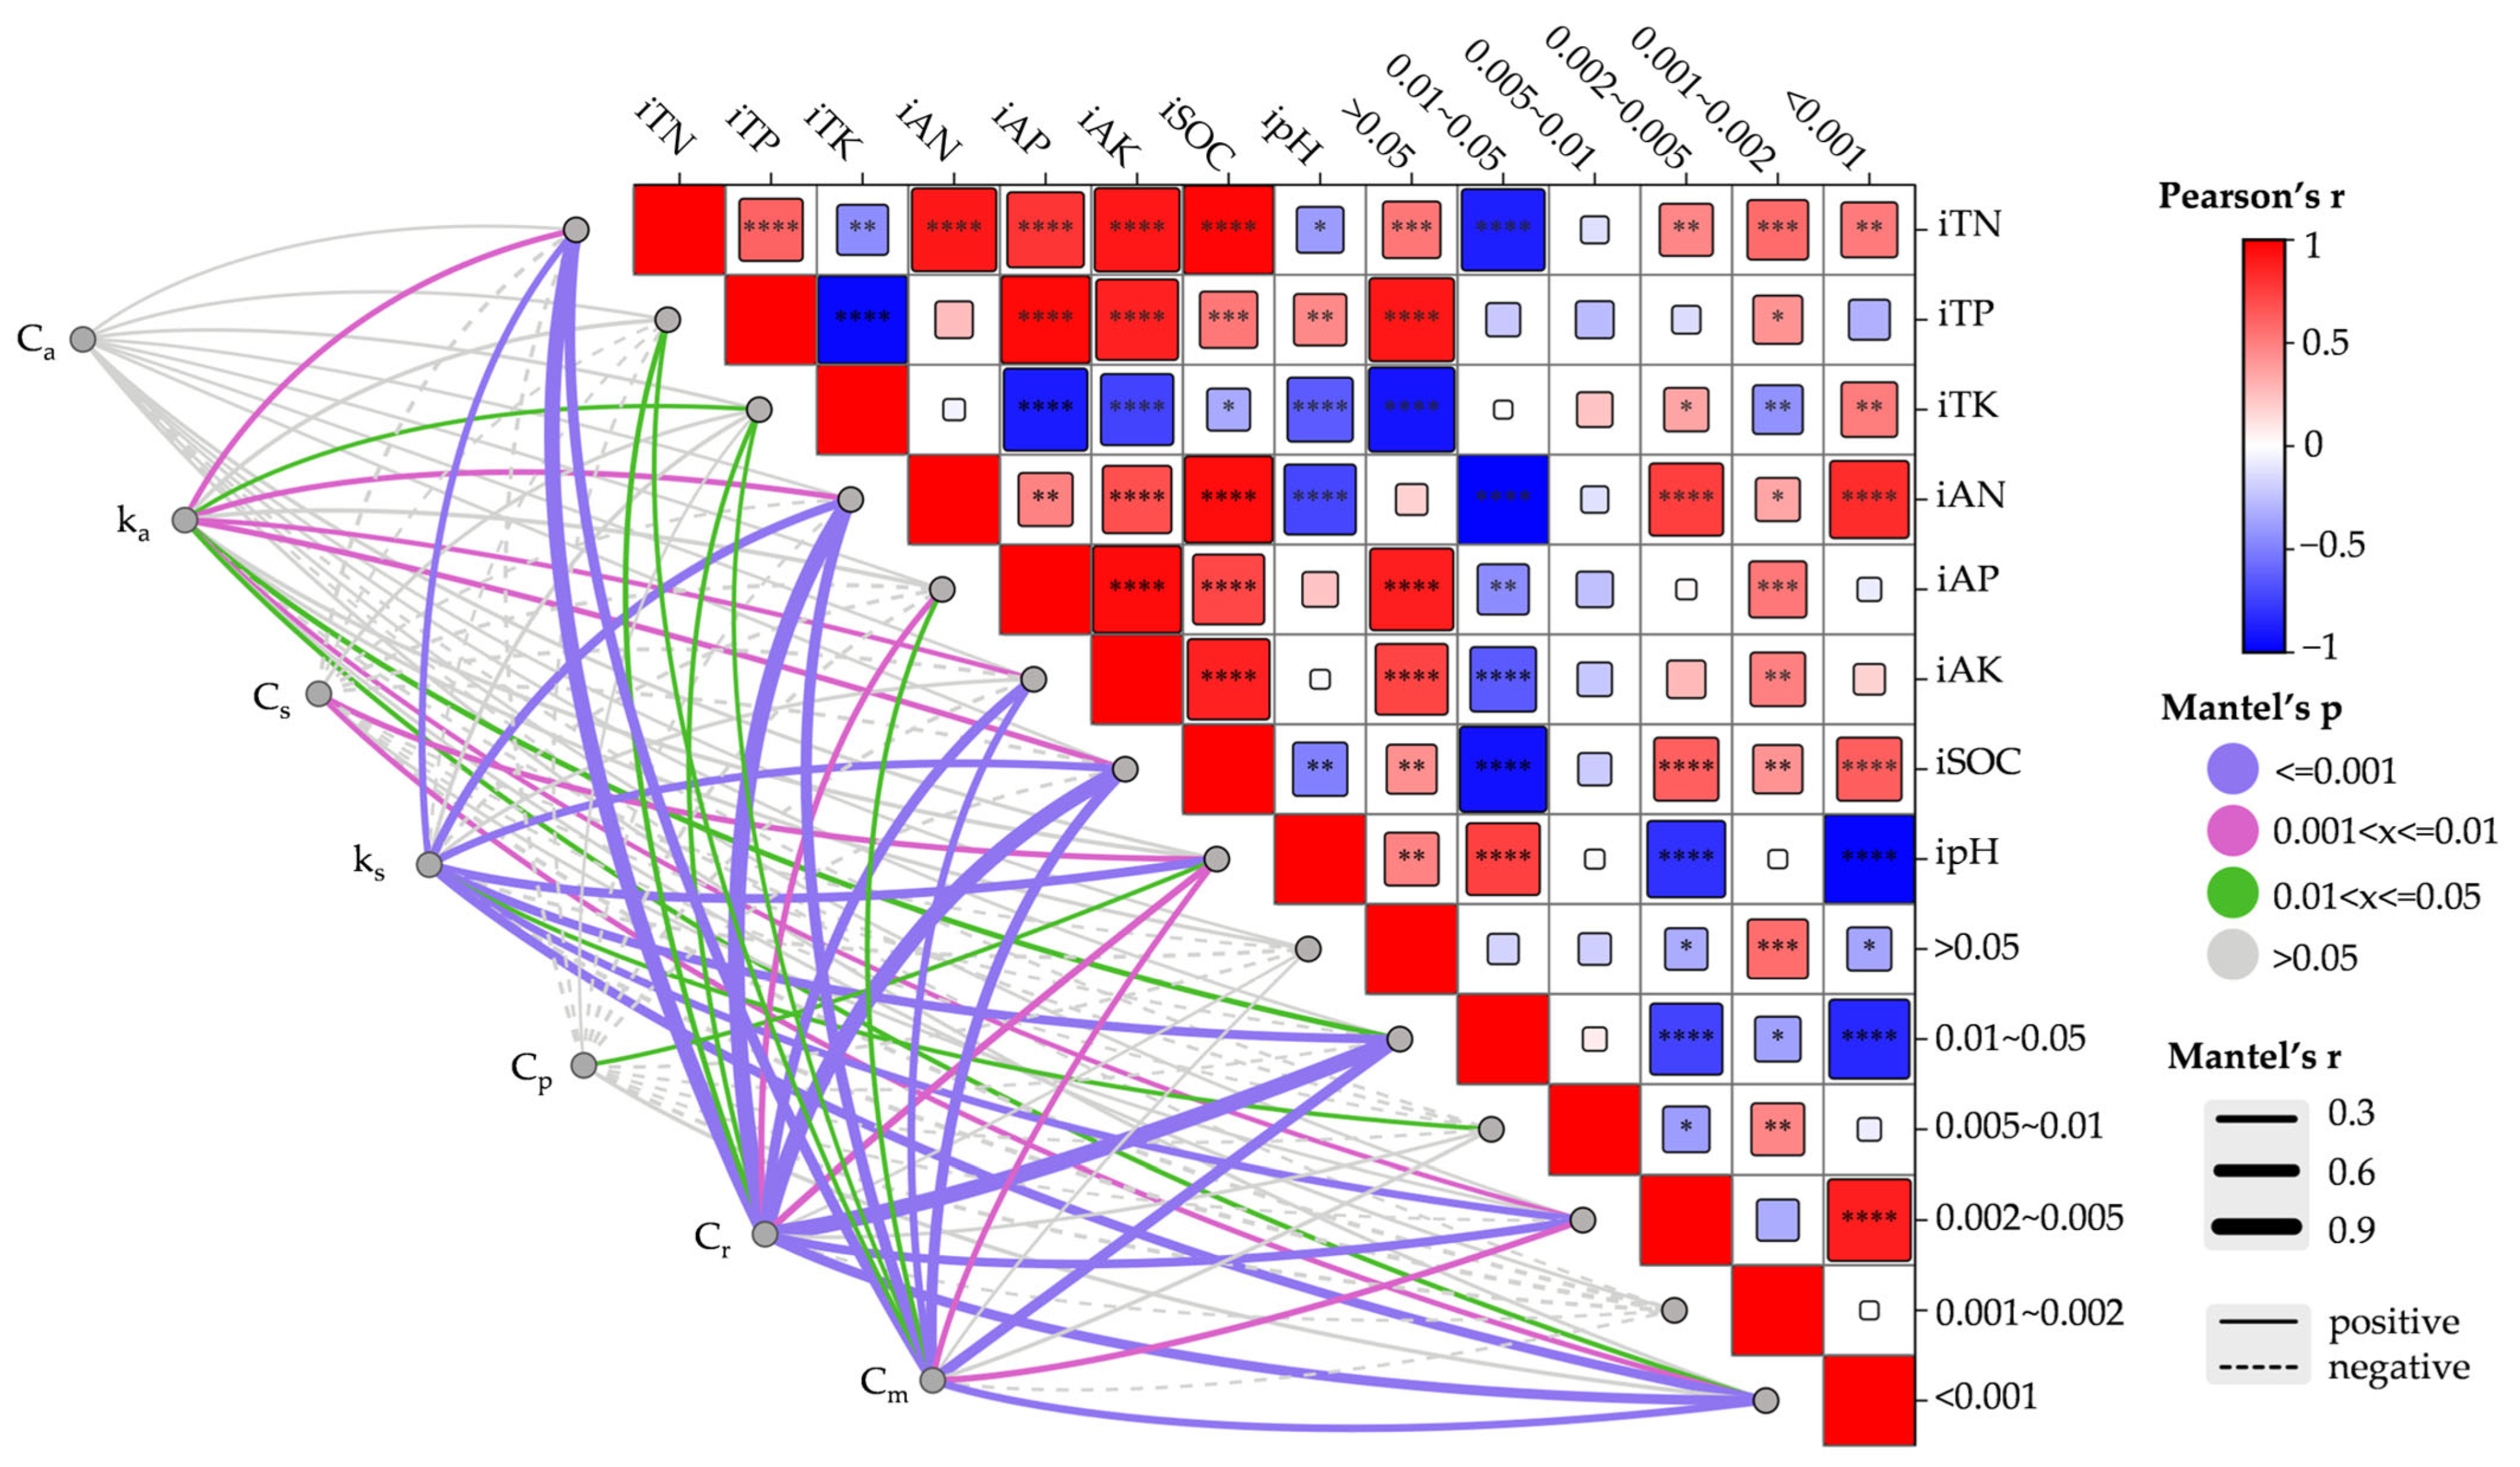
3.7. The Relationship Between the Basic Physicochemical Properties and Particle Composition of the Initial Soil and the Mineralization Parameters

Mantel test correlation analysis showed (Figure 5) that the ka was significantly positively correlated with the iTN, iTK, iAN, iAK, iSOC, 0.05~0.01, 0.005~0.002, and <0.001 mm particles (p < 0.05). The Cs was significantly positively correlated with the ipH and <0.001 mm particles (p < 0.001). The ks was significantly positively correlated with the iTN, iAN, iSOC, ipH, 0.05~0.01, 0.01~0.005, 0.005~0.002, and < 0.001 mm particles (p < 0.05). The Cp was significantly positively correlated with the ipH (p < 0.05). The Cr was significantly positively correlated with the basic physicochemical properties and particle composition of all initial soils except for the >0.05 and 0.002~0.001 mm particles (p < 0.05). The Cm was significantly positively correlated with the basic physicochemical properties and particle composition of all initial soils except for the >0.05, 0.001~0.005, and 0.002~0.001 mm particles (p < 0.05).

4. Discussions

4.1. Carbon Dioxide Emission Rates and Cumulative Emissions from Different Types of Soil

The mineralization of soil organic carbon, under the action of microorganisms, is an essential part of the carbon cycle. The mineralization rate and cumulative mineralization amount of CO2 reflect the speed and intensity of soil organic carbon mineralization (Figure 1 and Figure 2). Our study found that the CO2 emission rates of the three soils were initially rapid and then slowed in the later stage, which is consistent with the results of Liu et al. [23]. During the early stage of incubation, there was a large amount of easily decomposing active organic carbon (such as carbohydrates and proteins) in the soil. Active organic carbon serves as the primary carbon source for microbial activity, which microorganisms use for respiration and release a substantial amount of CO2, leading to a higher emission rate [24]. With the progress of incubation, the residual organic matter in the soil primarily consisted of hard-to-decompose carbon (such as cellulose, lignin, etc.), which is highly stable, has a slower decomposition rate, and results in a gradually stabilized emission rate [25,26]. The CO2 emission rates from the paddy soil and black soil were generally higher than those of the cinnamon soil. Paddy soil features a well-developed pore structure due to its prolonged exposure to alternating flooding and drainage conditions, facilitating gas exchange and microbial activity [27]. Black soil is characterized by its deep humus layers and good aggregation structure, which facilitates good ventilation and promotes the supply of oxygen in the soil, thereby enhancing the oxidation of organic matter [28]. In contrast, cinnamon soil has a relatively compact structure, poor aeration, and insufficient oxygen supply, which restricts the aerobic respiration of soil microorganisms and the decomposition rate of organic matter [29]. Therefore, the CO2 emission rate from the paddy soil and black soil was generally higher than that from the cinnamon soil. The CO2 cumulative emission of the three soils increased with longer incubation time, with a more rapid growth rate in the early stages that tended to stabilize over time. This trend mirrored changes in the CO2 emission rate of soil, indicating that the rapid decomposition of easily decomposed organic carbon in soil was the primary source of organic carbon mineralization. However, this study lacks an in-depth analysis of the dynamic changes in microbial community structure and function during the mineralization of soil organic carbon. This is explained only by the chemical composition of soil organic carbon and the soil’s physicochemical properties. The fine mechanism of microbial response to changes in the organic carbon across different soil types still needs further investigation.
For the paddy soil, on the first day of incubation, the CO2 emission rate of the high compost application rate was lower than that of only adding straw and the low compost application rate. This is mainly because the high compost application rate increased the C/N ratio of the soil; the addition of high C/N organic carbon favored the growth of slow microorganisms (K-strategists), inhibited the growth of fast microorganisms (r-strategists), and reduced the decomposition rate of soil organic carbon [30,31]. In addition, high C/N-induced organic substrate interaction enhanced the stability of soil organic carbon, which inhibits microbial activity and enhances the resistance of organic carbon to decomposition, thereby reducing the rate of decomposition of soil organic carbon [32,33,34]. At the end of the incubation, the CO2 emission rate of compost was significantly higher than that of the Control, indicating that compost had a significant promotion effect on organic carbon mineralization during long-term incubation. It is mainly because the compost has formed relatively stable humus substances during the composting process [35], and these humus substances are more easily utilized by microorganisms in subsequent incubation, thereby accelerating the mineralization rate of organic carbon. In the black soil, at the initial stage of incubation (day 1), the straw addition and low compost application rate significantly decreased the rate of organic carbon mineralization, while the high compost application rate had a certain increase. This is mainly because the black soil itself is rich in organic matter, and the addition of straw has a negative excitation effect at the initial stage, which inhibits the mineralization of the original organic carbon in the soil [36]. The increase in microbial activity of a small amount of compost (low compost application rate) was not enough to offset the inhibition of straw addition, and when the amount of compost was increased, although it could provide more microorganisms and nutrients, the improvement effect was limited. After 3~7 days of incubation, the CO2 emission rate gradually increased under the addition of straw and compost, indicating that the black soil microbial community required a certain amount of time to adapt to the new environment after the addition of exogenous carbon. In the late stage of incubation, the CO2 emission rate of each treatment gradually decreased. However, the CO2 emission rate of each treatment still maintained a higher release rate under the high compost application rate. This is mainly because a high compost application rate provides more organic carbon and a greater diversity of microbial communities [37,38], which allows for a higher release rate for a longer period. During the initial stage of incubation (1~3 days), the mineralization rate of organic carbon in the cinnamon soil with the high compost application rate was significantly higher than that with straw addition and low compost application rate. It is mainly due to the low organic carbon content of the cinnamon soil, and with the addition of a high amount of compost, the content of active organic carbon that is easy to decompose in the soil was increased, which in turn promotes the CO2 emission rate of cinnamon soil. By the end of the incubation, the CO2 emission rate was significantly increased under the high compost application rate, indicating that the high amount of compost added had a continuous promotion effect on the long-term organic carbon mineralization of the cinnamon soil. From the cumulative emission amount, the difference in cumulative emission among the three soils under different treatments gradually increased with the extension of incubation time, especially in the compost treatment, which showed a higher cumulative release amount. The straw and compost contained a large number of organic matter, microorganisms, enzymes, and other diverse bioactive substances, which could accelerate the decomposition of new input and original organic carbon in the soil [39]. This further illustrates the significant contribution of compost to the mineralization of soil organic carbon. The effects of exogenous straw addition and compost on soil organic carbon mineralization varied with soil types and the amount of addition. The addition of compost had a more significant effect on organic carbon mineralization in long-term cultivation.

4.2. Dynamic Changes in Soil Organic Carbon Content of Different Types of Soil

The properties of the soil regulate the variation in soil organic carbon content. In this study, we found that the soil organic carbon content for each treatment decreased with the progress of incubation time in the three soil types (Figure 3). This decrease was mainly due to soil incubation being a process of carbon loss [40]. During the incubation process, active organic carbon components (easily oxidized organic carbon, soluble organic carbon) were decomposed and utilized by microorganisms, converting complex organic carbon into simple compounds (CO2) [41], resulting in a decrease in soil organic carbon content. At each incubation period, the organic carbon content of the three soils under each treatment was highest with the high compost application rate, indicating that compost and straw as organic materials significantly increased the soil organic carbon content to a certain extent, aligning with the research results of Liu et al. [42]. Compost, as an exogenous organic material, is rich in carbon and significantly contributes to the input of exogenous carbon into the soil. The soil organic carbon content after applying organic materials mainly depends on the balance between the input and output of organic carbon in the process of microbial decomposition [41]. The addition of compost can enhance the available carbon pool for soil microbes, boost soil microbial biomass and aggregate formation, and sustain the soil structure along with the associated physical stability of soil organic matter. Consequently, the soil aggregate structure creates diverse habitats, altering the soil microbial community [43]. This further confirmed that the CO2 emission rate and cumulative emission amount were significantly increased with the addition of compost. For the three soils, the organic carbon content of the cinnamon soil displayed the highest increase under various treatments, particularly with the high compost application rate. The soil organic carbon content increased by 56.35% after 210 days of incubation, while the organic carbon content of the paddy soil and black soil also increased, but the magnitude was relatively minor. On the one hand, it is related to the initial soil organic carbon content. The initial organic carbon content of the cinnamon soil is low (Table 2), and the soil organic carbon is far from saturation level, typically showing a high potential and efficiency for soil carbon sequestration [44,45,46]. The decomposition and release of exogenous organic matter into the soil increases the soil organic carbon content and slows its loss [47]. On the other hand, soil pH affects the change in soil organic carbon content to a certain extent [48]. Xiao et al. [49] found that the increase in organic carbon content in acidic soils was significantly lower than in neutral and alkaline soils. The cinnamon soil was classified as alkaline, whereas the paddy soil and black soil were categorized as acidic and neutral (Table 2). This is primarily due to the decrease in soil pH, which inhibits microbial activity, reduces the decomposition of exogenous organic matter, and subsequently lowers the output of exogenous carbon [50,51]. Soil aggregates are fundamental soil particles created through the interaction of mineral, organic matter, and microorganisms, and they serve as the primary storage locations for soil organic carbon [52]. The particle content of 0.01~0.05 mm in the cinnamon soil was significantly higher than that in the paddy soil and black soil. The particles in the 0.01~0.05 mm range exhibited a higher specific surface area and strong adsorption capacity, allowing them to adsorb a part of the organic carbon onto their surface. In addition, exogenous organic materials (high compost application rate) can participate in the formation of soil aggregates through organic-inorganic cementation and clay encapsulation [53], which further enhances the physical protection of aggregates for organic carbon and ultimately leads to an increase in soil organic carbon by the end of incubation. There were obvious differences in the accumulation of organic carbon among different soil types. In cinnamon soil, due to its high carbon sequestration potential and efficiency, the soil organic carbon content can be rapidly increased by raising the input of organic materials (such as compost). It is recommended that a higher compost can be applied to the cinnamon soil to fully utilize its carbon fixation advantage. For paddy soil and black soil, due to the relatively modest increase in organic carbon, it should be combined with other soil management practices to achieve stable accumulation of soil organic carbon. However, this study has some limitations. While this study simulates the natural environment, certain aspects still differ from the actual complex natural soil environment. For instance, in nature, soil is influenced by various factors, such as vegetation growth, animal activities, and climate change. These factors are not fully represented in this experiment, which may affect the accuracy of extrapolating the research results to real natural soil conditions.

4.3. Kinetic Characteristics of Organic Carbon Mineralization in Different Types of Soil

Soil organic carbon mineralization is the primary pathway of soil organic carbon loss in farmland [54]. The stability of organic carbon in soil mainly depends on the size of the active carbon pool and the slow carbon pools within the soil. The mineralization rate constants ka and ks typically reflect the dependent relationship between the potentially mineralizable carbon pool and the active or slow mineralizable carbon [55]. The potentially mineralizable carbon pool indicates the mineralization potential of soil organic carbon. For the three soils, the addition of compost and straw significantly increased soil carbon pool content and the long-term potential for carbon mineralization. This effect is mainly due to the interaction between stable organic matter in compost (humus matter, etc.) [35] and refractory components in straw (cellulose, lignin, etc.) [56], which fosters the accumulation of soil carbon pools and ultimately promotes the fixation of soil organic carbon [57]. Straw and compost contain a large amount of active carbon. The increase in active organic carbon led to enhanced microbial activity, thereby increasing the potentially mineralizable carbon pool in the soils [58]. The difference in the rate of mineralization of slow carbon pools exhibited by different soil types is closely related to the basic physicochemical properties of the soil (Figure 5). Malik et al. [59] found that in acidic soils, abiotic factors limit the growth and decomposition of microorganisms, as well as their slower growth rate, which in turn limits the decomposition of organic matter and ultimately leads to the accumulation of organic carbon. The paddy soil was acidic (pH = 5.35), resulting in an increase in the active carbon pool and the slow carbon pool of the paddy soil, while the corresponding mineralization rate decreased with the high compost application rate. However, unlike paddy soil, cinnamon soil had an increased rate of slow carbon pool mineralization after compost addition. Studies have found that composting sludge treatment reduces microbial carbon utilization efficiency [35], which means that microorganisms utilize organic carbon primarily for growth and metabolism rather than decomposing it into carbon dioxide released into the atmosphere. The compost added to the soil brings more refractory organic carbon content, such as humus carbon [60], which is relatively stable in the soil and has a low mineralization rate. At the same time, in acidic conditions, microbial decomposition activities are limited, facilitating the fixation and storage of these organic carbons rather than being rapidly decomposed into carbon dioxide. In addition, the paddy soil has a sticky texture, and the high proportion of fine particles smaller than 0.001 mm enables water to exist in an adsorption form, creating a relatively submerged microenvironment that slows down the decomposition rate of organic carbon. The cinnamon soil has a higher proportion of particles larger than 0.01 mm and a looser texture. This structure allows water in the soil to be lost more easily through macropores, providing favorable living conditions for aerobic microorganisms. Compost is rich in soluble organic carbon and nutrients, which can significantly stimulate the activity of microorganisms in cinnamon soil [61], especially aerobic microorganisms, thereby accelerating the decomposition of soil organic carbon and increasing the mineralization rate of the slow carbon pool. The slow carbon pool mineralization rate of the paddy soil was significantly negatively correlated with the organic carbon content across different incubation durations. In contrast, the slow carbon pool mineralization rate of the black soil and cinnamon soil was significantly positively correlated. Therefore, organic carbon content is a contributing factor to the variation in the slow carbon pool mineralization rate across soil types. The ratio of the potentially mineralizable carbon pool in the soil to the organic carbon at the beginning of incubation is the mineralization entropy, which characterizes the soil’s carbon sequestration capacity. In this study, we found that the high compost application rate significantly increased the mineralization entropy of both the paddy soil and the black soil. In contrast, for the cinnamon soil, the mineralization entropy associated with a high compost application rate was significantly lower than that under the straw-only addition, indicating that the addition of compost reduced the impact of straw on the mineralization entropy of the cinnamon soil. Under the high compost application rate, the mineralization entropy was as follows: cinnamon soil > paddy soil > black soil, with significant differences among different soil types, indicating that the high compost application rate can significantly improve the carbon sequestration capacity of the paddy soil and black soil, while the cinnamon soil demonstrates higher carbon sequestration capacity. On the one hand, soil organic carbon content is an important factor affecting mineralization entropy (Figure 4). The organic carbon content of both paddy soil and black soil shows a significant positive correlation with mineralization entropy. In contrast, the organic carbon content of cinnamon soil has no significant correlation with mineralization entropy. On the other hand, the differences in nutrient content and structure among various soil types affect the mineralization entropy (Table 2 and Table 3 and Figure 5), with cinnamon soil showing higher clay mineral content and a more stable aggregate structure [19]. The addition of compost shows elevated mineralization entropy and carbon sequestration potential. In this study, we found that the stable carbon pool of the cinnamon soil increased significantly by adding high compost ratee, and the increase was the highest in cinnamon soil, which was mainly because the cinnamon soil had relatively lower organic carbon content and higher carbon fixation potential and efficiency than paddy soil and black soil, while the compost contained a large amount of humus material and demonstrated greater stability, so the cinnamon soil has the highest increase in stable carbon pool content. The addition of compost significantly increases the carbon pool content and mineralization potential in soils; however, the response varies among different soil types. In particular, compost addition can significantly improve the carbon sequestration capacity and stable carbon pool content of soils, with cinnamon soil exhibiting the highest carbon sequestration potential and efficiency. Plant growth plays an important role in the soil carbon cycle, but this study did not address the feedback effects of plant growth on the soil carbon cycle. In practical agricultural production, plant root exudates and residues contribute a large amount of organic carbon to the soil, and plant growth also affects the soil’s physical structure and microbial habitat environment, thereby influencing the mineralization and fixation of organic carbon. In future research, plant growth factors should be included in the research system to comprehensively evaluate the impact of plant–soil interaction on soil organic carbon mineralization and fixation, explore the feedback effect of plant root exudates on soil organic carbon mineralization and fixation with compost addition, and the impact of different plant species and soil types on the carbon cycle, so as to provide guidance for optimizing agricultural planting mode and enhancing soil carbon sink function.

5. Conclusions

At the end of the incubation, the compost addition significantly increased the SOC content in the three types of soil compared with the Control, with the cinnamon soil showing the greatest increase, corresponding to the cumulative CO2 release. The compost addition significantly enlarged the soil mineralizable carbon pool and decreased the mineralization rate of the active carbon pool. In the black soil and cinnamon soil, the mineralization rate of the slow carbon pool was enhanced after compost addition, while it decreased in the paddy soil. The mineralization entropy ranked as cinnamon soil > paddy soil > black soil, and either residue or compost addition could significantly increase the mineralization entropy of the paddy soil and the black soil, but compost addition lowered the value in cinnamon soil compared with residue addition. These differences were primarily related to the initial nutrient content of the soil, pH, and particle composition. Therefore, compost application in farmland, especially in cinnamon soil, is essential and effective, whether for nutrient input (which we commonly focus on) or carbon pool management.
Future research should expand the study of microbial community structure and function, including long-term field positioning experiments and studies on plant–soil system interactions. Additionally, it is crucial to improve composting and straw-returning methods and strategies to deepen the understanding of the soil organic carbon cycle and to provide a scientific basis and technical support for carbon management in agricultural ecosystems.

Author Contributions

Conceptualization, S.Z., X.C. and M.X.; methodology, S.Z., X.C., A.S., M.X., F.Z., X.X. and J.G.; investigation, S.Z., A.S., F.Z. and L.Z.; data curation, S.Z., X.C., A.S., J.Z., X.X. and J.G.; writing-original draft preparation, S.Z. and X.C.; writing-review and editing, S.Z., X.C., A.S., M.X., F.Z., L.Z., J.Z., X.X. and J.G.; visualization, S.Z.; supervision, X.C. and M.X.; resources, X.C. and M.X.; funding acquisition, X.C. and M.X. All authors have read and agreed to the published version of the manuscript.

Funding

This research was supported by the National Natural Science Foundation of China (41601309), Henan Provincial Joint Fund for Science and Technology Research Program (242103810032), the Scientific and Technological Research Project in Henan Province (252102320074), and the Graduate Innovation Fund Project of Henan University of Science and Technology (CXJJ-2025-CY05).

Data Availability Statement

The authors confirm that all data underlying the findings are fully available without restriction. All relevant data are within the paper.

Conflicts of Interest

Author Fenggang Zhang was employed by the Jiangsu Rotam Chemistry Co., Ltd. The remaining authors declare that the research was conducted in the absence of any commercial or financial relationships that could be construed as a potential conflict of interest.

References

  1. Wang, M.; Guo, X.; Zhang, S.; Xiao, L.; Mishra, U.; Yang, Y.; Zhu, B.; Wang, G.; Mao, X.; Qian, T.; et al. Global soil profiles indicate depth-dependent soil carbon losses under a warmer climate. Nat. Commun. 2022, 13, 5514. [Google Scholar] [CrossRef] [PubMed]
  2. Georgiou, K.; Koven, C.; Riley, W.; Torn, M. Toward improved model structures for analyzing priming: Potential pitfalls of using bulk turnover time. Glob. Change Biol. 2015, 21, 4298–4302. [Google Scholar] [CrossRef] [PubMed]
  3. Caitlin, E.; Castanha, C.; Porras, R.; Torn, M. The whole-soil carbon flux in response to warming. Science 2017, 355, 1420–1423. [Google Scholar]
  4. Zhang, S.; Wang, M.; Xiao, L.; Guo, X.; Zheng, J.; Zhu, B.; Luo, Z. Reconciling carbon quality with availability predicts temperature sensitivity of global soil carbon mineralization. Proc. Natl. Acad. Sci. USA 2024, 121, e2313842121. [Google Scholar] [CrossRef]
  5. Lü, Z.; Liu, X.; Zhong, J.; Lan, X.; Hou, H.; Ji, J.; Feng, Z.; Liu, Y. Effects of Long-Term Fertilization on Mineralization of Soil Organic Carbon in Red Paddy Soil. Sci. Agric. Sin. 2019, 52, 2636–2645. [Google Scholar]
  6. Parton, W.; Stewart, W.; Cole, C. Dynamics of C, N, P and S in grassland soils: A model. Biogeochemistry 1998, 5, 109–131. [Google Scholar] [CrossRef]
  7. Denis, C.; Campbell, C.; Abdul, J. Effects of acidity on mineralization: pH-dependence of organic matter mineralization in weakly acidic soils. Soil Biol. Biochem. 1998, 30, 57–64. [Google Scholar]
  8. Varney, R.; Chadburn, S.; Burke, E.; Cox, P. Evaluation of soil carbon simulation in CMIP6 Earth system models. Biogeosciences 2022, 19, 4671–4704. [Google Scholar] [CrossRef]
  9. Alejandro, D.; Andrew, J.; Ramón, E. Decomposing Temperature Extremes Errors in CMIP5 and CMIP6 Models. Geophys. Res. Lett. 2020, 47, e2020GL088031. [Google Scholar]
  10. Paul, E.; Van, V. The use of tracers to determine the dynamic nature of organic matter. In Proceedings of the 11th International Society of Soil Science, Edmonton, AB, USA, 19–27 June 1978; pp. 61–102. [Google Scholar]
  11. Li, Z.; Liu, M.; Wu, X.; Han, F.; Zhang, T. Effects of long-term chemical fertilization and organic amendments on dynamics of soil organic C and total N in paddy soil derived from barren land in subtropical China. Soil Tillage Res. 2009, 106, 268–274. [Google Scholar] [CrossRef]
  12. Zhang, B.; Dou, S.; Guo, D.; Guan, S. Straw Inputs Improve Soil Hydrophobicity and Enhance Organic Carbon Mineralization. Agronomy 2023, 13, 2618. [Google Scholar] [CrossRef]
  13. Wang, Y.; Yang, D.; Hong, Y.; Zhao, J.; Xuan, Q.; Huo, L.; Tan, B.; Xiu, W.; Wang, L. Characteristics of soil organic carbon mineralization in the soil of maize fields with different soil fertility. J. Agro-Environ. Sci. 2019, 38, 590–599. [Google Scholar]
  14. Li, S.; Qiu, L.; Zhang, X. Mineralization of soil organic carbon and its relations with soil physical and chemical properties on the Loess Plateau. Acta Ecol. Sin. 2010, 30, 1217–1226. [Google Scholar]
  15. Wu, M.; Li, Z.; Feng, Y.; Chen, R.; Jiang, C.; Liu, M. Dynamic Differences of Organic Carbon Mineralization in Differentypes of Paddy Soil Under Long-Term Located Fertilization. Sci. Agric. Sin. 2016, 49, 1705–1714. [Google Scholar]
  16. Li, M.; Chen, T.; Hong, X.; Yu, T.; Hu, Y. Effects of adding exogenous carbon with different chemical structure on the dynamics of organic carbon mineralization in red and sandy soils. Chin. J. Ecol. 2021, 40, 1609–1617. [Google Scholar]
  17. Mamedov, I.; Huang, C.; Aliev, F.; Levy, G. Aggregate Stability and Water Retention Near Saturation Characteristics as Affected by Soil Texture, Aggregate Size and Polyacrylamide Application. Land Degrad. Dev. 2017, 28, 543–552. [Google Scholar] [CrossRef]
  18. Wu, D.; Mehmet, S.; Zang, H.; Ugurlar, F.; Aydemir, S.; Brüggemann, N.; Kuzyakov, Y.; Bol, R.; Evgenia, B. Effect of biochar origin and soil pH on greenhouse gas emissions from sandy and clay soils. Appl. Soil Ecol. 2018, 129, 121–127. [Google Scholar] [CrossRef]
  19. Zhao, Y.; Yin, H.; Hu, X.; Xie, W.; Liu, Z.; Zhou, H.; Yang, Z. Characteristics and Driving Forces of Organic Carbon Mineralization in Brown Soil with Long-term Straw Returning. Environ. Sci. 2024, 45, 2353–2362. [Google Scholar]
  20. Li, N.; Teng, P.; Lei, W.; Long, J.; Li, L. Effects and mechanisms of addition of different types of exogenous organic materials on priming effect of organic carbon in arable black soils. Chin. J. Eco-Agric. 2023, 31, 1588–1601. [Google Scholar]
  21. Hu, S.; Nan, Q.; Wen, L.; Zhao, L. Effects of adding microplastics and rice straw on emission of CO2 from typical farmland soils. J. Huazhong Agric. Univ. 2024, 43, 219–228. [Google Scholar]
  22. Xi, W.; Xu, X.; Zhao, S.; Wei, D.; Zhou, B.; Huang, S.; Yu, X.-C.; Qiu, S.; He, P.; Zhou, W. Comparison of organic carbon content and its mineralization potential in three dryland soils under long-term fertilization. J. Plant Nutr. Fertil. 2021, 27, 2094–2104. [Google Scholar]
  23. Liu, S.; Chen, F.; Wang, C.; Kong, F.; Jiang, Z. Effects of polyethylene microplastics with different particle sizes on soil organic carbon characteristics and mineralization in agricultural soil. Environ. Sci. 2025, 46, 3161–3170. [Google Scholar]
  24. Shi, Y.; Zeng, H.; Fang, L.; Deng, Y.; Xiao, R. Mineralization and humification of chicken manure and composted kitchen waste in soils based on an in situ litter-bag experiment: Impacts of organic inputs and microbial community. Front. Agr. Sci. Eng. 2024, 11, 602–614. [Google Scholar]
  25. Guo, L.; Wu, G.; Li, Y.; Li, C.; Liu, W.; Meng, J.; Liu, H.; Yu, X.; Jiang, G. Effects of cattle manure compost combined with chemical fertilizer on topsoil organic matter, bulk density and earthworm activity in a wheat–maize rotation system in Eastern China. Soil Tillage Res. 2016, 156, 140–147. [Google Scholar] [CrossRef]
  26. Ahmed, H.; Adel, R.; Abdulrasoul, A.; Yong, S.; Mahtab, A.; Mohammad, I. Carbon mineralization and nutrient availability in calcareous sandy soils amended with woody waste biochar. Chemosphere 2015, 138, 67–73. [Google Scholar]
  27. Liu, Y.; Ge, T.; Zhu, Z.; Liu, S.; Luo, Y.; Li, Y.; Wang, P.; Gavrichkova, O.; Xu, X.; Wang, J.; et al. Carbon input and allocation by rice into paddy soils: A review. Soil Biol. Biochem. 2019, 133, 97–107. [Google Scholar] [CrossRef]
  28. Jiang, Y.; Tang, J.; Sun, Z. Study on the Factors Affecting the Humus Horizon Thickness in the Black Soil Region of Liaoning Province, China. Agronomy 2024, 14, 2106. [Google Scholar] [CrossRef]
  29. Chen, H.; Zhou, H.; Wen, Y.; Xiang, Y.; Cheng, M. Ecological stoichiometric characteristics of nutrients and enzyme activities in brown soil under long-term fertilization. J. Plant Nutr. Fertil. 2022, 28, 972–983. [Google Scholar]
  30. Zhang, P.; Hu, W.; Guan, Z.; Wang, C.; Ma, X.; Zou, Y. Effects of grass on soil nutrients, enzyme activities and bacterial community in apple orchard. Northwest A&F Univ. Nat. Sci. Ed. 2024, 52, 96. [Google Scholar]
  31. Wei, S.; Chen, X.; Zhao, G.; Li, Y.; Dong, Y.; Jiao, R.; Zhang, X. Effects of close-to-nature transformation of Chinese fir plantation on soil chemical properties and enzyme activities. Acta Ecol. Sin. 2024, 44, 4277–4287. [Google Scholar]
  32. Zhang, R.; Yuan, D.; Qin, S.; Hu, C. Effects of carbon, nitrogen, and phosphorus stoichiometry on the priming of soil carbon mineralization. Chin. J. Eco-Agric. 2023, 31, 1311–1321. [Google Scholar]
  33. Börger, M.; Bublitz, T.; Dyckmans, J.; Wachendorf, C.; Jørgensen, R.G. Microbial carbon use efficiency of litter with distinct C/N ratios in soil at different temperatures, including microbial necromass as growth component. Biol. Fertil. Soils 2022, 58, 761–770. [Google Scholar] [CrossRef]
  34. Guenet, B.; Camino-Serrano, M.; Ciais, P.; Tifafi, M.; Maignan, F.; Soong, J.L.; Janssens, I.A. Impact of priming on global soil carbon stocks. Glob. Change Biol. 2018, 24, 1873–1883. [Google Scholar] [CrossRef] [PubMed]
  35. Mercer, G.D.; Mickan, B.S.; Gleeson, D.B.; Walker, E.; Krohn, C.; Bühlmann, C.H.; Ryan, M.H. Probing the pump: Soil carbon dynamics, microbial carbon use efficiency and community composition in response to stoichiometrically-balanced compost and biochar. Soil Biol. Biochem. 2025, 205, 109770. [Google Scholar] [CrossRef]
  36. Zhou, G.; Li, G.; Liang, H.; Liu, R.; Ma, Z.; Gao, S.; Chang, D.; Liu, J.; Chadwick, D.R.; Jones, D.L.; et al. Green Manure Coupled With Straw Returning Increases Soil Organic Carbon via Decreased Priming Effect and Enhanced Microbial Carbon Pump. Glob. Change Biol. 2025, 31, e70232. [Google Scholar] [CrossRef]
  37. Jiang, Z.; Zhang, P.; Wu, Y.; Wu, X.; Ni, H.; Lu, Q.; Zang, S. Long-term surface composts application enhances saline-alkali soil carbon sequestration and increases bacterial community stability and complexity. Environ. Res. 2024, 240, 117425. [Google Scholar] [CrossRef]
  38. Li, J.; Wang, Q.; Liang, B.; Wang, W.; Liu, J. The impact of green waste on carbon sequestration and emission reduction in coastal saline soil and its effect on microbial community structure. Environ. Eng. 2024, 42, 95–101. [Google Scholar]
  39. Paterson, E.; Sim, A. Soil-specific response functions of organic matter mineralization to the availability of labile carbon. Glob. Change Biol. 2013, 19, 1562–1571. [Google Scholar] [CrossRef]
  40. Chen, X.; Wu, S.; Kou, T.; Xu, P.; Tan, X.; Guo, D. Transport of straw-derived carbon in black soil and cinnamon soil and its response to nitrogen fertilization. Acta Pedol. Sin. 2022, 59, 1248–1257. [Google Scholar]
  41. Song, W.; Liang, Y.; Tao, Z.; Zhong, Q.; He, Y. Advances on soil organic carbon dynamics mediated by microorganisms. Adv. Earth Sci. 2023, 38, 1213–1223. [Google Scholar]
  42. Liu, S.; Wang, J.; Pu, S.; Evgenia, B.; Yakov, K.; Bahar, S. Impact of manure on soil biochemical properties: A global synthesis. Sci. Total Environ. 2020, 745, 141003. [Google Scholar] [CrossRef] [PubMed]
  43. Wang, D.; Lin, J.; Sayre, J.; Schmidt, R.; Fonte, S.; Rodrigues, J.; Scow, K. Compost amendment maintains soil structure and carbon storage by increasing available carbon and microbial biomass in agricultural soil-A six-year field study. Geoderma 2022, 427, 116117. [Google Scholar] [CrossRef]
  44. Yan, X.; Zhou, H.; Zhu, Q.; Wang, X.; Zhang, Y.; Yu, X.; Peng, X. Carbon sequestration efficiency in paddy soil and upland soil under long-termfertilization in southern China. Soil Tillage Res. 2013, 130, 42–51. [Google Scholar] [CrossRef]
  45. Zuijdeest, A.; Baumgarther, S.; Wehrli, B. Hysteresis effects in organic matter turnover in a tropical floodplain during a flood cycle. Biogeochemistry 2016, 131, 49–63. [Google Scholar] [CrossRef]
  46. Zhao, Y.; Wu, S.; Bol, R.; Mansoor, A.; Wu, W.; Hu, Y.; Meng, F. Intensive organic vegetable production increases soil organic carbon but with a lower carbon conversion efficiency than integrated management. J. Plant Nutr. Soil Sci. 2020, 183, 155–168. [Google Scholar] [CrossRef]
  47. Pan, J.; Dai, W.; Shang, Z.; Guo, R. Review of research progress on the influence and mechanism of filed straw residue incorporation on soil organic matter and nitrogen availability. Chin. J. Eco-Agric. 2013, 21, 526–535. [Google Scholar] [CrossRef]
  48. Chen, Y.; Marta, C.; Shen, Q.; Singh, B.; Maria, L. The long-term role of organic amendments in building soil nutrient fertility: A meta analysis and review. Nutr. Cycl. Agroecosyst. 2018, 111, 103–125. [Google Scholar] [CrossRef]
  49. Xiao, G.; Liu, L.; Zhao, Y.; Ru, S.; Zhao, O.; Hou, L.; Sun, S.; Wang, L.; Wang, C. Effects of organic materials input on soil organic carbon in China based on Meta-analysis. Soil Fertil. Sci. China 2023, 8, 23–32. [Google Scholar]
  50. Ding, J.; Chen, L.; Zhang, B.; Liu, L.; Yang, G.; Fang, K.; Chen, Y.; Li, F.; Kou, D.; Ji, C.; et al. Linking temperature sensitivity of soil CO2 release to substrate, environmental, and microbial properties across alpine ecosystems. Glob. Biogeochem. Cycles 2016, 30, 1310–1323. [Google Scholar] [CrossRef]
  51. Frostegard, A.; Vick, S.; Lim, N.; Bakken, L.; Shapleigh, J. Linking meta-omics to the kinetics of denitrification intermediates reveals pH-dependent causes of N2O emissions and nitrite accumulation in soil. ISME J. 2021, 16, 26–37. [Google Scholar] [CrossRef]
  52. Bronick, C.J.; Lal, R. Soil structure and management: A review. Geoderma 2004, 124, 3–22. [Google Scholar] [CrossRef]
  53. Peng, X.; Zhang, B.; Zhao, Q. A review on relationship between soil organic carbon pools and soil structure stability. Acta Pedol. Sin. 2004, 41, 618–623. [Google Scholar]
  54. Xu, P.; Liu, Y.; Zhu, J.; Shi, L.; Fu, Q.; Chen, J.; Hu, H.; Huang, Q. Influence mechanisms of long-term fertilizations on the mineralization of organic matter in Ultisol. Soil Tillage Res. 2020, 201, 104594. [Google Scholar] [CrossRef]
  55. Marinari, S.; Lagomarsino, A.; Moscatellim, C.; Tizio, A.; Campiglia, E. Soil carbon and nitrogen mineralization kinetics in organic and conventional three years cropping systems. Soil Tillage Res. 2010, 109, 161–168. [Google Scholar] [CrossRef]
  56. Li, X.; Bei, Q.; Rabiei Nematabad, M.; Peng, J.; Liesack, W. Time-shifted expression of acetoclastic and methylotrophic methanogenesis by a single Methanosarcina genomospecies predominates the methanogen dynamics in Philippine rice field soil. Microbiome 2024, 12, 39. [Google Scholar] [CrossRef]
  57. Song, X.; Liu, S.; Liu, Q.; Zhang, W.; Hu, C. Carbon sequestration in soil humic substances under long-term fertilization in a wheat-maize system from north China. J. Integr. Agric. 2014, 13, 562–569. [Google Scholar] [CrossRef]
  58. Groenigen, K.; Xuan, Q.; Osenberg, C.; Luo, Y.; Hungate, B. Faster decomposition under increased atmospheric CO2 limits soil carbon storage. Science 2014, 344, 508–509. [Google Scholar] [CrossRef]
  59. Malik, A.; Puissant, J.; Buckeridge, K.; Goodall, T.; Jehmlich, N.; Chowdhury, S.; Gweon, H.; Peyton, J.; Mason, K.; Agtmaal, M.; et al. Land use driven change in soil pH affects microbial carbon cycling processes. Nat. Commun. 2018, 9, 3591. [Google Scholar] [CrossRef]
  60. Das, S.R.; Chatterjee, D.; Saha, S.; Sarkar, D.; Alam, R.; Dey, S.; Ghosh, S.; Nayak, B.K.; Smith, P.; Pathak, H. Enhancing carbon sequestration potential of lowland rice agroecosystems for environmentally clean production system: A review. Clim. Smart Agric. 2025, 2, 100054. [Google Scholar] [CrossRef]
  61. Song, X.; Hei, R.; Yao, Y.; Guo, D.; Luo, J.; Ma, Y. Effects of compost products of different Chinese medicinal residues on soil carbon mineralization. Soils 2023, 55, 45–52. [Google Scholar]
Figure 1. Characteristics of CO2 emission rates from different types of soil. Different lowercase letters indicate significant differences between different treatments under the same soil type (p < 0.05). Different capital letters indicated significant differences among different soil types under the same treatment (p < 0.05). *** indicates that soil type, treatment, and the interaction between soil type and treatment have a significant effect on the average CO2 emission rate at the 0.001 level.
Agronomy 15 01559 g001
Figure 2. Characteristics of CO2 accumulation and emission from different types of soils. Different lowercase letters indicate significant differences between different treatments under the same soil type (p < 0.05). Different capital letters indicated significant differences among different soil types under the same treatment (p < 0.05). *** indicates that soil type, treatment, and the interaction between soil type and treatment have a significant effect on the cumulative CO2 release at the end of incubation at the 0.001 level.
Agronomy 15 01559 g002
Figure 3. The organic carbon content of different types of soils. Different lowercase letters indicate significant differences between different treatments (p < 0.05).
Agronomy 15 01559 g003
Figure 4. Correlation between organic carbon and mineralization parameters at different incubation time. (a) indicates the paddy soil, (b) indicates the black soil, and (c) indicates the cinnamon soil. SOC0: organic carbon content for 0 days of incubation; SOC90: organic carbon content for 90 days of incubation; SOC210: organic carbon content for 210 days of incubation; Ca: active carbon pool; Cs: slow carbon pool; ka: mineralization rate of activated carbon pool; ks: slow carbon pool mineralization rate; Cp: potentially mineralizable carbon pool in the soil; Cr: stable carbon pool; Cm: mineralized entropy. * indicates significant difference at the 0.05 level; ** indicates significant difference at the 0.01 level; *** indicates significant difference at the 0.001 level.
Agronomy 15 01559 g004
Figure 5. The correlation between the basic physicochemical properties, particle composition, and mineralization parameters of the initial soil. * indicates significant difference at the 0.05 level; ** indicates significant difference at the 0.01 level; *** indicates significant difference at the 0.001 level; **** indicates significant difference at the 0.0001 level.
Agronomy 15 01559 g005
Table 1. Comparison table between the FAO soil classification system and the China soil classification system.
Soil TypeChinese Soil Classification SystemFAO Soil Classification SystemSoil CharacteristicsPedogenesis EnvironmentDiagnostic Horizons/Features
paddy soilSoil order: Anthrosols
(man-made soils)
Soil class: paddy soil
Reference soil group:
anthrosols (man-made soils)
Long-term paddy cultivation, with distinct plow layer and gleyed horizon, soil appears grayish-black or black, with heavy texture and high organic matter content.Long-term paddy field environment, mainly found in plains or low-lying areas.Plow layer (Aq), gleyed horizon (Gleyic horizon)
black soilSoil order: chernozems
(black soils)
Soil class: black soil
Reference soil group:
phaeozems (black soils)
Thick humus layer (ah), dark black or dark brown in color, high soil fertility, heavy texture, rich in humus and clay minerals.Temperate semi-humid climate zone, meadow steppe vegetation, mainly found in the Northeast China Plain.Humus layer (Ah), illuvial layer (Bts)
cinnamon soilsoil order: luvisols (luvic soils)
soil class: cinnamon soil
Reference soil group:
lixisols (low-activity
lixisols)
Distinct leaching layer and illuvial layer, soil body appears brown, clay minerals mainly montmorillonite and illite, with moderate fertility.Temperate humid climate zone, forest or grassland vegetation, mainly found in the Loess Plateau and North China Plain.Leaching layer (E), illuvial layer (Bts), redox layer (gleyic features)
Table 2. Basic physicochemical properties of soil before incubation.
Soil TypesTotal Nitrogen (iTN, g/kg)Total Phosphorus (iTP, g/kg)Total Potassium (iTK, g/kg)Alkaline Hydrolyzable Nitrogen
(iAN, mg/kg)
Available Phosphorus (iAP, mg/kg)Available Potassium (iAK, mg/kg)Organic Carbon (iSOC, g/kg)pH
(ipH)
Paddy soil0.25 ± 0.02 b4.27 ± 0.04 c8.43 ± 0.01 a166.11 ± 5.80 a23.83 ± 1.01 b177.42 ± 13.07 b20.68 ± 1.07 b5.35 ± 0.02 c
Black soil0.33 ± 0.02 a12.08 ± 0.17 a7.12 ± 0.09 c158.47 ± 1.31 a202.79 ± 11.34 a278.44 ± 7.08 a24.68 ± 0.09 a6.89 ± 0.02 b
Cinnamon soil0.11 ± 0.00 c5.90 ± 0.00 b7.90 ± 0.06 b49.17 ± 3.70 b13.04 ± 1.38 b132.35 ± 2.28 c8.48 ± 0.81 c7.38 ± 0.09 a
Note: Different lowercase letters indicate significant differences among different soil types (p < 0.05), the same as below.
Table 3. Particle composition of different types of soil.
Soil TypesProportion of Different Soil Particle Size Fractions (%)
>0.05 mm0.01~0.05 mm0.005~0.01 mm0.002~0.005 mm0.001~0.002 mm<0.001 mm
Paddy soil16.71 ± 2.03 b35.55 ± 1.02 b12.19 ± 2.03 a16.25 ± 2.03 a4.06 ± 2.03 a15.24 ± 1.02 a
Black soil26.56 ± 3.10 a38.27 ± 1.03 b11.38 ± 1.03 a10.34 ± 6.21 ab6.21 ± 4.14 a7.24 ± 1.03 b
Cinnamon soil19.37 ± 1.02 b59.20 ± 2.04 a12.25 ± 2.04 a4.08 ± 2.04 b3.06 ± 1.02 a2.04 ± 0.00 c
Note: Different letters (a, b, c) in the table indicate significant differences (p < 0.05).
Table 4. Mineralization parameters of different types of soil organic carbon in 210 days.
Soil TypesTreatmentCa (g/kg)ka (×10−1 d)Cs (g/kg)ks (×10−2 d)Cp (g/kg)Cr (g/kg)Cm (%)
Paddy soilControl0.46 ± 0.06 Ab1.28 ± 0.06 Ba1.16 ± 0.02 Bd0.91 ± 0.14 Aa1.62 ± 0.08 Bd19.06 ± 0.26 Bb7.85 ± 0.32 Bd
R0.88 ± 0.07 Ba1.01 ± 0.12 Ab1.58 ± 0.05 Bc0.72 ± 0.15 Aab2.46 ± 0.08 Bc19.83 ± 0.21 Ba11.02 ± 0.42 Bc
R1M0.79 ± 0.03 Ba1.14 ± 0.06 Aab3.08 ± 0.20 Ab0.70 ± 0.021 Ab3.86 ± 0.18 Ab20.32 ± 0.43 Ba15.98 ± 0.84 Bb
R2M0.86 ± 0.04 Ca1.01 ± 0.04 Ab4.45 ± 0.13 Aa0.69 ± 0.03 Ab5.31 ± 0.11 Aa20.40 ±0.32 Ba20.66 ±0.55 Ba
Black soilControl0.43 ± 0.02 Ac1.71 ± 0.12 Aa1.84 ± 0.10 Ac0.42 ± 0.02 Bb2.28 ± 0.08 Ac22.41 ± 0.61 Ac9.23 ± 0.34 Bb
R1.06 ± 0.06 Ab0.86 ± 0.04 ABb2.59 ± 0.32 Ab0.41 ± 0.13 Bb3.65 ± 0.38 Ab22.74 ± 0.23 Ac13.80 ± 1.13 Ba
R1M1.01 ± 0.06 Bb0.96 ± 0.05 Bb2.83 ± 0.27 Aab0.53 ± 0.08 Bab3.84 ± 0.31 Aab24.29 ± 0.70 Ab13.64 ± 1.08 Ba
R2M1.20 ± 0.06 Aa0.92 ± 0.05 Ab3.10 ± 0.10 Ba0.67 ± 0.03 Aa4.30 ± 0.07 Ba26.13 ± 0.21 Aa14.12 ± 0.19 Ca
Cinnamon
soil
Control0.39 ± 0.01 Ab1.15 ± 0.03 Ba1.37 ± 0.26 Bb0.29 ± 0.07 Bb1.76 ± 0.27 Bb6.72 ± 0.06 Cc20.72 ± 2.60 Ab
R1.03 ± 0.04 Aa0.79 ± 0.04 Bb2.43 ± 0.63 Aa0.24 ± 0.10 Bb3.46 ± 0.67 Aa6.25 ± 0.81 Cc35.65 ± 7.27 Aa
R1M1.08 ± 0.10 Aa0.72 ± 0.02 Cc2.40 ± 0.34 Ba0.35 ± 0.09 Cb3.54 ± 0.43 Aa8.99 ± 0.53 Cb28.26 ± 3.62 Aab
R2M1.04 ± 0.04 Ba0.79 ± 0.04 Bb2.46 ± 0.18 Ca0.52 ± 0.10 Ba3.44 ± 0.22 Ca11.39 ± 0.10 Ca23.21 ± 1.28 Ab
Treatment ********************
Soil type *******************
Treatment × soil type ********************
Note: Different lowercase letters indicate significant differences among different treatments under the same soil type (p < 0.05). Different capital letters indicated significant differences among different soil types under the same treatment (p < 0.05). ** indicates significant difference at the 0.01 level; *** indicates significant difference at the 0.001 level.
Disclaimer/Publisher’s Note: The statements, opinions and data contained in all publications are solely those of the individual author(s) and contributor(s) and not of MDPI and/or the editor(s). MDPI and/or the editor(s) disclaim responsibility for any injury to people or property resulting from any ideas, methods, instructions or products referred to in the content.

