Article

Foliar Application of Melatonin Improves Photosynthesis and Secondary Metabolism in Chenopodium quinoa Willd. Seedlings Under High-Temperature Stress

1
College of Agricultural Engineering, Jiangsu University, Ministry of Education of the People’s Republic of China, Zhenjiang 212013, China
2
State Key Laboratory of Environmental Geochemistry, Institute of Geochemistry, Chinese Academy of Sciences, Guiyang 550081, China
*
Author to whom correspondence should be addressed.
Agronomy 2025, 15(7), 1556; https://doi.org/10.3390/agronomy15071556
Submission received: 16 May 2025 / Revised: 24 June 2025 / Accepted: 24 June 2025 / Published: 26 June 2025
(This article belongs to the Section Plant-Crop Biology and Biochemistry)

Abstract

The suitable growth environment for quinoa is high-altitude areas. In recent years, quinoa is also gradually cultivated in other regions with high-temperature exposure. High-temperature stress poses a potential constraint on quinoa quality and yield by impacting pigments, photosynthesis, and metabolites. This study aimed to investigate the effect of exogenous melatonin (MT) in alleviating heat stress on quinoa in controllable conditions. Day/night temperatures were maintained at 35/25 °C in a climate chamber, and foliar spraying was performed using melatonin (MT) concentrations of 0, 50, 100, and 200 μmol L−1. Day/night temperatures were maintained at 25/15 °C in another climate chamber as a comparative trial. Our results demonstrated that high temperature decreased the levels of photosynthetic pigments and the values of photosynthetic rate (Pn), stomatal conductance (gs), and transpiration rate (Tr). Additionally, it also influenced the accumulation of polyphenols and altered polyphenol oxidase (PPO) activity in the red quinoa (RQ) cultivar. Obvious reductions in gas exchange parameters and metabolites including flavonoid, anthocyanin, and PPO were observed both in the BQ cultivar and the WQ cultivar. However, the application of 100 μmol L−1 MT significantly increased the levels of photosynthetic pigments, the values of Pn, gs, and Tr, and the PPO activity, as well as the contents of flavonoid and anthocyanin in the RQ cultivar. The application of 50 μmol L−1 MT only led to an increase in the concentrations of Chl a, Chl (a + b), and flavonoids, as well as PPO activity, whereas 100 μmol L−1 MT significantly enhanced the values of Pn, gs, and Tr and the PPO activity. Additionally, 200 μmol L−1 MT contributed to the synthesis of anthocyanins and polyphenols, and enhanced PPO activity in the BQ cultivar. The application of 50 μmol L−1 MT limited the increase in the contents of total polyphenols, flavonoids, and anthocyanin, we all as PPO activity, in the WQ cultivar. The findings demonstrated that photosynthesis and metabolite synthesis in quinoa under high temperatures depends on an interactive response between cultivar and melatonin levels. The application of 100 μmol L−1 MT was found to be optimal for alleviating the adverse effects of high temperature on photosynthesis and metabolites in the RQ cultivar during actual production.

1. Introduction

With the growing emphasis on a healthy diet, quinoa (Chenopodium quinoa Willd.), hailed as “the grain of the 21st century” [1], has gained popularity and is undergoing widespread cultivation worldwide. Its appeal lies not only in the fact that both the seeds of Chenopodiaceae plant quinoa and its green leaves, sprouts, and microgreens are rich in protein, fatty acids, and minerals [1,2,3], but also due to their significant contents of bioactive compounds such as polyphenols, flavonoids, and saponins [1,4]. The antioxidant capacity of quinoa bioactive compounds stems primarily from their polyphenols and flavonoids [4,5], which exhibit beneficial effects in high-risk-group consumers [1,4].
The cultivation of quinoa is well-suited for high-altitude regions, due to its tolerance to drought, salt, and extreme temperatures [6,7,8]. However, certain varieties of quinoa can also endure temperatures ranging from 8 to 35 °C, depending on their genotype characteristics and different phenological stages [9]. Despite being introduced relatively late in China, quinoa has been cultivated on a small scale in areas where summer temperatures between 20 and 30 °C are conducive to its growth.
However, in recent years, the growing area for harvesting seeds has experienced frequent and prolonged periods of hot weather. In addition, the cultivation of quinoa is also gradually being developed in other regional environments with high-temperature exposure. Heat stress, which is considered one of the significant stress factors and a direct consequence of contemporary climate change [7,10], has been found to impede growth and development [11,12,13] and leads to yield loss in quinoa branches [14]. In addition, heat stress results in the down-regulation of genes associated with photosynthesis in quinoa seedlings [15] and leaf physiological changes, including net photosynthetic rate (Pn), stomatal conductance (gs), intercellular CO2 concentration (Ci), transpiration rate (Tr), and physiological processes, as well as photosynthetic capacity and secondary metabolite production [14,16,17]. However, photosynthesis serves as the foundation for growth and productivity in higher plants, where photosynthetic pigments play a crucial role in converting light energy into chemical energy [14]. Secondary metabolites such as phenolics, including flavonoids, anthocyanins, and plant steroids, are also significantly involved in plant responses under heat stress and generally play roles in abiotic stress responses, typically associated with tolerance to heat [11,17]. Given the above, the indices of several quinoa varieties purchased from Jingle County, in China, remain to be studied under high-temperature stress.
Melatonin (N-acetyl-5-methoxytryptamine), derived from plants, has been identified as a potent antioxidant [18,19,20] and functionally active compound [19,21] that regulates responses to low temperature, high temperature, and low light conditions [22,23,24]. So, we can obtain high-quality seedlings under stress conditions, which reduces the incidence of pests and diseases [25], enhances endogenous hormone biosynthesis [26,27], improves yield and quality, and so on.
Limited research has been conducted on the application of melatonin in alleviating heat stress in quinoa seedlings and its effects on the pigment content, photosynthesis efficiency, and metabolite levels of different quinoa varieties. Research on the application of melatonin in plants is relatively extensive. Under high-temperature conditions, 200 µM MT-treated kiwifruit (Actinidia deliciosa), 100 µM MT-treated wheat (Triticum aestivum L.), and rice (Oryza sativa L.) seeds treated with 0, 20, 100, and 500 µM melatonin (MT) exhibited enhanced activity of antioxidant enzymes, reduced MDA content, and increased proline biosynthesis [28,29,30]. Seeds of three Chenopodium quinoa genotypes were subjected to a 16 h soaking treatment in a 100 μM melatonin (MT) solution. This treatment not only promoted biomass accumulation and increased total nutrient content, but also enhanced the accumulation of leaf pigments, including vitamins, polyphenols, and flavonoids [31]. Based on the research results mentioned above, we hypothesize that the varying photosynthesis efficiency, metabolite levels among quinoa varieties, and application of melatonin, could be attributed to their differential responses to elevated temperatures. Therefore, this study aimed to determine whether melatonin spraying can mitigate high-temperature-induced stress by regulating the biosynthesis of compounds involved in photosynthesis and secondary metabolism. The findings are expected to advance our understanding of the physiological functions of melatonin in quinoa seedlings under heat stress and enhance quinoa’s prospects as a broadly cultivable vegetable crop.

2. Materials and Methods

2.1. Plant Materials and Melatonin Treatments

The plant materials for the experiment included red quinoa (RQ), black quinoa (BQ), and white quinoa (WQ) seeds, purchased from Jingle County, Shanxi Province, China. In late September 2022, the seedlings were cultivated in the greenhouse of Jiangsu University using 50-hole trays (54 cm × 28 cm × 9 cm) under conventional management practices. After a few days, 30 seedlings per variety (RQ, BQ, and WQ), approximately 10 cm tall, were transplanted into cultivation pots (12 cm diameter, 13 cm height) at a density of two plants per pot (Figure 1a). A total of 45 pots were used. The soil samples for cultivation were obtained from the campus area, with available nitrogen (N) at 7.5 mg kg−1, phosphorus (P2O5) at 2.5 mg kg−1, and potassium (K2O) at 37.5 mg kg−1. Each pot contained a mixture of three parts soil to two parts high-quality wormcast, totaling 700 g. Regular management practices were implemented.
The experiments involving foliar spraying and different temperatures for quinoa seedlings started on 24 November 2022. Two artificial climate chambers were used in the laboratory. The chambers were designed for day/night conditions of 14/10 h with humidity of 60–70% and a maximum illumination of 180 µmol m−2 s−1, as measured using a LI-190 R photosynthetic photon flux sensor (LI-COR Ltd., Lincoln, NE, USA), which was higher than in Ref. [32] for quinoa. The temperatures for the day/night in one chamber were 35/25 °C, and for the other chamber were 25/15 °C. It was expected that, in the heat stress group (35/25 °C), plant photosynthesis and physiological metabolism may be affected as a result of the stress response. However, the specific results still need to be verified and analyzed through rigorous experimental data.
The total of 36 pots for the three cultivars of WQ, BQ, and WQ were introduced in the chamber with day/night temperatures of 35/25 °C. Melatonin (MT, purchased from Shanghai Macklin Biochemical Co., Ltd., Shanghai, China) was sprayed on the leaves daily at 9 am for 22 days at four concentrations (0, 50, 100, and 200 µmol L−1). For each melatonin concentration gradient, 0 µmol L−1 MT (the control) was replaced with distilled water. Subsequently, 10 mL of each of the four treatment concentrations was accurately pipetted into separate fine-mist spray bottles. The solutions were then uniformly sprayed onto the leaf surfaces of each plant every day, and the plants were then transferred to a controlled-light growth chamber for subsequent incubation. Each cultivar treated with the same MT concentration had three pots and two plants per pot. The climate chamber is shown in Figure 1b. The RQ seedlings with foliar spraying applications of MT at concentrations of 0 (which also served as the control without MT under the 35/25 °C condition), 50, 100, and 200 µmol L-1 were designated as RQ-MT0, RQ-MT50, RQ-MT100, and RQ-MT200, and the BQ seedlings and WQ seedlings with the four concentrations of MT application were marked as BQ-MT0, BQ-MT50, BQ-MT100, BQ-MT200, WQ-MT0, WQ-MT50, WQ-MT100, and WQ-MT200, in sequence.
A total of nine pots of three cultivars were placed in the other artificial climate chamber with day/night temperatures of 25/15 °C. The leaves were sprayed with 10 mL of distilled water every day. This experimental setup was designed to compare high-temperature conditions without melatonin spraying, aiming to reveal the effects of different temperatures on quinoa. The cultivars of RQ, BQ, and WQ were labeled as RQ-CK, BQ-CK, and WQ-CK, respectively.

2.2. Sample Collection and Preservation

The photosynthetic activity of quinoa leaves was evaluated 22 days after spraying on 16 December 2022. Six seedlings from each treatment were then harvested. For each treatment group, five plants were selected. All leaves from each plant were sampled, and each set of leaf samples was separately placed into a cryogenic centrifuge tube, rapidly frozen in liquid nitrogen, and stored at −80 °C for further analysis. Routine chemical reagents were purchased from Sinopharm Chemical Reagent Co., Ltd., Shanghai, China.

2.3. Leaf Photosynthesis Measurement

Photosynthetic parameters were assessed using a Li-6400 XT photosynthesis instrument (LI-COR Inc., Lincoln, NE, USA) on the second fully developed leaf from the top. Measurements were conducted in a standard light-source leaf chamber equipped with red/blue LEDs, with the following settings: PPFD at 180 µmol·m−2·s−1, CO2 concentration at 390 µmol·mol−1, leaf chamber temperature at 25 °C, and airflow rate at 500 µmol·s−1. This procedure followed and modified the parameters of the method in Ref. [33]. A total of 45 pots containing quinoa leaves were analyzed for their net photosynthetic rate (Pn), stomatal conductance (gs), intercellular CO2 concentration (Ci), and transpiration rate (Tr) in the laboratory. Leaf water use efficiency (WUE) was calculated as Pn/Tr.

2.4. Leaf Pigment Measurements

Determination of pigments included quantifying chlorophyll (a, b, and total), carotenoids, and anthocyanins. Chlorophyll and carotenoid measurement followed the methods of Imran Ahmad et al. [34], with further modifications. The fresh leaf sample (0.1 g) was mixed with 10 mL of 95% (v/v ethyl alcohol and kept in the dark at room temperature for 24 h until the leaves turned completely white. Absorbance of the solution for chlorophyll a, b, and carotenoids was read at 663 nm, 645 nm, and 470 nm wavelengths, respectively, using an ultraviolet-visible spectrophotometer (Model Cary100, Varian Inc., Palo Alto, CA, USA.). The concentrations of Chl a, Chl b, and carotenoid were marked as C a , C b , and C x . c , respectively, and were calculated as follows:
C a = 12.21 A 663 2.18 A 645
C b = 20.13 A 645 5.03 A 663
C x . c = 1000 A 470 3.27 C a 104 C b / 229
where A663 was the absorbance value at a wavelength of 663 nm, A645 was the absorbance value at a wavelength of 645 nm, and A470 was the absorbance value at a wavelength of 470 nm. The Chl (a + b) was the sum of chlorophyll a and chlorophyll b.
The pigment content was
C h l y = C y × extracted   volume / fresh   weight .  
where y represented Chl a, Chl b, or carotenoid.
The anthocyanin content was quantified using a spectrophotometer. Approximately 0.2 g of finely chopped and homogenized leaves were placed in a conical flask with 10 mL of hydrochloric acid–ethanol solution and extracted at 60 °C in a water bath. The extract was transferred, separated, and diluted. Absorbance was measured at wavelengths of 530 nm, 620 nm, and 650 nm using the spectrophotometer mentioned above. The anthocyanin absorbance was then calculated as follows:
A λ = A 530 A 620 0.1 A 650 A 620
The anthocyanin content was
A n = 106 V A λ / ε m
where εm was the molar extinction coefficient of anthocyanin (4.62 × 10⁶), m was the sampling mass in grams, and V was the total volume of the extraction solution. A530, A620, and A650 represented the optical densities at wavelengths of 530 nm, 620 nm, and 650 nm, respectively.

2.5. Leaf Total Polyphenol and Flavonoid Measurements

Leaf total polyphenol and flavonoid measurements were based on the modern plant physiology experiment guide [35]. Stored quinoa leaves (2 g) were homogenized by adding a small amount of pre-cooled 1% HCl–methanol solution in an ice bath and transferred into a calibrated test tube. The mortar was rinsed with HCl–methanol solution, and the extract solution was shaken at 4 °C. Subsequently, the extract was filtered and collected for the determination of phenols and flavonoids.
The above extract (1 mL) was accurately transferred, diluted with distilled water, and added to Folin–Ciocalteu standard reagent. Afterwards, 20% sodium carbonate solution was added within 8 min. The mixture was incubated at 20 °C for 2 h, and then absorbance was measured by visible ultraviolet spectrophotometry at a 765 nm wavelength by employing the standard curve obtained from gallic acid solution, as follows. Standard solutions of 0, 50, 100, 150, 250, and 350 μg mL−1 concentrations were drawn from the prepared 5 mg/L gallic acid solution, respectively. Subsequently, a series of standard curves was prepared. The final gallic acid concentrations of the solutions are 0, 5, 10, 15, 25, and 35 μg mL−1.
Methanol and sodium nitrite were added after the extract containing polyphenols was transferred into a volumetric flask. Then, the mixture was shaken and allowed to stand, and a 4% sodium hydroxide solution was added. Finally, methanol was added to maintain a constant volume. The absorbance at 510 nm was measured using a UV-visible spectrophotometer. The content of total flavonoids was calculated based on the standard curve of rutin solution, with the specific method as follows.
A 500 μ g mL−1 rutin stock solution was prepared by dissolving a precisely weighed rutin reference standard in methanol. Aliquots (0, 1, 2, 3, 4, 5 mL) of this stock were transferred to 25 mL volumetric flasks, with 5, 4, 3, 2, 1, and 0 mL of 60% (v/v) ethanol added sequentially to adjust the final volumes.
To each flask, 1.25 mL of 5% (w/v) sodium nitrite solution was added, followed by vigorous shaking for homogeneity and a 6 min standing period. Next, 1.25 mL of 10% (w/v) aluminum nitrate solution was added dropwise with gentle mixing, then allowed to stand for 6 min to promote complexation with rutin.
Subsequently, 10 mL of 4% (w/v) sodium hydroxide solution was added to each flask to induce color development, and the contents were mixed thoroughly. These colored solutions were serially diluted with methanol to prepare working solutions at target concentrations (0 [blank], 20, 40, 60, 80, 100 μg mL−1).
The absorbance of each working solution was measured at 510 nm using a UV-Vis spectrophotometer (with a 0 μg mL−1 blank for calibration). Finally, concentration absorbance data were imported into Microsoft Excel, and a standard curve was generated via linear regression to quantify the relationship between rutin concentration and absorbance.

2.6. Polyphenol Oxidase (PPO) Measurement

The experimental methods were based on the modern plant physiology experiment guide, with slight modifications [35]. Leaves (1 g) were homogenized with pH 6.5 phosphate buffer containing polyvinylpyrrolidone in a mortar. The homogenate was treated with 30% saturated ammonium sulfate to precipitate proteins, which were removed by centrifugation to obtain the supernatant. Additional ammonium sulfate was added to the supernatant, and, after further centrifugation, the resulting protein precipitation was dissolved in 2.5 mL of pH 6.5 phosphate buffer (0.01 mol L−1) to prepare the enzyme solution.
In a test tube, 3.9 mL of pH 5.5 sulfuric acid buffer (0.05 mol L−1) and 1.0 mL of catechol (0.1 mol·L−1) were mixed and incubated at 37 °C for 10 min. After adding 1.0 mL of enzyme solution and vigorously shaking, the mixture was quickly transferred to a 1 cm path length cuvette. Polyphenol oxidase (PPO) activity was measured at 525 nm using UV-VIS spectrophotometry over 2 min.

2.7. Leaf Saponin Measurement

The total saponin content was extracted using the vanillin-perchloric acid method [35]. Leaves (1 g of mixed whole leaves per plant, which were frozen in liquid nitrogen and stored in a −80 °C refrigerator) were crushed, mixed with 70% ethanol, ultrasonically cleaned for 30 min, and filtered. The filtrate was concentrated to a dry extract, dissolved in distilled water, and subjected to three consecutive extractions with equal volumes of petroleum ether and n-butanol. Finally, the combined extracts were concentrated and dissolved in a 50 mL volumetric flask.
A 20 µL aliquot of the saponin extract was evaporated at 80 °C in a vacuum drying oven. Then, 150 µL vanillin–glacial acetic acid solution and 600 µL perchloric acid were added to the sample. The mixture was incubated at 70 °C for 15 min, cooled, and supplemented with 1.95 mL glacial acetic acid as a coolant for an additional 10 min.
The saponin content was determined at a wavelength of 540 nm using oleanolic acid as a standard on a UV-VIS spectrophotometer.

2.8. Statistical Analysis

The data collected was subjected to analysis of variance technique (ANOVA) and two-way ANOVA using the software program SPSS (Version 22.0, IBM Corporation, Armonk, NY, USA), indicating the significance of the two main factors (including cultivar and temperature without MT spraying; cultivar and MT level under the 35/25 °C controlled conditions) and their interaction (cultivar × temperature level without MT spraying; cultivar × MT level under 35/25 °C controlled conditions) for each variable examined. Means ± standard deviation of five replications for each cultivar were differentiated with the Tukey test at a p ≤ 0.05 level, then means ± standard deviation among cultivars were differentiated with Tukey’s honestly significant difference test (HSD) at a p ≤ 0.05 level. Heatmap (Pearson’s correlation) coefficients between various traits were used to calculate the level of association between each pair of indicator parameters and were generated using Origin 2021 software.

3. Results

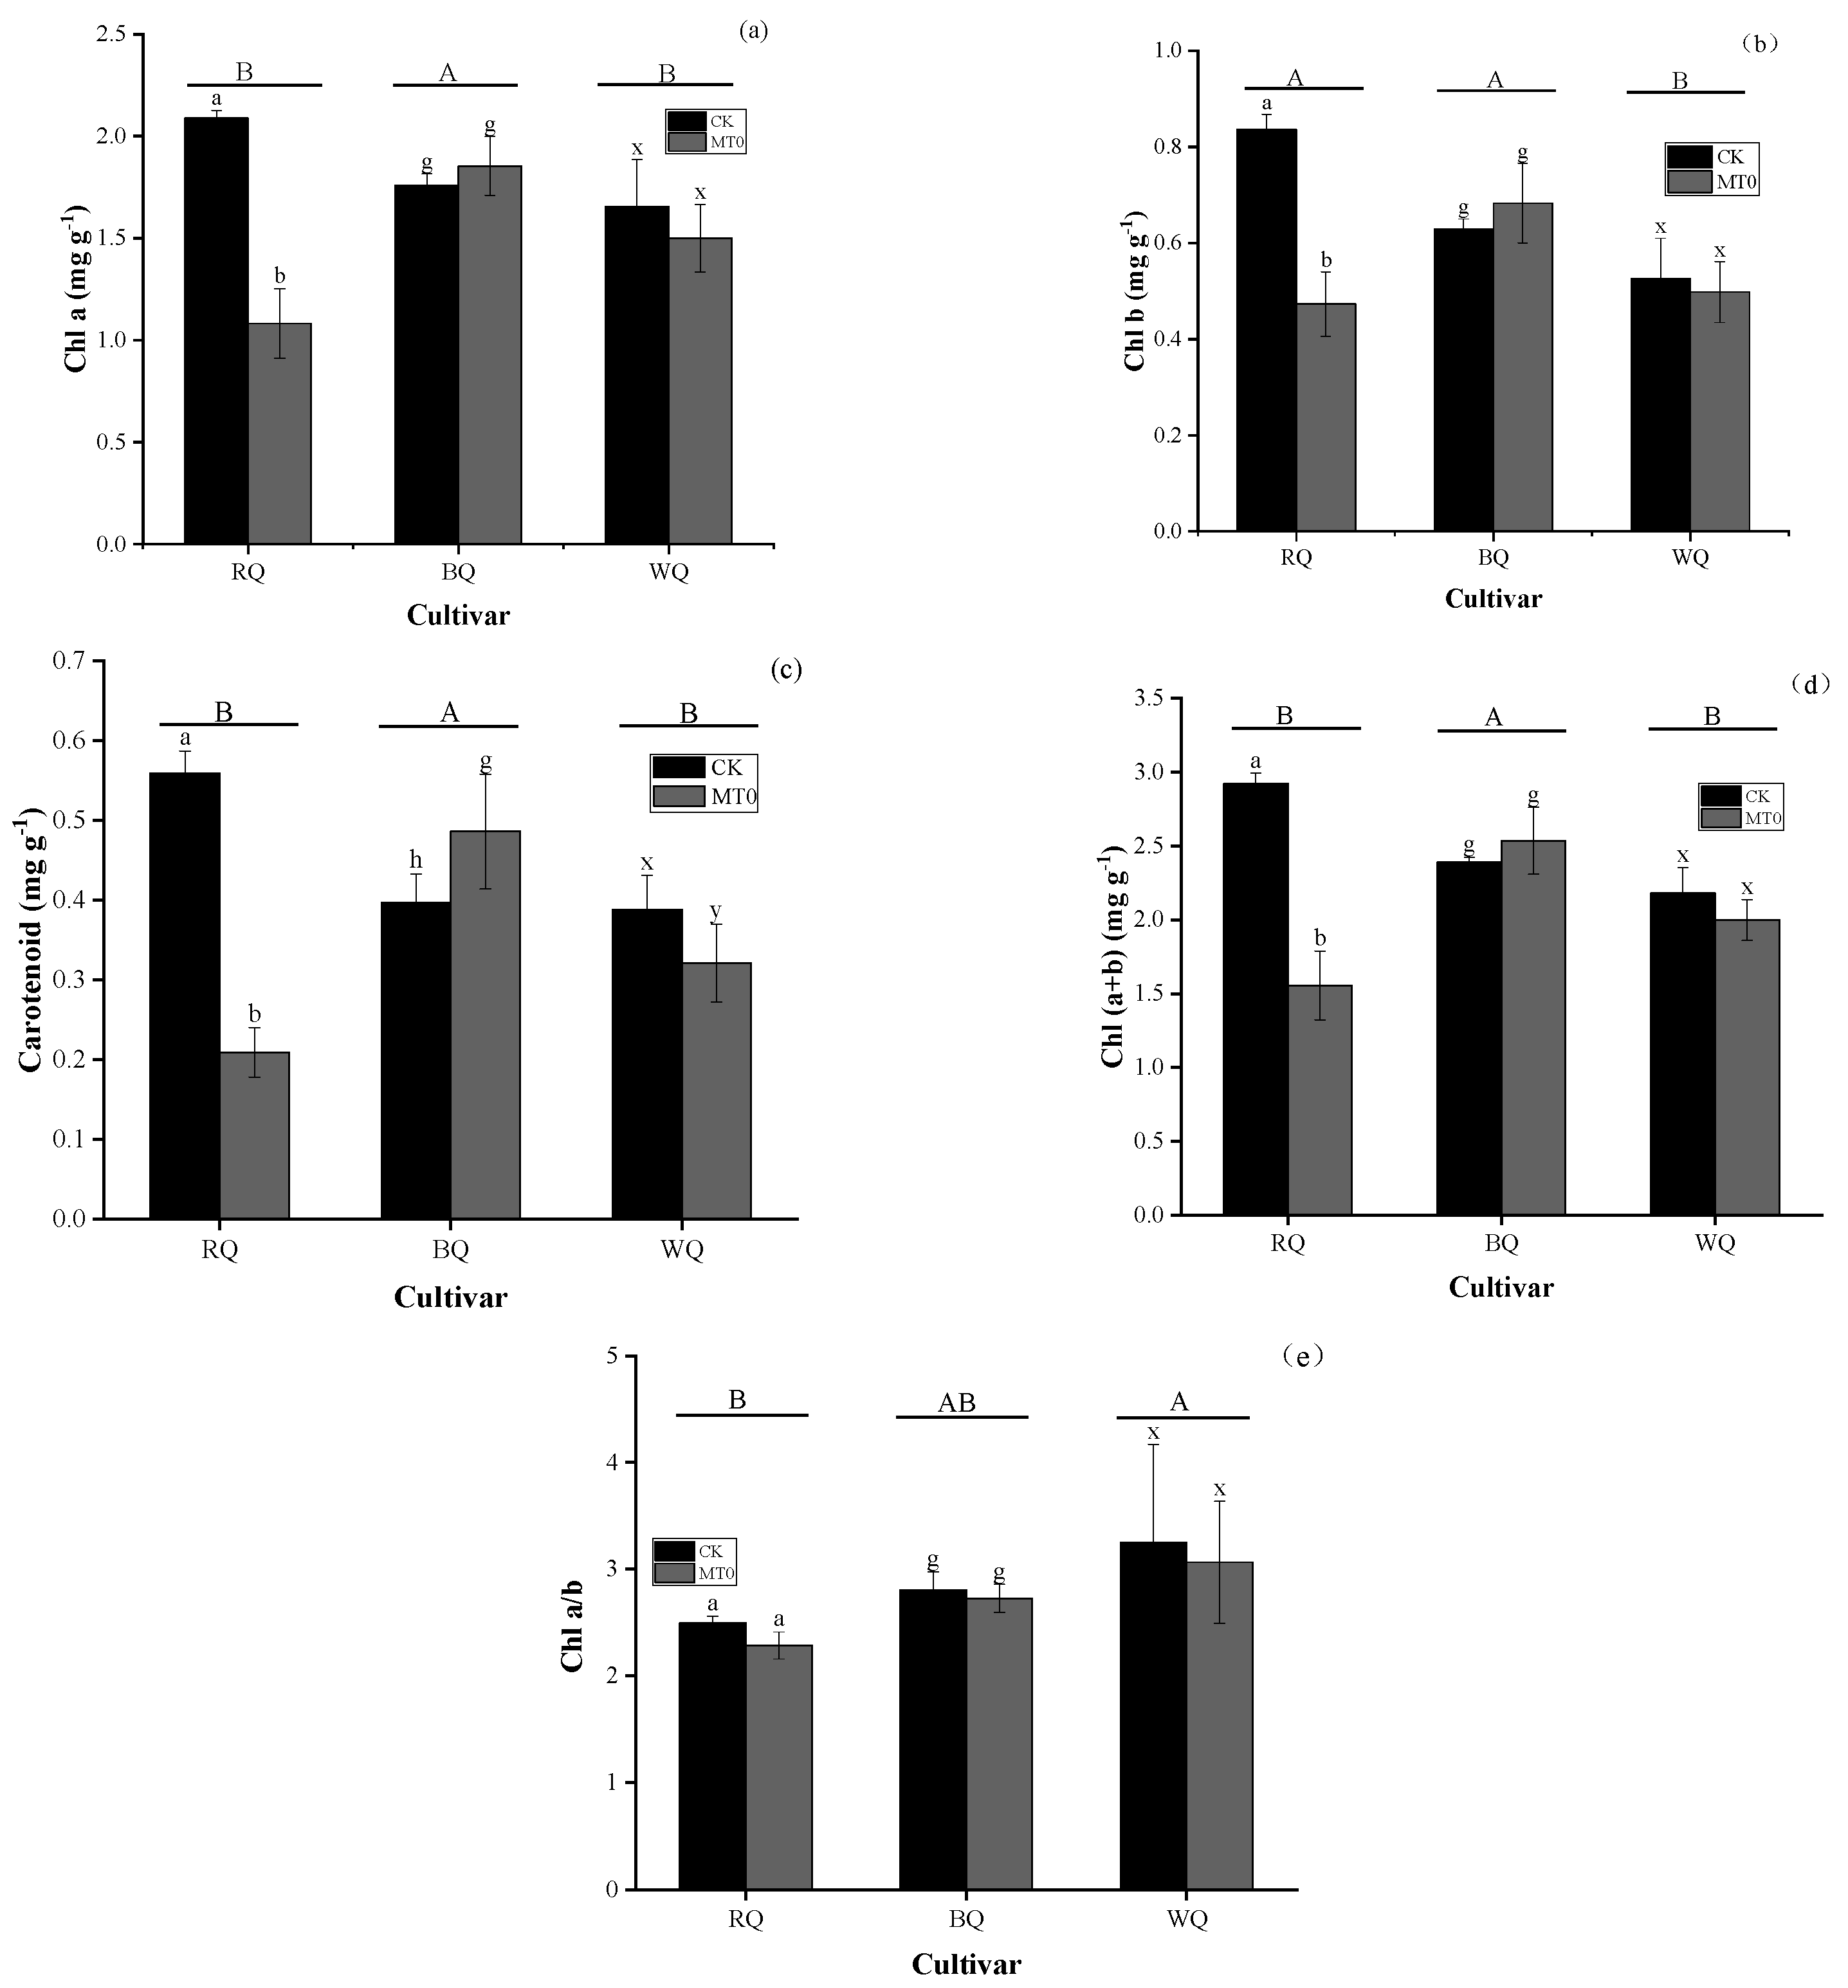
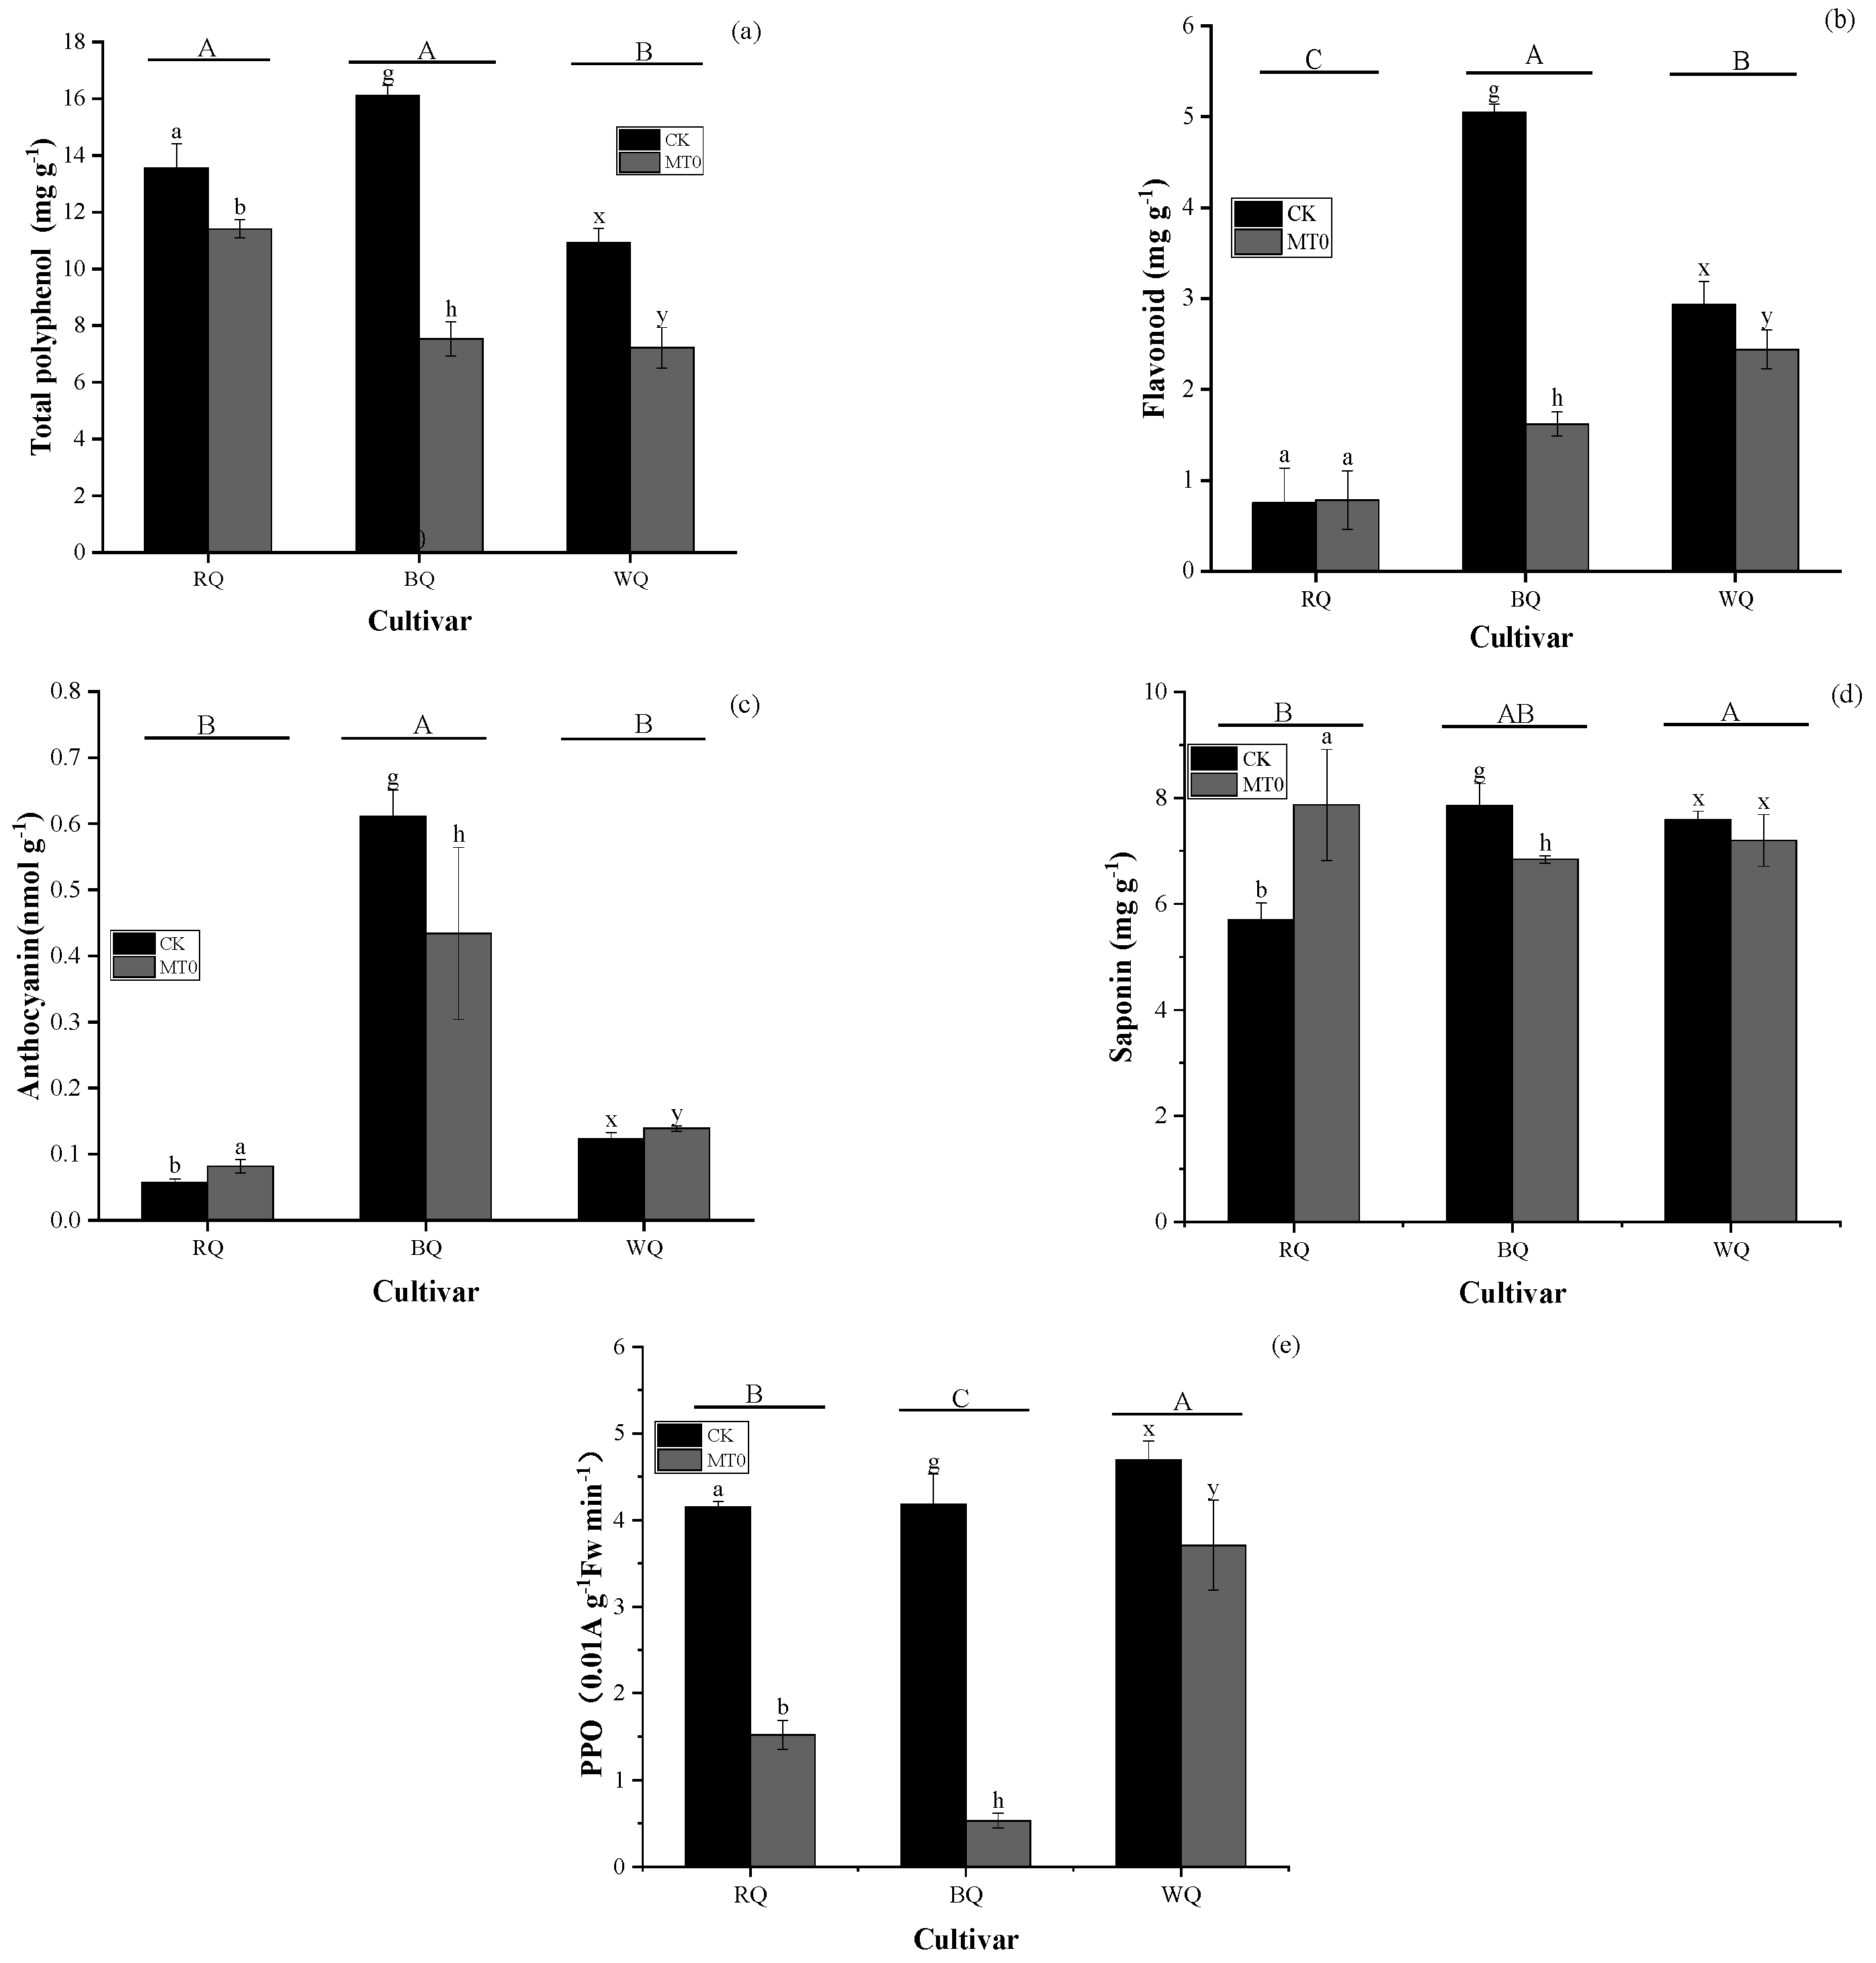
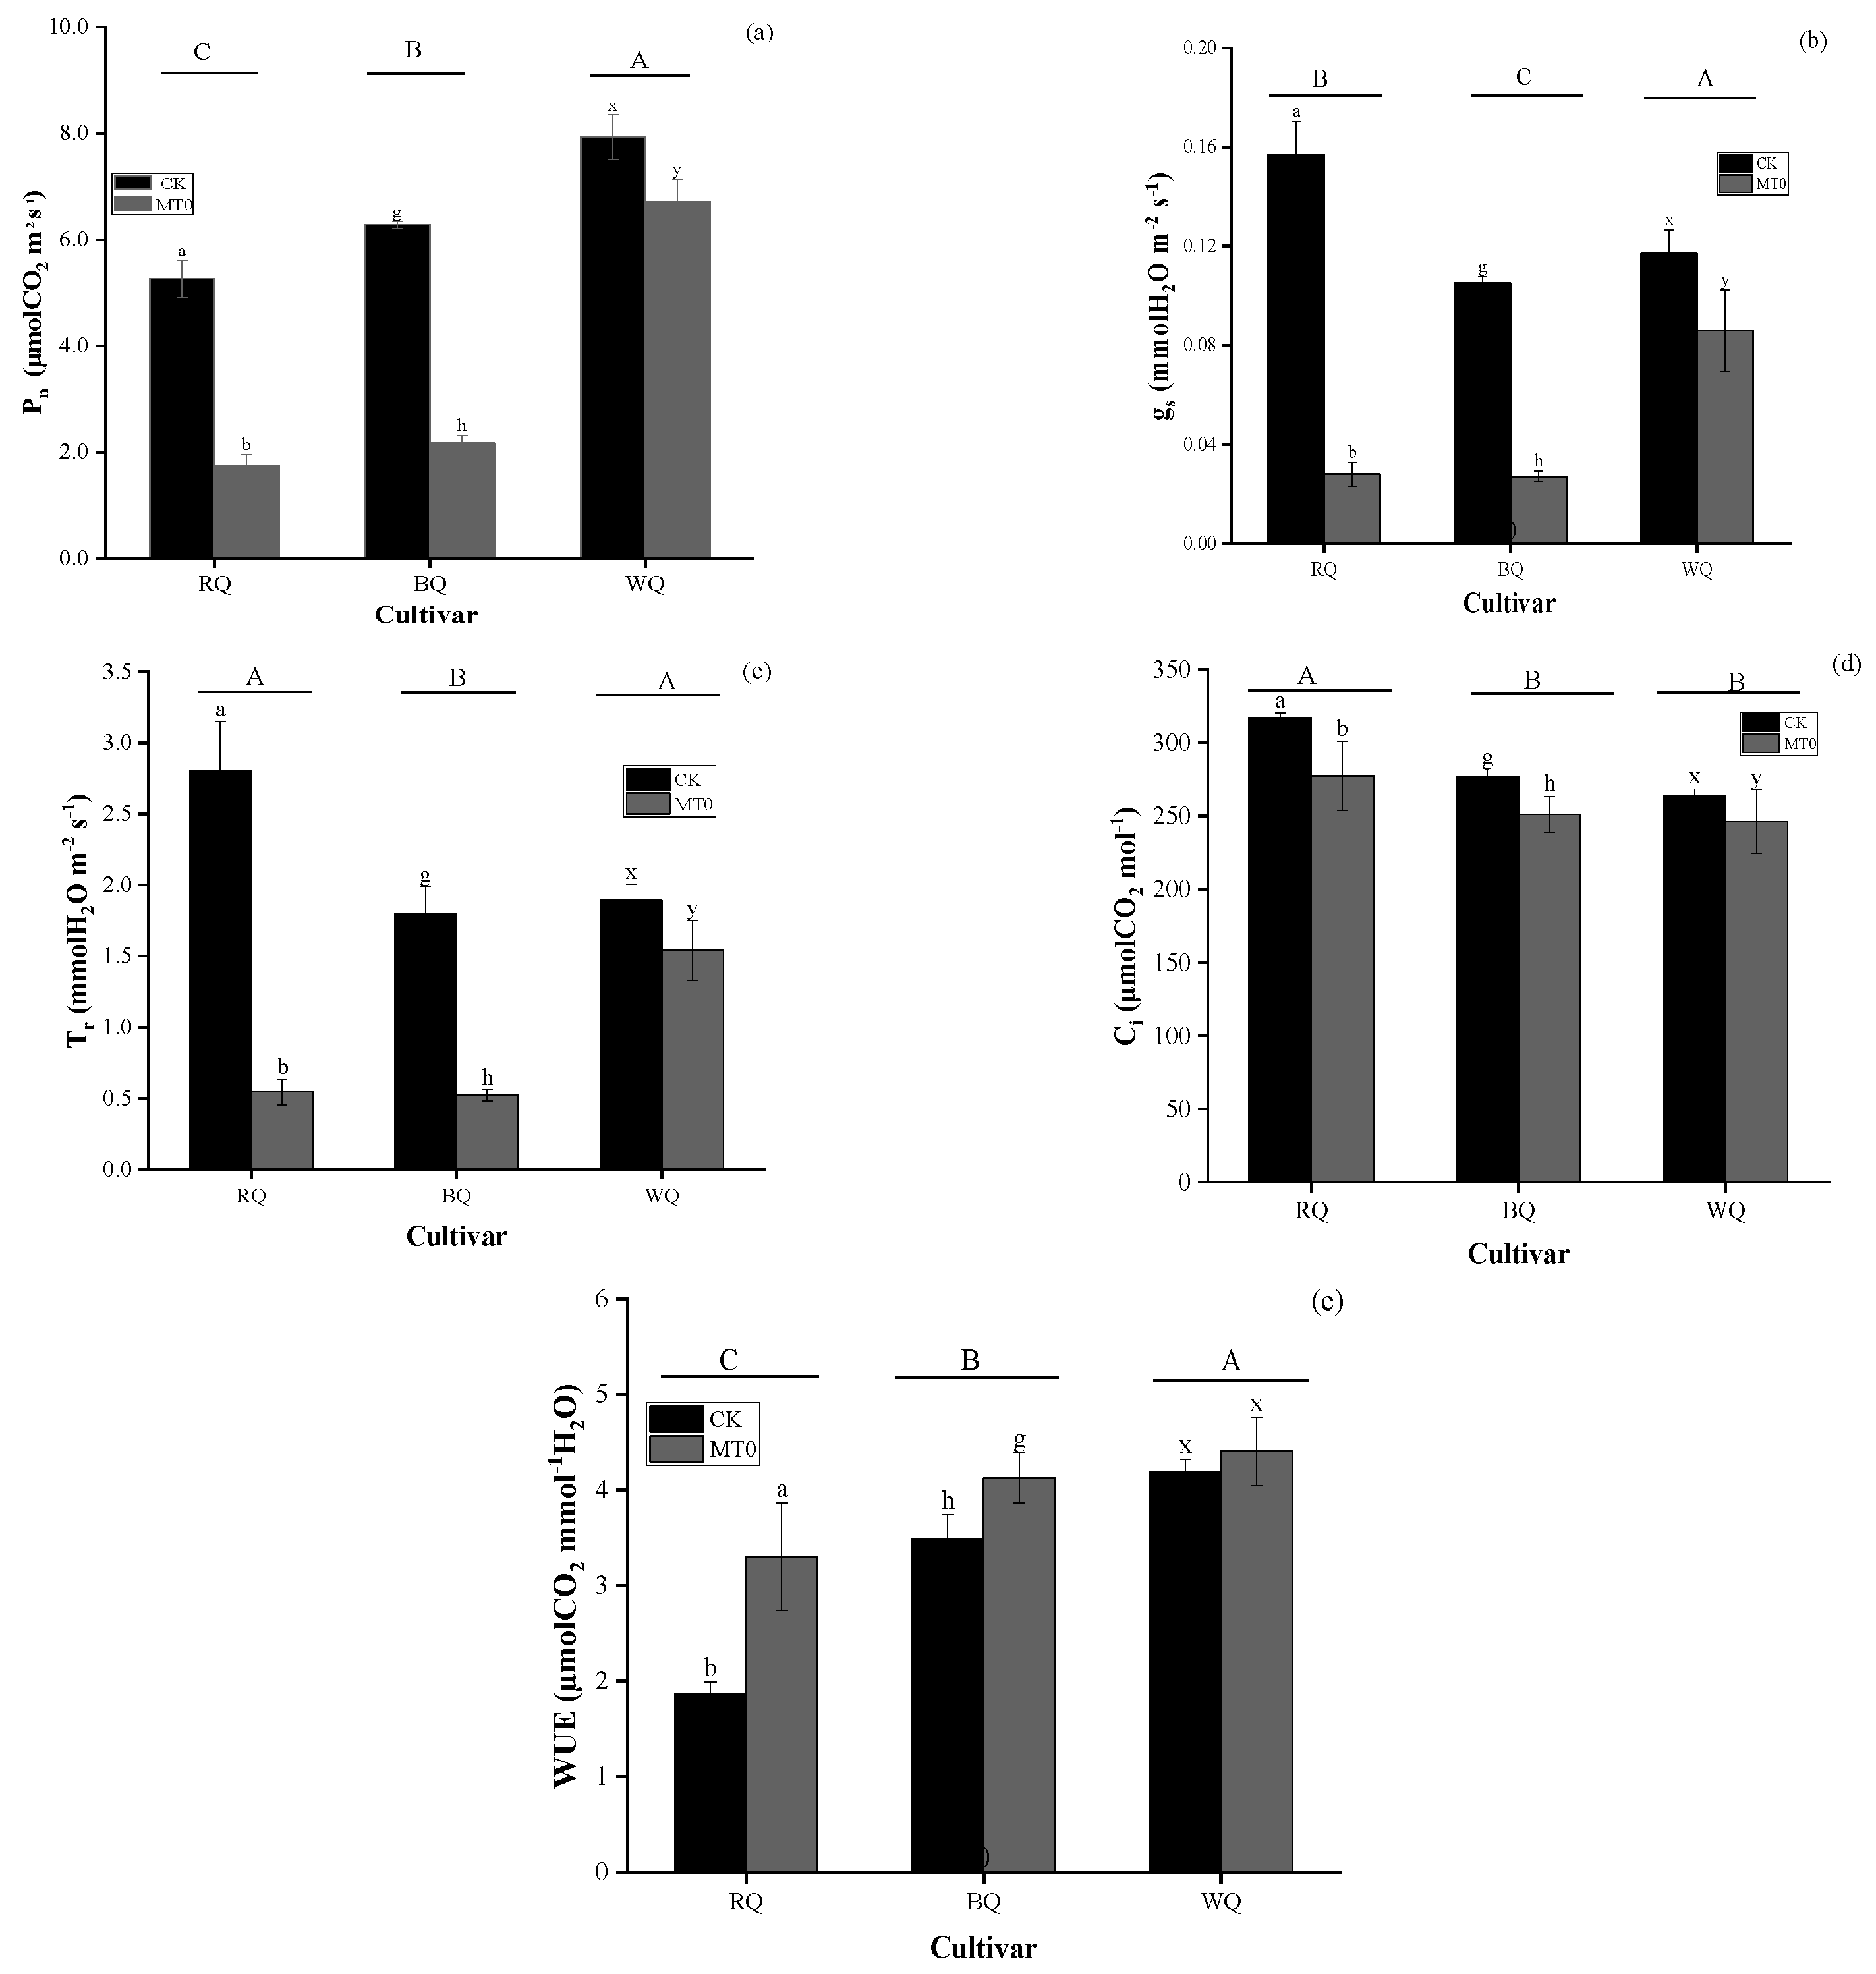
3.1. Impacts of Heat Stress and Cultivar on Metabolite and Gas Exchange Parameters

The results of the two-way ANOVA analysis of photosynthetic pigments showed that temperature (TEM), cultivar, and the interaction of cultivar × temperature (TEM) had a considerable effect on the levels of Chl b, carotenoid, and Chl (a + b), as indicated by the analysis of variance values shown in Table 1. Significant effects of the temperature and the interaction of cultivar × temperature (TEM) on the content of Chl a were observed. However, temperature (TEM), cultivar, and the interaction of cultivar × temperature (TEM) had no significant effect on Chl a/b.
Under heat stress, the RQ cultivar with MT0 exposed to 35/25 °C showed a significant difference in pigment content. Compared to CK, the reduction rates of Chl a, Chl b, carotenoids, and total chlorophyll (Chl (a + b)) were 48.1%, 43.4%, 62.6%, and 46.8%, respectively. In contrast, the carotenoid content in BQ with MT0 exposed to 35/25 °C increased by 22.3% while the carotenoid content in MT0 decreased significantly.
Tukey’s Honest Significant Difference (HSD) test was utilized to conduct pairwise comparisons of the means of pigments across different varieties. The results showed that the Chl a content followed the order BQ > RQ = WQ (marked as A, B, B, as shown in Figure 2a). The Chl b content followed the order BQ = RQ > WQ, indicating a significant difference between the RQ cultivar and BQ cultivar compared to the WQ cultivar, as shown in Figure 2b (labeled as A, A, B). No significant differences were observed in carotenoid and total Chl (a + b) content between the RQ and WQ cultivars; however, both showed a significant reduction compared to the BQ cultivar. Additionally, the Chl a/b ratio exhibited a significant difference between the WQ cultivar and the RQ cultivar.
The other metabolite data from two-way ANOVA also revealed that temperature (TEM), cultivar, and the interaction of cultivar × temperature (TEM) significantly influenced the contents of total polyphenols, flavonoids, and anthocyanin, as well as PPO activity, as indicated by the analysis of variance values shown in Table 1. The interaction of cultivar × temperature (TEM) had a significant effect on the content of saponin; however, neither temperature (TEM) nor cultivar exerted a significant influence on saponin content.
Under two controlled conditions, such as a day/night temperatures of 35/25 °C and temperatures of 25/15 °C for the BQ cultivar, the contents of total polyphenols, flavonoids, anthocyanin, and saponin, as well as the activity of PPO, in MT0 showed significant reduction compared to CK. However, in the RQ cultivar, the total polyphenol content and the PPO activity significantly decreased in MT0 compared to CK, while the contents of anthocyanin and saponin significantly increased. For the WQ cultivar, MT0 treatment resulted in a significant increase in anthocyanin content and a significant decrease in total phenols, flavonoid content, and PPO activity compared to CK. Compared to their respective controls (CK in RQ, CK in BQ, and CK in WQ), the total polyphenol content decreased by 2.15 mg g−1 for MT0 in RQ, 8.57 mg g−1 for MT0 in BQ, and 3.70 mg g−1 for MT0 in WQ, respectively.
Tukey’s Honest Significant Difference (HSD) test revealed that the respective mean values of total polyphenols, flavonoids, anthocyanin, and PPO activity in the BQ cultivar were significantly different compared to those in the WQ cultivar. This showed that the BQ cultivar exhibited the highest contents of total polyphenols, flavonoids, and anthocyanin, while the lowest PPO activity was observed. Additionally, it was noted that the mean values of saponin content and PPO activity were the highest in the WQ cultivar, with significant differences observed compared to other cultivars (Figure 3).
The photosynthetic parameter data from two-way ANOVA also revealed that temperature (TEM), cultivar, and the interaction of cultivar × temperature (TEM) had a considerable effect on the Pn, gs, Tr, Ci, and WUE, as indicated by the analysis of variance values shown in Table 1.
When exposed to different temperatures, the values of Pn, gs, Tr,, and Ci were significantly changed for each cultivar (Figure 4). The values of Pn, gs, Tr, and Ci with MT0 for each cultivar are significantly lower than those with CK, while the values of WUE with MT0 for the RQ cultivar and the BQ cultivar significantly increased by 77.32% and 18.29%, respectively.
The results of the Tukey HSD test for pairwise comparisons showed that Pn, gs, Tr,, and WUE exhibited significant differences among different cultivars. The WQ cultivar showed the highest average values (remark A, A, A, A) for these parameters. Compared to the BQ cultivar, the values of Tr and Ci for the RQ cultivar were significantly increased, achieving the maximum values among the three cultivars.

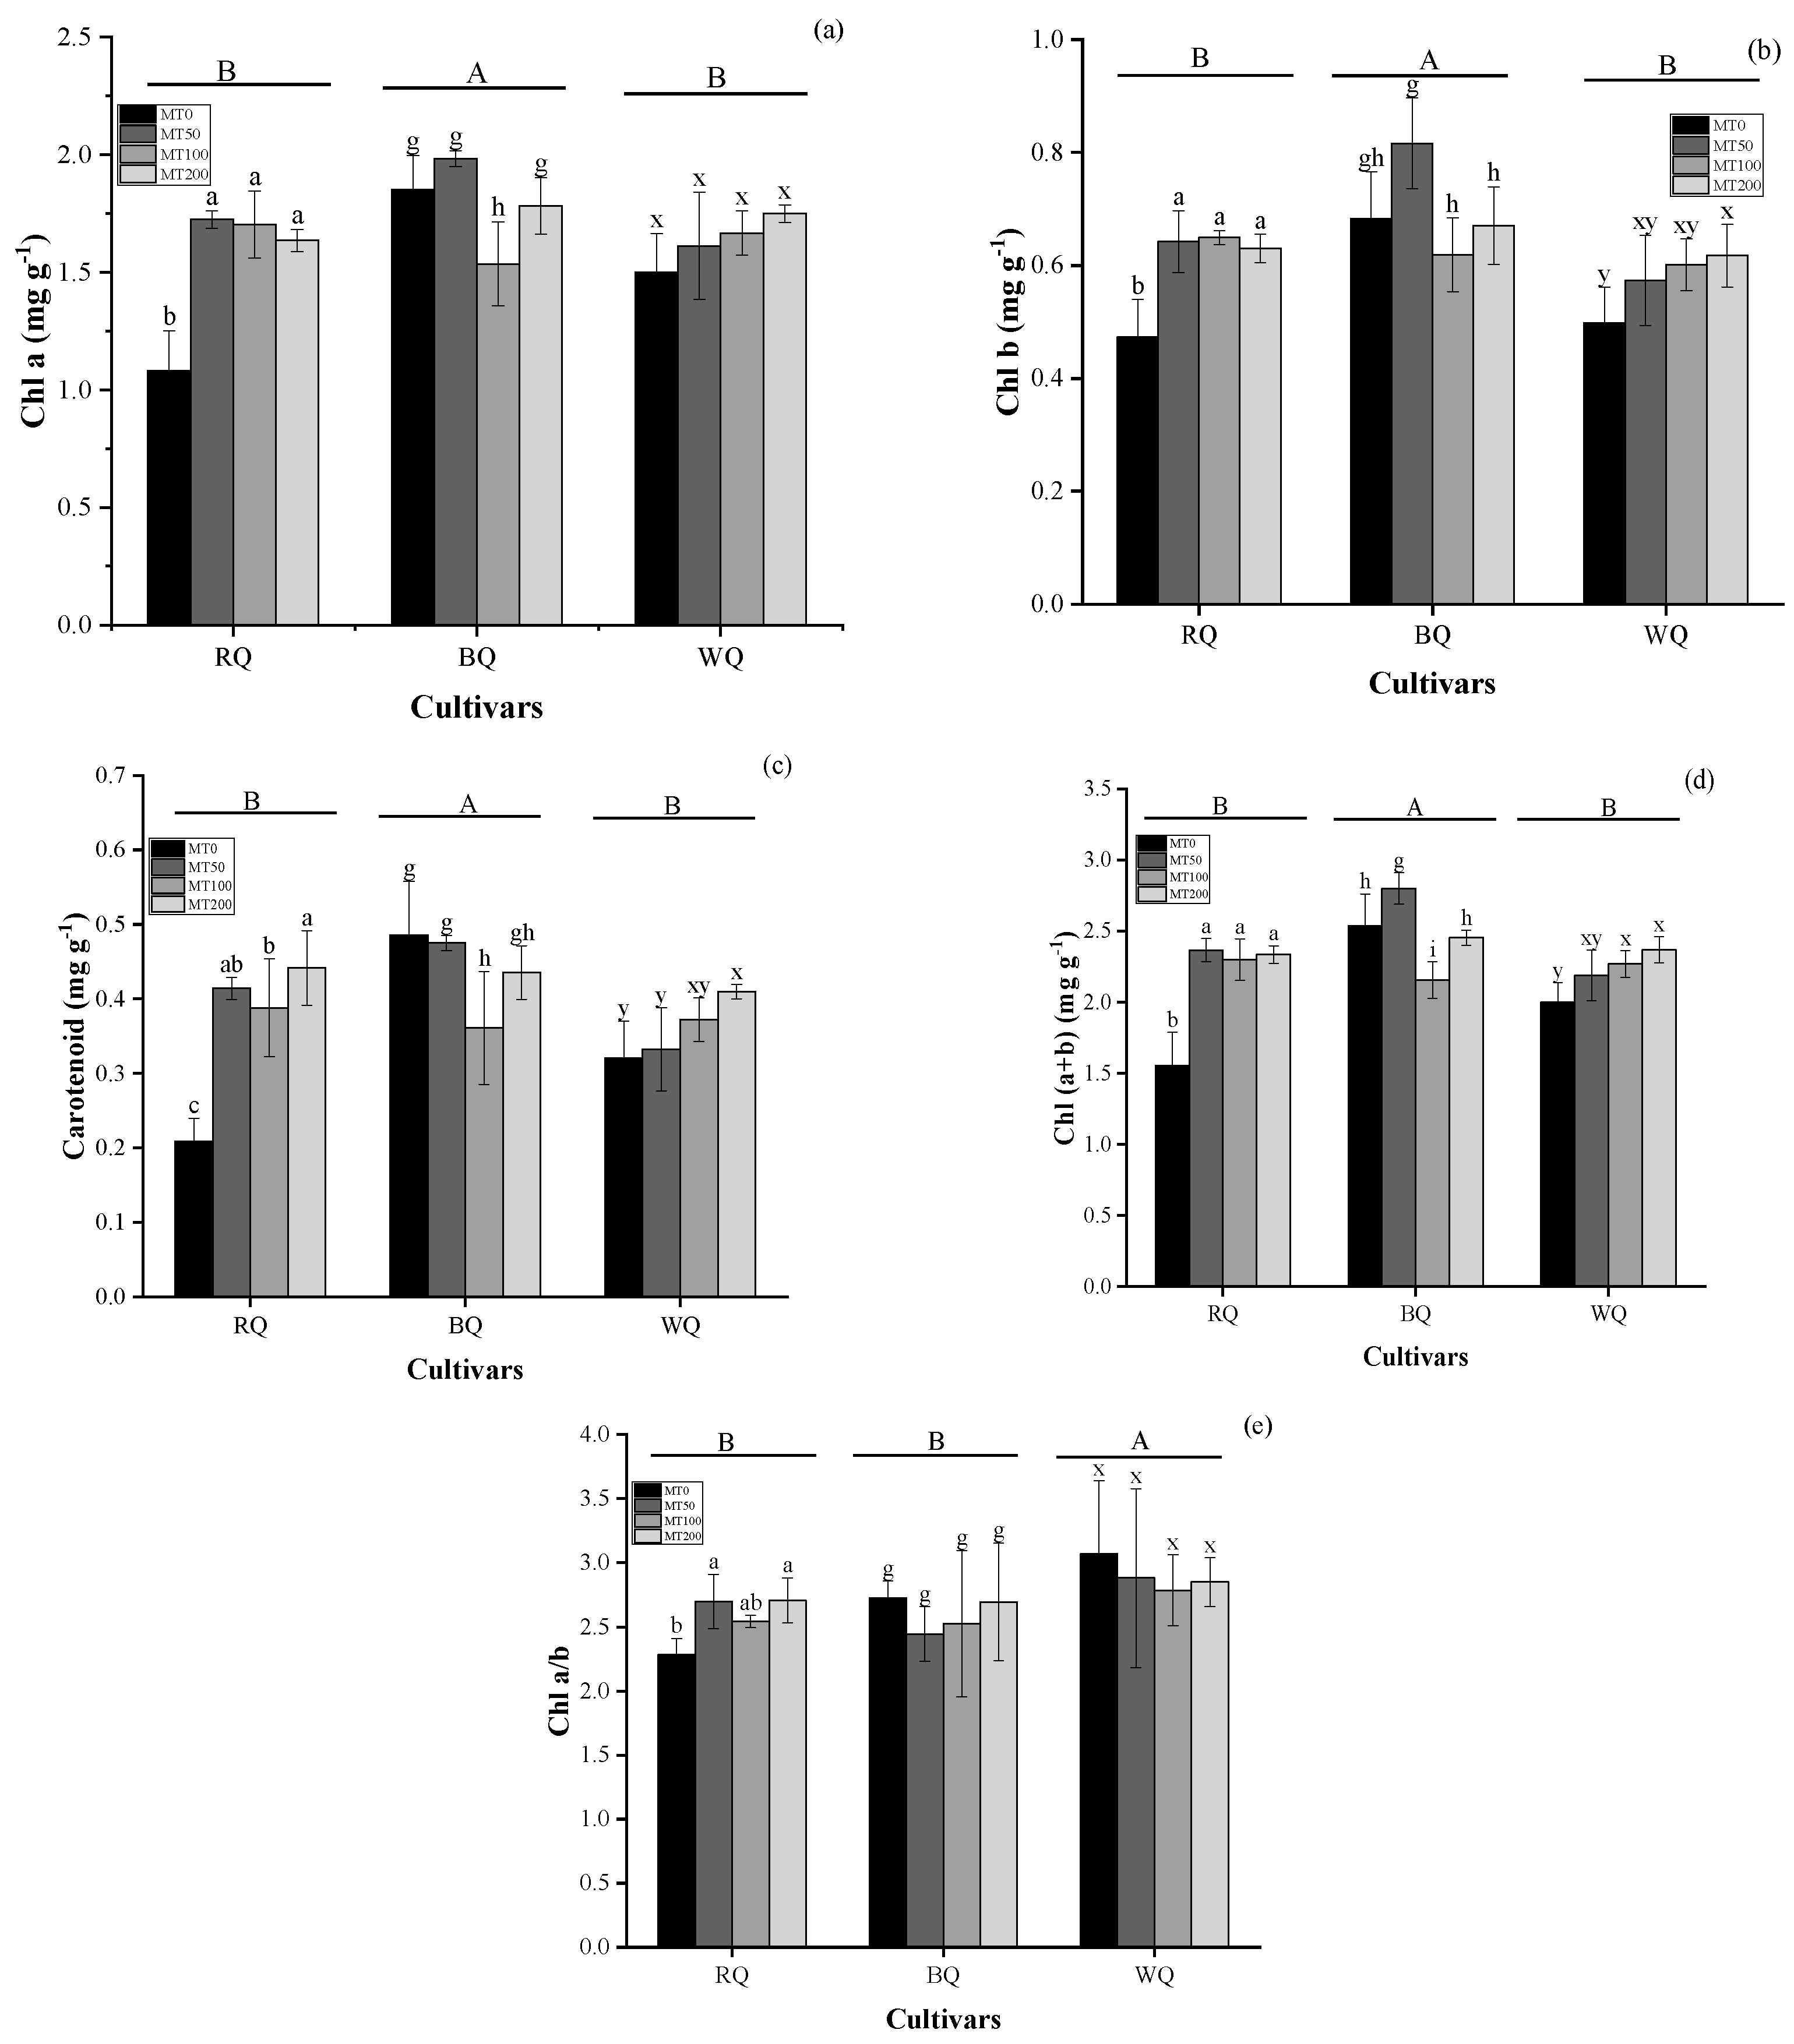
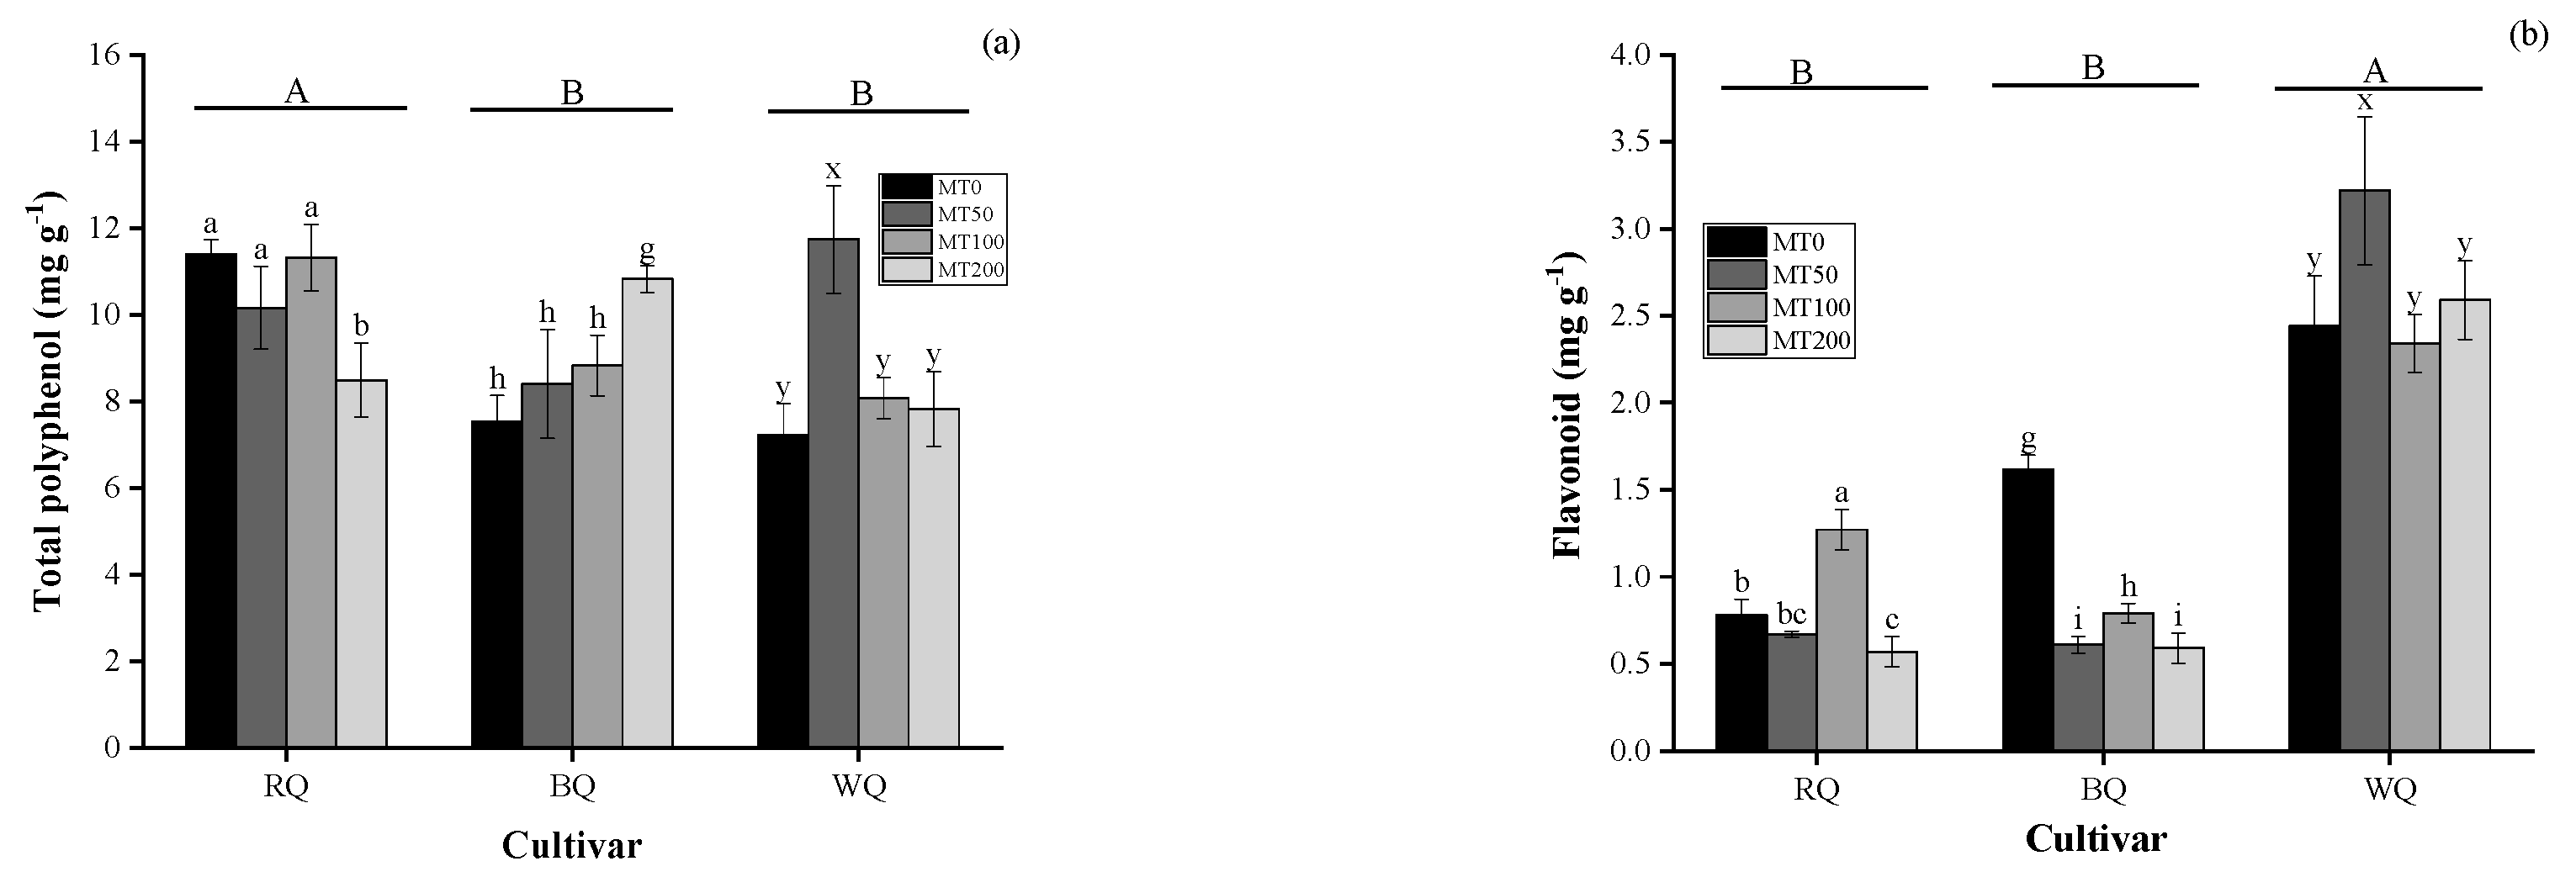
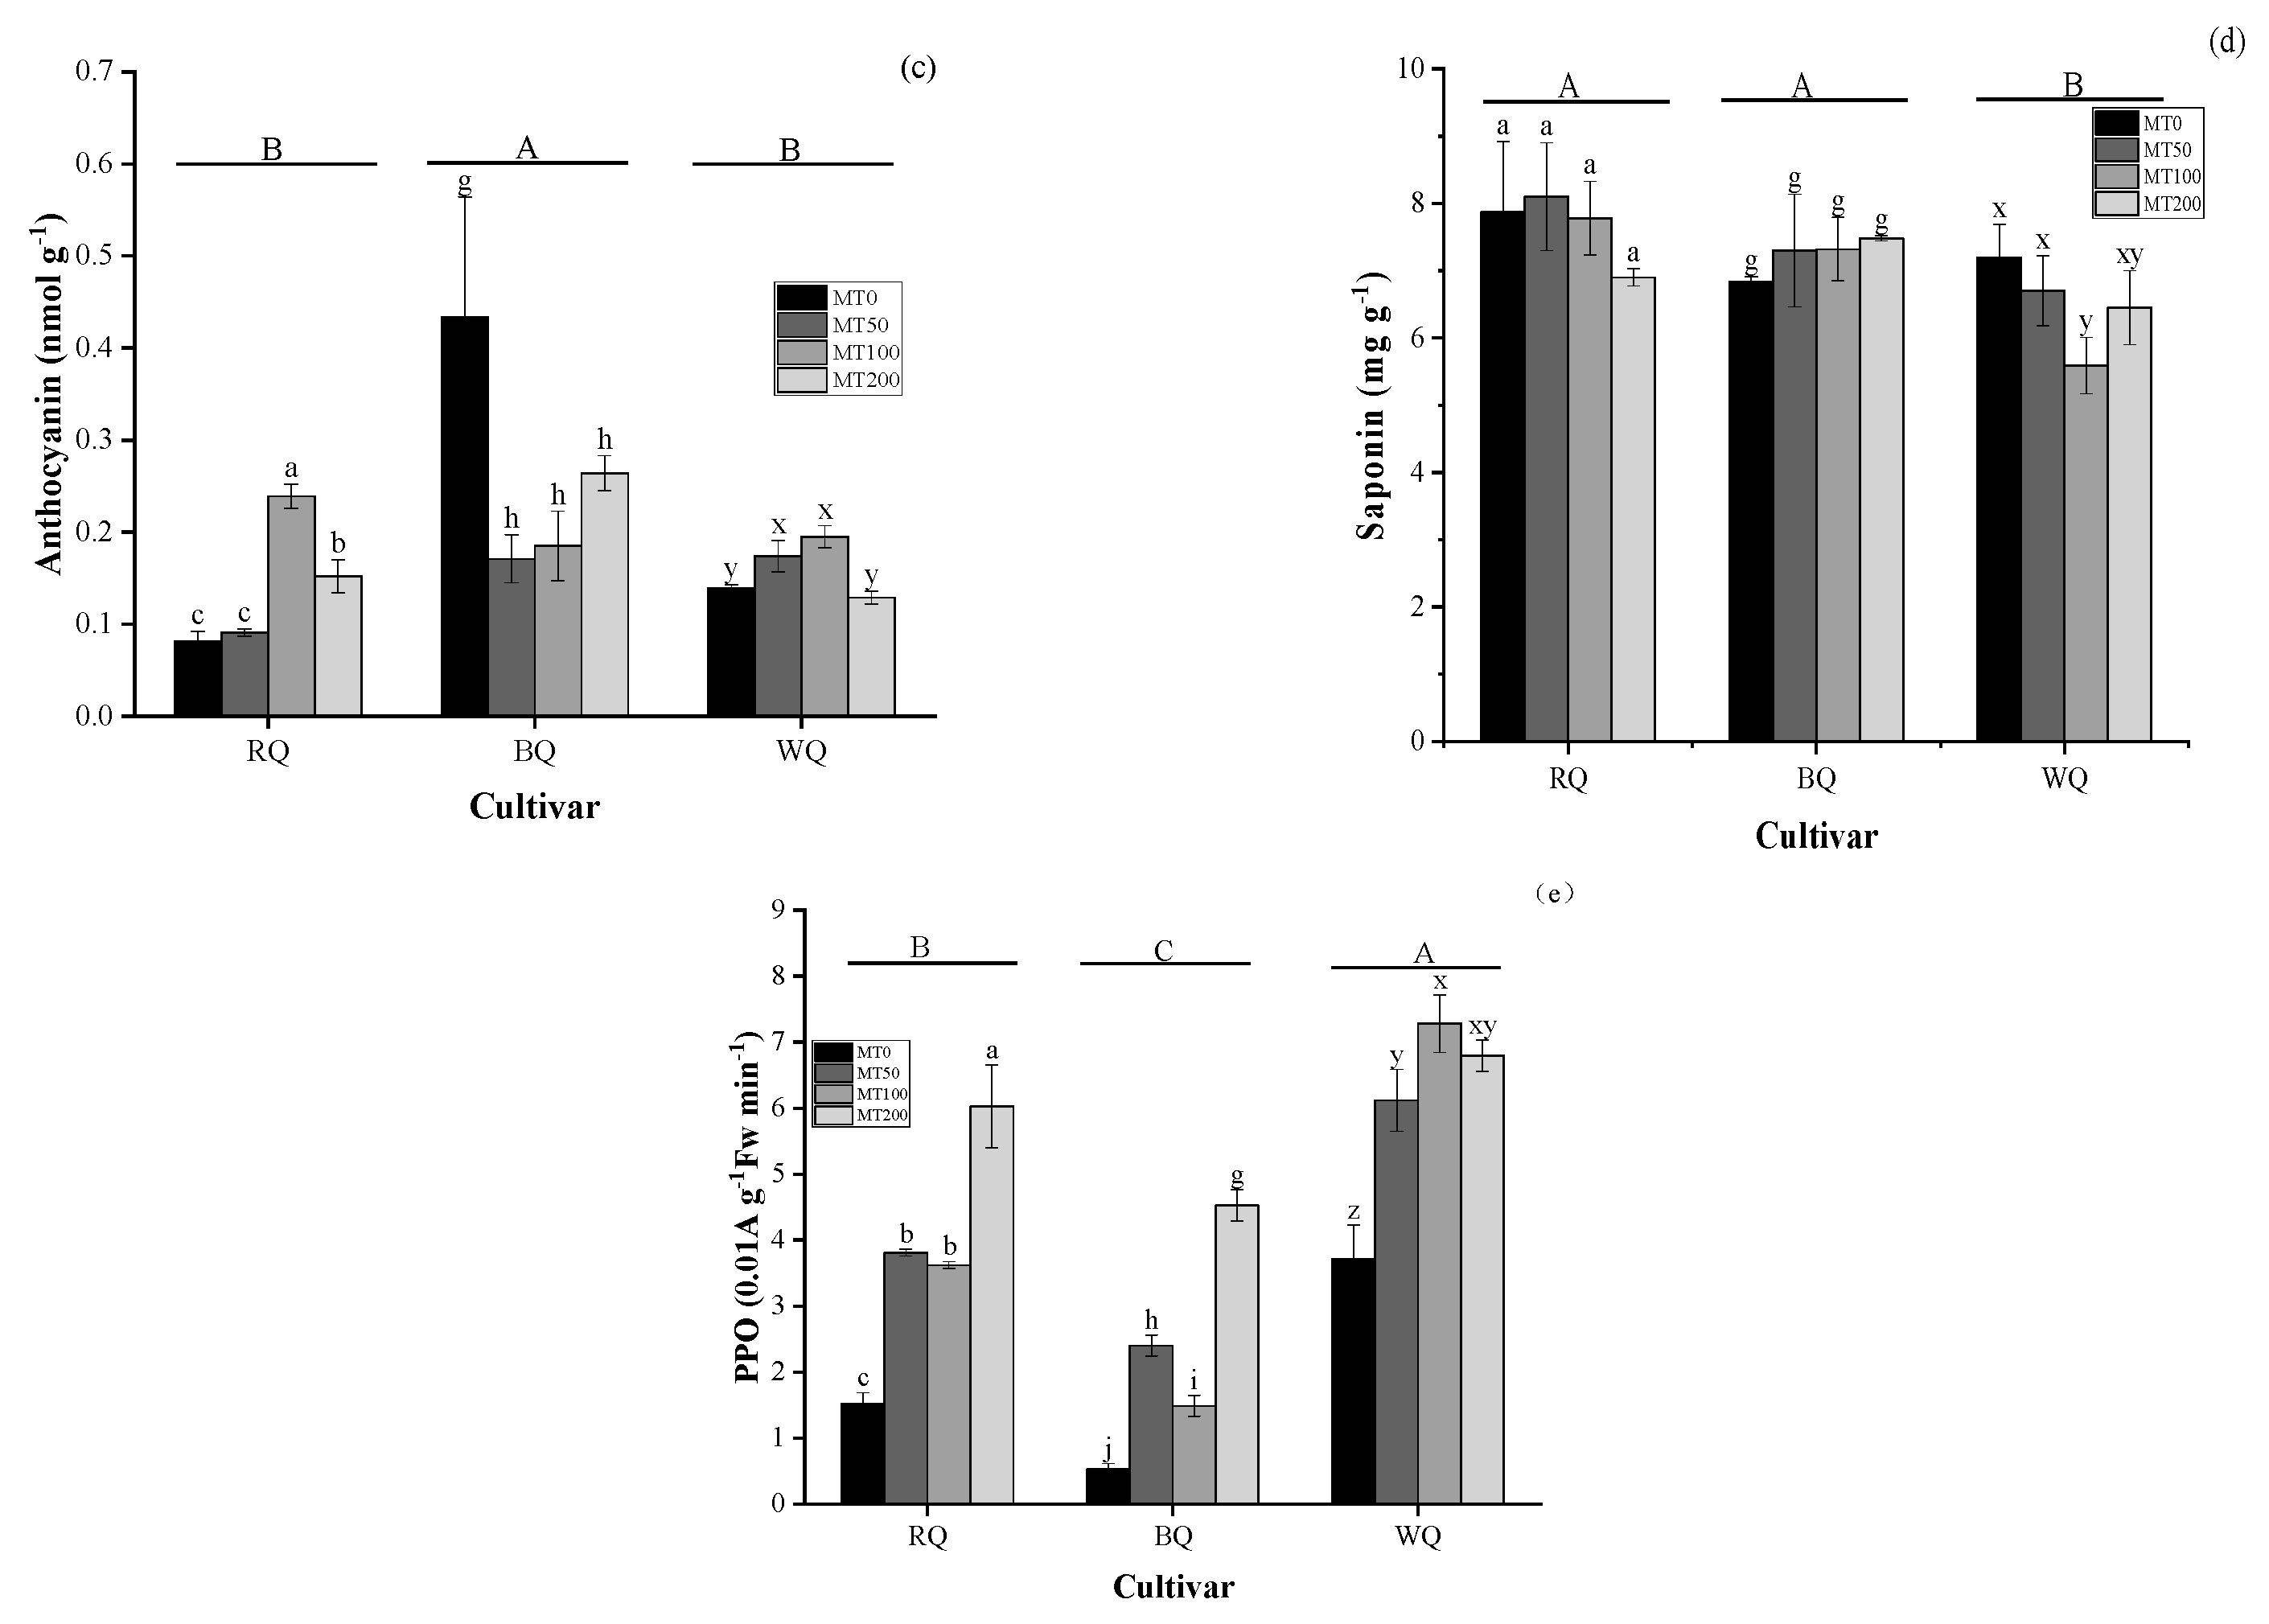
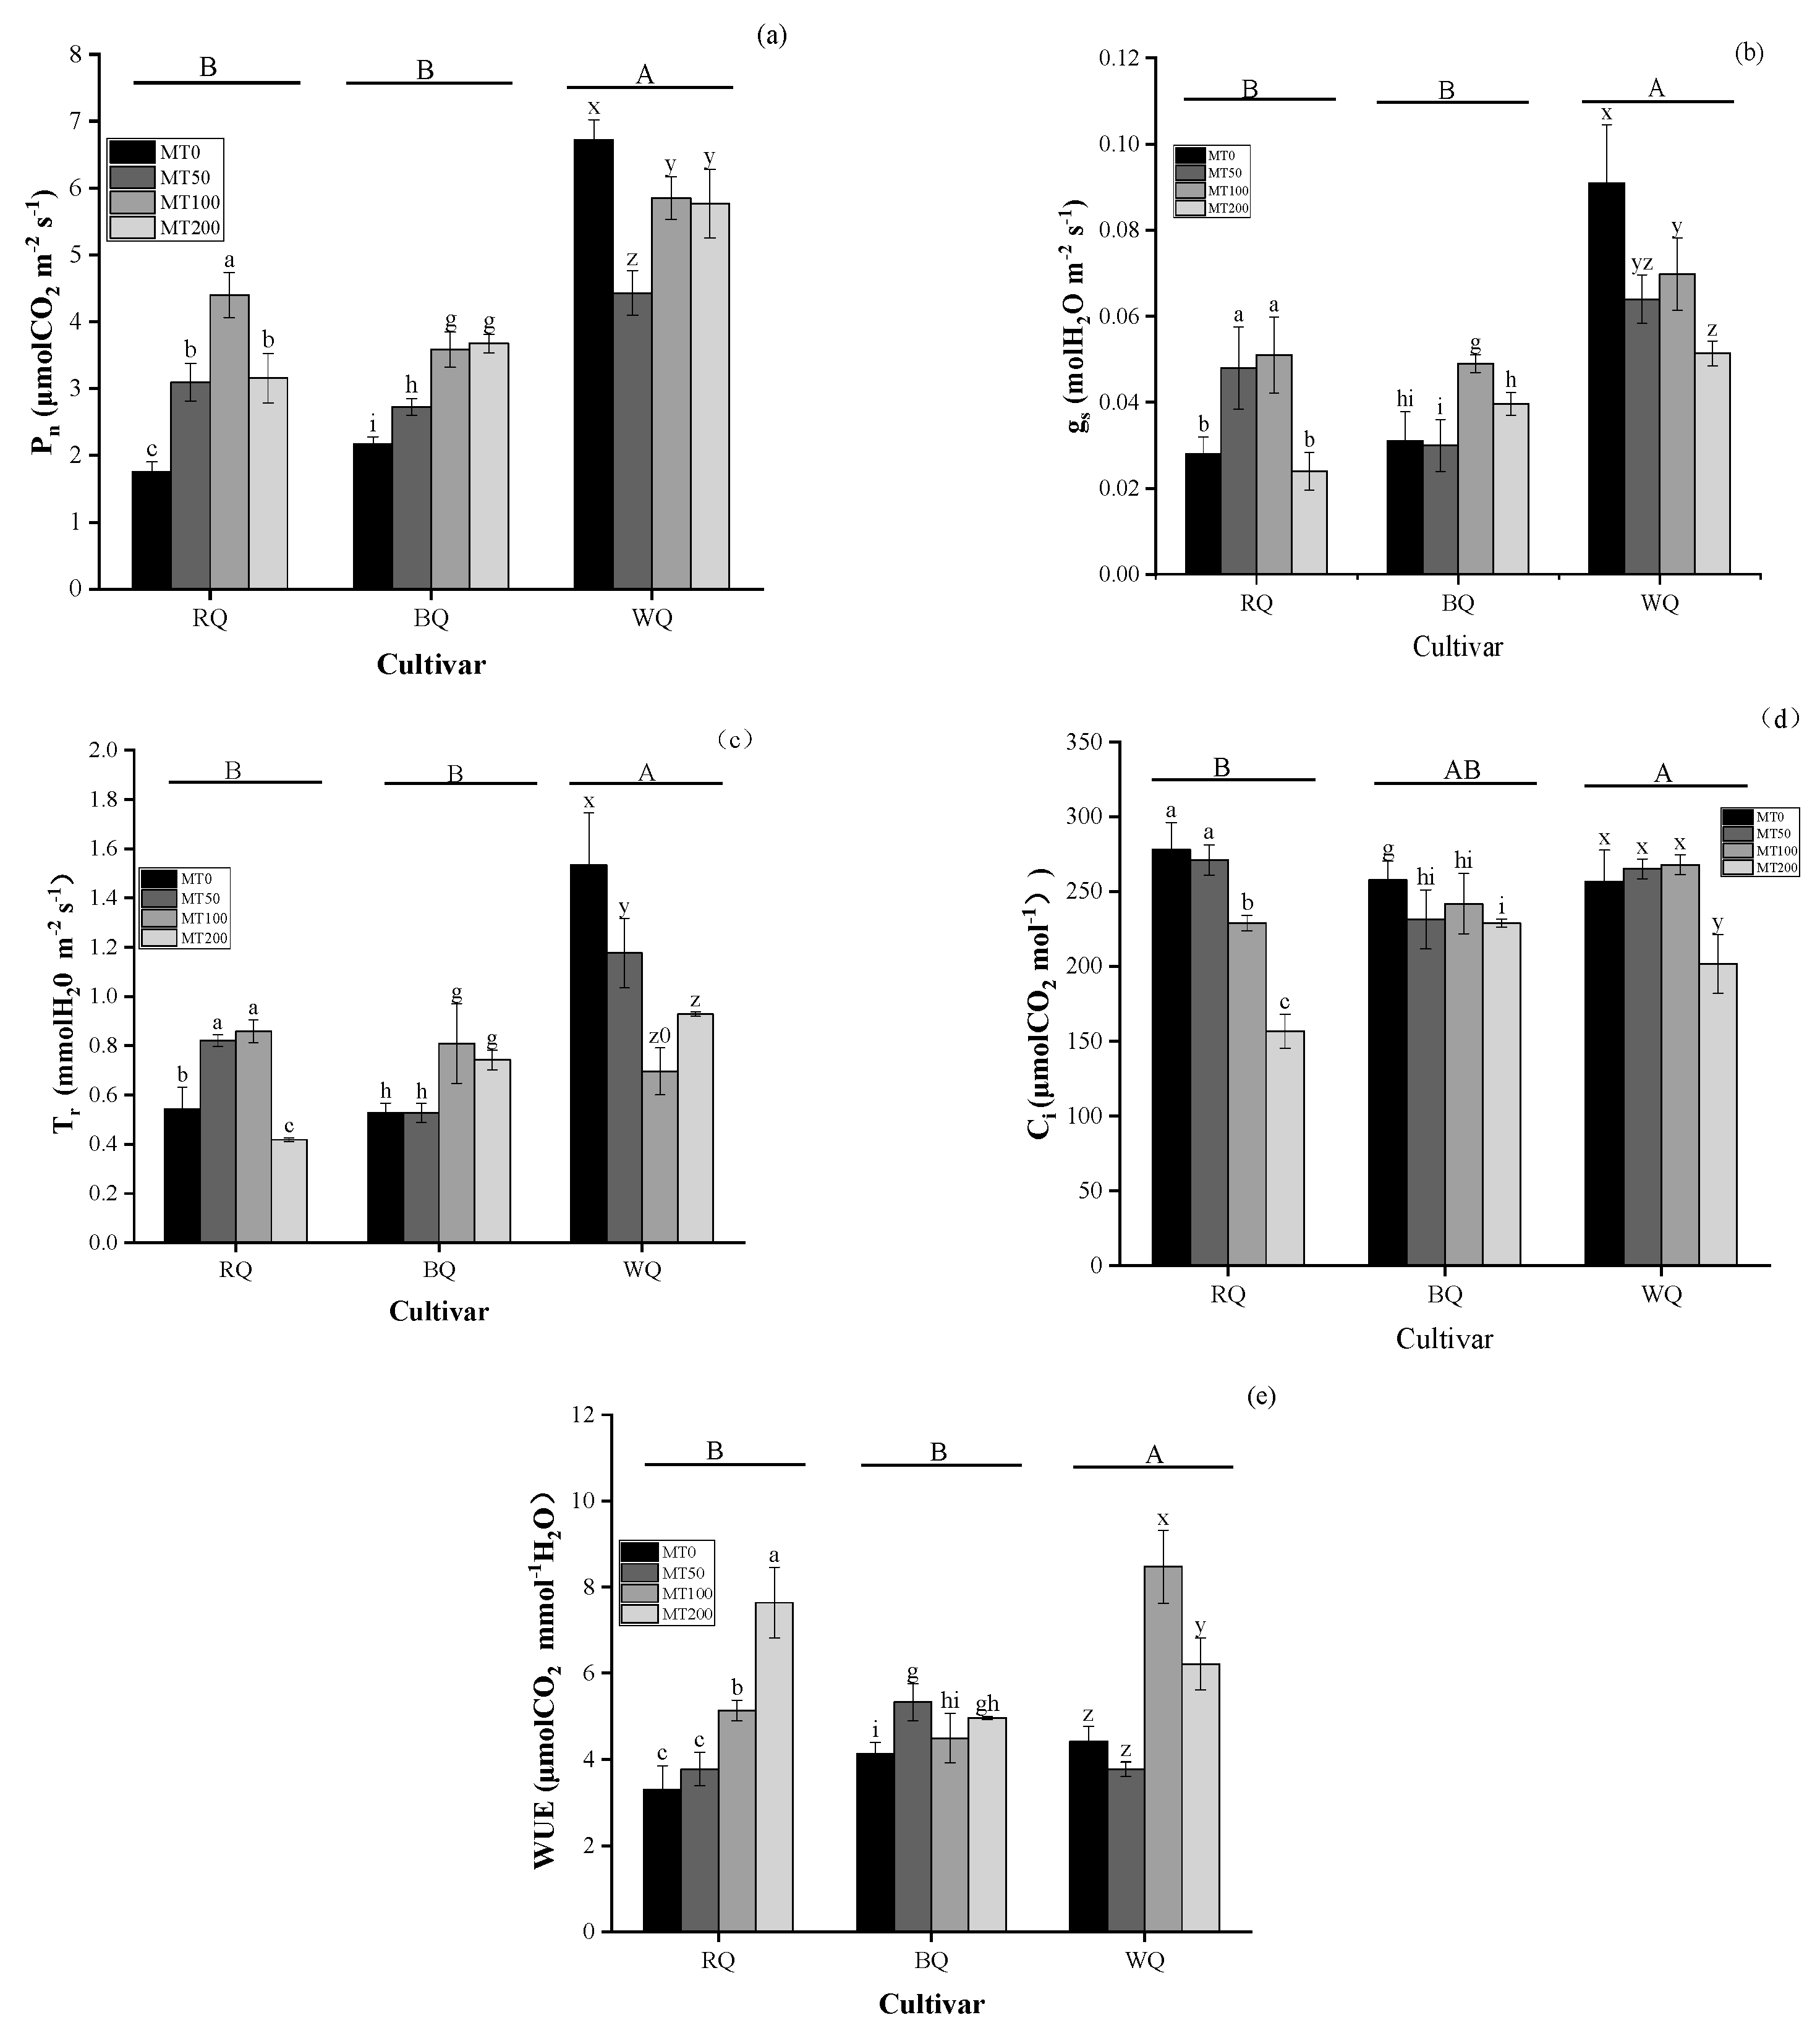
3.2. Impacts of Cultivar and MT on Metabolite and Gas Exchange Parameters in Plants Exposed to Heat Stress

Under high-temperature conditions (35/25 °C) with foliar application of different MT concentrations, the interaction of cultivar × melatonin (MT) had a considerable effect on Chl a, Chl b, carotenoid, and Chl (a + b), as indicated by the analysis of variance values shown in Table 2. However, the Chl a/b ratio was significantly influenced by quinoa cultivar.
Compared to MT0, in plants with melatonin applications (MT50, MT100, and MT200), the pigment contents of Chla, Chl b, Chl (a + b), and carotenoid significantly increased, while no significant differences were observed in the contents of Chl a, Chl b and Chl (a + b) among the three levels of MT applications in the RQ cultivar. Additionally, the significant effects of MT200 application on the carotenoid content were obvious. Applications of MT50 and MT200 also significantly increased Chl a/b.
For the BQ cultivar, the effects of different levels of MT application on photosynthetic pigments were different, while the application of MT100 (100 µmol L−1) caused a decrease in the contents of Chl a, Chl b, Chl (a + b), and carotenoid compared to MT50. Application of other MT levels induced no differences in the contents of photosynthetic pigments compared to MT0.
Application of MT50, MT100, or MT200 showed no significant increase in the contents of Chl a, Chl b, and Chl a/b in the WQ cultivar compared to MT0. However, application of MT100 or MT200 demonstrated a particularly significant increase in Chl (a + b) content compared to MT0, with increased rates of 13.49% and 18.46%, respectively (Figure 5d). In addition, the content of carotenoids significantly increased with the application of MT200 compared to that of MT0.
The results of the Tukey HSD test for pairwise comparisons of photosynthetic pigments indicated that the contents of Chl a, Chl b, carotenoid, and Chl (a + b) with all MT levels for the BQ cultivar were significantly different compared to those of the RQ cultivar and the WQ cultivar. However, the pigment contents of Chl a, Chl b, carotenoid, and Chl (a + b) between the RQ cultivar and the WQ cultivar showed no statistical difference (p < 0.05), as illustrated in Figure 5. The Chl a/b ratio in the WQ cultivar was significantly higher than those in the RQ and BQ cultivars.
With foliar application of different MT concentrations and exposure to high-temperature stress, the saponin contents of the RQ cultivar, BQ cultivar, and WQ cultivar exhibited no significant differences, while the contents of total polyphenols, flavonoids, anthocyanin, and saponin, as well as the activity of PPO, showed obvious differences by cultivar, MT, and the interaction of cultivar × melatonin (MT), as indicated in Table 2.
With different MT levels, as can be seen from Figure 6, the three quinoa cultivars showed various changes in secondary metabolite levels.
For the RQ cultivar, compared to MT0, the total polyphenol content significantly decreased by 25.5% with MT200. On the contrary, no significant difference was observed in total polyphenol content with application of MT50 of MT100 (Figure 6a). Compared to MT0, the flavonoid content showed a remarkable increase with MT100 application and an obvious decrease with MT200 application, while no difference was observed with MT50 application (Figure 6b). The anthocyanin content showed a significant increase with MT100 and MT200, while no difference in MT50 was found. Notably, the anthocyanin content with MT100 was significantly higher than that with MT200 (Figure 6c). The effects of application of MT50, MT100, or MT200 on saponin content revealed no significant differences compared to MT0 (Figure 6d). Application of MT50 or MT100 resulted in a similar increase in PPO activity compared to MT0. Furthermore, application of MT200 led to a significant increase in PPO activity compared to MT50 and MT100 (Figure 6e).
Compared to MT0 in the BQ cultivar, the total polyphenol content with MT200 significantly increased, while MT50 and MT100 exhibited no statistical difference. Inversely, there is an obvious decrease in the flavonoid and anthocyanin contents with MT50, MT100, and MT200, and no significant differences in anthocyanin content among the three MT levels were observed. MT50 and MT200 exhibited an inhibitory effect on flavonoid content. The saponin content revealed no significant difference among application of MT50, MT100, or MT200. However, the PPO activity showed a significant increase with application of MT50, MT100, or MT200, and the effect on PPO activity was ranked as follows: MT200 > MT50 > MT100 (Figure 6).
For the WQ cultivar, compared to MT0, MT50 significantly raised the contents of total polyphenols and flavonoids. However, there is no significant difference in total polyphenol and flavonoid content with MT100 and MT200. Only MT50 and MT100 resulted in a similar growth in anthocyanin content compared to MT0, whereas MT levels showed no significant difference. Applications of MT50 and MT100 had no significant effect on saponin content compared to MT0, whereas MT200 exhibited a significantly inhibitory effect. Applications of MT50, MT100, and MT200 significantly increased PPO activity that was specifically pronounced for MT100, followed by MT50.
The results of the Tukey HSD test for pairwise comparisons of secondary metabolite levels indicated that the contents of total polyphenols, flavonoids, anthocyanin, and saponin, as well as PPO activity, with all levels of MT were significantly different among the three cultivars. The total polyphenol content among the three cultivars exhibited significant differences, with the ranking sequence RQ > BQ = WQ (p < 0.05). The flavonoid content also showed significant differences, following the order WQ > RQ = BQ (p < 0.05). Similarly, the anthocyanin content demonstrated significant differences, ranking as BQ > RQ = WQ (p < 0.05). The saponin content exhibited significant differences as well, with the ranking being RQ = BQ > WQ (p < 0.05). Additionally, the PPO activity followed the order WQ > RQ > BQ (p < 0.05), as illustrated in Figure 6 and denoted by A, B, and C.
With the application of different MT concentrations under high temperatures, the photosynthetic parameters were influenced by both quinoa cultivar and melatonin (MT) application, as indicated by the two-way interaction (Table 2). The effects of MT, cultivar, and their interaction on photosynthetic parameters exhibited statistically significant differences (p < 0.05).
Foliar application of melatonin (MT) had a different effect on Pn, gs, and Tr in the RQ cultivar. As shown in Figure 7, the value of Pn increased by approximately 1.8-fold with MT50 and MT200 and 2.5-fold with MT100 compared to MT0; application of MT100 exhibited a higher effect compared to MT50 and MT200. The values of gs and Tr in the RQ cultivar exhibited a significant increasing trend with application of MT50 and MT100. In contrast, the MT200 level had no obvious effect on gs, but significantly decreased the Tr value. Application of MT50, MT100, or MT200 led to a significant reduction in Ci; the order of the inhibitory effect was as follows: MT50 < MT100 < MT200. However, application of these treatments had an opposite effect on WUE.
With the MT100 and MT200 treatments, the Pn, gs, and Tr values for the BQ cultivar were significantly higher than those with MT50 (p < 0.05). In addition, MT50 showed only a significant increase in the Pn value. Specifically, these values were approximately 1.65–1.69 times, 1.55–1.26 times, and 1.53–1.40 times higher than those with MT0 for the values of Pn, gs, and Tr, respectively.
The values of Ci in the BQ cultivar were significantly reduced, while the values of WUE were markedly enhanced with the application of MT50, MT100, and MT200. However, no significant differences were observed among the three MT applications in terms of the Ci and WUE values.
For the WQ cultivar, application of MT50, MT100, or MT200 significantly inhibited the values of Pn, gs, and Tr. However, MT50 had a more pronounced inhibitory effect on the Pn value compared to MT100 and MT200. MT200 exhibited a stronger inhibitory effect on the gs value relative to MT100. MT100 demonstrated a greater inhibitory effect on the Tr value compared to MT50. In addition, MT200 significantly decreased the value of Ci compared to MT50 and MT100, whereas MT100 and MT50 exhibited no significant difference compared to MT0. Notably, in comparison with MT0, application of MT100 or MT200 significantly improved water use efficiency (WUE), whereas no significant difference was observed for MT50.
The results of the Tukey HSD test for pairwise comparisons of gas exchange parameters indicated that the values of Pn, gs, Tr, Ci, and WUE from all levels of MT means were significantly different among the three cultivars. All the values of Pn, gs, Tr, and WUE among the three cultivars exhibited significant differences, with the ranking being WQ > RQ = BQ (p < 0.05). Ci also exhibited a significant difference, with the ranking being WQ > WQ, and the BQ cultivar showed no obvious difference compared to both RQ and WQ (p < 0.05), as illustrated in Figure 7 and denoted by A, B, and C.

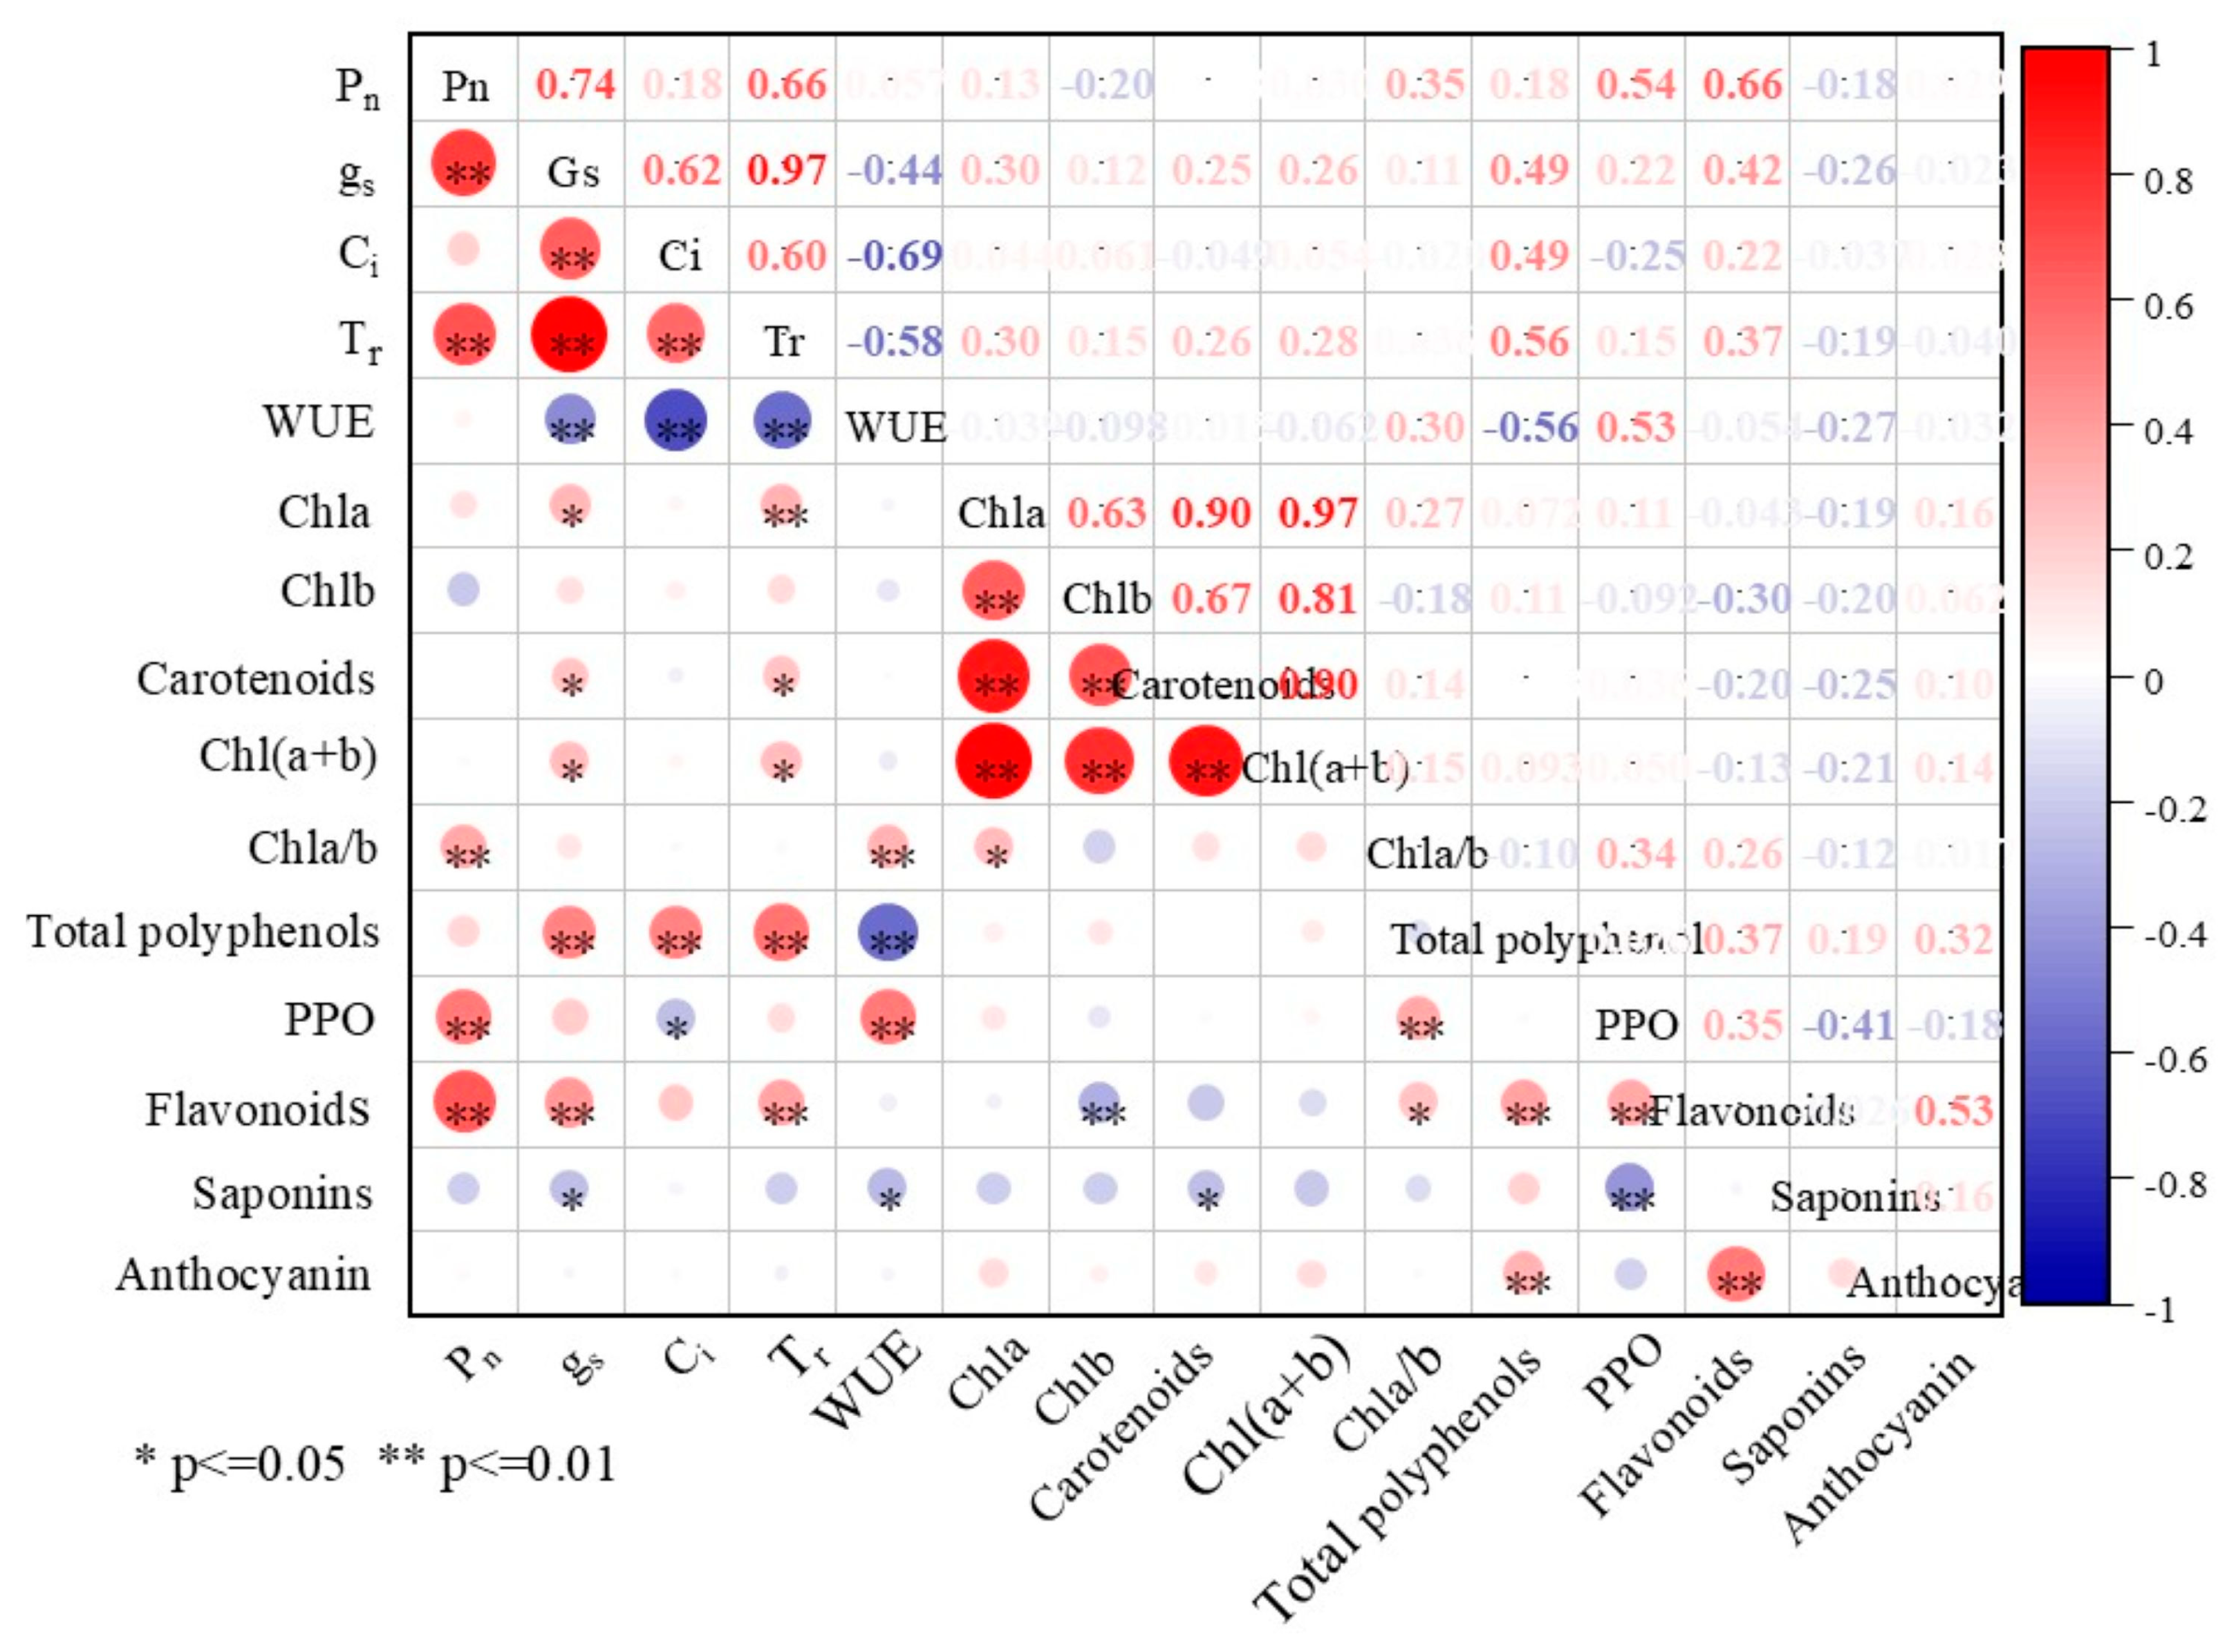
3.3. Correlation Analysis of the Photosynthetic Parameters and Some Biochemical Traits in Plants Exposed to High Temperatures

Under high temperatures, the correlation analysis of photosynthetic parameters and biochemical traits varied across different treatments, as illustrated in Figure 8. Strong correlations were found among the contents of Chl a, Chl b, carotenoids, and Chl(a + b). Additionally, the net photosynthetic rate (Pn) showed relatively strong correlations with stomatal conductance (gs) and transpiration rate (Tr), which were 0.74 and 0.66, respectively. Similarly, a positive correlation was also observed between Pn and flavonoid content, reaching 0.66. However, total polyphenol content showed negative correlations with Pn, WUE, chlorophyll a, and carotenoids, whereas positive and significant interactions were observed between saponin content and the values for Pn, WUE, PPO activity, and flavonoid content.

4. Discussion

4.1. Changes in Photosynthetic Efficiency Under Favorable Growth Conditions and Heat Stress Conditions

Photosynthesis is the foundation of higher plant growth and production [16], and evaluation of photosynthetic efficiency under heat stress can be achieved through analysis of photosynthetic gas exchange and pigments [36]. The results of this study indicate that changes in photosynthetic efficiency under different temperature treatments not only depend on the quinoa variety and temperature, but also on the interaction effect between variety and temperature. The photosynthesis-related parameters of net photosynthetic rate (Pn), stomatal conductance (gs), and transpiration rate (Tr) for the three quinoa cultivars exhibited significant decreases under day/night 35/25 °C temperature conditions. Specifically, the net photosynthetic rate (Pn) and water use efficiency (WUE) decreased significantly for the RQ cultivar, stomatal conductance (gs) decreased for the BQ cultivar, and transpiration rate (Tr) decreased for the BQ cultivar, which differed from the photosynthetic parameters reported under similar conditions in Ref. [6]. This discrepancy may be attributed to differential impairment of chloroplast components [37] leading to reduced photosynthetic efficiency in the three quinoa cultivars. Stomata play a crucial role in regulating water transport within plants by controlling aperture size [38]. So, low stomatal conductance (gs) induced a correspondingly rapid reduction in transpiration rate (Tr) for each cultivar in this study, resulting in an overall obvious increase in water use efficiency (WUE) under heat stress. Research confirms that the notable increase in WUE in the red quinoa cultivar [39] is primarily attributable to the synergistic effects of higher net photosynthetic rate (Pn) and lower transpiration rate (Tr), which effectively enhance WUE.
Different quinoa cultivars showed varying responses to heat stress. The reduction in the contents of Chl a, Chl b, carotenoid, and Chl (a + b) in the RQ cultivar and the increase in the contents of carotenoid and Chl (a + b) in the BQ cultivar were responses to heat stress across the cultivars, which affects both the content of photosynthetic pigments and the activity of chlorophyll-related enzymes [40]. The BQ cultivar exhibited relatively low sensitivity to temperature change, while the RQ cultivar and the WQ cultivar demonstrated higher sensitivity, characterized by reduced levels of photosynthetic pigments in these two varieties. These observations may also be influenced by variations in enzyme activity and the differential response of photosynthetic pigments to light signaling among quinoa varieties under heat stress [41]. Additional research is needed to investigate the impacts of varying light intensities on the physiology and biochemistry of plants under high-temperature stress.
The polyphenol content of quinoa leaves across all three quinoa cultivars exposed to temperature conditions of 25/15 °C (day/night) aligns with previous research findings on the same three quinoa seed varieties reported in Ref. [42]. Under varying temperature conditions, the BQ variety exhibited a relatively minor reduction in the levels of polyphenols, flavonoids, and anthocyanin. Similarly, the WQ variety demonstrated a comparably small decrease in saponins and polyphenol oxidase (PPO). This indicates that heat stress affects the synthesis of metabolites differently depending on the quinoa cultivar. The reductions in PPO activity and the contents of total phenol content and flavonoid content in the WQ and BQ cultivars, as well as the anthocyanin content, in a specific variety subjected to heat stress further testified to the fact that the secondary metabolite level decrease in different cultivars was not conducive to resisting heat stress. Previous studies have reported that heat stress responses, and generally non-biological stress responses, were the outcome of increasing phenolic compounds, including flavonoids, anthocyanin, and so on [17,43]. In addition, high temperatures can induce an increase in PPO activity in the leaves of Basella alba [44], which was inconsistent with the findings in the three quinoa cultivars in our study. The discrepancy may primarily be attributed to differences in the accumulation patterns of flavonoids and phenolic acids, as well as variations in purine metabolism regulation that enhance stress signaling for rapid adaptation to high-temperature stress across different quinoa cultivars [45].
Saponins can act as anti-nutritional factors [46], and the findings of this study revealed that heat stress significantly decreased their content in the RQ cultivar but kept a higher content in the WQ cultivar, which differs from the positive correlation between saponin content and increased heat tolerance observed in maize seedlings [47]. The varying saponin content among quinoa varieties in the study revealed responses of different cultivars to elevated temperatures.

4.2. Metabolites and Photosynthesis in Plants Exposed to Heat Stress with MT Spraying

Research indicates that photosynthetic capability and quantities of photosynthetic pigments in leaves are reduced in plants exposed to extreme temperatures [48,49]. The differential responses of various quinoa cultivars to melatonin application were evidenced by the gradually increasing levels of chlorophyll a, chlorophyll b, carotenoids, and total chlorophyll (Chl (a + b)) in the RQ and WQ cultivars treated with melatonin (MT). Additionally, a significant elevation in these levels was noted in the BQ cultivar following MT treatment. Other research also has confirmed that different levels of melatonin (MT) can enhance photosynthetic energy transport capacity and chlorophyll content [50]. It could be inferred from the existing research that the spraying of MT on quinoa leaves alleviates high-temperature stress by increasing pigments relevant to photosynthesis. Research findings have confirmed that melatonin treatment (100 μM) could increase photosynthetic pigments in tomato seedlings under high-temperature stress [49]. Therefore, the increased photosynthesis in the three cultivars may be attributed to the differential activities of defense enzymes in response to varying MT concentrations [51].
The values of gas exchange parameters in the WQ cultivar were more obviously enhanced with the application of melatonin compared to both the RQ cultivar and the WQ cultivar. The outcomes of different gas exchange parameters for the three cultivars may depend on the genetic characteristics and phenological stage of quinoa under heat stress, as well as their varying responses to melatonin [52]. Notably, photosynthesis in the RQ variety was inhibited by MT200, possibly associated with the acceleration of sucrose, hexose, and starch accumulation at high concentrations of melatonin, which also resulted in inhibition of photosynthesis and phloem loading of sucrose [53]. Higher values of WUE and Ci with sprayed MT under heat stress may be attributed to stomatal aperture regulation utilizing transpiration reduction and evaporative cooling as mechanisms to prevent thermal damage [54,55]. However, the low Ci and high Pn values observed in WQ when sprayed with 200 μmol L−1 MT were consistent with research showing that melatonin spray increases the net photosynthetic rate and decreases the intercellular CO2 concentration in cucumber seedlings under high-temperature stress [56]. From the above analysis, we concluded that the changes in photosynthetic parameters under heat stress were the result of the combined effect of varieties and melatonin concentrations. Application of 100 μmol L−1 MT is perhaps the optimal choice for enhancing gas exchange parameters (Pn, gs, and Tr) under heat stress in all three cultivars. However, experimental limitations, such as low light intensity, could potentially affect quinoa growth. Therefore, further research is necessary, involving the establishment of different light intensity conditions in conjunction with heat stress exposure.
High-temperature stress can lead to variable activities of polyphenol oxidase (PPO) in wheat genotypes, depending on the tolerance or susceptibility of different varieties [57]. Exogenous melatonin (MT) can increase the activity of defensive enzymes, including PPO, in grapefruit [58]. In our study, the application of different levels of MT to plants exposed to high temperatures enhanced PPO activity in the three quinoa cultivars, particularly resulting in a significant increase in the WQ cultivar. The increased PPO activity triggered by melatonin is crucial for protecting cell membranes from ROS-induced injury [59]. Consequently, these results demonstrate robust and effective co-regulation between PPO and MT, which imparts partial heat tolerance to quinoa seedlings, especially for the WQ cultivar.
The experimental results showed that the total polyphenol content in the RQ cultivar with MT application, the flavonoid content in the WQ cultivar, and anthocyanin levels in BQ the cultivar obviously increased. Additionally, a significant increase in total polyphenols was found in WQ treated with MT50. The increase in total polyphenols in the RQ cultivar and flavonoids in the WQ cultivar were consistent with results observed in wheat under heat stress [57]. This phenomenon implies that melatonin priming enhances accumulation of total polyphenols and flavonoids, depending on the quinoa cultivar. This contributes to an increase in antioxidants and antidiabetic activities among the three quinoa genotypes [37].
The water-soluble pigment anthocyanin, a flavonoid compound, exhibits varied responses to heat stress among different quinoa varieties [46]. Melatonin had a more obvious decreasing effect on the anthocyanin content of the WQ cultivar. Application of melatonin enhanced the anthocyanin content in both the RQ and WQ cultivars in our study, which is related to melatonin’s involvement in anthocyanin and flavonoid biosynthesis [60]. As the MT concentration increased from 50 to 200 μmol L−1, there was a noticeable declining trend in saponin content in the leaves of each cultivar under heat-stress conditions. This observation aligns with findings in Psammosilene tunicoides roots, where a negative correlation has been established between total saponin levels and MT concentrations [61]. The consistently low total saponin content is related to the specific characteristics of quinoa [62], which primarily synthesizes saponins during the onset of flowering and accumulates them in later stages of plant development [63].

4.3. Correlation Analysis of Photosynthetic Parameters and Some Biochemical Traits of Quinoa Cultivars with MT and Exposure to High Temperatures

The robust correlations observed among chlorophylls (excluding chl a/b) suggested that the synthesis and metabolism of these photosynthetic pigments may be regulated by a shared mechanism under high-temperature conditions. The strong positive correlations between net photosynthetic rate (Pn) and stomatal conductance (gs), as well as transpiration rate (Tr), indicated that the extent of stomatal opening directly influences CO₂ assimilation and water transpiration under high temperatures, thereby constraining photosynthetic efficiency. Flavonoids may protect photosynthetic organs through their antioxidant effects or by participating in the regulation of light signaling pathways. Meanwhile, total polyphenols may influence net photosynthetic rate (Pn) by disrupting chloroplast structure. Saponins exhibit positive interactions with Pn, water use efficiency (WUE), polyphenol oxidase (PPO) activity, and flavonoids, potentially facilitating metabolic coordination under stress conditions. The strong association between saponin content and total polyphenol content suggests either a precursor–product relationship or the presence of a common regulatory node within their metabolic pathways.
These findings provided a theoretical foundation for elucidating the physiological-metabolic network underlying plant responses to high-temperature stress. Future research could focus on the regulation mechanisms of relevant genes to further uncover the molecular basis of these adaptive processes.

5. Conclusions

Our results confirmed that the BQ cultivar was more sensitive to temperature changes. Melatonin priming enhanced the ability of quinoa seedlings to alleviate the adverse effects of heat stress, with the effectiveness varying depending on the quinoa cultivar. Taking the actual application situation of melatonin at high temperatures, application of 100 μmol L−1 MT was optimal for mitigating the adverse effects on photosynthesis and metabolites in the RQ cultivar. Our approach has further demonstrated that foliar spraying of melatonin enhances photosynthesis and promotes metabolite accumulation in quinoa plants through concentration- and variety-specific effects under a heat-stress growth environment. Moving forward, future studies are necessary to investigate the metabolic pathways of the three cultivars involved in alleviation mechanisms under high-temperature conditions with melatonin treatment.

Author Contributions

Conceptualization, M.L. and J.L.; methodology, M.L.; software, D.X.; validation, M.L.; formal analysis, Y.W.; investigation, M.L.; resources, M.L.; data curation, M.L.; writing—original draft preparation, M.L.; writing—review and editing, J.L.; visualization, D.X.; supervision, Y.W.; project administration, J.L.; funding acquisition, J.L. All authors have read and agreed to the published version of the manuscript.

Funding

This research was funded by the Key Research and Development Program of Zhenjiang City (NY2022008) and the Priority Academic Development Program of Jiangsu Higher Education Institutions (No. PAPD-2023-87).

Data Availability Statement

No new data were created or analyzed in this study. Data sharing is not applicable to this article.

Conflicts of Interest

The authors declare no conflicts of interest.

References

  1. Vilcacundo, R.; Hernández, B. Nutritional and biological value of quinoa (Chenopodium quinoa Willd.). Curr. Opin. Food Sci. 2017, 14, 1–6. [Google Scholar] [CrossRef]
  2. Pathan, S.; Siddiqui, R. Nutritional composition and bioactive components in quinoa (Chenopodium quinoa Willd.) greens: A review. Nutrients 2022, 14, 558. [Google Scholar] [CrossRef] [PubMed]
  3. Vasquez-Luna, A.; Pimentel Cortes, V.; Fuentes Carmonas, F.; Diaz-Sobac, R. Quinoa leaf as a nutritional alternative. Cienc. Inv. Agric. 2019, 46, 137–143. [Google Scholar] [CrossRef]
  4. Gawlik-Dziki, U.; Swieca, M.; Sulkowski, M.; Dziki, D.; Baraniak, B.; Czyz, J. Antioxidant and anticancer activities of Chenopodium quinoa leaves extracts-In vitro study. Food Chem. Toxicol. 2013, 57, 154–160. [Google Scholar] [CrossRef]
  5. Satheesh, N.; Fanta, S.W.; Yildiz, F. Review on structural, nutritional and anti-nutritional composition of Teff (Eragrostis tef) in comparison with Quinoa (Chenopodium quinoa Willd.). Cogent Food Agric. 2018, 4, 1546942. [Google Scholar]
  6. Yang, A.; Akhtar, S.; Amjad, M.; Iqbal, S.; Jacobsen, S. Growth and physiological responses of quinoa to drought and temperature stress. J. Agron. Crop Sci. 2016, 202, 445–453. [Google Scholar] [CrossRef]
  7. Hinojosa, L.; Gonzalez, J.; Barrios-Masias, F.; Fuentes, F.; Murphy, K. Quinoa abiotic stress responses: A review. Plants 2018, 7, 106. [Google Scholar] [CrossRef]
  8. Zou, C.; Chen, A.; Xiao, L.; Muller, H.; Ache, P.; Haberer, G.; Zhang, M.; Jia, W.; Deng, P.; Huang, R.; et al. A high-quality genome assembly of quinoa provides insights into the molecular basis of salt bladder-based salinity tolerance and the exceptional nutritional value. Cell Res. 2017, 27, 1327–1340. [Google Scholar] [CrossRef]
  9. Isobe, K.; Uziie, K.; Hitomi, S.; Furuya, U. Agronomic studies on quinoa (Chenopodium quinoa Willd.) cultivation in Japan. Jpn. J. Crop Sci. 2012, 81, 167–172. [Google Scholar] [CrossRef]
  10. Awasthi, R.; Bhandari, K.; Nayyar, H. Temperature stress and redox homeostasis in agricultural crops. Front. Environ. Sci. 2015, 3, 11. [Google Scholar] [CrossRef]
  11. Zhang, C.; Zhang, W.; Yan, H.; Ni, Y.; Akhlaq, M.; Zhou, J.; Xue, R. Effect of micro–spray on plant growth and chlorophyll fluorescence parameter of tomato under high temperature condition in a greenhouse. Sci. Hortic. 2022, 306, 111441. [Google Scholar] [CrossRef]
  12. Xue, R.; Zhang, C.; Yan, H.; Li, J.; Ren, J.; Akhlaq, M.; Hameed, M.U.; Disasa, K.N. Physiological response of tomato and cucumber plants to micro-spray in high-temperature environment: A Scientific and effective means of alleviating crop heat stress. Agronomy 2023, 13, 2798. [Google Scholar] [CrossRef]
  13. Hou, M.; Ni, J.; Mao, H. Effects of airflow disturbance on the content of biochemical components and mechanical properties of cucumber seedling stems. Agriculture 2023, 13, 1125. [Google Scholar] [CrossRef]
  14. Präger, A.; Munz, S.; Nkebiwe, P.; Mast, B.; Graeff-Hönninger, S. Yield and quality characteristics of different quinoa (Chenopodium quinoa Willd.) cultivars grown under field conditions in southwestern Germany. Agronomy 2018, 8, 197. [Google Scholar] [CrossRef]
  15. Eisa, S.; Eid, M.; Abd, E.; Hussin, S.; Abdel-Ati, A.; El-Bordeny, N.; Ali, S.; Al-Sayed, H.; Lotfy, M.; Masoud, A.; et al. ‘Chenopodium quinoa’ Willd. A new cash crop halophyte for saline regions of Egypt. Aust. J. Crop Sci. 2017, 11, 343–351. [Google Scholar] [CrossRef]
  16. Zahra, N.; Hafeez, M.; Ghaffar, A.; Kausar, A.; Zeidi, M.; Kadambot, H.; Siddique, K.; Farooq, M. Plant photosynthesis under heat stress: Effects and management. Environ. Exp. Bot. 2023, 206, 105178. [Google Scholar] [CrossRef]
  17. Bita, C.; Gerats, T. Plant tolerance to high temperature in a changing environment: Scientific fundamentals and production of heat stress-tolerant crops. Front. Plant Sci. 2013, 4, 273. [Google Scholar] [CrossRef]
  18. Sharif, R.; Xie, C.; Zhang, H.; Arnao, M.; Ali, M.; Ali, Q.; Muhammad, I.; Shalmani, A.; Nawaz, M.; Chen, P.; et al. Melatonin and its effects on plant systems. Molecules 2018, 23, 2352. [Google Scholar] [CrossRef] [PubMed]
  19. Moustafa-Farag, M.; Almoneafy, A.; Mahmoud, A.; Elkelish, A.; Arnao, M.; Li, L.; Ai, S. Melatonin and its protective role against biotic stress impacts on plants. Biomolecules 2020, 10, 54. [Google Scholar] [CrossRef]
  20. Sun, H.; Wang, X.; Shang, Y.; Wang, X.; Du, G.; Lü, D. Preharvest application of melatonin induces anthocyanin accumulation and related gene upregulation in red pear (Pyrus ussuriensis). J. Integr. Agr. 2021, 20, 2126–2137. [Google Scholar] [CrossRef]
  21. Arnao, M.; Hernandez-Ruiz, J. Is phytomelatonin a new plant hormone? Agronomy 2020, 10, 95. [Google Scholar] [CrossRef]
  22. Yu, Y.; Deng, L.; Zhou, L.; Chen, G.; Wang, Y. Exogenous melatonin activates antioxidant systems to increase the ability of rice seeds to germinate under high temperature conditions. Plants 2022, 11, 886. [Google Scholar] [CrossRef]
  23. Dey, S.; Biswas, A.; Deng, Y.; Birhanie, Z.; Wentao, C.; Li, D. Exogenous melatonin enhances low-temperature stress of jute seedlings through modulation of photosynthesis and antioxidant potential. Heliyon 2023, 9, e19125. [Google Scholar] [CrossRef]
  24. Karumannil, S.; Khan, T.; Kappachery, S.; Gururani, M. Impact of exogenous melatonin application on photosynthetic machinery under abiotic stress conditions. Plants 2023, 12, 2948. [Google Scholar] [CrossRef]
  25. Zhou, M.; Sun, H.; Xu, X.; Yang, J.; Wang, G.; Wei, Z.; Xu, T.; Yin, J. Study on the method and mechanism of seedling picking for pepper (Capsicum annuum L.) plug seedlings. Agriculture 2024, 14, 11. [Google Scholar] [CrossRef]
  26. Song, J.; Fan, Y.; Li, X.; Li, Y.; Mao, H.; Zuo, Z.; Zou, Z. Effects of daily light integral on tomato (Solanum lycopersicon L.) grafting and quality in a controlled environment. Int. J. Agric. Biol. Eng. 2022, 15, 44–50. [Google Scholar] [CrossRef]
  27. Xu, X.; Yang, F.; Song, J.; Zhang, R.; Cai, W. Does the daily light integral influence the sowing density of tomato plug seedlings in a controlled environment? Horticulturae 2024, 10, 730. [Google Scholar] [CrossRef]
  28. Liang, D.; Gao, F.; Ni, Z.; Lin, L.; Deng, Q.; Tang, Y.; Wang, X.; Luo, X.; Xia, H. Melatonin improves heat tolerance in kiwifruit seedlings through promoting antioxidant enzymatic activity and glutathione S-transferase transcription. Molecules 2018, 23, 584. [Google Scholar] [CrossRef] [PubMed]
  29. Buttar, Z.A.; Wu, S.N.; Arnao, M.B.; Wang, C.; Ullah, I.; Wang, C. Melatonin suppressed the heat stress-induced damage in wheat seedlings by modulating the antioxidant machinery. Plants 2020, 9, 809. [Google Scholar] [CrossRef]
  30. Zulfiqar, F.; Moosa, A.; Ferrante, A.; Nafees, M.; Darras, A.; Nazir, M.M.; AlShaqhaa, M.A.; Elsaid, F.A. Melatonin and salicylic acid synergistically improve arsenic induced oxidative stress tolerance in ornamental sword lily. Sci. Hortic. 2023, 322, 112389. [Google Scholar] [CrossRef]
  31. Zrig, A.; Saleh, A.M.; Sheteiwy, M.S.; Hamouda, F.; Selim, S.; Abdel-Mawgoud, M.; Almuhayawi, M.S.; Okla, M.K.; Abbas, Z.K.; Al-Qahtani, W.H.; et al. Melatonin priming as a promising approach to improve biomass accumulation and the nutritional values of Chenopodium quinoa sprouts: A genotype-based study. Sci. Hortic. 2022, 301, 111088. [Google Scholar] [CrossRef]
  32. Austin, J.; Jeon, Y.; Cha, M.; Park, S.; Cho, Y. Effects of photoperiod, light intensity and electrical conductivity on the growth and yield of quinoa (Chenopodium quinoa Willd.) in a closed-type plant factory system. Korean J. Hortic. Sci. Technol. 2016, 34, 405–416. [Google Scholar] [CrossRef]
  33. Song, J.; Zhang, R.; Yang, F.; Wang, J.; Cai, W.; Zhang, Y. Nocturnal LED supplemental lighting improves quality of tomato seedlings by increasing biomass accumulation in a controlled environment. Agronomy 2024, 14, 1888. [Google Scholar] [CrossRef]
  34. Ahmad, I.; Cheng, Z.; Meng, H.; Liu, T.; Nan, W.; Khan, M.; Wasila, H.; Khan, A. Effect of intercropped garlic (Allium sativum) on chlorophyl contents, photosynthesis and antioxidant enzymes in pepper. Pak. J. Bot. 2013, 45, 1889–1896. [Google Scholar]
  35. Shanghai Institute of Plant Physiology, Chinese Academy of Sciences/Shanghai Society of Plant Physiology. A Modern Guide to Plant Physiology Experiments, 1st ed.; Science Press: Beijing, China, 1999; pp. 212–317. (In Chinese) [Google Scholar]
  36. Xu, C.; He, C.; Wang, Y.; Bi, Y.; Jiang, H. Effect of drought and heat stresses on photosynthesis, pigments, and xanthophyll cycle in alfalfa (Medicago sativa L.). Photosynthetica 2020, 58, 1226–1236. [Google Scholar] [CrossRef]
  37. Wang, X.; Xu, C.; Cai, X.; Wang, Q.; Dai, S. Heat-responsive photosynthetic and signaling pathways in plants: Insight from proteomics. Int. J. Mol. Sci. 2017, 18, 2191. [Google Scholar] [CrossRef]
  38. Yu, R.; Wu, Y.Y.; Xing, D.K. The differential response of intracellular water metabolism derived from intrinsic electrophysiological information in Morus alba L. and Broussonetia papyrifera (L.) vent. subjected to water shortage. Horticulturae 2022, 8, 182. [Google Scholar] [CrossRef]
  39. Xing, D.; Chen, L.; Wu, Y.; Zwiazek, J. Leaf physiological impedance and elasticity modulus in Orychophragmus violaceus seedlings subjected to repeated osmotic stress. Sci. Hortic. 2021, 276, 109763. [Google Scholar] [CrossRef]
  40. Li, X.; Lv, X.; Wang, X.; Wang, L.; Zhang, M.; Ren, M. Effects of abiotic stress on anthocyanin accumulation and grain weight in purple wheat. Crop Pasture Sci. 2018, 69, 1208–1214. [Google Scholar] [CrossRef]
  41. Nie, R.; Wei, X.; Jin, N.; Su, S. Response of photosynthetic pigments, gas exchange and chlorophyll fluorescence parameters to light quality in Phoebe bournei seedlings. Plant Growth Regul. 2024, 103, 675–687. [Google Scholar] [CrossRef]
  42. Peak, J.; Lee, Y.; Kim, Y.; Yoon, K. Antioxidant and antimicrobial activities of quinoa (Chenopodium quinoa Willd.) seeds cultivated in Korea. Prev. Nutr. Food Sci. 2017, 22, 195–202. [Google Scholar]
  43. Wahid, A.; Gelani, S.; Ashraf, M.; Foolad, M.R. Heat tolerance in plants: An overview. Environ. Exp. 2007, 61, 199–223. [Google Scholar] [CrossRef]
  44. Siddika1, M.R.; Rakib, M.A.; Zubair, M.A.; Islam, M.M.; Haque, M.S.; Al-Khayri, J.M. Regulatory mechanism of enhancing polyphenol oxidase activity in leaf of Basella alba induced by high temperature stress. Emir. J. Food Agric. 2015, 27, 82–93. [Google Scholar] [CrossRef]
  45. Qian, G.; Li, X.; Zhang, H.; Zhang, H.; Zhou, J.; Ma, X.; Sun, W.; Yang, W.; He, R.; Wahab, A.; et al. Metabolomics analysis reveals the accumulation patterns of flavonoids and phenolic acids in quinoa (Chenopodium quinoa Willd.) grains of different colors. Food Chem. X 2023, 17, 100594. [Google Scholar] [CrossRef] [PubMed]
  46. Otterbach, S.; Wellman, G.; Schmöckel, S. Saponins of quinoa: Structure, function and opportunities. In The Quinoa Genome; Springer Nature Switzerland AG: Cham, Switzerland, 2021; pp. 119–138. [Google Scholar]
  47. Mahmood, S.; Parveen, A.; Hussain, I.; Javed, S.; Iqbal, M. Possible involvement of secondary metabolites in the thermotolerance of maize seedlings. Int. J. Agric. Biol. 2014, 16, 1075–1082. [Google Scholar]
  48. Jahan, M.; Shu, S.; Wang, Y.; Chen, Z.; Wu, J.; Sun, J.; Guo, S. Melatonin alleviates heat induced damage of tomato seedlings by balancing redox homeostasis and modulating polyamine and nitric oxide biosynthesis. BMC Plant Biol. 2019, 19, 414. [Google Scholar] [CrossRef]
  49. Jahan, M.; Guo, S.; Sun, J.; Shu, S.; Wang, Y.; Ei-Yazied, A.; Alabdallah, N.; Hikal, M.; Mohamed, M.; Ibrahim, M.; et al. Melatonin-mediated photosynthetic performance of tomato seedlings under high-temperature stress. Plant Physiol. Biochem. 2021, 167, 309–320. [Google Scholar] [CrossRef]
  50. Zuo, Z.; Sun, L.; Wang, T.; Miao, P.; Zhu, X.; Liu, S.; Song, F.; Mao, H.; Li, X. Melatonin improves the photosynthetic carbon assimilation and antioxidant capacity in wheat exposed to nano-ZnO stress. Molecules 2017, 22, 1727. [Google Scholar] [CrossRef]
  51. Uma, S.; Karthic, R.; Kalpana, S.; Backiyarani, S. A comparative assessment of photosynthetic pigments and defense enzymes in ex vitro and in vitro propagated plants of banana (Musa spp.). Biocatal. Agric. Biotechnol. 2023, 51, 102799. [Google Scholar] [CrossRef]
  52. Zhao, H.; Su, T.; Huo, L.; Wei, H.; Jiang, Y.; Xu, L.; Ma, F. Unveiling the mechanism of melatonin impacts on maize seedling growth: Sugar metabolism as a case. J. Pineal Res. 2015, 59, 255–266. [Google Scholar] [CrossRef]
  53. Wang, K.; Xing, Q.; Ahammed, G.J.; Zhou, J. Functions and prospects of melatonin in plant growth, yield, and quality. J. Exp. bot. 2022, 73, 5928–5946. [Google Scholar] [CrossRef]
  54. Aparecido, L.M.T.; Woo, S.; Suazo, C.; Hultine, K.R.; Blonder, B. High water use in desert plants exposed to extreme heat. Ecol. Lett. 2020, 23, 1189–1200. [Google Scholar] [CrossRef] [PubMed]
  55. Slot, M.; Garcia, M.N.; Winter, K. Temperature response of CO2 exchange in three tropical tree species. Funct. Plant Biolog. 2016, 43, 468–478. [Google Scholar] [CrossRef] [PubMed]
  56. Xu, X. Effects of exogenous melatonin on physiological response of cucumber seedlings under high temperature stress. Master’s Thesis, Northwest A&F University, Xianyang, China, 2010. [Google Scholar]
  57. Kaur, K.; Asthir, B. Regulation of polyphenol catabolism in amelioration of high-temperature stress vis-a-vis antioxidant defense system in wheat. Cereal Res. Commun. 2022, 50, 987–998. [Google Scholar] [CrossRef]
  58. Li, Z.; Zhang, S.; Xue, J.; Mu, B.; Song, H.; Liu, Y. Exogenous melatonin treatment induces disease resistance against botrytis cinerea on post-harvest grapes by activating defence. Foods 2022, 11, 2231. [Google Scholar] [CrossRef]
  59. Dawood, M.G.; El-Awadi, M.E. Alleviation of salinity stress on Vicia faba L. plants via seed priming with melatonin. Acta Biol. Colomb. 2015, 20, 223–235. [Google Scholar] [CrossRef]
  60. Arnao, M.B.; Hernandez-Ruiz, J. Melatonin in flowering, fruit set and fruit ripening. Plant Reprod. 2020, 33, 77–87. [Google Scholar] [CrossRef]
  61. Yu, Y.; Qiu, H.; Wang, H.; Wang, C.; He, C.; Xu, M.; Zhang, W.; Zhang, W.; Zhang, Z.; Su, L. Melatonin improves saponin biosynthesis and primary root growth in Psammosilene tunicoides hairy roots through multiple hormonal signaling and transcriptional pathwanys. Ind. Crops Prod. 2023, 200, 116819. [Google Scholar] [CrossRef]
  62. Kuljanabhagavad, T.; Thongphasuk, P.; Chamulitrat, W.; Wink, M. Triterpene saponins from Chenopodium quinoa Willd. Phytochemistry 2008, 69, 1919–1926. [Google Scholar] [CrossRef]
  63. Mastebroek, H.D.; Limburg, H.; Gilles, T.; Marvin, H.J.P. Occurrence of sapogenins in leaves and seeds of quinoa (Chenopodium quinoa Willd.). J. Sci. Food Agric. 2000, 80, 152–156. [Google Scholar] [CrossRef]
Figure 1. Experimental cultivation of quinoa. (a) Quinoa seedlings in a greenhouse; (b) cultivation of quinoa in a climate chamber in the laboratory.
Agronomy 15 01556 g001
Figure 2. Changes in photosynthetic pigments in three quinoa leaves exposed to different temperatures. CK was defined as 25/15 °C day/night temperatures and a 14/10 h photoperiod with distilled water spray; MT0 treatment was conducted under 35/25 °C day/night temperatures and a 14/10 h photoperiod with distilled water spray; RQ, BQ, and WQ represented three quinoa varieties. (a) Chl a; (b) Chl b; (c) carotenoid; (d) Chl (a + b); (e) Chl a/b. Lowercase letters (a, b, c…; g, h, i…; x, y, z…) denoted statistical differences in temperature level in each variety (p < 0.05), and uppercase letters (A, B, C…) denoted statistical differences for pairwise comparisons of the means across different varieties (p < 0.05).
Agronomy 15 01556 g002
Figure 3. Secondary metabolism changes in quinoa with different temperature treatments. (a) Total polyphenols, (b) flavonoids, (c) anthocyanin, (d) saponin, and (e) PPO. CK (control) was defined as 25/15 °C day/night temperatures and a 14/10 h photoperiod with distilled water spray; MT0 treatment was conducted under 35/25 °C day/night temperatures and a 14/10 h photoperiod with distilled water spray; RQ, BQ, and WQ represented three quinoa varieties. Lowercase letters (a, b, c…; g, h, i…; x, y, z…) denoted statistical differences in temperature level in each variety (p < 0.05), and uppercase letters (A, B, C…) denoted statistical differences in pairwise comparisons of the means across different varieties (p < 0.05).
Agronomy 15 01556 g003
Figure 4. Changes in photosynthetic parameters of quinoa leaves under different temperature treatments. (a) Net photosynthetic rate (Pn), (b) stomatal conductance (gs), (c) transpiration rate (Tr), (d) intercellular CO2 concentration (Ci), and (e) water use efficiency (WUE). The three quinoa cultivars are RQ, BQ, and WQ. CK represented the control conditions for each cultivar at 25/15 °C with distilled water spraying, and MT0 represented the conditions for each cultivar at 35/25 °C without melatonin replaced by distilled water. Lowercase letters (a, b, c…; g, h, i…; x, y, z…) denote statistical differences in temperature level in each variety (p < 0.05), and uppercase letters (A, B, C….) denoted statistical differences in pairwise comparisons of the means across different varieties (p < 0.05).
Agronomy 15 01556 g004
Figure 5. Changes in photosynthetic pigments in three quinoa leaves with different levels of MT foliar spraying (p < 0.05). The MT0, MT50, MT100, and MT200 groups were maintained under day/night temperatures of 35/25 °C, with distilled water, 50, 100, and 200 µmol L−1 MT spraying. RQ, BQ, and WQ represent the three quinoa varieties. (a) Chl a; (b) Chl b; (c) carotenoid; (d) Chl (a + b); (e) Chl a/b. Lowercase letters (a, b, c…; g, h, i…; x, y, z…) denote statistical differences in temperature level in each variety (p < 0.05), and uppercase letters (A, B, C…) denoted statistical differences in pairwise comparisons of the means across different varieties (p < 0.05).
Agronomy 15 01556 g005
Figure 6. Effect of high temperature and MT on polyphenol content. The three quinoa cultivars are RQ, BQ, and WQ. MT0, MT50, MT100, and MT200 represented the conditions for each cultivar at 35/25 °C with melatonin concentration of 0, 50, 100, and 200 μmol L−1, respectively. (a) total polyphenol; (b) flavonoid; (c) anthocyanin; (d) saponin; (e) PPO. Lowercase letters (a, b, c…; g, h, i…; x, y, z…) denote statistical differences in temperature level in each variety (p < 0.05), and uppercase letters (A, B, C…) denoted statistical differences in pairwise comparisons of the means across different varieties (p < 0.05).
Agronomy 15 01556 g006aAgronomy 15 01556 g006b
Figure 7. Impacts of cultivar and MT spraying treatments on the gas exchange parameters of quinoa cultivars. (a) Net photosynthetic rate (Pn), (b) stomatal conductance (gs), (c) transpiration rate (Tr), (d) intercellular CO2 concentration (Ci), and (e) water use efficiency (WUE). The three quinoa cultivars are RQ, BQ, and WQ. MT0, MT50, MT100, and MT200 represented the conditions for each cultivar at 35/25 °C with melatonin concentrations of 0, 50, 100, and 200 μ mol L−1. Lowercase letters (a, b, c...; g, h, i….; x, y, z….) denote statistical differences in temperature level in each variety (p < 0.05), and uppercase letters (A, B, C….) denoted statistical differences in pairwise comparisons of the means across different varieties (p < 0.05).
Agronomy 15 01556 g007
Figure 8. Correlation analysis of the photosynthetic parameters and some biochemical traits of quinoa cultivars sprayed with MT and exposed to high temperatures. Based on the Pearson correlation coefficient, within each cell, absolute values closer to 1 are represented by a deep red/deep blue color, while absolute values closer to 0 are represented by a light pink/light blue or white color. * denoted significant differences at p ≤ 0.05 and ** denoted significant differences at p ≤ 0.01.
Agronomy 15 01556 g008
Table 1. Impacts of cultivar and temperature levels on photosynthetic pigments in quinoa leaves.
Two-Way ANOVA of Cultivar Level and Temperature Level (p < 0.05)
TEMCultivarTEM × Cultivar
PartTraitd.f.Fpd.f.Fpd.f.Fp
MetaboliteChl a142.333p < 0.00127.5900.03237.065p < 0.001
Chl b123.831p < 0.001217.128p < 0.001230.501p < 0.001
Carotenoid143.316p < 0.00129.3230.001259.504p < 0.001
Chl (a + b)160.762p < 0.001213.047p < 0.001258.675p < 0.001
Chl a/b10.2320.63223.2980.5420.1100.897
Total polyphenols1492.445p < 0.001292.488p < 0.001279.721p < 0.001
Flavonoids1165.502p < 0.0012233.437p < 0.0012113.377p < 0.001
Anthocyanin14.8870.0372191.405p < 0.001210.2880.001
Saponin11.7720.19624.1150.029225.394p < 0.001
PPO1547.419p < 0.0012114.264p < 0.001256.858p < 0.001
Gas exchangesPn11413.01p < 0.0012889.563p < 0.0012120.800p < 0.001
gs1664.174p < 0.001251.758p < 0.0012100.104p < 0.001
Tr1619.071p < 0.001247.159p < 0.0012111.985p < 0.001
Ci128.242p < 0.001225.221p < 0.00123.5500.045
WUE143.277p < 0.001276.739p < 0.00129.4950.001
Note: p-values in the same column indicate statistical significance at p < 0.05, according to ANOVA analysis. Data were means of five replicates per treatment; TEM represents temperature.
Table 2. Impacts of cultivar and MT levels on photosynthesis and metabolites in quinoa leaves exposed to heat stress.
Two-Way ANOVA of MT and Cultivar (p < 0.05)
MTCultivarMT × Cultivar
PartTraitd.f.Fpd.f.Fpd.f.Fp
MetaboliteChl a215.654p < 0.001317.884p < 0.001612.224p < 0.001
Chl b210.869p < 0.001322.390p < 0.00165.575p < 0.001
Carotenoid212.712p < 0.001322.105p < 0.001613.790p < 0.001
Chl (a + b)225.975p < 0.001333.621p < 0.001617.763p < 0.001
Chl a/b20.3280.80535.0370.0161.1710.337
Total polyphenols224.150p < 0.00137.999p < 0.001626.185p < 0.001
Flavonoids210.374p < 0.0013649.204p < 0.001631.719p < 0.001
Anthocyanin29.085p < 0.001350.873p < 0.001625.795p < 0.001
Saponin22.662p < 0.001321.4010.05864.709p < 0.001
PPO2352.764p < 0.0013663.052p < 0.001630.043p < 0.001
Gas exchangesPn254.819p < 0.0013525.684p < 0.001646.833p < 0.001
gs217.545p < 0.0013133.390p < 0.001618.592p < 0.001
Tr215.181p < 0.0013214.785p < 0.001678.451p < 0.001
Ci268.464p < 0.00134.8480.012617.124p < 0.001
WUE285.541p < 0.001322.398p < 0.001641.527p < 0.001
Note: p values in the same column indicate statistical significance at p < 0.05, according to ANOVA analysis. Data were means of five replicates per treatment; MT was melatonin.
Disclaimer/Publisher’s Note: The statements, opinions and data contained in all publications are solely those of the individual author(s) and contributor(s) and not of MDPI and/or the editor(s). MDPI and/or the editor(s) disclaim responsibility for any injury to people or property resulting from any ideas, methods, instructions or products referred to in the content.

