Article

Putative Second-Site Mutations in the Barley Low Phytic Acid 1-1 (lpa 1-1) Genetic Background Further Reduce Seed Total Phosphorus

by
Beverly L. Agesa
1,†,
Victor Raboy
2,
Paul J. A. Withers
3 and
Katherine A. Steele
1,*
1
School of Natural and Environmental Sciences, Bangor University, Bangor LL57 2UW, UK
2
US Department of Agriculture (USDA), Agricultural Research Service (ARS), Portland, OR 97223, USA
3
Lancaster Environment Centre, University of Lancaster, Lancaster LA1 4YQ, UK
*
Author to whom correspondence should be addressed.
Current address: The Alliance of Bioversity and CIAT Arusha, P.O. Box 2704, Dodoma Road, Arusha, Tanzania.
Agronomy 2025, 15(7), 1550; https://doi.org/10.3390/agronomy15071550
Submission received: 29 April 2025 / Revised: 20 May 2025 / Accepted: 23 June 2025 / Published: 25 June 2025

Abstract

Inefficient crop phosphorus (P) use impacts global food security and P fertilizer use can be environmentally harmful. Lines homozygous for barley (Hordeum vulgare L.) low phytic acid 1-1 (lpa 1-1) have yields equivalent to the wild type but ~15% less seed Total P (TP). The objective here was to identify second-site mutations in the lpa1-1 background that condition a further reduction in seed TP, again with little impact on yield. A chemically mutagenized population was derived from lpa 1-1 and screened to identify lines with seed TP reductions greater than 15% (as compared with wild-type) but with seed weights per plant within 80% of wild-type. Three M4 lines were selected and evaluated in a greenhouse pot experiment. Plants were grown to maturity either on a soil with low soil P fertility (16 to 25 mg Olsen P L−1; Soil P Index 1) or with that soil supplemented (36 kg P ha−1) to provide optimal available soil P. Mean seed P reduction across the three lines and two soil P levels was 28%, a near doubling of the lpa1-1 seed Total P reduction. When grown with optimal soil available P, no impact of these putative mutations on grain yield was observed. These findings suggest that the three lpa 1-1-derived mutant lines carry second-site mutations conferring substantially (~17%) greater decreases in seed TP than that conferred by lpa 1-1. If the putative mutations are confirmed to be heritable and to have negligible impact on yield, they could be used in breeding P-efficient barley cultivars as a step towards reducing regional and global P demand.

1. Introduction

Phosphorus (P) is stored in seeds in the form of phytic acid (PA, myo-inositol-1,2,3,4,5,6-hexkisphosphate) and utilized during the first stage of germination to produce the radicle through which the plant subsequently takes up P from the soil [1,2]. The total amount of P taken up by crops and stored as phytic acid is positively correlated with P supply during crop growth [3]. Subsequent removal of P from fields following crop harvest is a key factor determining P fertilizer demand the world over [4]. The majority of annual crops typically take up only 10–15% of applied P fertilizer [5]. In developed countries, this P inefficiency has led to a system of insurance-based farming that relies on over-applying P fertilizers to build up high soil P fertility, but one which has greatly increased the transfer of soil P to water bodies causing endemic global eutrophication [6,7]. Conversely in low- and middle-income countries, this P inefficiency is restricting crop production because smallholder farmers do not have the financial resources to buy the large amounts of fertilizers needed to build up necessary soil P fertility on old P-fixing soils [8]. Solutions to tackling this P inefficiency are therefore needed at both ends of this farming spectrum, and with greater global P fertilizer demand for expanding grain production, the need to manage P more sustainably within agricultural systems has become a global priority [9].
Crop genetic approaches offer a potential route to maintaining or improving crop yields with reduced fertilizer P inputs achieved either via a lower soil P supply or using less applied P [10]. One of several concepts for improving crop phosphorus use efficiency (PUE) is through the selection of genetic variants that result in more efficient P absorption, transportation or internal utilization by plants [11,12]. Since P fertilizer inputs are directly linked to crop P offtake, genetic selection of P-efficient crops is a fundamental strategy for reducing fertilizer P demand. Lower grain P content in animal feed and food will help to reduce the excretal P loading on soils from manures that is exacerbating water P pollution [13], and lowering grain PA content will increase the bioavailability of important micronutrients including iron, calcium, and zinc in the human diet [14,15]. Reduced seed PA and reduced seed TP are therefore two seed traits of potential importance for enhancing both agricultural and environmental sustainability and biofortification through improved nutritional quality of grains [15].
Genetic screening for mutations that specifically impact seed PA, referred to here as low phytic acid (lpa) genotypes, has provided resources for study and potentially for breeding [2]. Typically, the reduction in seed PA in lpa genotypes is largely matched by an increase in inorganic P such that there is little or no effect on seed TP [2]. These mutations block the ability of a seed to synthesize or accumulate P as PA P rather than the ability of the plant to take up P and transport it to a developing seed [2].
Lpa mutations were initially isolated in several of the world’s most important grain crops, including maize (Zea mays L), rice (Oryza sativa L.), wheat (Triticum aestivum L.), and barley (Hordeum vulgare L.) [2,16]. In terms of production, barley is the fourth most important grain crop worldwide, following maize, rice, and wheat. Its production is particularly important in regions with marginal or dry environments, serving as a key source of nutrition and resilience for farmers [17]. Barley is also an important crop due to its diverse uses, including food, animal feed, and brewing. Finally, barley is also a valuable model plant for research in plant genetics and other related fields.
Barley lpa genotypes were originally isolated following chemical mutagenesis of the spring-sown cultivar ‘Harrington’, a seed which contains wild-type levels of TP and PA P. In the Harrington parental materials that were used for screening, the seed contained 4.77 mg g−1 seed TP of which 61%, or 2.89 mg g−1, is PAP [18]. Screening for the “high inorganic P” phenotype associated with lpa mutants in populations derived from Harrington identified lpa mutant lines with reductions in PA compared to Harrington ranging from 50% to >90%. A mutation conditioning a >75% reduction in PA as compared to Harrington had a more substantial impact on seed viability, plant growth and other functions leading to yield reductions, especially in more stressful production environments, as compared with those conditioning lesser reductions [19]. Alleles resulting in PA reductions of up to 75% compared to Harrington have been used to breed cultivars with little or no yield penalty [20,21].
Barley lpa 1-1 was the first exception to the rule that lpa mutations typically do not affect seed TP because in lpa 1-1 reduction in seed PA was accompanied by reduced seed TP [18]. Compared to Harrington, lpa 1-1 has up to a 15% reduction in seed TP concentration with no yield penalty [19]. This reduction in seed TP has been demonstrated to be a seed-specific trait not dependent on the maternal plant’s genotype and furthermore the reduction in seed TP is endosperm-specific [3]. The lpa 1-1 trait has also been demonstrated to be due to a recessive mutation in a single gene mapping to chromosome 2H [22]. The mutation conditioning the phenotype of barley lpa 1-1 was subsequently found to be a nonsense mutation in a member of a sulfate transporter gene family termed HvST (Hordeum vulgare Sulfate Transporter) [23]. The knockout of the rice ortholog of this gene was shown to produce a similar lpa/low seed TP phenotype [24].
Barley lpa 1-1 provides proof of principal that a seed chemistry phenotype with both low TP and low PA is achievable, however further reductions in seed TP would be desirable. Second-site mutations (either extragenic or intragenic) might enhance the phenotypic effects of the original mutation. In this study, a mutagenized population derived from the homozygous lpa 1-1 line was screened for novel second-site mutation events that condition seed TP reductions greater than that observed in lpa 1-1. Stable lines with the greatest reductions in TP were selected and evaluated in a pot experiment to determine the effect of genotype and P supply on the uptake of P within the plant.

2. Materials and Methods

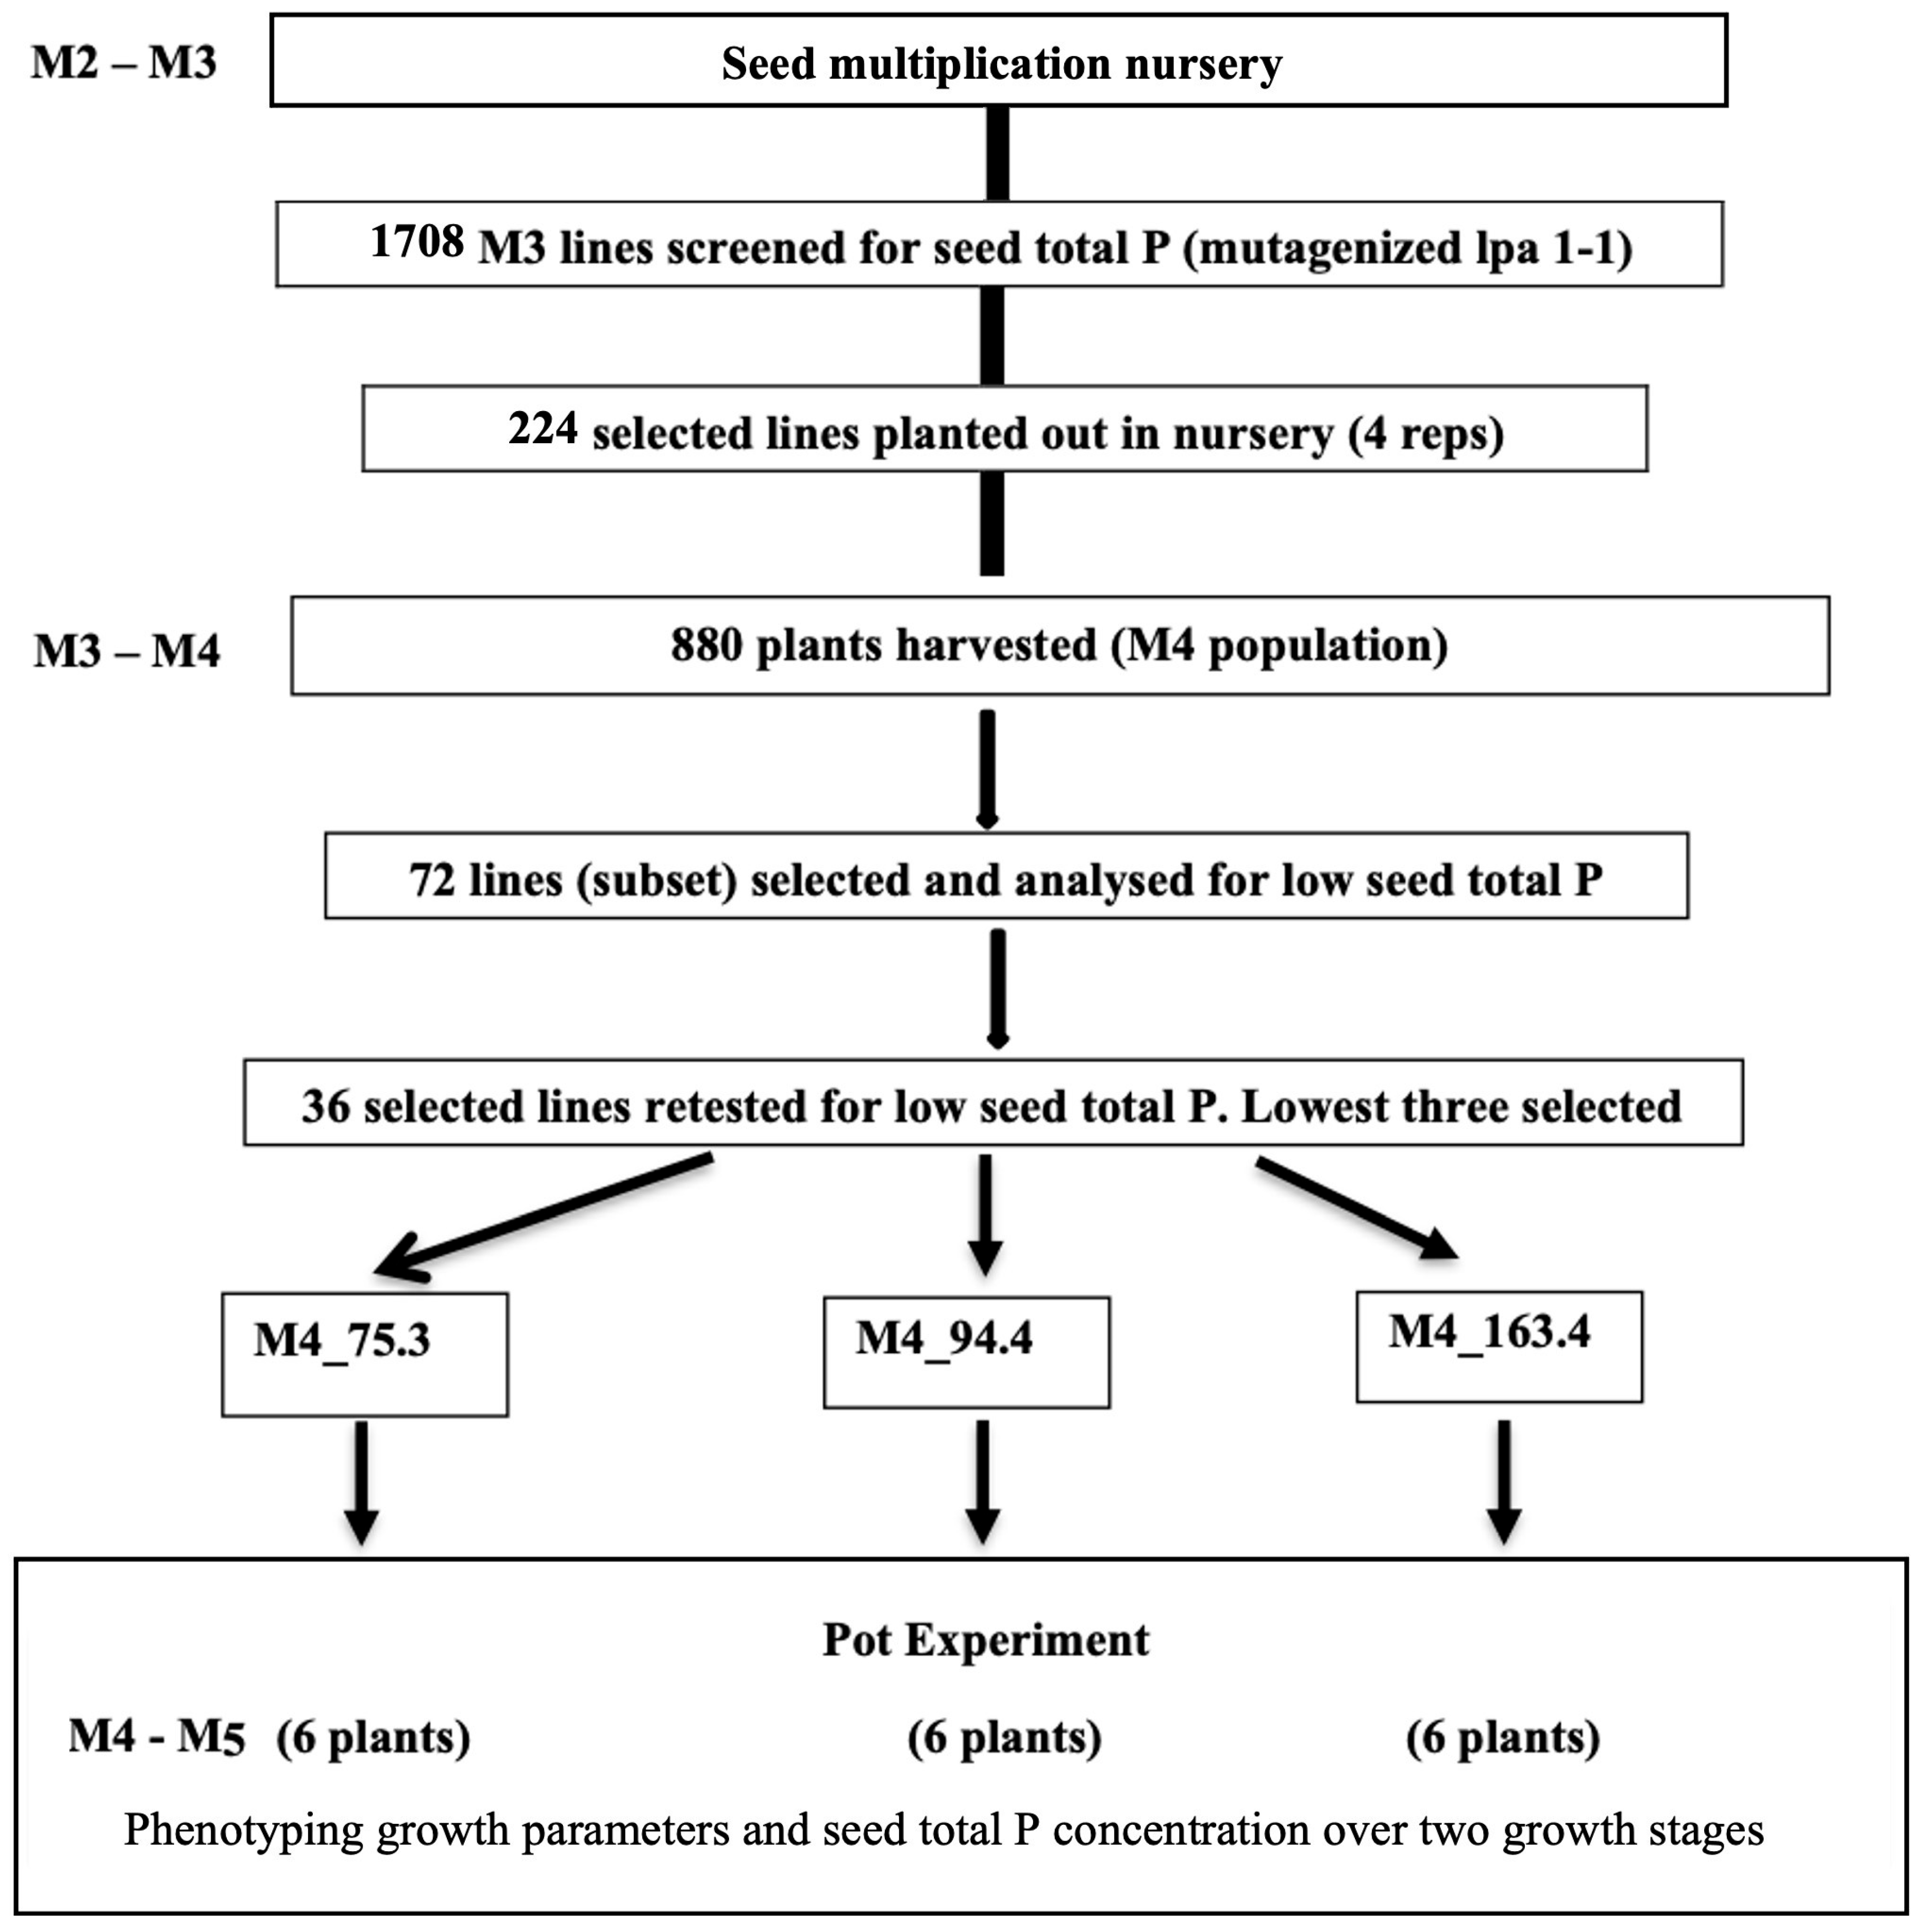
2.1. Overview of Screening Approach and Testing of Events of Interest

Using a sodium azide seed treatment method [25], an M2 population was generated containing random mutations in a cv. Harrington line homozygous for lpa 1-1. The screening was performed over two generations (Figure 1); to generate a population of M3 seed progenies, M2 seed were planted with appropriate controls (cv. Harrington and a cv. Harrington homozygous for lpa1-1) in a field nursery field (Aberdeen, ID, USA). A total of 1708 M3 progenies produced by these M2s were screened for seed TP using the wet-ashing method (see below). Lines with seed TP values ≤ 3.1 mg g−1 were re-sampled from the available seed and re-tested for seed TP. A subset of 224 progenies was selected and, along with controls, used to plant a second nursery. The M4 seed produced in the second nursery by this subset was then again screened for seed TP. Putative events of interest were selected based on three criteria: that they produced seed with TP concentrations (mg TP g1) or TP contents per seed (μg TP seed1), that they were at least two standard deviations less than the M3 population means and that they had seed weights between 30 and 55 mg seed1. Three lines with putative events of interest were identified from this subset and evaluated in a subsequent greenhouse experiment.
The 224 selected M3 lines were hand planted alongside ten entries of each of the parental control lines Harrington and lpa 1-1 (each entry consisting of 5 seeds from each line in 2 randomized complete blocks) in a field nursery with DeA Declo loam soil (Aberdeen, ID, USA) in May 2017, in rows of 71 cm with 5 plants, spaced 36 cm apart. The nursery was fertilized with N, 37 kg ha1; P2O5, 178 kg ha1; Zinc 11 kg ha1 and irrigated when necessary during the growing season. The fields were maintained free of weeds and managed according to standard practices. Lines that clearly displayed stunted, chlorotic or reduced plant growth were rejected from further analysis. At maturity, the seed was harvested using a single-plant thresher.
First, M4 seeds from one of the four plants from each of two replicates per M3 line were screened for seed TP concentration. This identified an initial 18 putative mutant lines which appeared to have reduced seed TP as compared with the lpa 1-1 parent. For each of these 18 lines, the seed from the additional three plants from one replicate were then tested for seed TP (giving data for 72 plants in total). Based on the data for these 18 lines, individuals from three M3 lines (75.3, 94.4, and 163.4), representing one each from three M3 lines which appeared to produce seed with the lowest mean seed TP, were selected for further study in subsequent generations.

2.2. Experiment to Test P Uptake by Barley Mutants (M5)

The three selected barley mutant lines (75.3, 94.4 and 163.4) and two controls (Harrington and the original lpa 1-1 mutant) were grown in 2 L (11 cm diameter) pots filled with air dry, sieved, sandy soil with low soil P fertility according to the soil P classification system used in England and Wales (soil P Index 1 [26], pH 5.8) and weighing approximately 1.61 kg. One M4 seedling was established per pot, and each received 0.295 g of Nitrogen (N) and 0.16 g Potassium (K) at planting, 0.045 g Magnesium (Mg) and 0.045 g Sulfur (S) at 33 days after sowing (DAS), and a second application of 0.295 g N at the three-leaf stage. Two treatments of Hoagland’s nutrient solution [27] were compared: nutrient solution with no added P (no nutrient P) and nutrient solution with added P (0.15 g potassium hydrogen phosphate per pot, equivalent to 36 kg P ha-1 as recommended [26] for a P Index 1 soil). Plant P uptake was sampled at 40 DAS (flag leaf stage) and 92 DAS (harvest stage). The 60 pot, completely randomized design experiment (5 genotypes × 2 nutrient P × 3 replicates × 2 sampling stages) was conducted in a 20 °C temperature-controlled glasshouse, with no supplementary lighting, at Henfaes Research Centre, UK (53°14′20.4″ N 4°01′12.0″ W). The pots were watered with tap water every 2–3 days.
Plants were destructively sampled at 40 days after sowing (DAS) and 92 DAS. The roots were washed free of soil, and whole plants were weighed to determine fresh weight, then dried at 70 °C for 72 h and weighed again for dry weight. Dried plants were separated into roots, leaves and ears were also separated for 92 DAS samples. Root and shoot samples were re-dried at 70 °C for 72 h before weighing. Seed dry weight was determined on M5 seeds separated from the ears after drying using a hand seed thresher. TP analysis of the root, shoot and grain (M5) samples were analyzed.

2.3. TP and PA Analysis of Vegetative and Grain Tissue

For TP analysis in vegetative and grain tissues, samples (50 mg) were wet-ashed and then digests were analyzed for P using a colorimetric assay [28]. A Megazyme K-PHYT kit was used for PA determination (K-PHYT, Megazyme International, Wicklow, Ireland). Milled grain (1 g per replicate sample) was analyzed following the manufacturer’s instructions. The Megazyme K-PHYT approach measures inorganic P released from PA with the assumption that the amount of P measured is exclusively released from PA and that this comprises 28.2% of PA.

2.4. Data Analysis

P uptake, Physiological Efficiency (PE), Agronomic Efficiency (AE), crop recovery, and Yield Response (YR) were calculated using previously published formulae (Table 1).
Statistical analyses were performed using generalized linear models from the LME4 package available in the R statistical packages version 3.5.2 [31]. Shapiro’s test was used to determine normality of the data at each sampling stage. The effect of the different P supply treatments and the five test genotypes on plant P content and P uptake at each sampling stage was determined by analysis of variance (ANOVA). The independent variables were five barley genotypes and the two nutrient P levels (added and no added P) while the dependent variables included dry weight (shoot, root, grain), P concentration (shoot, root, grain), and P uptake (shoot, root, grain), and grain PA. Tukey’s HSD post hoc test was used for multiple comparison between sample means where ANOVA F statistics were significant at p < 0.05 unless otherwise stated.

3. Results

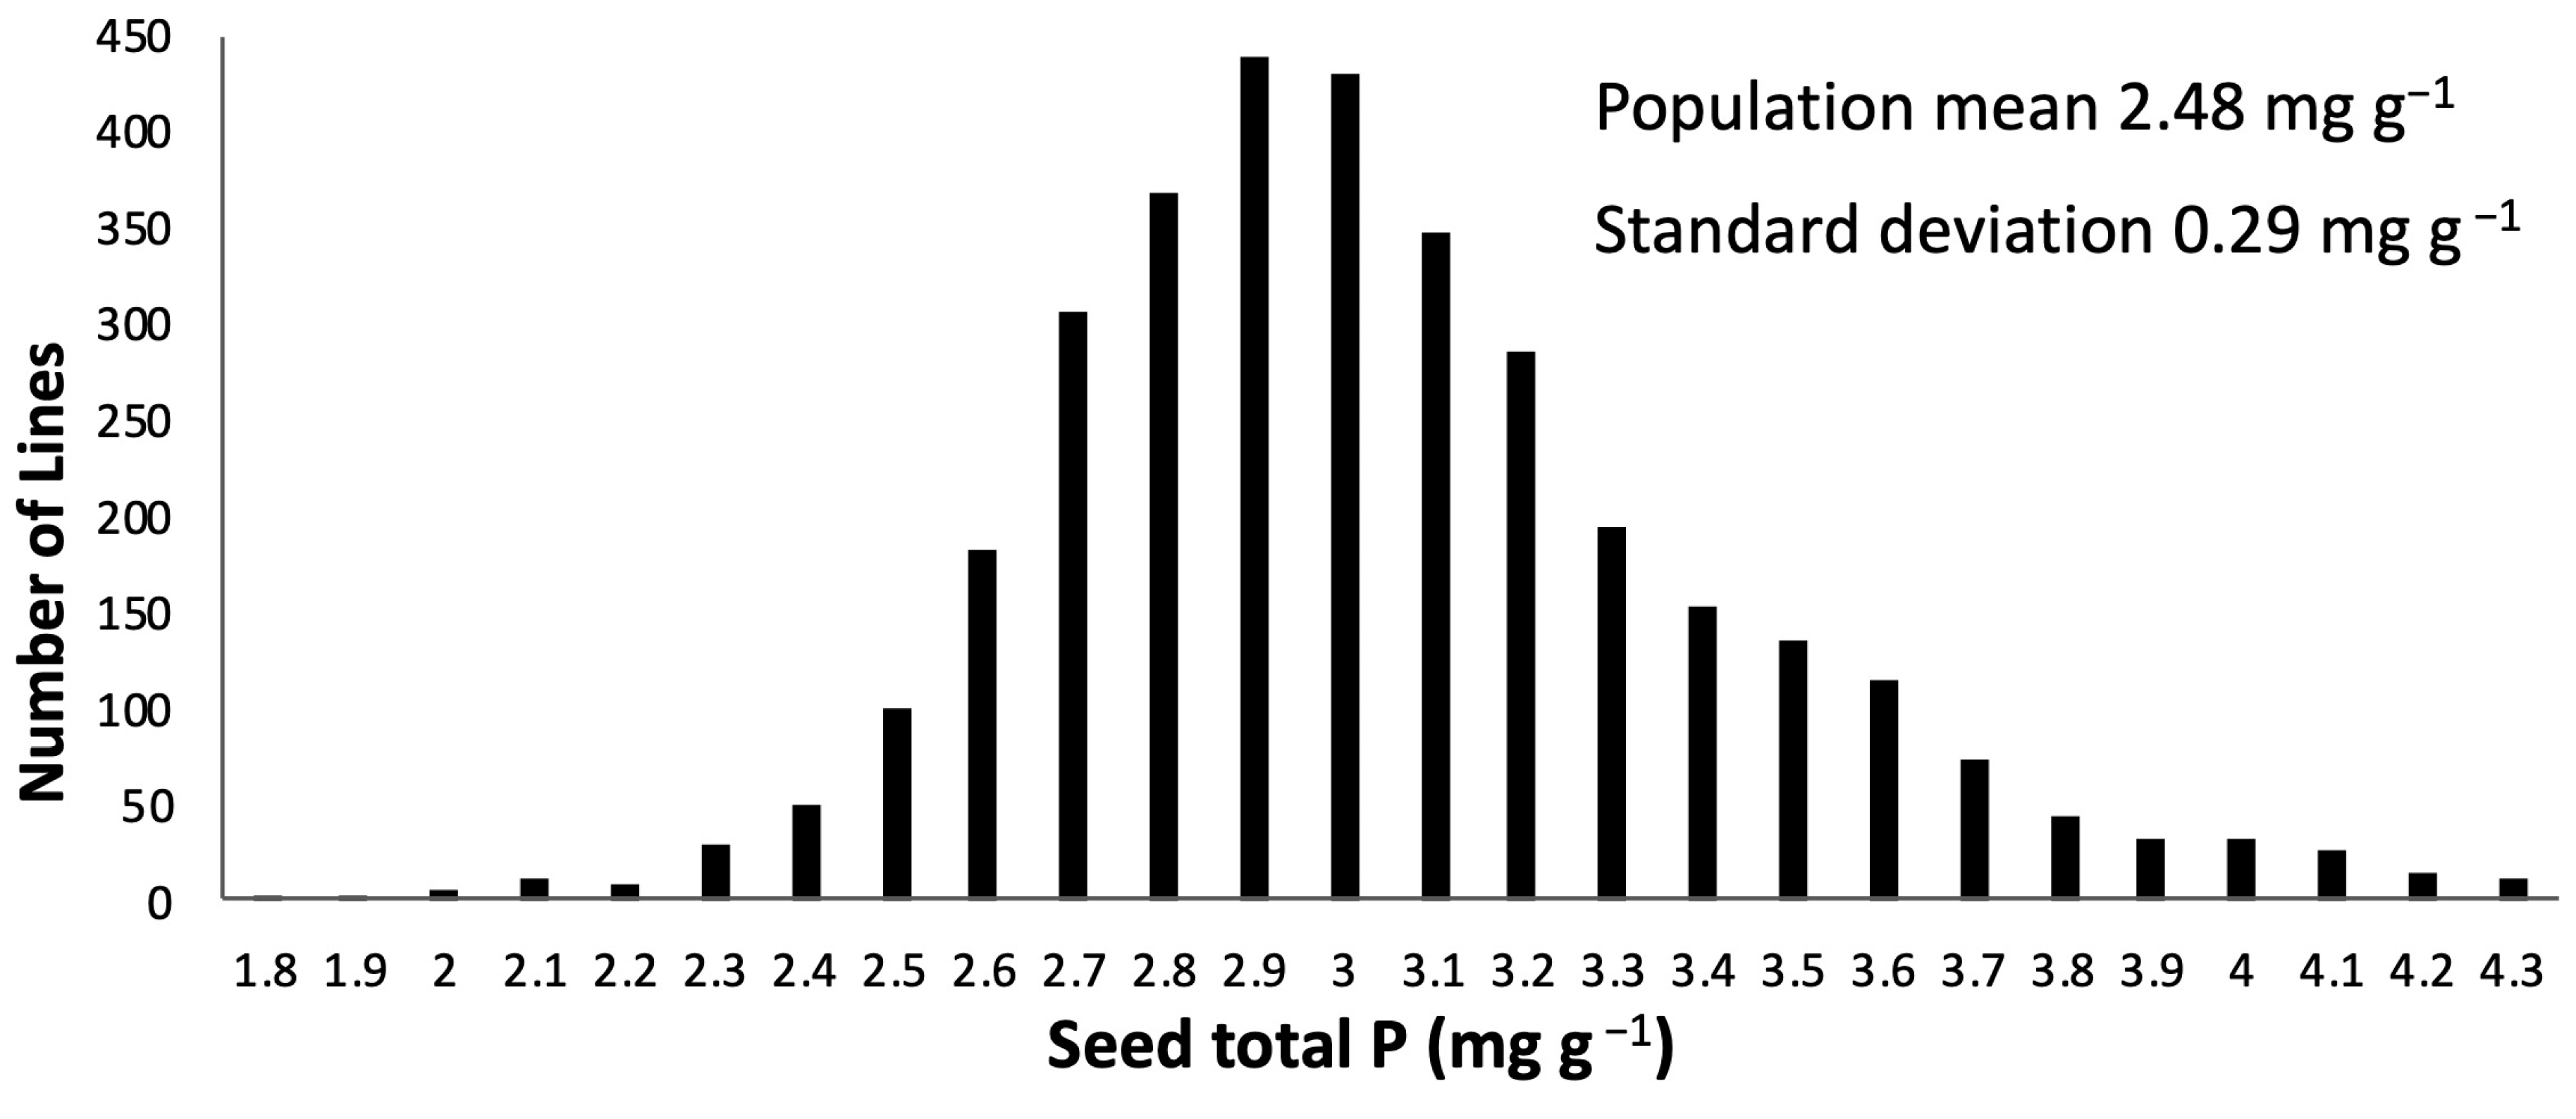
3.1. Selection for Low Seed TP in M3-M4 lpa 1-1 Barley

Seed TP concentration in the 1708 screened M3 lines (Figure 2) appeared to represent a normal distribution between 1.9 and 4.2 mg g−1, as compared with the mean seed total P concentration of the lpa 1-1 (3.2 mg g−1) and Harrington (4.1 mg g−1) controls (Figure 2). This normal distribution indicates that seed TP is a multi-genic, quantitative trait with variation contributed by several loci. The challenge was to identify single-gene effects, conditioned by novel induced mutations, that result in reduced seed total P as compared with lpa 1-1. To do so, from within this M3 generation a subset of 224 putative low seed TP lines were selected based on the criteria described in the Materials and Methods. This subset had a mean seed TP of 2.50 mg g−1 (Table 2).
To identify those M3’s that appeared to have heritable mutations that condition reduced seed TP, as compared with the lpa 1-1 control, this subset of 224 lines were planted in a second, follow-up nursery and the seed produced from 219 lines was analyzed for seed TP. Seed TP concentration of grains harvested from one replicate of each of the mature M4 lines was in the range 2.4–4.9 mg g1 and a mean seed TP of 3.54 ± 0.029 mg g1: Sixty-six percent of this population had <3.7 mg g1 and 43% < 3.5 mg g1 seed TP.
Eighteen lines with the lowest TP values were selected for grain analysis. These 72 M4 plants (four plants from a single replicate of each of the 18 lines) had TP concentrations in the range 1.2–3.6 mg g1 with a mean of 3.13 ± 0.040 seed TP and there was no significant difference between the 18 M3 lines for TP per seed or seed weight. There was a difference for seed P concentration (p = 0.002).
As a result of these analyses, three lines were selected for further study. These were numbered 75.1, 94.4, and 163.3, and represented direct descendants of three plants in the 2013 M3 nursery that were (Row-Plant) 191-21, 182-12, and 203-23 (respectively). These three M4 lines were the progeny of the three M3 lines with the lowest mean seed TP, and had TP values as follows: lpa 75.3, mean 2.98 ± 0.32; lpa 94.4, mean 3.00 ± 0.26; lpa 163.4 mean 2.65 ± 0.97. Seed weight was lowest in 94.4 (24.8 ± 3.95 mg) but 75.3 and 163.4 were in the top four of the 18 selected M3 lines for seed weight (43.8 ± 3.95 mg and 45.5 ± 3.32 mg, respectively).

3.2. Seed TP, PA and Seed Weight of Three Putative Second-Site lpa Mutants in the M5 Generation

In the pot experiment using M5-generation progeny grown with contrasting P treatments, there was no significant effect of P treatment on seed TP and PA concentration or seed weight, but there was a significant interaction between P treatment and genotype for seed weight and consequently single seed P content (Table 3). The reduction in seed TP observed in lpa 1-1 seed as compared with Harrington, ranging from 12% to 16% (in the no added P and added P treatments, respectively), was similar to that observed in previous studies [18,19]. Within-M5 line variation for TP for the different M4 mutants was consistent with the variation within the inbred lines (lpa 1-1 and Harrington) used as controls (Table 2). In contrast, seed TP concentration was significantly lower in the three novel lpa mutant genotypes (p < 0.05) compared to both lpa 1-1 (by 11–19%) and Harrington (by 26–30%) (Table 3). There was also a significant genetic effect on PA content (p < 0.05) with lpa 1-1 and the three novel lpa mutants all having less PA than Harrington (Table 3). Reduced seed PA was observed in the three novel mutants compared with lpa 1-1 (on average they had 36% less with no added P and 23% less with added P), although this was not statistically significantly different. When compared with Harrington the three mutants had on average 66% lower PA in both P treatments.
When plants were grown with no added P, the single seed weight of lpa 163.4 did not differ significantly from that of Harrington and lpa 1-1. However single seed weights of lpa 94.4 and lpa 75.3 were greater (~17%) than either Harrington or lpa1-1. In contrast, when plants were grown with added P, single seed weights of all three putative mutations were reduced as compared with both Harrington and lpa 1-1. These reductions ranged from 28% (lpa 75.3 as compared with Harrington) to 13% (lpa 163.4 as compared with Harrington) (Table 3).

3.3. P Uptake and Utilization Efficiency in Three Novel lpa M4 Mutants

When grown either on the P Index 1 sandy soil without supplemental P, or grown with supplemental P, there was little or no observed differences in grain yield per plant between the five genotypes (Table 4). While adding P fertilizer increased the yield of all genotypes by about 33%, this did not result in any differences in yield between genotypes (Table 4). There was no effect of P treatment or genotype on phosphorus harvest index (PHI) or harvest index (HI). Grain yield per P uptake was significantly higher for all four lpa mutant lines than Harrington (Table 4) and they had better P utilization efficiency than Harrington for yield response, physiological efficiency, agronomic efficiency, and crop recovery (Table 5). Lpa 94.4 had the lowest crop recovery compared to the other four genotypes while lpa 75.3 was the most efficient among all 5 genotypes.
Added P increased both total plant dry weight and P content in all genotypes at both 40 and 90 DAS but there was no effect of genotype on shoot or total dry weight content. Root dry weight and TP content was higher in lpa 1-1 than at least the novel lpa genotypes at both 40 and 92 DAS under both P treatments (Supplementary Tables S1 and S2).
In the early growth stages at 40 DAS, the lpa mutant lines all took up more P than Harrington, but the novel lpa mutants did not respond significantly to added P where lpa 1-1 had the greatest P uptake. At 90 DAS, when data was combined for both P treatments, total plant P uptake was found to be significantly higher in both lpa 1-1 and Harrington genotypes compared to lines 94.4, 163.4, and 75.3 (Supplementary Table S3).

4. Discussion

Through screening over 1700 M3 plants derived from mutagenized lpa 1-1 seeds, this study successfully identified three lines that, when evaluated in the M5 generation, displayed a 17% reduction in seed TP as compared to the original lpa 1-1 line and a 28% reduction in TP compared to the wild-type parental cv. Harrington. A reduction in seed TP concentration of the order of 28% would represent substantial progress towards achieving optimal PUE. A target of a 20% reduction in grain TP was proposed for rice [32]. In fact, a reduction of 30% might approach biological limits for crops, considering the need to maintain acceptable productivity (reviewed in [32]. An added potential benefit is that these lines also produced seeds with 30% less PA than lpa 1-1 and 66% less PA compared to Harrington. The selected lines did not show substantial decreases in seed weight compared to lpa 1-1, suggesting they could hold agronomic value for breeding.
We observed that the three novel lpa mutants had no significant yield penalty in greenhouse pot-culture studies when grown under low P conditions or when P fertilizer was added. Follow-up field trials are required to test this apparent lack of yield penalty. This suggests that, not only has there been further reduction in both seed P concentration and PA, but the low seed TP phenotype was stably inherited with little negative pleiotropic effects. Our finding that the three novel lpa genotypes had better P utilization efficiency than Harrington may indicate a process underpinning their improved plant P efficiency that could be due to improved internal plant use of P [32].
The reductions in seed TP observed in these progenies may be conditioned by the inheritance of novel alleles at multiple genes or might be conditioned by allelic variants at a single gene whose effects in turn are either dominant, recessive, or additive. These novel mutations may represent second-site mutations which act as modifiers of lpa 1-1, and which would contribute to the low seed TP phenotype only when in a homozygous lpa 1-1 plant. Alternatively, they may condition reduced seed TP independently of lpa 1-1; that is, either in the presence or absence of lpa 1-1. An example of the latter would be a mutation that is germ-specific, since it is known that lpa 1-1 is endosperm-specific. A genetically determined reduction in germ TP could contribute to a net reduction in seed TP greater than that observed in lpa 1-1 alone. Furthermore, the effect, if heritable, may be maternal, due to some process determined by the genotype of maternal tissues, or filial, due to a process determined by the genotype of the filial tissues. An example of a possible maternal effect would be a mutation in a gene for P-transport function in the maternal plant, which is important for seed P uptake (see below).
Addressing these questions requires a series of follow-up genetic analyses. Plants representing the three putative mutants should be reciprocally crossed (used as both male and female parents) to the non-mutant parental line Harrington and also to a homozygous lpa 1-1 line, to obtain F1 seed from both crosses. That F1 seed in turn must be used to produce F2, F3, and backcross/testcross progeny. Analyses of these materials would provide answers to the above questions and allow tests of the above hypotheses. Perhaps most importantly, phenotypically analyzing these progenies would provide a further test of whether the mutations and mutant phenotypes are indeed heritable following out-crossing. In addition, these analyses would allow an excellent test of the correlation of inheritance of the mutations and reduced seed weight. Furthermore, they should be studied for a broader range of phenotypic and gene expression data, as has been carried out recently for a rice mutant for low P soil tolerance [33].
Whole genome sequencing could be used to compare the novel lpa mutants with lpa 1-1 to help identify the mutations and their underpinning genes, or sequences of targeted amplicons in candidate genes as carried out by. Metabolite profiling of these lines could reveal the effect of the mutation on metabolites such as sugars and sugar alcohols, as carried out for rice lpa lines by [34].
The HvST gene acts in P-transport processes important to PA synthesis. The disruption of HvST in lpa 1-1 does not affect the ability of a plant to take up P but rather appears to block the transport of P needed for PA synthesis in the developing seed. This results in an endosperm-specific P reduction while the P in the germ of the seed is not affected [3]. Further analysis of the novel lpa mutants therefore must analyze split-grains so that the endosperm component and the germ component can each be tested for TP separately.
The HvST gene is orthologous to the rice gene sulfate transporter gene, OsSULTR3;3, which, when mutated, affects TP concentrations in both shoots and roots and it may play a role in crosstalk between the nutrients P and S [35]. Mutations in OsSULTR3;3 give lower seed TP and PA concentrations, increase root and leaf P and Pi concentrations but decrease root and leaf sulfate concentration in comparison to their corresponding wild-type parents [36]. Developing seeds of this rice mutant had altered expression of genes coding for the last steps in PA synthesis. Dramatic changes in the expression of several genes involved in P signaling and homeostasis, as well as redistribution of endosperm Pi and reduced lysophospholipid were also observed in another rice mutation of the same gene [37]. A different gene underpins the Sang-gol rice lpa mutant, which is involved in the PA biosynthetic pathway [38] and codes for a kinase protein whose precursor strongly inhibit polyphosphatase 5-phosphatases. The mutation may remove this inhibition of polyphosphate intermediates, leading to reduced PA in the mutant.

5. Conclusions

Improved sustainability and reduced environmental impact of P use within agricultural systems has become a global research priority. As a contribution to this effort, three barley mutant lines were identified that produce grain with up to 28% less total P than their non-mutant progenitor and do so with little apparent effect on productivity. Pending confirmation via follow-up inheritance studies and field trials, these genotypes could be of value for breeding barley cultivars with enhanced P use efficiency. If used widely, this could reduce the amount of P fertilizers used in agricultural systems [6]. They could also be used for the development of low phytate barley feed and food grains to improve efficiency of P management in livestock production, reduce the amount of phytase supplementation, and improve human nutrition. Future commercialization of crop varieties with further reduced low seed TP and PA as well as total plant P uptake could have a significant industry impact. This may include economic, nutritional and environmental benefits by maintaining food in developing nations as well as maintaining water security in developed nations.

Supplementary Materials

The following supporting information can be downloaded at: https://www.mdpi.com/article/10.3390/agronomy15071550/s1, Supplementary Table S1. Dry weight and total P uptake in shoot and root of five barley genotypes at 40 DAS and 92DAS; Supplementary Table S2. Total plant dry weight (combined shoot and root dry weight) of five barley genotypes at 40 DAS and 92 DAS; Supplementary Table S3. Total plant P uptake (combined vegetative tissue, grain, and root total P uptake) of five barley genotypes at 40 DAS; Supplementary File. Datasets for M3 and M4 line selection; M4 analyses and M5 pot experiment.

Author Contributions

The project was conceived by V.R., P.J.A.W. and K.A.S. B.L.A. carried out all practical research, experimental planning and data analysis, with input from all other authors. B.L.A. and K.A.S. jointly wrote the manuscript with contributions from other co-authors and V.R. approved the final version. All authors have read and agreed to the published version of the manuscript.

Funding

This research was funded by the Agriculture and Horticulture Development Board (AHDB) PhD studentship project number 211400 to Beverly Agesa. Raboy received support from the United States Department of Agriculture, Agricultural Research Service project number 5366-21000-030-00D.

Data Availability Statement

The original contributions presented in this study are included in the article/Supplementary Materials. Further inquiries can be directed at the corresponding author(s).

Acknowledgments

The authors thank Sajjad Awan (Formerly AHDB) for advice and Bangor University staff Llinos Hughes, Mark Hughes, Helen Simpson, Diane Hamilton, John Evans, and Sarah Chesworth for technical support.

Conflicts of Interest

The authors declare no conflicts of interest. The funders had no role in the design of the study; in the collection, analyses, or interpretation of data; in the writing of the manuscript; or in the decision to publish the results.

References

  1. Julia, C.C.; Rose, T.J.; Pariasca-Tanaka, J.; Jeong, K.; Matsuda, T.; Wissuwa, M. Phosphorus uptake commences at the earliest stages of seedling development in rice. J. Exp. Bot. 2018, 69, 233–5240. [Google Scholar] [CrossRef] [PubMed]
  2. Raboy, V.; Young, K.A.; Dorsch, J.A.; Cook, A. Genetics and breeding of seed phosphorus and phytic acid. J. Plant Physiol. 2001, 158, 489–497. [Google Scholar] [CrossRef]
  3. Raboy, V.; Cichy, K.; Peterson, K.; Reichman, S.; Sompong, U.; Srinives, P.; Saneoka, H. Barley (Hordeum vulgare L.) low phytic acid 1-1: An endosperm-specific, filial determinant of seed total phosphorus. J. Hered. 2014, 105, 656–665. [Google Scholar] [CrossRef]
  4. Tunney, H.; Breeuwsma, A.; Withers, P.J.A.; Ehlert, P.A.I. Phosphorus Fertilizer Strategies: Present and Future. In Phosphorus Loss from Soil to Water; Tunney, H., Carton, O.T., Brookes, P.C., Johnston, A.E., Eds.; CAB International: Wallingford, UK, 1997; pp. 177–203. [Google Scholar]
  5. Johnston, A.E.; Poulton, P.R.; Fixen, P.E.; Curtin, D. Phosphorus: Its efficient use in agriculture. Adv. Agron. 2014, 123, 177–228. [Google Scholar] [CrossRef]
  6. Withers, P.J.A.; Sylvester-Bradley, R.; Jones, D.L.; Healey, J.R.; Talboys, P.J. Feed the crop not the soil: Rethinking phosphorus management in the food chain. Environ. Sci. Technol. 2014, 48, 6523–6530. [Google Scholar] [CrossRef]
  7. Carpenter, S.R.; Bennett, E.M. Reconsideration of the planetary boundary for phosphorus. Environ. Res. Lett. 2011, 6, 014009. [Google Scholar] [CrossRef]
  8. Nziguheba, G.; Zingore, S.; Kihara, J.; Merckx, R.; Njoroge, S.; Otinga, A.; Vandamme, E.; Vanlauwe, B. Phosphorus in smallholder farming systems of sub-Saharan Africa: Implications for agricultural intensification. Nutr. Cycl. Agroecosyst. 2016, 104, 321–340. [Google Scholar] [CrossRef]
  9. Brownlie, W.J.; Sutton, M.A.; Reay, D.S.; Heal, K.V.; Hermann, L.; Kabbe, C.; Spears, B.M. Global actions for a sustainable phosphorus future. Nat. Food 2021, 2, 71–74. [Google Scholar] [CrossRef] [PubMed]
  10. Rose, T.J.; Pariasca-Tanaka, J.; Rose, M.T.; Fukuta, Y.; Wissuwa, M. Genotypic variation in grain phosphorus concentration; and opportunities to improve P-use efficiency in rice. Field Crops Res. 2010, 119, 154–160. [Google Scholar] [CrossRef]
  11. Shenoy, V.V.; Kalagudi, G.M. Enhancing plant phosphorus use efficiency for sustainable cropping. Biotechnol. Adv. 2005, 23, 501–513. [Google Scholar] [CrossRef]
  12. Vandamme, E.; Wissuwa, M.; Rose, T.J.; Dieng, I.; Drame, K.N.; Fofana, M.; Senthilkumar, K.; Venuprasad, R.; Jallow, D.; Segda, Z.; et al. Genotypic variation in grain P loading across diverse rice growing environments and implications for field P balances. Front. Plant Sci. 2016, 7, 1435. [Google Scholar] [CrossRef]
  13. Rothwell, S.A.; Doody, D.G.; Johnston, C.; Forber, K.J.; Cencic, O.; Rechberger, H.; Withers, P.J.A. Phosphorus stocks and flows in an intensive livestock dominated food system. Resour. Conserv. Recycl. 2020, 163, 105065. [Google Scholar] [CrossRef] [PubMed]
  14. Samtiya, M.; Aluko, R.E.; Dhewa, T. Plant food anti-nutritional factors and their reduction strategies: An overview. Food Prod. Process. Nutr. 2020, 2, 6. [Google Scholar] [CrossRef]
  15. Bohn, L.; Meyer, A.S.; Rasmussen, S.K. Phytate: Impact on environment and human nutrition. A challenge for molecular breeding. J. Zhejiang Univ. Sci. B 2008, 9, 165–191. [Google Scholar] [CrossRef]
  16. Guttieri, M.; Bowen, D.; Dorsch, J.A.; Raboy, V.; Souza, E. Identification and characterization of a low phytic acid wheat. Crop Sci. 2004, 44, 418–424. [Google Scholar] [CrossRef]
  17. Geng, L.; Li, M.; Zhang, G.; Ye, L. Barley: A potential cereal for producing healthy and functional foods. Food Qual. Saf. 2022, 6, fyac012. [Google Scholar] [CrossRef]
  18. Dorsch, J.A.; Cook, A.; Young, K.A.; Anderson, J.M.; Bauman, A.T.; Volkmann, C.J.; Murthy, P.P.; Raboy, V. Seed phosphorus and inositol phosphate phenotype of barley low phytic acid genotypes. Phytochemistry 2003, 62, 691–706. [Google Scholar] [CrossRef]
  19. Raboy, V.; Peterson, K.; Jackson, C.; Marshall, J.M.; Hu, G.; Saneoka, H.; Bregitzer, P. A substantial fraction of barley (Hordeum vulgare L.) low phytic acid mutations have little or no effect on yield across diverse production environments. Plants 2015, 4, 225–239. [Google Scholar] [CrossRef]
  20. Bregitzer, P.; Raboy, V.; Obert, D.E.; Windes, J.M.; Whitmore, J.C. Registration of ‘Herald’ barley. Crop Sci. 2007, 47, 441. [Google Scholar] [CrossRef]
  21. Bregitzer, P.; Raboy, V.; Obert, D.E.; Windes, J.; Whitmore, J.C. Registration of ‘Clearwater’ low-phytate hulless spring barley. J. Plant Regist. 2008, 2, 1–4. [Google Scholar] [CrossRef]
  22. Roslinsky, V.; Eckstein, P.E.; Raboy, V.; Rossnagel, B.G.; Scoles, G.J. Molecular marker development and linkage analysis in three low phytic acid barley (Hordeum vulgare) mutant lines. Mol. Breed. 2007, 20, 323–330. [Google Scholar] [CrossRef]
  23. Ye, H.; Zhang, X.; Broughton, S. A nonsense mutation in a putative sulphate transporter gene results in low phytic acid in barley. Funct. Integr. Genom. 2011, 11, 103–110. [Google Scholar] [CrossRef] [PubMed]
  24. Yamaji, N.; Takemoto, Y.; Miyaji, T.; Mitani-Ueno, N.; Yoshida, K.T.; Ma, J.F. Reducing phosphorus accumulation in rice grains with an impaired transporter in the node. Nature 2017, 541, 92–95. [Google Scholar] [CrossRef]
  25. Nilan, R.A.; Sideris, E.G.; Sander, C.; Konzak, C.F. Azide—A potent mutagen. Mutat. Res. 1973, 17, 142–144. [Google Scholar] [CrossRef]
  26. Agriculture and Horticulture Development Board. Nutrient Management Guide (RB209); Agriculture and Horticulture Development Board: Coventry, UK, 2019; Available online: https://ahdb.org.uk/nutrient-management-guide-rb209 (accessed on 19 May 2025).
  27. Hoagland, D.R.; Arnon, D.I. The Water-Culture Method for Growing Plants Without Soil, 2nd ed.; Circular, California Agricultural Experiment Station: Santa Cruz, CA, USA, 1950; p. 347. [Google Scholar]
  28. Chen, P.S.; Toribara, T.Y.; Huber, W. Microdetermination of Phosphorus. Anal. Chem. 1956, 28, 1756–1758. [Google Scholar] [CrossRef]
  29. Richards, I. Review of AHDB-Funded Research on Phosphorus Management in Arable Crops; AHDB: Coventry, UK, 2019; Volume 93, pp. 1–21. [Google Scholar]
  30. Syers, J.K.; Johnston, A.E.; Curtin, D. Efficiency of Soil and Fertilizer Phosphorus Use: Reconciling Changing Concepts of Soil Phosphorus Behaviour with Agronomic Information; FAO: Rome, Italy, 2008; Volume 18. [Google Scholar] [CrossRef]
  31. R Core Team. RR: A Language and Environment for Statistical Computing; R Foundation for Statistical Computing: Vienna, Austria, 2020; Available online: www.R-project.org/ (accessed on 3 May 2020).
  32. Rose, T.J.; Liu, L.; Wissuwa, M. Improving phosphorus efficiency in cereal crops: Is breeding for reduced grain phosphorus concentration part of the solution? Front. Plant Sci. 2013, 4, 444. [Google Scholar] [CrossRef]
  33. Srivastava, A.; Gupta, A.; Bishi, S.K.; Akhila, P.; Latha, P.C.; Subrahmanyam, D.; Brajendra, P.; Anantha, M.S.; Ch, S.R.; Sakhare, A.S.; et al. Tolerance of Oryza sativa to low phosphate is associated with adaptive changes in root architecture and metabolic exudates. Plant Sci. 2025, 353, 112415. [Google Scholar] [CrossRef]
  34. Zhou, C.; Zhou, Y.; Tan, Y.; Shu, Q.; Li, Y.; Liu, J.; Wang, J.; Shi, J.; Zou, X. Metabolite profiling reveals the metabolic features of the progenies resulting from the low phytic acid rice (Oryza sativa L.) mutant. J. Cereal Sci. 2021, 100, 103251. [Google Scholar] [CrossRef]
  35. Sacchi, G.A.; Nocito, F.F. Plant sulfate transporters in the low phytic acid network: Some educated guesses. Plants 2019, 8, 61. [Google Scholar] [CrossRef]
  36. Cominelli, E.; Pilu, R.; Sparvoli, F. Phytic acid and transporters: What can we learn from Low phytic acid mutants. Plants 2020, 9, 69. [Google Scholar] [CrossRef]
  37. Zhao, H.; Frank, T.; Tan, Y.; Zhou, C.; Jabnoune, M.; Arpat, A.B.; Cui, H.; Huang, J.; He, Z.; Poirier, Y.; et al. Disruption of OsSULTR3; 3 reduces phytate and phosphorus concentrations and alters the metabolite profile in rice grains. New Phytol. 2016, 211, 926–939. [Google Scholar] [CrossRef] [PubMed]
  38. Kishor, D.S.; Lee, C.; Lee, D.; Venkatesh, J.; Seo, J.; Chin, J.H.; Jin, Z.; Hong, S.-K.; Ham, J.-K.; Koh, H.E. Novel allelic variant of Lpa1 gene associated with a significant reduction in seed phytic acid content in rice (Oryza sativa L.). PLoS ONE 2019, 14, e0209636. [Google Scholar] [CrossRef] [PubMed]
Figure 1. Schematic diagram showing generation advance and selection of mutagenised lpa 1-1 lines from M2 to M5.
Agronomy 15 01550 g001
Figure 2. Distribution of lpa 1-1 M3 population seed total P concentration (n = 1708).
Agronomy 15 01550 g002
Table 1. Calculations for nutrient uptake and utilization indices a.
IndexCalculationUnitReference
Plant PShoot P Uptake = Shoot dry weight (g) × P concentration (mg/g)
Root P Uptake = Root dry weight (g) × P concentration (mg/g)
Grain P uptake = Grain dry weight (g) × P concentration (mg/g)
Grain Yield = Grain dry weight (g) × 305,000 plants ha−1
Grain P offtake = 85% Grain dry weight (g) × P2O5 concentration
mg/g
mg/g
mg/g
t/ha
t/ha
[29]
Physiological Efficiency Y N Y O U N U O g[30]
Agronomic Efficiency (AE) Y N Y O   F N mg[30]
Crop recovery ( U p t a k e   b y   c r o p + P ) ( u p t a k e   b y   c r o p P )   P   a p p l i e d × 100 %
Yield Response (YR) ( G r a i n   Y i e l d + P ) ( G r a i n   Y i e l d P )   g
Phosphorus Harvest Index (PHI) G r a i n   P   c o n t e n t   T o t a l   P   U p t a k e   × 100 %
Yield P efficiency G r a i n   y i e l d   T o t a l   P l a n t   P   U p t a k e  
a YN = Crop yield with added P; YO = Crop yield without added P; UN = Crop nutrient uptake with added P; UO = Crop nutrient uptake without added P; FN = Amount of nutrient added.
Table 2. Summary of seed TP, seed weight, and mean seed P content of the mutant populations screened and selected in subsequent generations plus controls.
GenerationnLine DetailsSeed Total P (mg g−1)Seed Weight (mg)
Mean ± s.e.
Single Seed P Content
(μgP Seed−1)
Mean ± s.e
Min.Max.Mean ± s.e.
M31708All lines in initial TP screen1.94.22.84 ± 0.00749 ± 0.152139 ± 0.496
M3224Only selected lines1.23.62.50 ± 0.01645 ± 0.4112 ± 0.897
Harrington3Control in M3 nursery 4.1 ± 0.1843 ± 1.24176 ± 2.88
lpa 1-13Control in M3 nursery 3.2 ± 0.1145 ± 1.32143 ± 1.20
M4219 aAll lines screened for TP from field2.44.93.54 ± 0.02938 ± 0.54135
M472Four plants of 18 selected M4 lines1.23.63.13 ± 0.04039 ± 1.05121 ± 3.6
M5 (+P)9Three reps of lines 75.3, 94.4 and 163.4 with no P2.83.23.02 ± 0.13043 ± 1.99
M5 (-P)9Three reps of lines 75.3, 94.4 and 163.4 with added P2.63.43.04 ± 0.21947 ± 2.20
M5 (both treatments)18All M5 lines tested2.63.43.03 ± 0.17545 ± 1.57
a 224 lines were planted but only 219 produced viable seeds that could be tested.
Table 3. M5 seed components for three novel M4-selected lines (163.1, 75.3 and 94.4), Harrington, and lpa 1-1 grown under two different P treatments.
Nutrient PGenotypeSeed Components (±SD)
Seed Total P (mg g−1)Phytic Acid (%)Single Seed Weight (mg)
No added P94.43.0 ± 0.10 a0.18 ± 0.01 a51 ± 3.22 ab
163.43.3 ± 0.14 a0.15 ± 0.01 a40 ± 3.54 cd
75.33.1 ± 0.06 a0.15 ± 0.04 a52 ± 1.41 ab
Harrington4.2 ± 0.21 c0.49 ± 0.13 b43 ± 1.53 cd
LPA 1-13.7 ± 0.10 b0.25 ± 0.04 a45 ± 1.00 cd
Added P94.42.9 ± 0.12 a0.17 ± 0.021 a45 ± 1.41 cd
163.43.2 ± 0.06 a0.16 ± 0.04 a47 ± 2.12 bc
75.33.0 ± 0.06 a0.18 ± 0.01 a39 ± 2.65 d
Harrington4.4 ± 0.20 c0.49 ± 0.09 b54 ± 1.73 a
LPA 1-13.7 ± 0.06 b0.22 ± 0.01 a51 ± 0.58 ab
Source of Variationdfp Value and Significance
Genotype35.02 × 10−15 ***2.86 × 10⁻⁷ ***0.0006 ***
Nutrient P10.897 ns0.944 ns0.0957 ns
Interaction30.481 ns0.948 ns3.13 × 10−7 ***
Values represent means (n = 3), means with the same letters are not significantly different and means with different letters are significantly different. Significance codes: p < 0.001 ‘***’; no significant difference ‘ns’).
Table 4. Grain yield, Phosphorus Harvest Index (PHI), Harvest Index (HI) and P yield efficiency for three novel M4-selected lines (163.1, 75.3 and 94.4), Harrington and lpa 1-1 grown under two different P treatments. Values represent means (n = 3), means with the same letters are not significantly different and means with different letters are significantly different. Significance codes: p < 0.001 ‘***’; not significant ‘ns’.
Nutrient P Level (mg/L)GenotypeGrain Yield (g)Phosphorus Harvest Index (PHI) (%)Harvest Index (HI) (g)Yield/P Uptake
No added P94.412.73 ± 0.57 ab82 ± 0.05 a0.38 ± 0.02 a270 ± 0.01 ab
163.410.20 ± 1.77 a80 ± 0.02 a0.35 ± 0.03 a270 ± 0.04 ab
75.39.40 ± 0.57 a80 ± 0.02 a0.36 ± 0.03 a270 ± 0.02 ab
Harrington12.25 ± 1.91 ab82 ± 0.05 a0.35 ± 0.07 a200 ± 0.02 c
lpa 1-111.75 ± 1.34 ab81 ± 0.03 a 0.39 ± 0.02 a220 ± 0.01 bc
Added P94.415.65 ± 0.78 b83 ± 0.04 a0.37 ± 0.06 a290 ± 0.03 a
163.415.30 ± 0.00 b81 ± 0.03 a 0.40 ± 0.03 a260 ± 0.02 ab
75.314.75 ± 1.77 b81 ± 0.04 a 0.38 ± 0.03 a270 ± 0.02 ab
Harrington13.85 ± 0.35 ab84 ± 0.01 a0.38 ± 0.01 a200 ± 0.01 c
lpa 1-115.23 ± 1.10 b86 ± 0.04 a0.42 ± 0.04 a230 ± 0.01 abc
Source of Variationdfp Value and Significance
Genotype40.104 ns0.582 ns0.505 ns1.02 × 10−5 ***
Nutrient P16.2 × 10−6 ***0.189 ns0.138 ns0.432 ns
Interaction40.193 ns0.958 ns0.793 ns0.852 ns
Table 5. Estimated phosphorus utilization efficiency parameters (yield response, physiological efficiency (PE), agronomic efficiency (AE) and crop P recovery) for three novel lpa mutant lines, lpa 1-1 and Harrington.
GenotypeYield Response (g)Physiological Efficiency (PE) (g g−1)Agronomic Efficiency (AE) (mg)Crop P Recovery (%)
94.42.920.3619.475.47
163.45.10.2634.0013.07
75.35.350.3635.6710.00
Harrington1.60.1610.676.60
lpa 1-13.480.2423.209.73
Disclaimer/Publisher’s Note: The statements, opinions and data contained in all publications are solely those of the individual author(s) and contributor(s) and not of MDPI and/or the editor(s). MDPI and/or the editor(s) disclaim responsibility for any injury to people or property resulting from any ideas, methods, instructions or products referred to in the content.

