Abstract
Given the worsening global climate change that drives drought frequency and irrigation water shortages, implementing water-conserving practices like alternate wetting and drying (AWD) is now critically urgent. Biochar is widely used for soil carbon sequestration. However, there is limited information on the effects of biochar on soil organic carbon (SOC) and its labile fractions in paddy fields, especially under AWD. A two-year field experiment was conducted with two irrigation regimes (CF: continuous flooding irrigation; AWD) as the main plots and 0 (B0) and 20 t ha−1 (B1) biochar as sub-plots. AWD had no effect on the SOC and particulate organic carbon (POC) content, but increased the dissolved organic carbon (DOC), microbial biomass carbon (MBC), easily oxidizable organic carbon (EOC), light fraction organic carbon (LFOC), and carbon pool management index (CPMI) at 0–10 cm depths, by 24.4–56.4%, 12.6–17.7%, 9.2–16.8%, 25.6–28.1%, and 11.3–18.6%, respectively. Biochar increased SOC while also increasing DOC, MBC, EOC, LFOC, POC, and CPMI at 0–20 cm depths, by 18.4–53.3%, 14.7–70.2%, 17.4–22.3%, 10.2–27.6%, 95.2–188.3%, 46.6–224%, and 5.6–27.2, respectively, making SOC more labile under AWD. Our results highlight that biochar still holds great potential for improving soil quality and carbon sequestration under AWD, and the combination of biochar and AWD can achieve the synergistic optimization of the food–water–carbon sequestration trade-off, which is beneficial to sustainable agricultural production.
1. Introduction
Soil organic carbon (SOC) is the largest carbon stock in the terrestrial ecosystem [1]. SOC is both a source and sink and small changes in it can significantly contribute to changes in atmospheric CO2 concentration, thereby influencing the global carbon cycle [2]. SOC consists of a range of fractions [3], among which labile organic carbon fractions are shorter in turnover time and faster in response to changes in soil management practices [4], which act as an early index of SOC change [5]. It mainly includes dissolved organic carbon (DOC), microbial biomass carbon (MBC), particulate organic carbon (POC), light fraction organic carbon (LFOC), and easily oxidizable organic carbon (EOC) [6]. These labile fractions play vital agronomic roles. In particular, DOC serves as the primary substrate for microorganisms, driving organic carbon mineralization and nutrient cycling; MBC is an important easily biodegradable carbon component in soil, playing a key role in nutrient turnover and availability. Consequently, the size and activity of these labile fractions directly influence soil fertility, nutrient supply efficiency, and ultimately crop productivity. The carbon pool management index (CPMI) is a composite indicator to measure the quality and quantity of soil carbon [5]. Farmland SOC has a faster turnover rate than other soils and is more easily affected by human activities [7]. As a result of long-term agricultural production around the world, huge amounts of SOC is mineralized, leading to more greenhouse gas emissions [8]. Therefore, it is important to evaluate farmland SOC and its labile fractions for the global carbon balance and sustainable agricultural production.
Paddy fields account for 9% of the world’s cropland area [9], 75% of which is under continuous flooding irrigation (CF) [10]. CF was beneficial to the accumulation of soil carbon [11], which is about 20% higher than that of upland [12]. Rice feeds over 50% of the global population [13], and underpins world food security. However, this critical crop has a significant water footprint, utilizing freshwater at rates three to five times higher than those of other cereals [14]. Global climate change will further limit fresh water availability [15], and water scarcity is a critical factor for paddy production [16]. To cope with water scarcity, alternate wetting and drying irrigation (AWD) has emerged as one of the most widely water-saving irrigation technologies [17]. Previous studies have shown that AWD can greatly mitigate water scarcity and CH4 emissions without sacrificing rice yield [18,19,20]. However, AWD can also decrease SOC and promote soil CO2 emissions, mainly due to increased microbial activity by improving soil aeration and aggregate disruption during drying, consequently reducing SOC’s physical protection. [21,22,23,24]. Labile organic carbon is inevitably more responsive to AWD. Yang, et al. [7] showed that AWD decreased SOC by 5.7–13.3% and increased DOC and MBC by 13.8–26.1% and 0.9–11.1%, respectively. If water conservation and soil carbon sequestration can be achieved simultaneously while ensuring food security, it will be more conducive to green and sustainable agricultural production and help achieve the United Nations Sustainable Development Goals.
Biochar has been widely adopted for crop production, carbon sequestration, and the mitigation of GHG [25,26,27]. Numerous reports showed that biochar can greatly increase SOC, even in paddy fields [28,29]. In addition, previous studies have also shown that biochar had a positive effect on MBC, POC, EOC, and LFOC [30,31], while both positive and negative effects on DOC [32]. At present, most of the previous studies have focused on dryland or paddy fields under CF. To our knowledge, there is still little known about its impact on SOC and labile fractions under AWD, especially in Northeast China, a typical rice monoculture region.
Therefore, a two-year field experiment was performed to assess the impacts of biochar on SOC, labile fractions (DOC, MBC, EOC, LFOC, and POC), and the CPMI at different soil depths under two irrigation regimes. In this study, we hypothesized that the effects of biochar on the soil organic carbon (SOC) content and its labile fractions are significantly influenced by both the irrigation regime and soil depth, with biochar increasing SOC but concurrently enhancing its lability, specifically under alternate wet and dry (AWD) irrigation. The outcomes will contribute to providing a scientific basis for the green and sustainable production of paddy fields by biochar application and AWD, and achieve the synergistic optimization of the food–water–carbon sequestration trade-off.
2. Materials and Methods
2.1. Experimental Site and Materials
The experiment was carried out at the Center Irrigation Experiment Station of Liaoning Province, Shenyang, China (42°08′ N, 120°30′ E) during the rice growing seasons (May to October) in 2021 and 2022. The experimental site has a temperate continental monsoon climate with a mean annual temperature of 8.1 °C and precipitation of 672.9 mm. Daily temperature and precipitation during the experimental period are available in Figure S1. The main properties of topsoil (0–20 cm) are listed in Table 1. Biochar derived from maize straw was pyrolyzed at 500 °C for 2 h. Maize straw was selected as the feedstock due to its high regional relevance in Northeast China, where maize is the dominant crop generating vast quantities of this agricultural residue annually. Utilizing this abundant and locally available resource for biochar production aligns with the principles of sustainable agricultural waste management and enhances the practical applicability of our findings to regional soil improvement strategies. Biochar was mixed into the topsoil (0–20 cm) only once in May 2020. The properties of biochar are shown in Table 1.

Table 1.
The main properties of topsoil (0–20 cm) and biochar.
2.2. Experimental Design
A split-plot design with three replications was used. The main plots were irrigation regimes (CF and AWD) and sub-plots were biochar application rates (B0: 0 and B1: 20 t ha–1). The application rate of 20 t ha−1 was based on the optimal application rate determined in previous studies [33]. Each plot is 3 m (width) × 6 m (length) and is separated by the PVC barrier buried at a depth of 40 cm to avoid the lateral flow of nutrients and water.
The water management is depicted by Li, et al. [34] and indicated in Table 2. The soil water potential (SWP) at the depth of 15 cm was measured twice daily (8:00 and 14:00) by a tensiometer (Institute of Soil Science of Chinese Academy of Sciences, Nanjing, China) for IAWD plots. Irrigation was initiated immediately when readings fell within the threshold range. Based on local fertilization practices, 210 kg ha–1 N (urea), 60 kg ha–1 P2O5 (superphosphate), and 75 kg ha–1 K2O (potassium sulfate) are generally applied annually across all plots. A total of 40%, 40%, and 20% urea were used as basal, tillering, and panicle fertilizers, respectively. A total of 50% and 50% potassium were used as basal and panicle fertilizers, respectively. All phosphate was used as a base fertilizer.

Table 2.
Irrigation standards for two irrigation regimes.
2.3. Sampling and Measurement
After harvest in October 2021 and 2022, three soil samples were randomly collected from the same soil layer at depths of 0–10, 10–20, and 20–40 cm for each plot, and mixed into one representative sample. Fresh soil was partially placed in the refrigerator to measure DOC and MBC. Air-dried soil was used to measure POC, LFOC, EOC, and SOC. Soil chemical properties at 0–10 cm were analyzed based on standard methods provided by Bao [35]. DOC was measured as described by Ghani, et al. [36]. MBC was measured following the chloroform fumigation approach by Wu, et al. [37]. EOC was measured as described by Blair, et al. [5]. POC was measured as described by Cambardella, et al. [38]. LFOC was determined using the density fractionation method described by Gregorich, et al. [39]. SOC and total N were measured by an elemental analyzer (Vario Elemental Analyzer, Langenselbold, Germany). Further details of the methods are provided in the Supplementary Materials.
By integrating the SOC concentration and lability parameters, the CPMI effectively gauges the efficacy of soil management strategies in augmenting soil quality. The CPMI was calculated as follows:
where CPI and LI represent the carbon pool index and lability index, respectively.
where SOCS represents the SOC content of each treatment (ICFB0, ICFB1, IAWDFB0, or IAWDB1), SOCC represents the SOC content of the ICFB0 treatment, LS represents the carbon pool lability of each treatment (ICFB0, ICFB1, IAWDB0, or IAWDB1), LC represents the carbon pool lability of the ICFB0 treatment, and EOC represents the easily oxidizable organic carbon content.
CPMI = CPI × LI × 100
CPI = SOCS/SOCC
LI = LS/LC
L = EOC/(SOC − EOC)
2.4. Statistical Analyses
An analysis of variance was performed to analyze the data separately for each year according to a split-plot design, using R software (version 4.2.1). Before the ANOVA, assumptions of normality (Shapiro–Wilk test) and homogeneity of variance (Levene test) were tested for the dataset. The irrigation regime and biochar application were fixed effects, while replicates were random effects. Tukey’s HSD test at the 5% probability level was used to test the significance of differences among treatments. Data principal component analysis (PCA) and mapping were completed by using Origin 2022 (OriginLab Corporation, Northampton, MA, USA).
3. Results
3.1. Soil Chemical Properties
The irrigation regime exerted significant effects on soil total P, NH4+-N, NO3−-N, available P, and available K, but no effect on total N (Table 3). AWD increased soil total P, NO3−-N, available P, and available K by 6.8%, 29.0%, 9.6%, and 53.2% in 2021 and 6.7%, 22.9%, 9.2%, and 52.6% in 2022, respectively, compared to CF. Conversely, AWD reduced NH4+-N by 12.0% and 18.3% in 2021 and 2022, respectively (Figure 1). The biochar application exerted significant effects on soil total N, total P, NH4+-N, NO3−-N, available P, and available K (Table 3). Biochar increased soil total N, total P, NH4+-N, NO3−-N, available P, and available K by 8.8%, 6.5%, 17.4%, 23.2%, 11.7%, and 65.1% in 2021 and 6.9%, 6.6%, 29.4%, 17.2%, 13.6% and 62.4% in 2022, respectively. Among the treatments, the IAWDB1 treatment had the highest soil total N, total P, NO3−-N, available P, and available K.

Table 3.
ANOVAs for soil chemical properties in 2021 and 2022.
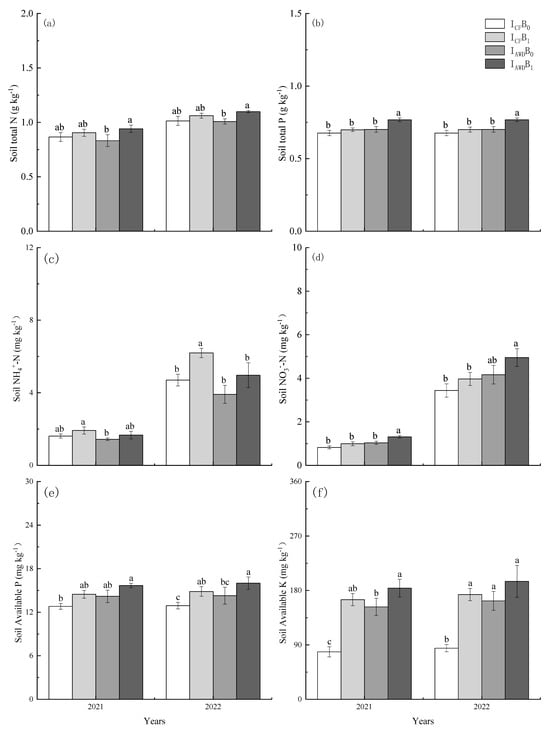
Figure 1.
Effects of irrigation regime and biochar on soil total N (a), total P (b), NH4+-N (c), NO3--N (d), Available P (e), and Available K (f) in 2021 and 2022. Significant differences at p < 0.05 have been indicated with different letters.
3.2. SOC
SOC was significantly impacted by the biochar application at 0–10 and 10–20 cm depths, but not by the irrigation regime at each depth (Table 4). Biochar increased SOC at 0–10 and 10–20 cm depths by 53.3% and 36.9% in 2021, and 46.9% and 18.4% in 2022, respectively, compared to the no biochar control. IAWDB1 and ICFB1 treatments showed no significant difference in SOC but were significantly greater than IAWDB0 and ICFB0 at 0–20 cm depths in both years (Figure 2).

Table 4.
ANOVAs for SOC and its fractions in 2021 and 2022.
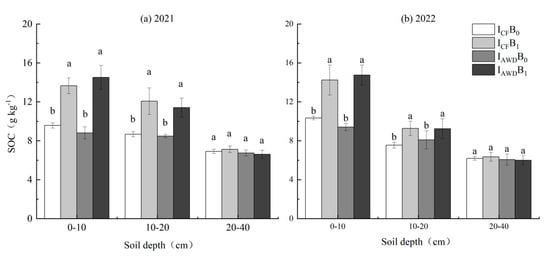
Figure 2.
Effects of irrigation regime and biochar on SOC in (a) 2021 and (b) 2022. ICF and IAWD represent continuous flooding irrigation and alternate wetting and drying irrigation, respectively. B0 and B1 represent biochar addition rates at 0 and 20 t ha−1, respectively. Bars represent standard errors (n = 3). Different letters above the columns indicate significant differences in the same soil depth (p < 0.05).
3.3. SOC Labile Fractions
3.3.1. DOC
DOC was significantly impacted by irrigation regime at 0–10 cm depths, biochar application at 0–10 and 10–20 cm depths in 2021 and 2022, and the I × B interaction at 0–10 cm depths in 2021 (Table 4). AWD improved DOC at 0–10 cm depths by 56.4% and 24.4% in 2021 and 2022, respectively, compared with CF. Biochar improved DOC at 0–10 and 10–20 depths cm by 70.2% and 26.9% in 2021 and 43.0% and 14.7% in 2022, respectively. The I × B interaction was caused by biochar having a higher increase under AWD than under CF. Among the treatments, the IAWDB1 treatment achieved the largest increase in DOC at 0–20 cm depths (except in 10–20 cm in 2021) (Figure 3).
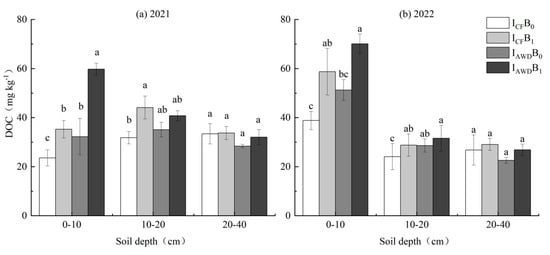
Figure 3.
Effects of irrigation regime and biochar on DOC in (a) 2021 and (b) 2022. Different letters above the columns indicate significant differences in the same soil depth (p < 0.05).
3.3.2. MBC
MBC was significantly impacted by irrigation regime and biochar application at 0–10 and 10–20 cm depths in both years (Table 4). At 0–10 and 10–20 cm depths, AWD increased MBC by 12.6% and 25.6% in 2021 and 17.7% and 21.4% in 2022, respectively. Biochar increased MBC by 17.3% and 18.5% in 2021 and 22.3% and 17.4% in 2022, respectively. The I AWDB1 treatment achieved the largest increase in MBC at each soil depth, which was 9.5–50.6% higher than ICFB0 in two years (Figure 4).
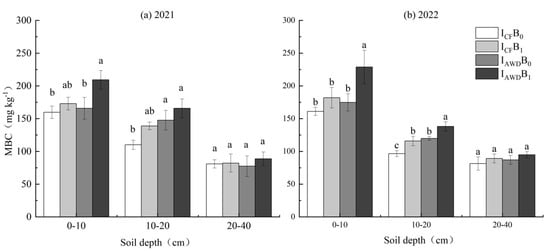
Figure 4.
Effects of irrigation regime and biochar on MBC in (a) 2021 and (b) 2022. Different letters above the columns indicate significant differences in the same soil depth (p < 0.05).
3.3.3. EOC
EOC was significantly impacted by the irrigation regime at 0–10 cm depths and the biochar application at 0–10 and 10–20 cm depths in both years (Table 4). AWD increased EOC at 0–10 cm depths by 16.8% and 9.2% in 2021 and 2022, respectively. Biochar increased EOC at 0–10 and 10–20 cm depths by 15.1% and 27.6% in 2021 and 10.2% and 24.6% in 2022, respectively. The I AWDB1 treatment achieved the largest increase in EOC at 0–20 cm depths, which was 20.6–33.3% higher than ICFB0 in the two years studied (Figure 5).
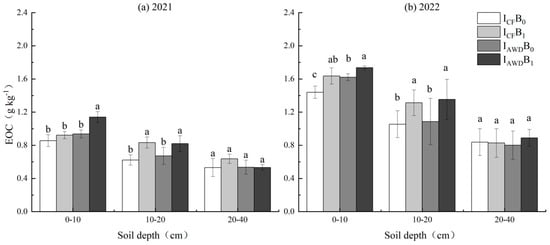
Figure 5.
Effects of irrigation regime and biochar on EOC in (a) 2021 and (b) 2022. Different letters above the columns indicate significant differences in the same soil depth (p < 0.05).
3.3.4. LFOC
LFOC was significantly impacted by the irrigation regime at 0–10 cm depths and the biochar application at 0–10 and 10–20 cm depths in 2021 and 2022, and the I × B interaction at 0–10 cm depths in 2021 (Table 4). AWD increased LFOC at 0–10 cm depths by 25.6% and 28.1% in 2021 and 2022, respectively. Biochar increased LFOC at 0–10 and 10–20 cm depths by 155.3% and 95.2% in 2021 and 185.6% and 188.3% in 2022, respectively. Moreover, the I × B interaction was caused by biochar having a 32.5% higher increase under AWD than under CF at 0–10 cm depths in 2021. The IAWDB1 treatment achieved the largest increase in LFOC at 0–20 cm depths (except at 10–20 cm depths in 2021) (Figure 6).
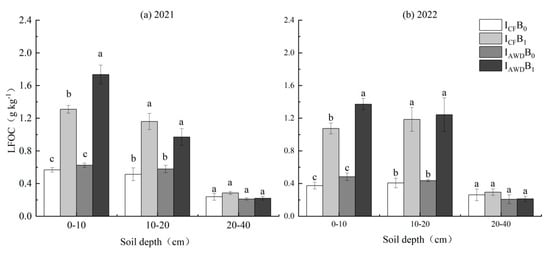
Figure 6.
Effects of irrigation regime and biochar on LFOC in (a) 2021 and (b) 2022. Different letters above the columns indicate significant differences in the same soil depth (p < 0.05).
3.3.5. POC
POC was significantly impacted by the biochar application at 0–10 and 10–20 cm depths in 2021 and 2022 and the I × B interaction at 0–10 cm depths in 2021 and 2022 and 10–20 cm depths in 2021 (Table 4). Biochar increased POC at 0–10 and 10–20 cm depths by 167.0% and 46.6% in 2021 and 224.0% and 57.9% in 2022, respectively. The I × B interaction was caused by biochar having a higher increase under CF than under AWD. (Figure 7).
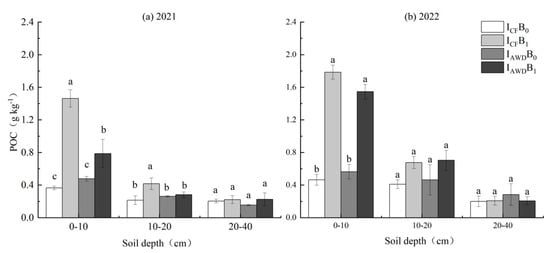
Figure 7.
Effects of irrigation regime and biochar on POC in (a) 2021 and (b) 2022. Different letters above the columns indicate significant differences in the same soil depth (p < 0.05).
3.4. CPMI
L and LI were significantly impacted by the irrigation regime and biochar application at 0–10 cm depths in both years (Table 5). AWD increased L and LI by 19.7% and 19.9% in 2021, and 16.5% and 16.4% in 2022, respectively, compared to CF. In contrast, biochar reduced L and LI by 27.3% and 27.3% in 2021, and 28.2% and 28.0% in 2022, respectively, relative to the no biochar control (Figure 8a–d).

Table 5.
ANOVAs for the soil carbon pool lability (L), the carbon pool lability index (LI), the carbon pool index (CPI), and the carbon pool management index (CPMI) at 0–10, 10–20, and 20–40 cm soil depth in 2021 and 2022.
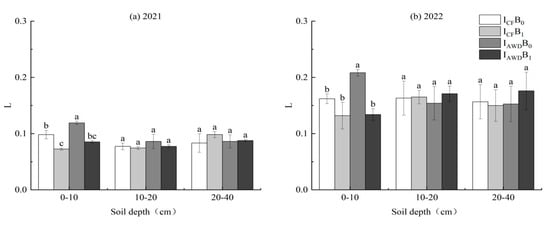
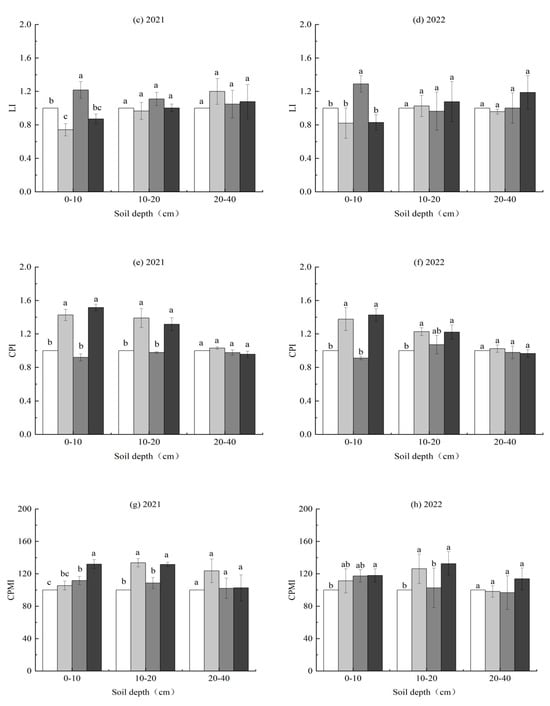
Figure 8.
Effects of irrigation regimes and biochar applications on the soil carbon pool lability (L) (a,b), the carbon pool lability index (LI) (c,d), the carbon pool index (CPI) (e,f), and the carbon pool management index (CPMI) (g,h) in 2021 and 2022. Different letters above the columns indicate significant differences in the same soil depth (p < 0.05).
The CPI was significantly impacted by the biochar application at 0–20 cm depths in both years and the I × B interaction at 0–10 cm depths in 2021 (Table 5). Biochar increased the CPI at 0–10 and 10–20 cm depths by 53.3% and 36.7% in 2021 and 46.8% and 18.2% in 2022, respectively, relative to the no biochar control. The I × B interaction was caused by the CPI of biochar application being 6.3% higher under AWD than under CF (Figure 8e,f).
The CPMI was significantly impacted by the irrigation regime at 0–10 cm depths and biochar application at 10–20 cm depths in both years and the biochar application and the I × B interaction at 0–10 cm depths in 2021 (Table 5). AWD increased the CPMI at 0–10 cm depths by 18.6% and 11.3% in 2021 and 2022, respectively, compared to CF. The biochar application increased the CPMI at 0–10 and 10–20 cm depths by 12.1% and 27.2% in 2021, and 5.6% and 27.7% in 2022, respectively, relative to the no biochar control. The I × B interaction at 0–10 cm depths in 2021 occurred because the CPMI of biochar application was 25.1% higher under AWD than under CF (Figure 8g,h).
3.5. Principal Component Analysis (PCA) of SOC and Labile Organic Carbon Fractions
The PCA is helpful in understanding the impact of irrigation regimes and biochar application on SOC and its labile fractions. The PCA results identified two principal components with their eigenvalues >1. PC1 explained 85.0% of the variance, while PC2 explained 10.6%, jointly accounting for 95.6% of the total variation (Figure 9). DOC, MBC, EOC, LFOC, POC, SOC, and CPMI were mainly impacted by the biochar application. Additionally, DOC, MBC, EOC, POC, and LFOC were strongly associated with the SOC and CPMI.
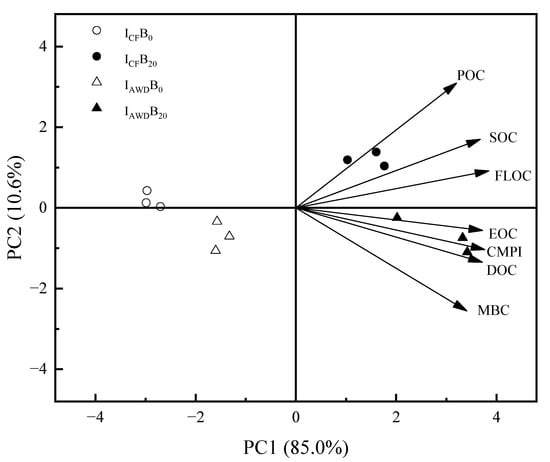
Figure 9.
Principal component analysis (PCA) of SOC and its labile fractions affected by irrigation regimes and biochar applications. All traits were mean values for the 0–10 and 10–20 cm depths in 2021 and 2022.
4. Discussion
4.1. Effects of AWD and Biochar on SOC
Most studies have suggested that AWD decreases SOC in paddy fields [40,41]. However, some reports suggest that AWD has no effect or even increases SOC [42,43]. These different results probably were related to irrigation regimes, the SOC stock, and soil characteristics [41,43,44]. Our findings show that AWD did not affect the SOC content (Figure 2), agreeing with findings reported by Xu, et al. [43]. The reasons might be mainly that different SWP thresholds were set for AWD according to the water stress of rice at different growth periods in our experiments (Table 2), which was insufficient to induce a significant change in soil carbon metabolism [44], and thus would not have a significant effect on SOC. It could also be that the lower SOC content in our experiments meant that relatively less labile organic carbon could be oxidized, which would not significantly contribute to the mineralization of SOC, even under more aerobic conditions [45]. In addition, AWD also can promote root growth and root density [46], and increase the amount and transfer ratio of carbon residing underground as rhizodeposition [47]; thus, the outcome revealed no effect on SOC.
Numerous studies have suggested that biochar greatly increases SOC in paddy fields [26,28,48]. Our results suggest that biochar greatly increases SOC at 0–20 cm depths in paddy fields (Figure 2), agreeing with Yang, et al. [7]. This might be mainly due to biochar containing large amounts of stable organic carbon, which directly increases SOC [29,49]. Previous investigations have indicated about 80–97% of carbon from biochar remains unmineralized to carbon dioxide over hundreds to thousands of years [50,51,52]. In addition, biochar also indirectly increases SOC by improving soil physicochemical and biological properties [7,53,54,55]. For instance, biochar can increase SOC by improving soil aggregate stability [48,56], due to about 90% of surface SOC being stored in aggregate [57], and the physical protection of SOC by aggregate is an important mechanism for SOC stabilization [58]. Critically, our results suggest that biochar increased SOC at 0–20 cm depths under AWD to a level comparable to that under CF, and even slightly higher than that at 0–10 cm under CF. This phenomenon may be attributed to the significantly enhanced soil nutrient availability (Figure 1) under the AWD-biochar treatment, which likely stimulated rice nutrient uptake and consequently amplified root-derived carbon inputs—a primary source of SOC.
4.2. Effects of AWD and Biochar on SOC Labile Fractions
DOC has an essential function in SOC mineralization and nutritional cycling [59]. The results suggested AWD only increased DOC at 0–10 cm depths (Figure 3), agreeing with results reported by Yan, et al. [40], which was attributed to AWD increasing the soil aeration and oxygen content, which facilitated the colonization of microorganisms and the decomposition of SOC to produce DOC [7]. Studies showed that biochar had a positive [60], a negative [61], and no influence [62] on DOC. Our results suggest that biochar improved DOC at 0–20 cm depths under both irrigation regimes. The reasons may be, first, biochar contains labile organic carbon [63,64,65], and DOC is considered to be the main component [66]; Yin, et al. [67] directly regarded DOC as labile organic carbon content. Second, biochar enhances soil microbial activity, allowing SOC to release more DOC through microbial decomposition [60]. In addition, biochar has a greater increase in DOC under AWD than under CF, mainly due to greater soil aeration and oxygen content under AWD [68].
MBC is an essential labile carbon fraction that plays a critical function in nutrient turnover and availability [69]. It also serves as a sensitive indicator of soil biological activity, responding rapidly to changes in soil management practices such as fertilization, irrigation regimes, and biochar application. Our results suggest that AWD increased MBC at 0–20 cm depths, agreeing with results reported by Yang, et al. [7]. This is likely because AWD increased the effective aeration of plow depth, and the hydrothermal conditions were suitable, which favored the mineralization and decomposition of SOC and improved the activity of soil microorganisms [7]. Biochar increased MBC at 0–20 cm depths, agreeing with results reported by Sun, et al. [60]. This may be attributed to biochar’s highly porous structure and specific surface, offering a favorable habitat for microorganisms [70], and the labile carbon of biochar provides greater substrate availability [71], which in turn caused an increase in MBC. EOC is a sensitive indicator of changes in SOC pools, soil quality, and management practices that promote carbon sequestration [71]. Our study shows that AWD increased EOC at 0–10 cm depths, similar to findings reported by [72]; this may be because the soil Eh is the index of soil oxidation-reduction conditions of paddy soil, and AWD increased soil Eh [43], thus increasing EOC. Our study shows that the biochar application increased EOC at 0–20 cm depths, which is probably due to the biochar application promoting plant development, soil aggregate, and root activity [73], the matrix for EOC formation. Additionally, biochar has little carbon, which can be oxidized by KMnO4 [31]; thus, it is favorable for the formation of EOC.
LFOC is mainly produced by new additions of organic matter that may not decompose in a shorter period [74]. Our study shows that AWD increased LFOC at 0–10 cm depths, which is probably because AWD can increase soil nutrients such as soil NO3−-N, available P, and available K (Figure 1), thereby promoting root growth [46]. The biochar application increased LFOC at 0–20 cm depths, which is probably because biochar has a high chemical and biological stability, which contributes to the formation of LFOC [30].
POC is primarily comprised of crop residues, microorganisms, and animal debris, and is a source of energy for microorganisms and a repository of labile SOC and plant nutrients [75]. Our study shows that the biochar application greatly increased POC content at 0–20 cm depths. This could be attributed to (1) the greater quantity of the fixed carbon content direct input from the biochar application [71]. Our PCA results also show a strong correlation between POC and SOC, indicating that the direct increase in SOC caused by the return of biochar to the soil may also increase POC (Figure 9); (2) biochar itself contained silica and alumina minerals, which can inhibit the decomposition of POC [76]; (3) the biochar application could protect POC from rapid degradation by microbes through the promotion of soil aggregation formation [74].
Critically, the observed increases in labile carbon fractions do not contradict the goal of stable carbon sequestration. Labile carbon fractions accounted for a very small proportion of SOC [5], so their changes did not cause a significant reaction in SOC (Figure 2). Moreover, labile carbon fractions promoted microbial growth, and microbial necromass contributed to mineral-associated stable C formation [77]. Biochar further improved microbial activity and root growth under AWD [14,78], which was more beneficial to aggregate stability and protected easily decomposable and stable carbon pools from decomposition. Therefore, although increased labile carbon fractions such as DOC might temporarily increase mineralization, the direct carbon input and stabilization mechanisms of biochar, as well as increased soil nutrients under AWD promoting root growth and increasing organic carbon sources, will mitigate long-term carbon loss.
Labile carbon fractions, especially DOC and MBC, serve as the most direct reservoir of plant-available nutrients, playing a pivotal role in sustaining soil fertility through rapid nutrient cycling and microbial mediation [5]. Our results demonstrated this point, showing that biochar increased SOC lability while also increasing soil total N, total P, NH4+-N, NO3−-N, available P, and available K under AWD. This indicated that biochar-induced SOC accumulation supported climate goals even when increasing its lability, while also enhancing agricultural productivity through nutrient synergism.
4.3. Effects of AWD and Biochar on CPMI
The CPMI integrates both the quantity and quality (carbon stability) of SOC. It is a comprehensive index that combines the carbon pool index and lability index to characterize changes in SOC storage and its stability [5]. Our study shows that AWD significantly increased L, LI, and the CPMI at 0–10 cm depths, yet had no influence on the CPI. This may be due to AWD significantly increasing EOC, but slightly decreasing SOC at the 0–10 soil depth, thus ultimately increasing the CPMI. The biochar application significantly decreased L and LI at 0–10 cm depths and increased the CPI and CPMI at 0–20 cm depths (Figure 9). This may be due to the fact that biochar significantly increased SOC, while EOC accounted for less in SOC and thus ultimately increased the CPMI. The increase in the CPMI reflected more carbon being stored in stable forms, which is more conducive to long-term carbon sequestration. In addition, biochar had the highest CPMI at 0–10 cm depths under AWD. These findings indicate that biochar still increases the SOC and EOC contents in paddy fields under AWD, and improves the soil carbon pool activity and carbon sequestration capacity.
Critically, our results redefine the biochar-AWD interaction paradigm. While AWD alone may promote carbon mineralization [40,41], biochar introduction transforms this system into a carbon-nutrient synergy engine. Our results demonstrate that carbon stability and agricultural productivity can be achieved simultaneously under optimized water–biochar management.
5. Conclusions
Our study shows that the irrigation regime and biochar had different effects on SOC and its labile fractions in different soil depths. AWD did not influence the SOC and POC content, but increased DOC, MBC, EOC, LFOC, and CPMI at 0–10 cm depths. Biochar increased SOC, its labile fractions (DOC, MBC, EOC, LFOC, POC), and the CPMI at 0–20 cm depths under two irrigation regimes. Overall, our results highlight that biochar can still significantly increase SOC under AWD, and biochar combined with AWD has great potential to save agricultural water and improve the soil carbon sequestration capacity, so as to achieve a win–win situation. In addition, biochar makes SOC more labile under AWD, and future studies should consider the effect of biochar on soil respiration.
Supplementary Materials
The following supporting information can be downloaded at: https://www.mdpi.com/article/10.3390/agronomy15071547/s1, Figure S1: Daily average air temperature and precipitation throughout the 2021 and 2022 rice growing periods in Shenyang, China.
Author Contributions
Conceptualization, W.D., Z.B., J.M. and T.C.; Methodology, W.D., Z.B. and T.C.; Formal analysis, W.D.; Investigation, W.D.; Data curation, W.D.; Writing—original draft, W.D.; Writing—review & editing, W.D., Z.B., J.M., T.C. and X.L.; Supervision, J.M. and T.C.; Project administration, W.D.; Funding acquisition, X.L. All authors have read and agreed to the published version of the manuscript.
Funding
This study was financially supported by the Liaodong University Doctoral Research Startup Fund (2024BS058), the Applied Basic Research Project of Liaoning Provincial Science and Technology Joint Program (2023JH2/101700181), the General Program of Liaoning Provincial Department of Education (JYTMS20230706), the Natural Science Foundation of Liaoning Province Joint Fund (2024-BSLH-091), and the Liaodong University Doctoral Research Startup Fund (2024BS053).
Data Availability Statement
The original contributions presented in the study are included in the article/Supplementary Materials, further inquiries can be directed to the corresponding author.
Conflicts of Interest
The authors declare that they have no competing interests.
References
- Batjes, N.H. Total carbon and nitrogen in the soils of the world. Eur. J. Soil Sci. 2014, 65, 10–21. [Google Scholar] [CrossRef]
- Wander, M.M.; Traina, S.J.; Stinner, B.R.; Peters, S.E. Organic and Conventional Management Effects on Biologically Active Soil Organic Matter Pools. Soil Sci. Soc. Am. J. 1994, 58, 1130–1139. [Google Scholar] [CrossRef]
- Mi, W.; Gao, Q.; Liu, M.; Sun, Y.; Wu, L. Changes in humus carbon fractions in paddy soil given different organic amendments and mineral fertilizers. Soil Tillage Res. 2019, 195, 104421. [Google Scholar] [CrossRef]
- Laik, R.; Kumar, K.; Das, D.K.; Chaturvedi, O.P. Labile soil organic matter pools in a calciorthent after 18 years of afforestation by different plantations. Appl. Soil Ecol. 2009, 42, 71–78. [Google Scholar] [CrossRef]
- Blair, G.J.; Lefroy, R.D.B.; Lisle, L. Soil carbon fractions based on their degree of oxidation, and the development of a carbon management index for agricultural systems. Aust. J. Agric. Res. 1995, 46, 1459–1466. [Google Scholar] [CrossRef]
- Bowles, T.M.; Acosta-Martínez, V.; Calderón, F.; Jackson, L.E. Soil enzyme activities, microbial communities, and carbon and nitrogen availability in organic agroecosystems across an intensively-managed agricultural landscape. Soil Biol. Biochem. 2014, 68, 252–262. [Google Scholar] [CrossRef]
- Yang, S.H.; Chen, X.; Jiang, Z.W.; Ding, J.; Sun, X.; Xu, J.Z. Effects of Biochar Application on Soil Organic Carbon Composition and Enzyme Activity in Paddy Soil under Water-Saving Irrigation. Int. J. Environ. Res. Public Health 2020, 17, 333. [Google Scholar] [CrossRef] [PubMed]
- Lin, Z.B.; Zhang, R.D. Dynamics of Soil Organic Carbon Under Uncertain Climate Change and Elevated Atmospheric CO2. Pedosphere 2012, 22, 489–496. [Google Scholar] [CrossRef]
- Liu, Y.; Ge, T.; van Groenigen, K.J.; Yang, Y.; Wang, P.; Cheng, K.; Zhu, Z.; Wang, J.; Li, Y.; Guggenberger, G.; et al. Rice paddy soils are a quantitatively important carbon store according to a global synthesis. Commun. Earth Environ. 2021, 2, 154. [Google Scholar] [CrossRef]
- FAO. Rice Market Monitor (RMM); FAO: Rome, Italy, 2018; Volume XI, Issue No. 1; Available online: https://openknowledge.fao.org/server/api/core/bitstreams/573305c9-224b-4d1e-9e32-d8ac4911c12b/content (accessed on 21 June 2025).
- Xu, J.; Yang, S.; Peng, S.; Wei, Q.; Gao, X. Solubility and leaching risks of organic carbon in paddy soils as affected by irrigation managements. Sci. World J. 2013, 2013, 546750. [Google Scholar] [CrossRef]
- Qi, J.Y.; Yao, X.B.; Lu, J.; He, L.X.; Cao, J.L.; Kan, Z.R.; Wang, X.; Pan, S.G.; Tang, X.R. A 40% paddy surface soil organic carbon increase after 5-year no-tillage is linked with shifts in soil bacterial composition and functions. Sci. Total Environ. 2023, 859, 160206. [Google Scholar] [CrossRef]
- Zhuang, Y.; Liu, H.; Zhang, L.; Li, S. Research perspectives on paddy field systems: Ecological functions and environmental impacts. Int. J. Agric. Sustain. 2020, 18, 505–520. [Google Scholar] [CrossRef]
- Ishfaq, M.; Farooq, M.; Zulfiqar, U.; Hussain, S.; Akbar, N.; Nawaz, A.; Anjum, S.A. Alternate wetting and drying: A water-saving and ecofriendly rice production system. Agric. Water Manag. 2020, 241, 106363. [Google Scholar] [CrossRef]
- Zhou, S.; Park, W.A.; Lintner, B.R.; Berg, A.M.; Zhang, Y.; Keenan, T.F.; Cook, B.I.; Hagemann, S.; Seneviratne, S.I.; Gentine, P. Soil moisture–atmosphere feedbacks mitigate declining water availability in drylands. Nat. Clim. Change 2021, 11, 38–44. [Google Scholar] [CrossRef]
- Zhang, W.; Yu, J.; Xu, Y.; Wang, Z.; Liu, L.; Zhang, H.; Gu, J.; Zhang, J.; Yang, J. Alternate wetting and drying irrigation combined with the proportion of polymer-coated urea and conventional urea rates increases grain yield, water and nitrogen use efficiencies in rice. Field Crops Res. 2021, 268, 108165. [Google Scholar] [CrossRef]
- Ye, Y.S.; Liang, X.Q.; Chen, Y.X.; Liu, J.; Gu, J.T.; Guo, R.; Li, L. Alternate wetting and drying irrigation and controlled-release nitrogen fertilizer in late-season rice. Effects on dry matter accumulation, yield, water and nitrogen use. Field Crops Res. 2013, 144, 212–224. [Google Scholar] [CrossRef]
- Hao, M.; Guo, L.J.; Du, X.Z.; Wang, H.L.; Sheng, F.; Li, C.F. Integrated effects of microbial decomposing inoculant on greenhouse gas emissions, grain yield and economic profit from paddy fields under different water regimes. Sci. Total Environ. 2022, 805, 150295. [Google Scholar] [CrossRef]
- Arai, H. Increased rice yield and reduced greenhouse gas emissions through alternate wetting and drying in a triple-cropped rice field in the Mekong Delta. Sci. Total Environ. 2022, 842, 156958. [Google Scholar] [CrossRef]
- Sha, Y.; Chi, D.; Chen, T.; Wang, S.; Zhao, Q.; Li, Y.; Sun, Y.; Chen, J.; Laerke, P.E. Zeolite application increases grain yield and mitigates greenhouse gas emissions under alternate wetting and drying rice system. Sci. Total Environ. 2022, 838, 156067. [Google Scholar] [CrossRef]
- Van Gestel, M.; Merckx, R.; Vlassak, K. Microbial biomass responses to soil drying and rewetting: The fate of fast- and slow-growing microorganisms in soils from different climates. Soil Biol. Biochem. 1993, 25, 109–123. [Google Scholar] [CrossRef]
- Gordon, H.; Haygarth, P.M.; Bardgett, R.D. Drying and rewetting effects on soil microbial community composition and nutrient leaching. Soil Biol. Biochem. 2008, 40, 302–311. [Google Scholar] [CrossRef]
- Moyano, F.E.; Manzoni, S.; Chenu, C. Responses of soil heterotrophic respiration to moisture availability: An exploration of processes and models. Soil Biol. Biochem. 2013, 59, 72–85. [Google Scholar] [CrossRef]
- Denef, K.; Six, J.; Bossuyt, H.; Frey, S.D.; Elliott, E.T.; Merckx, R.; Paustian, K. Influence of dry-wet cycles on the interrelationship between aggregate, particulate organic matter, and microbial community dynamics. Soil Biol. Biochem. 2001, 33, 1599–1611. [Google Scholar] [CrossRef]
- Meng, J.; He, T.; Sanganyado, E.; Lan, Y.; Zhang, W.; Han, X.; Chen, W. Development of the straw biochar returning concept in China. Biochar 2019, 1, 139–149. [Google Scholar] [CrossRef]
- Wang, C.; Liu, J.; Shen, J.; Chen, D.; Li, Y.; Jiang, B.; Wu, J. Effects of biochar amendment on net greenhouse gas emissions and soil fertility in a double rice cropping system: A 4-year field experiment. Agric. Ecosyst. Environ. 2018, 262, 83–96. [Google Scholar] [CrossRef]
- Singh, H.; Northup, B.K.; Rice, C.W.; Prasad, P.V.V. Biochar applications influence soil physical and chemical properties, microbial diversity, and crop productivity: A meta-analysis. Biochar 2022, 4, 8. [Google Scholar] [CrossRef]
- Zhang, Q.; Duan, P.; Gunina, A.; Zhang, X.; Yan, X.; Kuzyakov, Y.; Xiong, Z. Mitigation of carbon dioxide by accelerated sequestration from long-term biochar amended paddy soil. Soil Tillage Res. 2021, 209, 104955. [Google Scholar] [CrossRef]
- Bi, Y.; Cai, S.; Wang, Y.; Zhao, X.; Wang, S.; Xing, G.; Zhu, Z. Structural and microbial evidence for different soil carbon sequestration after four-year successive biochar application in two different paddy soils. Chemosphere 2020, 254, 126881. [Google Scholar] [CrossRef]
- Yang, X.; Meng, J.; Lan, Y.; Chen, W.; Yang, T.; Yuan, J.; Liu, S.; Han, J. Effects of maize stover and its biochar on soil CO2 emissions and labile organic carbon fractions in Northeast China. Agric. Ecosyst. Environ. 2017, 240, 24–31. [Google Scholar] [CrossRef]
- Ma, L.; Lv, X.; Cao, N.; Wang, Z.; Zhou, Z.; Meng, Y. Alterations of soil labile organic carbon fractions and biological properties under different residue-management methods with equivalent carbon input. Appl. Soil Ecol. 2021, 161, 103821. [Google Scholar] [CrossRef]
- Li, G.; Khan, S.; Ibrahim, M.; Sun, T.-R.; Tang, J.-F.; Cotner, J.B.; Xu, Y.-Y. Biochars induced modification of dissolved organic matter (DOM) in soil and its impact on mobility and bioaccumulation of arsenic and cadmium. J. Hazard. Mater. 2018, 348, 100–108. [Google Scholar] [CrossRef] [PubMed]
- Chen, D.; Guo, H.; Li, R.; Li, L.; Pan, G.; Chang, A.; Joseph, S. Low uptake affinity cultivars with biochar to tackle Cd-tainted rice—A field study over four rice seasons in Hunan, China. Sci. Total Environ. 2016, 541, 1489–1498. [Google Scholar] [CrossRef]
- Li, Y.; Zheng, J.; Wu, Q.; Gong, X.; Zhang, Z.; Chen, Y.; Chen, T.; Siddique, K.H.M.; Chi, D. Zeolite increases paddy soil potassium fixation, partial factor productivity, and potassium balance under alternate wetting and drying irrigation. Agric. Water Manag. 2022, 260, 107294. [Google Scholar] [CrossRef]
- Bao, S.D. Soil and Agricultural Chemistry Analysis; China Agriculture Press: Beijing, China, 2000. [Google Scholar]
- Ghani, A.; Dexter, M.; Perrott, K.W. Hot-water extractable carbon in soils: A sensitive measurement for determining impacts of fertilisation, grazing and cultivation. Soil Biol. Biochem. 2003, 35, 1231–1243. [Google Scholar] [CrossRef]
- Wu, J.; Joergensen, R.G.; Pommerening, B.; Chaussod, R.; Brookes, P.C. Measurement of soil microbial biomass C by fumigation—extraction—An automated procedure. Soil Biol. Biochem. 1990, 22, 1167–1169. [Google Scholar] [CrossRef]
- Cambardella, C.A.; Elliott, E.T. Particulate Soil Organic-Matter Changes across a Grassland Cultivation Sequence. Soil Sci. Soc. Am. J. 1992, 56, 777–783. [Google Scholar] [CrossRef]
- Gregorich, E.; Janzen, H. Storage of soil carbon in the light fraction and macro-organic matter. In Structure and Organic Matter Storage in Agricultural Soils; CRC Press: Boca Raton, FL, USA, 1996; pp. 167–192. [Google Scholar]
- Yan, M.; Junzeng, X.; Qi, W.; Shihong, Y.; Linxian, L.; Suyan, C.; Qi, L. Organic carbon content and its liable components in paddy soil under water-saving irrigation. Plant Soil Environ. 2017, 63, 125–130. [Google Scholar]
- Livsey, J.; Kätterer, T.; Vico, G.; Lyon, S.W.; Lindborg, R.; Scaini, A.; Da, C.T.; Manzoni, S. Do alternative irrigation strategies for rice cultivation decrease water footprints at the cost of long-term soil health? Environ. Res. Lett. 2019, 14, 074011. [Google Scholar] [CrossRef]
- Maneepitak, S.; Ullah, H.; Datta, A.; Shrestha, R.P.; Shrestha, S. Effect of Water and Rice Straw Management Practices on Soil Organic Carbon Stocks in a Double-Cropped Paddy Field. Commun. Soil Sci. Plant Anal. 2019, 50, 2330–2342. [Google Scholar] [CrossRef]
- Xu, Y.; Zhan, M.; Cao, C.; Ge, J.; Ye, R.; Tian, S.; Cai, M. Effects of irrigation management during the rice growing season on soil organic carbon pools. Plant Soil 2017, 421, 337–351. [Google Scholar] [CrossRef]
- Oliver, V.; Cochrane, N.; Magnusson, J.; Brachi, E.; Monaco, S.; Volante, A.; Courtois, B.; Vale, G.; Price, A.; Teh, Y.A. Effects of water management and cultivar on carbon dynamics, plant productivity and biomass allocation in European rice systems. Sci. Total Environ. 2019, 685, 1139–1151. [Google Scholar] [CrossRef] [PubMed]
- Swails, E.; Jaye, D.; Verchot, L.; Hergoualc’h, K.; Schirrmann, M.; Borchard, N.; Wahyuni, N.; Lawrence, D. Will CO2 Emissions from Drained Tropical Peatlands Decline Over Time? Links Between Soil Organic Matter Quality, Nutrients, and C Mineralization Rates. Ecosystems 2018, 21, 868–885. [Google Scholar] [CrossRef]
- Pascual, V.J.; Wang, Y.-M. Utilizing rainfall and alternate wetting and drying irrigation for high water productivity in irrigated lowland paddy rice in southern Taiwan. Plant Prod. Sci. 2016, 20, 24–35. [Google Scholar] [CrossRef]
- Tian, J.; Pausch, J.; Fan, M.; Li, X.; Tang, Q.; Kuzyakov, Y. Allocation and dynamics of assimilated carbon in rice-soil system depending on water management. Plant Soil 2013, 363, 273–285. [Google Scholar] [CrossRef]
- Situ, G.; Zhao, Y.; Zhang, L.; Yang, X.; Chen, D.; Li, S.; Wu, Q.; Xu, Q.; Chen, J.; Qin, H. Linking the chemical nature of soil organic carbon and biological binding agent in aggregates to soil aggregate stability following biochar amendment in a rice paddy. Sci. Total Environ. 2022, 847, 157460. [Google Scholar] [CrossRef] [PubMed]
- Wang, J.; Xiong, Z.; Kuzyakov, Y. Biochar stability in soil: Meta-analysis of decomposition and priming effects. Glob. Change Biol. Bioenergy 2016, 8, 512–523. [Google Scholar] [CrossRef]
- Luo, Y.; Durenkamp, M.; De Nobili, M.; Lin, Q.; Brookes, P.C. Short term soil priming effects and the mineralisation of biochar following its incorporation to soils of different pH. Soil Biol. Biochem. 2011, 43, 2304–2314. [Google Scholar] [CrossRef]
- Singh, B.P.; Cowie, A.L.; Smernik, R.J. Biochar carbon stability in a clayey soil as a function of feedstock and pyrolysis temperature. Environ. Sci. Technol. 2012, 46, 11770–11778. [Google Scholar] [CrossRef]
- Naisse, C.; Girardin, C.; Lefevre, R.; Pozzi, A.; Maas, R.; Stark, A.; Rumpel, C. Effect of physical weathering on the carbon sequestration potential of biochars and hydrochars in soil. Glob. Change Biol. Bioenergy 2015, 7, 488–496. [Google Scholar] [CrossRef]
- Lehmann, J.; Rillig, M.C.; Thies, J.; Masiello, C.A.; Hockaday, W.C.; Crowley, D. Biochar effects on soil biota—A review. Soil Biol. Biochem. 2011, 43, 1812–1836. [Google Scholar] [CrossRef]
- Buss, W.; Shepherd, J.G.; Heal, K.V.; Masek, O. Spatial and temporal microscale pH change at the soil-biochar interface. Geoderma 2018, 331, 50–52. [Google Scholar] [CrossRef]
- Han, L.; Sun, K.; Yang, Y.; Xia, X.; Li, F.; Yang, Z.; Xing, B. Biochar’s stability and effect on the content, composition and turnover of soil organic carbon. Geoderma 2020, 364, 114184. [Google Scholar] [CrossRef]
- Zhang, Q.; Song, Y.; Wu, Z.; Yan, X.; Gunina, A.; Kuzyakov, Y.; Xiong, Z. Effects of six-year biochar amendment on soil aggregation, crop growth, and nitrogen and phosphorus use efficiencies in a rice-wheat rotation. J. Clean. Prod. 2020, 242, 118435. [Google Scholar] [CrossRef]
- Jastrow, J.D.; Miller, R.M.; Lussenhop, J. Contributions of interacting biological mechanisms to soil aggregate stabilization in restored prairie. Soil Biol. Biochem. 1998, 30, 905–916. [Google Scholar] [CrossRef]
- Kamran, M.; Huang, L.; Nie, J.; Geng, M.; Lu, Y.; Liao, Y.; Zhou, F.; Xu, Y. Effect of reduced mineral fertilization (NPK) combined with green manure on aggregate stability and soil organic carbon fractions in a fluvo-aquic paddy soil. Soil Tillage Res. 2021, 211, 105005. [Google Scholar] [CrossRef]
- Zhao, M.; Zhou, J.; Kalbitz, K. Carbon Mineralization and Properties of Water-Extractable Organic Carbon in Soils of the South Loess Plateau in China. Eur. J. Soil Biol. 2008, 44, 158. [Google Scholar] [CrossRef]
- Sun, Q.; Yang, X.; Bao, Z.; Gao, J.; Meng, J.; Han, X.; Lan, Y.; Liu, Z.; Chen, W. Responses of microbial necromass carbon and microbial community structure to straw- and straw-derived biochar in brown earth soil of Northeast China. Front. Microbiol. 2022, 13, 967746. [Google Scholar] [CrossRef]
- Yang, X.; Wang, D.; Lan, Y.; Meng, J.; Jiang, L.; Sun, Q.; Cao, D.; Sun, Y.; Chen, W. Labile organic carbon fractions and carbon pool management index in a 3-year field study with biochar amendment. J. Soils Sediments 2017, 18, 1569–1578. [Google Scholar] [CrossRef]
- Dong, X.; Singh, B.P.; Li, G.; Lin, Q.; Zhao, X.; Aitkenhead, M. Biochar has little effect on soil dissolved organic carbon pool 5 years after biochar application under field condition. Soil Use Manag. 2019, 35, 466–477. [Google Scholar] [CrossRef]
- Zimmerman, A.R. Abiotic and microbial oxidation of laboratory-produced black carbon (biochar). Environ. Sci. Technol. 2010, 44, 1295–1301. [Google Scholar] [CrossRef]
- Mandal, S.; Sarkar, B.; Bolan, N.; Novak, J.; Ok, Y.S.; Van Zwieten, L.; Singh, B.P.; Kirkham, M.B.; Choppala, G.; Spokas, K.; et al. Designing advanced biochar products for maximizing greenhouse gas mitigation potential. Crit. Rev. Environ. Sci. Technol. 2016, 46, 1367–1401. [Google Scholar] [CrossRef]
- Leng, L.; Xu, X.; Wei, L.; Fan, L.; Huang, H.; Li, J.; Lu, Q.; Li, J.; Zhou, W. Biochar stability assessment by incubation and modelling: Methods, drawbacks and recommendations. Sci. Total Environ. 2019, 664, 11–23. [Google Scholar] [CrossRef]
- Major, J.; Lehmann, J.; Rondon, M.; Goodale, C. Fate of soil-applied black carbon: Downward migration, leaching and soil respiration. Glob. Change Biol. 2010, 16, 1366–1379. [Google Scholar] [CrossRef]
- Yin, Y.-f.; He, X.-h.; Gao, R.; Ma, H.-l.; Yang, Y.-s. Effects of Rice Straw and Its Biochar Addition on Soil Labile Carbon and Soil Organic Carbon. J. Integr. Agric. 2014, 13, 491–498. [Google Scholar] [CrossRef]
- Dai, W.; Bao, Z.; Meng, J.; Chen, T.; Zhang, W.; Chen, Y.; Lin, L.; Su, X.; Jiang, X. Biochar incorporation increases grain yield, net ecosystem CO2 exchange, and decreases CH4 emissions in an alternate wetting and drying paddy ecosystem. Environ. Technol. Innov. 2024, 34, 103577. [Google Scholar] [CrossRef]
- Liang, Q.; Chen, H.; Gong, Y.; Fan, M.; Yang, H.; Lal, R.; Kuzyakov, Y. Effects of 15 years of manure and inorganic fertilizers on soil organic carbon fractions in a wheat-maize system in the North China Plain. Nutr. Cycl. Agroecosystems 2012, 92, 21–33. [Google Scholar] [CrossRef]
- Hale, L.; Luth, M.; Crowley, D. Biochar characteristics relate to its utility as an alternative soil inoculum carrier to peat and vermiculite. Soil Biol. Biochem. 2015, 81, 228–235. [Google Scholar] [CrossRef]
- Oladele, S.O.; Adetunji, A.T. Agro-residue biochar and N fertilizer addition mitigates CO2-C emission and stabilized soil organic carbon pools in a rain-fed agricultural cropland. Int. Soil Water Conserv. Res. 2021, 9, 76–86. [Google Scholar] [CrossRef]
- Yang, C.; Yang, L.; Ouyang, Z. Organic carbon and its fractions in paddy soil as affected by different nutrient and water regimes. Geoderma 2005, 124, 133–142. [Google Scholar] [CrossRef]
- Abiven, S.; Hund, A.; Martinsen, V.; Cornelissen, G. Biochar amendment increases maize root surface areas and branching: A shovelomics study in Zambia. Plant Soil 2015, 395, 45–55. [Google Scholar] [CrossRef]
- Burrell, L.D.; Zehetner, F.; Rampazzo, N.; Wimmer, B.; Soja, G. Long-term effects of biochar on soil physical properties. Geoderma 2016, 282, 96–102. [Google Scholar] [CrossRef]
- Christensen, B.T. Physical fractionation of soil and structural and functional complexity in organic matter turnover. Eur. J. Soil Sci. 2001, 52, 345–353. [Google Scholar] [CrossRef]
- Jiang, M.; Li, C.; Gao, W.; Cai, K.; Tang, Y.; Cheng, J. Comparison of long-term effects of biochar application on soil organic carbon and its fractions in two ecological sites in karst regions. Geoderma Reg. 2022, 28, e00477. [Google Scholar] [CrossRef]
- Liang, C.; Schimel, J.P.; Jastrow, J.D. The importance of anabolism in microbial control over soil carbon storage. Nat. Microbiol. 2017, 2, 17105. [Google Scholar] [CrossRef]
- Sokol, N.W.; Bradford, M.A. Microbial formation of stable soil carbon is more efficient from belowground than aboveground input. Nat. Geosci. 2019, 12, 46–53. [Google Scholar] [CrossRef]
Disclaimer/Publisher’s Note: The statements, opinions and data contained in all publications are solely those of the individual author(s) and contributor(s) and not of MDPI and/or the editor(s). MDPI and/or the editor(s) disclaim responsibility for any injury to people or property resulting from any ideas, methods, instructions or products referred to in the content. |
© 2025 by the authors. Licensee MDPI, Basel, Switzerland. This article is an open access article distributed under the terms and conditions of the Creative Commons Attribution (CC BY) license (https://creativecommons.org/licenses/by/4.0/).