Article

Crop Water Requirement Estimated with Data-Driven Models Improves the Reliability of CROPWAT 8.0 and the Water Footprint of Processing Tomato Grown in a Hot-Arid Environment

Department of Agricultural, Food and Forest Sciences, University of Palermo, Viale delle Scienze, 13, Building 4, 90128 Palermo, Italy
*
Author to whom correspondence should be addressed.
Agronomy 2025, 15(7), 1533; https://doi.org/10.3390/agronomy15071533
Submission received: 23 May 2025 / Revised: 23 June 2025 / Accepted: 23 June 2025 / Published: 24 June 2025
(This article belongs to the Section Water Use and Irrigation)

Abstract

The determination of the actual crop water requirement (CWR) today represents an important prerogative for combating climate change. A three-year trial was conducted to ad-dress the need to provide adequate support to processing tomato growers in defining the correct amounts of water to be supplied. In fact, the objective of this work was to calculate the water requirement of processing tomatoes, specifically analyzing their irrigation needs using the CROPWAT 8.0 software and through capacitive and tensiometric probes. Furthermore, for both methods, the tomato yield was evaluated both by supplying 100% of its water requirement and by supplying, through regulated deficit irrigation (RDI), 70% of its water requirement. Subsequently, for each irrigation strategy employed and for each CWR calculation method, the water footprint was calculated by analyzing the blue, green, and grey components. In the years 2022 and 2023, there was an overestimation of CWR of 13.5% for IR100 and 13.94% for IR70, and 14.53% for IR100 and 11.65% for IR70, respectively, while in 2024 there was an underestimation, with values of 9.17% and 5.22% for the IR100 and IR70 treatments compared to the values obtained with the probes. The total WF of tomatoes varied between 33.42 and 51.91 m3 t−1 with the CROPWAT model and between 35.82 and 47.19 m3 t−1 with the probes for IR100, while for RDI70, the values ranged between 38.72 and 59.44 m3 t−1 with the CROPWAT method and between 35.81 and 53.95 m3 t−1 with the probe method. In water-scarce regions, integrating the CROPWAT 8.0 model (enhanced with real-world data) and implementing smart systems can significantly improve water management, refine decision-making processes, and mitigate environmental impacts. This approach directly addresses the urgent need for water security within sustainable agriculture.

1. Introduction

Processing tomato cultivation represents a highly significant economic sector for numerous nations, particularly within the Mediterranean basin. In Europe, Italy holds the position of the largest producer, with a cultivated area of 99,000 ha and a production exceeding 6,016,050 tons [1]. These data highlight the sector’s importance and explain the large number of companies operating in the production of tomato-based sauces, concentrates, juices, and preserves [2]. Due to increasingly unpredictable climatic conditions, processing tomato growers today face multiple challenges primarily related to climate change [3]. Compared to other regions in the Mediterranean basin, Italy has been experiencing the effects of rising average temperatures and decreasing rainfall for several years [4], leading to frequent periods of drought. Indeed, the growing scarcity of freshwater is becoming a social and economic problem for policymakers and direct users of water resources. Agriculture is considered one of the main consumers of freshwater globally; in fact, it is estimated to consume 87% of this crucial resource [5]. Furthermore, the quantity and quality of freshwater, in addition to climate change, will be exacerbated by increased agricultural and industrial use to support a continuously growing global population [6]. Given that water resources will become increasingly limited for the agricultural sector, it will be essential to improve efficiency, water use productivity, and irrigation scheduling. Current strategies mainly involve measures that tend to supply crops with less water than their actual requirements without compromising yields [7,8,9]. In fact, the implementation of an appropriate irrigation methodology and the maintenance of optimal soil moisture levels are fundamental for achieving higher yields, improving water productivity (WP), and conserving water resources. Among deficit irrigation strategies, regulated deficit irrigation (RDI) aims to provide adequate water only during critical development periods that can influence yields and reduce water supply during less-sensitive phenological stages [10,11]. The effectiveness of the RDI technique varies depending on seasonal weather conditions, cultivation site, genotype, fertilization management, and the timing of deficit induction [12,13,14]. Although conflicting data exist in the literature regarding yields [15] and WP [16], most authors agree on the qualitative improvement of tomato fruits irrigated with the RDI strategy [12,14,17]. However, irrigation strategy alone cannot solve the problems related to excessive water use; today, for the determination of the correct amount of water to be supplied to crops, smart systems can be used, which accurately and instantaneously provide soil moisture values. In situ measurements of volumetric soil water content and matric potential values using remotely communicating sensors [18] could represent an innovative approach to determine crop water consumption, overcoming the issues related to the calculation of ETc using the FAO method [19]. However, the use of these sensors is still limited due to cost and the difficult collection and interpretation of data [20]. Furthermore, their correct use presupposes knowledge of the hydrological constants in the soil profile affected by the root system. To overcome some of these limitations, for the estimation of crop water requirements and irrigation demand, researchers and farmers increasingly rely on simulation models [21]. A notable model for the knowledge of crop water requirement (CWR) and irrigation needs is CROPWAT 8.0, developed by the Food and Agriculture Organization (FAO) [22]. Several authors have used this model to effectively explore CWR and irrigation scheduling in a wide range of crops and different climatic conditions [23,24,25,26]. Despite these efforts, gaps in studies on the accuracy of different models persist. Another issue regarding the correct estimation of CWR concerns the environmental impact of water resources. The concept of “water footprint” (WF) has been defined to raise social awareness of water use and to analyze the relationship between human consumption habits and their impact on natural resources [27]. Since most of the water in food production is consumed during the cultivation phase, it is important to quantify the WF of agricultural practices in order to use it as a decision-making tool and for certifications and labels of agricultural products [28,29]. The WF consists of three components: blue, green, and grey [30]. The blue component refers to the consumptive (mainly evaporative) use of water from surface and groundwater sources. In irrigated agriculture, this component would reflect the amount of water applied through irrigation that has been used in the evapotranspiration process. Blue water volumes do not necessarily coincide with applied irrigation volumes, as the term “water use” refers only to water used in the evapotranspiration process, and that does not return to its source. The green component refers to the amount of rainwater stored in the soil that is used in the evapotranspiration process, while the grey component refers to the volume of freshwater required to dilute pollutants discharged into water bodies due to irrigation [27]. Although accurate WF estimates for processing tomatoes in the Mediterranean region exist [31,32,33], the high variability of pedoclimatic conditions and agronomic management generates some uncertainty. A typical example is the WF estimation under non-limiting soil water supply conditions without analyzing the impact of the irrigation strategy (RDI) or the CWR calculation method. Moreover, models and software tend to overestimate crop water demand, especially under extreme climatic conditions. Based on the above, a three-year trial was conducted to address the need to provide adequate support to processing tomato growers in defining the correct amounts of water to be supplied. In fact, the objective of this work was to calculate the water requirement of processing tomatoes, specifically analyzing their irrigation needs using the CROPWAT 8.0 software and through capacitive and tensiometric probes. Furthermore, for both methods, the tomato yield was evaluated both by supplying 100% of its water requirement and by supplying, through regulated deficit irrigation (RDI), 70% of its water requirement. Subsequently, for each irrigation strategy employed and for each CWR calculation method, the water footprint was calculated by analyzing the blue, green, and grey components. This approach affirmed the importance of site-specific data and enabled a complete overview of processing tomatoes. It facilitated the evaluation of water impacts across each phase and yielded crucial insights into the environmental footprint of processing tomato in a Mediterranean context.

2. Materials and Methods

2.1. Exsperimental Sites

The research was conducted during the spring–summer seasons of 2022, 2023, and 2024. The experimental sites for 2022 and 2023 were located near Castelvetrano (TP, Sicily, Italy) at the “Campo Carboj” experimental farm (37°51′17″ N, 12°53′40″ E; altitude 30 m a.s.l.) owned by the Ente di Sviluppo Agricolo (ESA) of the Sicilian Region. Although the trials for both years were conducted within the same experimental farm, they were carried out in different zones of the property, which exhibited distinct structural characteristics. The experimental site for 2024 was located near Termini Imerese (PA, Sicily, Italy) at the private farm “Buonfornello” (37°58′31″ N, 12°49′07″ E; altitude 10 m a.s.l.). The physico-chemical characteristics of the soils at experimental sites are reported in Table 1. Soil samples were collected prior to transplanting and following soil tillage operations. Undisturbed samples were taken using steel cylinders. The reported values represent the average of samples collected along the two diagonals of each experimental plot and year, with a total of 20 observations for each sampling time.

2.2. Plant Material and Crop Management

For all three experimental years, the processing tomato variety “Tayson F1” (BASF, nunhems®, Nunhem, The Netherlands), characterized by elongated fruits and a medium-early cycle, was used. Transplanting of the seedlings, with three/four true leaves, was carried out on 8 June 2022, 12 June 2023, and 24 May 2024. The planting layout was a twin-row system of 1.70 m with a planting density of 3.3 plants m−2 (0.40 m between rows, 0.40 m within the row). The experimental trials were organized in a randomized block design with three replicates, with each plot covering 1600 m2. The fertilization plan, in all study years, involved the application, via a fertigation system, of 140 kg ha−1 of N, 170 kg ha−1 of P2O5, 200 kg ha−1 of K2O, and 70 kg ha−1 of CaO. Weed, pest, and disease control was carried out following the integrated pest management guidelines of the Sicilian Region. Tomato fruits were harvested manually when the rate of ripe fruits reached approximately 95% (13 September 2022, 13 September 2023, 22 August 2024). Additionally, Table 2 reports the lengths of the developmental stages considered in the Kc model. For each phenological stage, growing degree days (GDD) were also calculated according to Pathak and Stoddard (2018) [34] and using a base temperature of 10 °C.

2.3. Meteorological Data

Meteorological data were collected from an on-site ATMOS 41 weather station (METER Group, Pullman, WA, USA). ATMOS 41 measures twelve meteorological variables, including air temperature, relative humidity, vapor pressure, barometric pressure, wind speed and direction, solar radiation, precipitation, and lightning. The station was connected to a ZL6 datalogger (METER Group, Pullman, WA, USA), specifically designed to collect data from environmental sensors. The datalogger transfers data to the Cloud via a Subscriber Identity Module. Its operation is powered by six NiMH batteries charged by solar cells.

2.4. Determination of Soil Hydrological Properties

The volumetric soil water content, θ (m3 m−3), at a pressure head value, h (m), of −1 m, corresponding to field capacity (FC), was determined by the pressure plate extractors [35]. For each treatment, two replicated samples were prepared by compacting the 2 mm fraction into cylindrical samplers, with a diameter of 5 cm and a height of 1 cm, at the bulk density values measured in the undisturbed soil. Equilibrium with the applied pressure head was assumed when the samples stopped draining for at least 24 hrs. The volumetric water content at equilibrium was determined by the thermogravimetric method, after oven-drying the samples at 105 °C until constant weight, typically reached within 24 h. All the measurements were performed under controlled conditions, setting the temperature at 22 ± 1 °C.
Table 3 shows the volumetric water content at field capacity, θFC, and at the irrigation point, θIP, corresponding to matric potential values of −0.01 bar and −0.40 bar, respectively, for each experimental plot.

2.5. Irrigation Management

Two irrigation regimes were studied: (i) Full irrigation (IR100), restoring the soil water content to 100% of field capacity; (ii) regulated deficit irrigation (RDI70), restoring the soil water content to 70% of field capacity from transplanting to the appearance of the first flower (BBCH 51). Once the first flower appearance stage was reached and until fruit enlargement (BBCH 71), the restoration followed the IR100 schedule, while from fruit enlargement to harvest (BBCH 89), the irrigation regime involved restoring 70% of field capacity. A self-compensating drip irrigation system was adopted, positioned along each row of the twin rows. Emitters were spaced 0.20 m apart and had a flow rate of 2 l h−1. Additionally, volumetric flow meters were used to monitor the volumes distributed for each irrigation scheduling method.

2.6. Restoration of Crop Water Requirement via Probes

For each experimental plot, the volume of water to be supplied was determined by considering the amount of available water in the soil layer affected by the root system. For each replicate, the available water content was monitored daily by reading TEROS 10 and 12 capacitive and tensiometric probes (METER Group, Inc., Munich, Germany formerly Decagon Devices, Inc., Pullman, WA, USA) positioned at depths of 0–0.20 m, 0.20–0.40 m, and 0.40–0.60 m along the soil profile. Additionally, the soil matric potential at a depth of 0–0.40 m was monitored using a TEROS 21 probe (METER Group, Inc., Munich, Germany formerly Decagon Devices, Inc., Pullman, WA, USA). TEROS 10 probes exhibit an accuracy for volumetric water content (VWC) of ± 0.03 m3/m3. TEROS 12 probes offer an accuracy for volumetric water content (VWC) of ± 0.03 m3/m3, for temperature of ±0.5 °C, and for bulk electrical conductivity of ± (5% of reading +10 μS/cm). TEROS 21 probes provide an accuracy for water potential of ± (10% of reading +2 kPa) (typically from −9 to −100 kPa) and for temperature of ±1.0 °C. The probes were connected to a ZL6 datalogger (METER Group, Pullman, WA, USA), specifically designed to collect data from environmental sensors. The datalogger transfers data to the Cloud via a Subscriber Identity Module. Its operation is powered by six NiMH batteries charged by solar cells. Capacitive, tensiometric, and matric potential probes continuously recorded data. Measurements were acquired every 15 min. Therefore, the study did not involve a fixed irrigation schedule. At the beginning of the trial, all treatments were irrigated to field capacity to ensure uniform initial soil moisture conditions. Irrigation was applied, according to the defined regime, when the soil water content (SWC) approached values corresponding to a soil matric potential of −0.40 bar, in order to restore SWC to field capacity. The −0.40 bar threshold was defined as the irrigation point (θIP), and under the Full irrigation (IR100) strategy, the volume of water supplied was calculated as the difference between the soil water content at θFC and at θIP, over a rooting depth (D) of 0.60 m (Equation (1)). In the deficit irrigation (DI) strategy, 70% of the volume required for Full irrigation was applied to restore the soil profile to the desired water content (Equation (2)).
SWC = (θFC − θIP) × D
SWC(DI) = 0.70 × (θFC − θIP) × D

2.7. CROPWAT 8.0 Model

CROPWAT 8.0 is a computer-based decision support program based on a series of equations, developed by the FAO to calculate reference evapotranspiration (ET0), crop water requirement (CWR), irrigation scheduling, and irrigation requirement (IR), using data related to rainfall, soil, crops, and climate. The program includes general data on various crop characteristics, local climate, and soil properties and helps to improve irrigation schedules and the calculation of water supply for different cropping patterns under irrigated and rainfed conditions [36].

2.7.1. Irrigation Based on the CROPWAT 8.0 Model

The model determines reference evapotranspiration (ET0) and CWR using input variables related to a variety of climatic, rainfall, crop, and soil parameters [37]. It employs the Penman–Monteith approach, a well-established and widely recognized method, renowned for its robustness and comprehensiveness in estimating both ET0 and CWR [19,38]. In the present research, all input data for the CROPWAT 8.0 model were accumulated and measured prior to the start of the experiment. An individual IR100 and RDI70 schedule for the three years was predetermined using the CROPWAT 8.0 model for tomatoes based on a comprehensive dataset.

2.7.2. Input Data Related to Climate

The average monthly meteorological data for the 3 years of the experimental trial were acquired from an on-site ATMOS 41 weather station. The average input data, for the three years of study, concerning various climatic parameters, namely minimum temperature (°C), maximum temperature (°C), humidity (%), wind speed (m s−1), sunshine hours, and precipitation (mm), are represented in Figures S1–S3. For the calculation of effective rainfall, the USDA-SCS method integrated into the CROPWAT 8.0 model was chosen [39]. The effective rainfall values for the year under study (2022, 2023, 2024) are reported in Figures S4–S6.

2.7.3. Input Data Related to Crop and Soil

All data pertaining to tomato crop information, which included crop coefficient (Kc) values, crop growth stages (days), rooting depth (m), critical depletion (fraction of total available water), yield response factor, crop height (m), sowing date, and transplanting date, were measured and manually entered for each year of the experimental trial and for each irrigation strategy (Figures S7–S9). The Kc values for each phenological phase were determined from the ratio between crop evapotranspiration (ETc) and reference evapotranspiration (ET0) [19] and were obtained from the Full irrigation (IR100) treatment data. ETc was calculated using the soil water balance method, according to the FAO-56 approach (Equation (3)), while ET0 was derived, using the Penman–Monteith equation, from the climatic variables recorded by the on-site weather station. All input data related to soil parameters, namely total available soil moisture (mm m−1), maximum infiltration rate of rainfall (mm day−1), maximum rooting depth (m), initial soil moisture depletion (%), and initial soil moisture (mm m−1), were measured for each irrigation strategy and for all experimental years and were manually incorporated (Figure S10). The data related to soil parameters for the year 2022 did not change for the two irrigation strategies.
ETc = P + I − R − D − ∆S
where P is effective precipitation (mm), I is irrigation (mm), R is surface runoff (mm), D is deep percolation (mm), and ΔS is the change in soil water storage (mm) over the crop root zone.
However, under our well-drained field conditions and controlled irrigation management, surface runoff (R) and deep percolation (D) were negligible and therefore assumed to be zero.

2.8. Water Footprint

The water footprint (WF) provides a comprehensive framework for analyzing the link between human water consumption and global freshwater resources. The main reference standards for the assessment and calculation of WF are reported in the international standard UNI EN ISO 14046: “Environmental management—Water footprint, principles, requirements and guidelines” [40]. For the calculation of WFtotal, the guidelines of The Water Footprint Assessment Manual [30] were followed, and it was calculated as the sum of the green (WFgreen), blue (WFblue), and grey (WFgrey) components.
WFtotal = WFblue + WFgreen + WFgrey
Specifically, the WFgreen (m3 kg−1 and m3 L−1) was calculated as follows:
WFgreen = CWUgreen/Y
where CWUgreen (m3 ha−1) represents the green water consumption of the crop, and Y is the yield in kg ha−1. CWUgreen is calculated according to the following equation:
CWUgreen = 10 × ∑lgpd=1 ETgreen
where ETgreen (mm day−1) is the daily green evapotranspiration. ETgreen was calculated as the minimum crop water requirement (CWR, mm year−1) and effective precipitation (Peff, mm year−1) [41]:
CWU = 10 × ∑lgpd=1 ETc
where CWU was calculated from crop evapotranspiration (ETc, mm day−1) and the length of the growing period in days (lgp).
The blue component (WFblue) (m3 kg−1 and m3 L−1) is calculated with the following equation:
WFblue = CWUblue/Y
where CWUblue (blue water consumption) is calculated by the following equation:
CWUblue = 10 × ∑ lgpd=1 ETblue
where ETblue (mm day−1) is the daily blue evapotranspiration. ETblue was estimated from the irrigation requirement (IR) rates as the minimum between IR (m3 year−1) and the effective irrigation volume (Ieff, m3 ha−1 year−1) [41]. IR was calculated as a constant value for the analyzed systems according to the following equation:
IR = max (0; CWR − Peff)
The grey component (WFgrey) was calculated according to the following equation [30]:
WFgrey = ((α × AR)/(cmax − cnat))/Y
where AR is the chemical application rate to the field per hectare (kg ha−1); α is the leaching-runoff fraction; cmax is the maximum acceptable concentration for the considered pollutant (kg m−3); cnat is the natural concentration of the considered pollutant (kg m−3); Y is the crop yield (kg ha−1). The pollutants are represented by fertilizers (nitrogen, phosphorus, and other), pesticides, and insecticides. As recommended by Hoekstra et al., (2011) [30], we considered only the most critical pollutant, which is nitrogen, for which a leaching rate of 0.1 is assumed, as the experimental fields are located on flat soils [42].

3. Results

3.1. Estimation of CWR Using the CROPWAT 8.0

The model is based on the provided input data. Tables S1–S3 show the CWR estimation by the CROPWAT 8.0 model for processing tomato for the years 2022, 2023, and 2024, respectively, under IR100, while Tables S4–S6 show the CWR estimation under RDI70 for the same years. In the 2022 CWR module, using the IR100 irrigation strategy (Table S1), cumulative ETc values during the entire crop cycle were observed to be 540.0 mm. These values ranged from 10.5 mm in the first decade of June to 78.7 mm in the third decade of July. Although effective rainfall was zero in the initial decades after transplanting, from the last decade of July until the end of the cycle, precipitation led to an accumulation of effective rainfall equal to 55.4 mm. The software calculated a total irrigation requirement of 482.3 mm, with a maximum peak during the Full development phase of the plant (78.6 mm), corresponding to Kc and ETc values of 1.15 and 7.15 mm/day, respectively.
In the same year, but with the different irrigation strategy, RDI70 (Table S4), variations were observed in the total ETc values (516.2 mm) and irrigation requirement values (459.4 mm). The peak of ETC occurred during the third decade of July (77.3 mm/dec), correlating with the highest irrigation demand values (77.2 mm/dec). Regarding the crop coefficients (Kc), the maximum values (1.18) were observed in the last decade of July and the first decade of August.
In 2023, with the IR100 irrigation strategy (Table S2), ETc, effective rainfall, and irrigation requirement values were 425.8 mm, 31.2 mm, and 393.1 mm, respectively. In this case, high ETc values were observed throughout July and August, with values around 39.2 and 63.8 mm. This resulted in a significant increase in irrigation needs, with values no lower than 39.1 mm. In 2023, irregular rainfall was observed throughout the crop cycle, with an almost total absence of precipitation in July. In this case, the highest Kc values (1.00) were recorded during the first and second decades of August.
Regarding the RDI70 irrigation strategy (Table S5), the values obtained differed significantly from the IR100 strategy of the same year, with ETc and irrigation requirement values of 349.3 mm and 316.6 mm, respectively. The Kc values ranged from 0.49 in the second and third decades of June to 0.87 in the first and second decades of August. The highest ETc was observed in the third decade of July (55.1 mm/dec).
In the year 2024, with the IR100 irrigation strategy (Table S3), the ETc and irrigation requirement values were 400.7 mm and 355.3 mm, respectively. Significant ETc values were found during the second and third decades of July, amounting to 53.3 mm and 58.9 mm. The effective rainfall at the Buonfornello site amounted to 53.0 mm for the entire crop cycle. The highest Kc was observed in the third decade of July (1.04), which corresponded with the maximum ETc (58.9 mm/dec).
In the same year, with the RDI70 irrigation strategy, quantitative variations were observed in the ETc and irrigation requirement values. As highlighted in Table S6, the total values for both data points were 362.7 mm and 317.3 mm, respectively. The highest Kc values were observed in the third decade of July (1.03), while the lowest occurred in the third decade of May and the first and second decades of June. Conversely, the ETc reached its lowest values in the third decade of August (6.6 mm/dec).

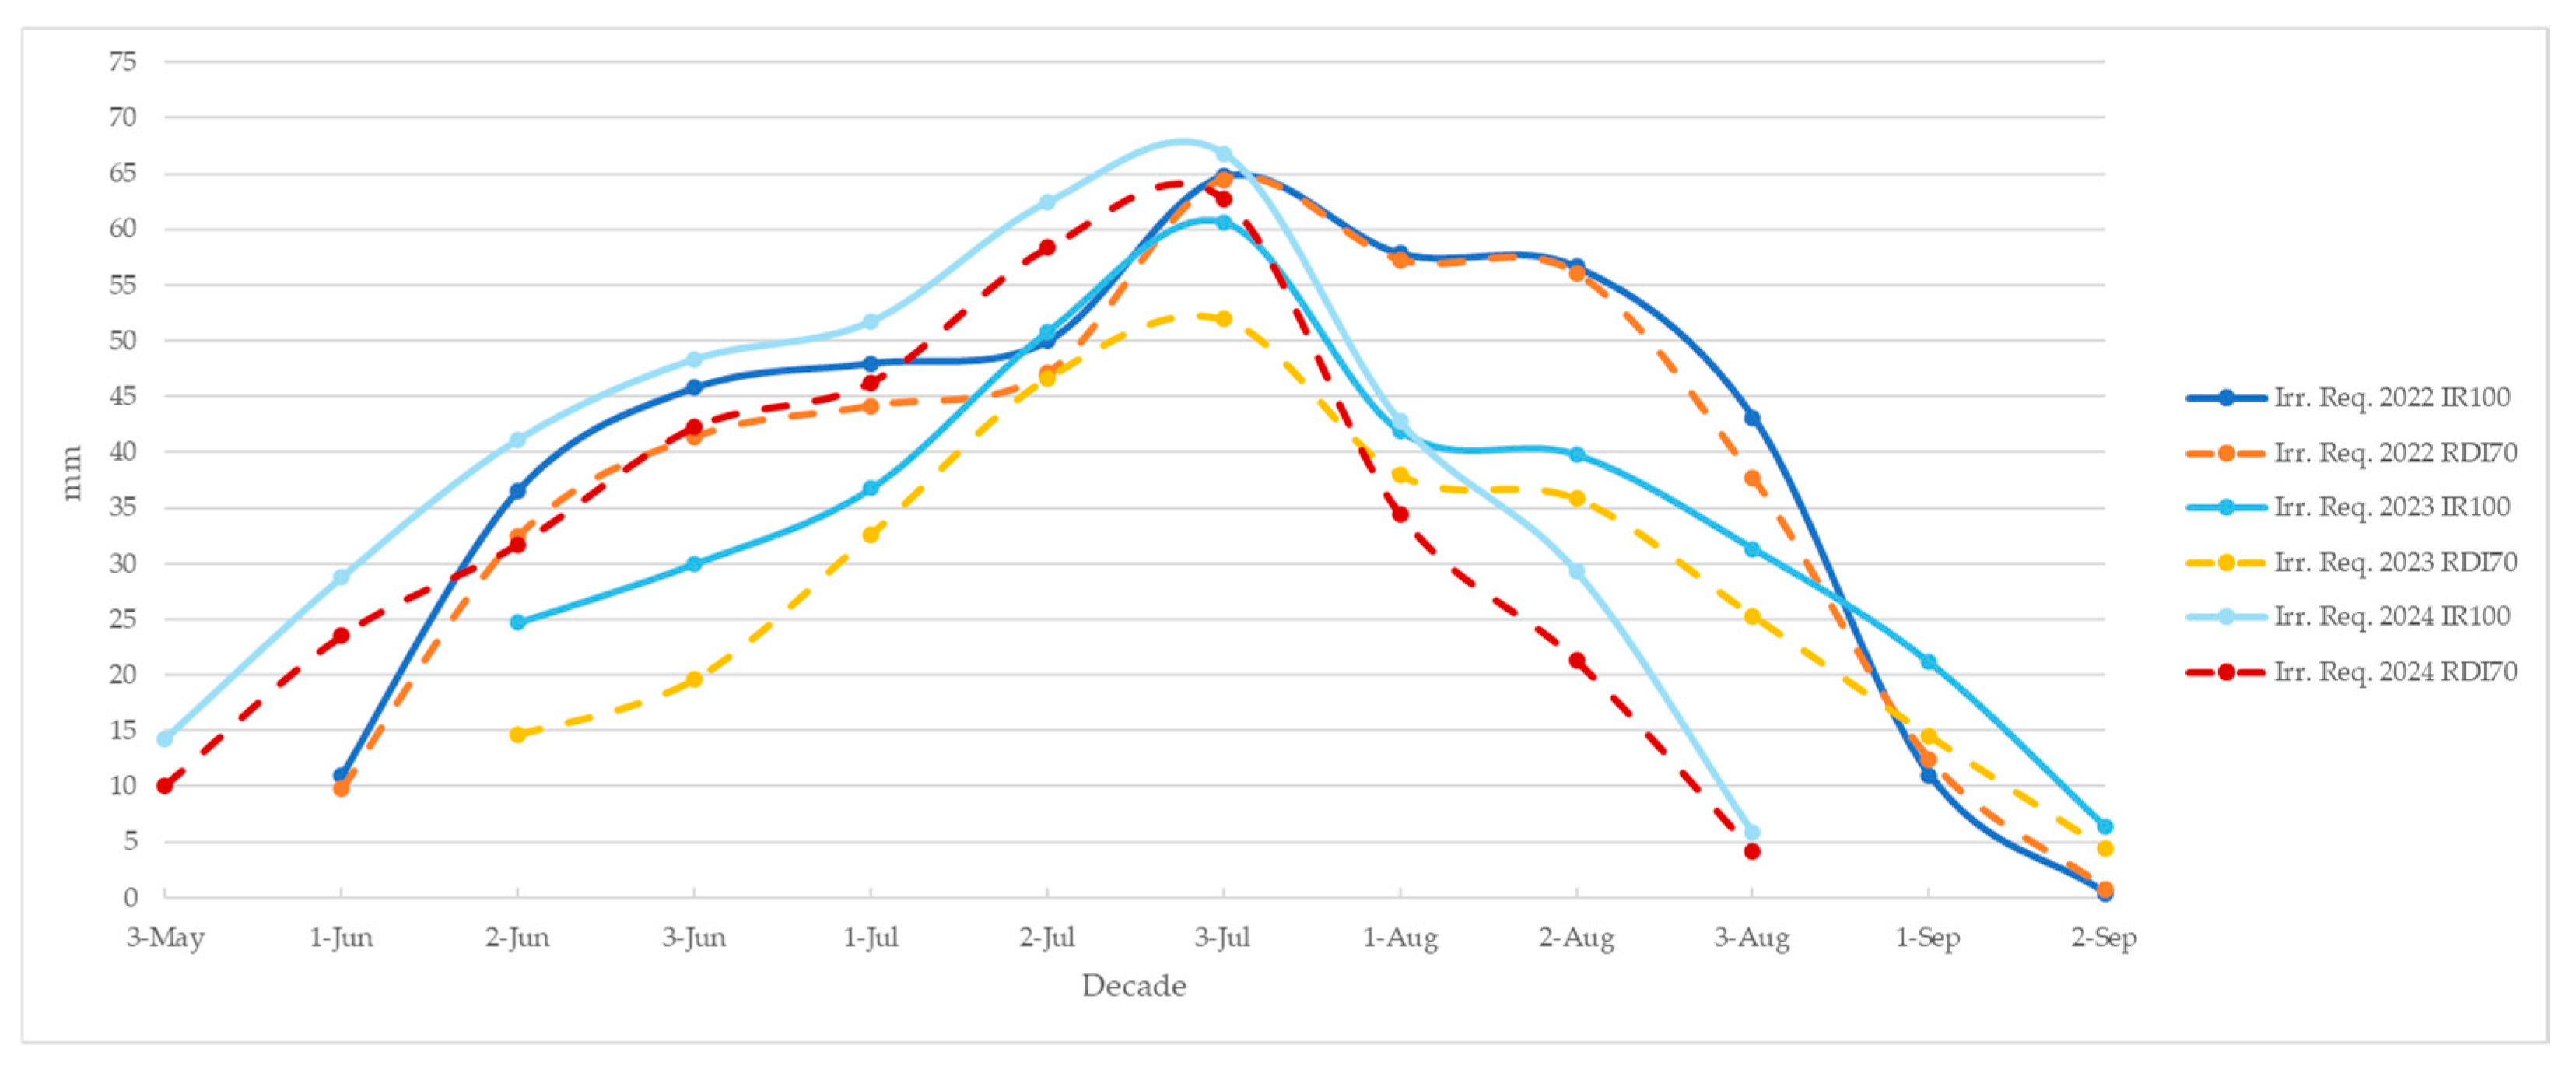
3.2. Estimation of CWR Using Data Collected from Probes

Based on the data obtained from the probes, Tables S7–S9 show the estimation of CWR for processing tomato under IR100 for the years 2022, 2023, and 2024, respectively, while Tables S10–S12 show the estimation of CWR under RDI70 for the same years. In 2022, for the IR100 irrigation strategy (Table S7), the ETc and irrigation requirement values were 480.3 mm and 424.95 mm, respectively. Again, higher ETc values, and consequently plant water requirements, were observed in July and August, with the latter ranging from 56.03 mm to 60.32 mm. Effective rainfall was recorded mainly during the second half of the crop cycle, totaling 55.4 mm for the entire cycle. The Kc values ranged from 0.63 to 1.20, with the peak recorded in the first and second decades of August.In 2022, using the RDI70 irrigation strategy (Table S10), total ETc and irrigation requirement values of 458.64 mm and 403.24 mm, respectively, were recorded. From the third decade of July and throughout August, ETc values ranged between 50.53 mm and 64.53 mm, while the irrigation requirement varied between 37.63 mm and 64.43 mm. These data confirm that these months are the hottest of the entire crop cycle. The highest Kc values (1.19) were also observed in the first and second decades of August, while the lowest values were recorded in the first and second decades of June (0.55).
In Table S8, related to 2023, IR100 irrigation strategy, ETc and irrigation requirement values of 374.45 mm and 343.25 mm were observed. The maximum peaks occurred in July and August, with ETc values ranging between 36.83 mm and 60.58 mm. During the same period, irrigation requirement values ranging between 31.33 mm and 60.58 mm were recorded. The highest Kc value was observed in the third decade of July (1.0), while the lowest values were recorded in September (0.62).
In the case of the RDI70 irrigation strategy for the same year (Table S11), the ETc and irrigation requirement values were 314.77 mm and 283.57 mm, respectively. Similar to the IR100 strategy, the maximum ETc and irrigation requirement values were recorded in July and August. Specifically, in July, values of 32.75 mm, 46.66 mm, and 51.93 mm were found, while in August, the values were 42.03 mm, 42.03 mm, and 30.91 mm. In this case, Kc values never exceeded 0.86 (second and third decades of July). The lowest values were observed in the second decade of June (transplanting).
In Table S9 related to 2024, IR100 irrigation strategy, the total ETc and irrigation requirement values were 444.18 mm and 391.18 mm, respectively. A peak in ETc and irrigation requirement values was observed in the third decade of July, with values of 68.79 mm and 66.79 mm, respectively. The Kc range was from 0.75 (third decade of May and first decade of June) to 1.10 (second decade of July).
In Table S12, reporting the CWR data with the RDI70 irrigation strategy for 2024, ETc and irrigation requirement values of 387.76 mm and 334.76 mm, respectively, were observed. Furthermore, peaks in ETc (64.76 mm) and irrigation requirement (62.76 mm) values were noted in the third decade of July. The highest Kc values (1.00) were observed in the third decade of July, while the lowest values (0.64) were recorded in the third decade of May and the first decade of June.
The dynamics of crop water demand for each irrigation strategy, summarized by decade and year, are shown in Figure 1.

3.3. Environmental Impact: Water Footprint

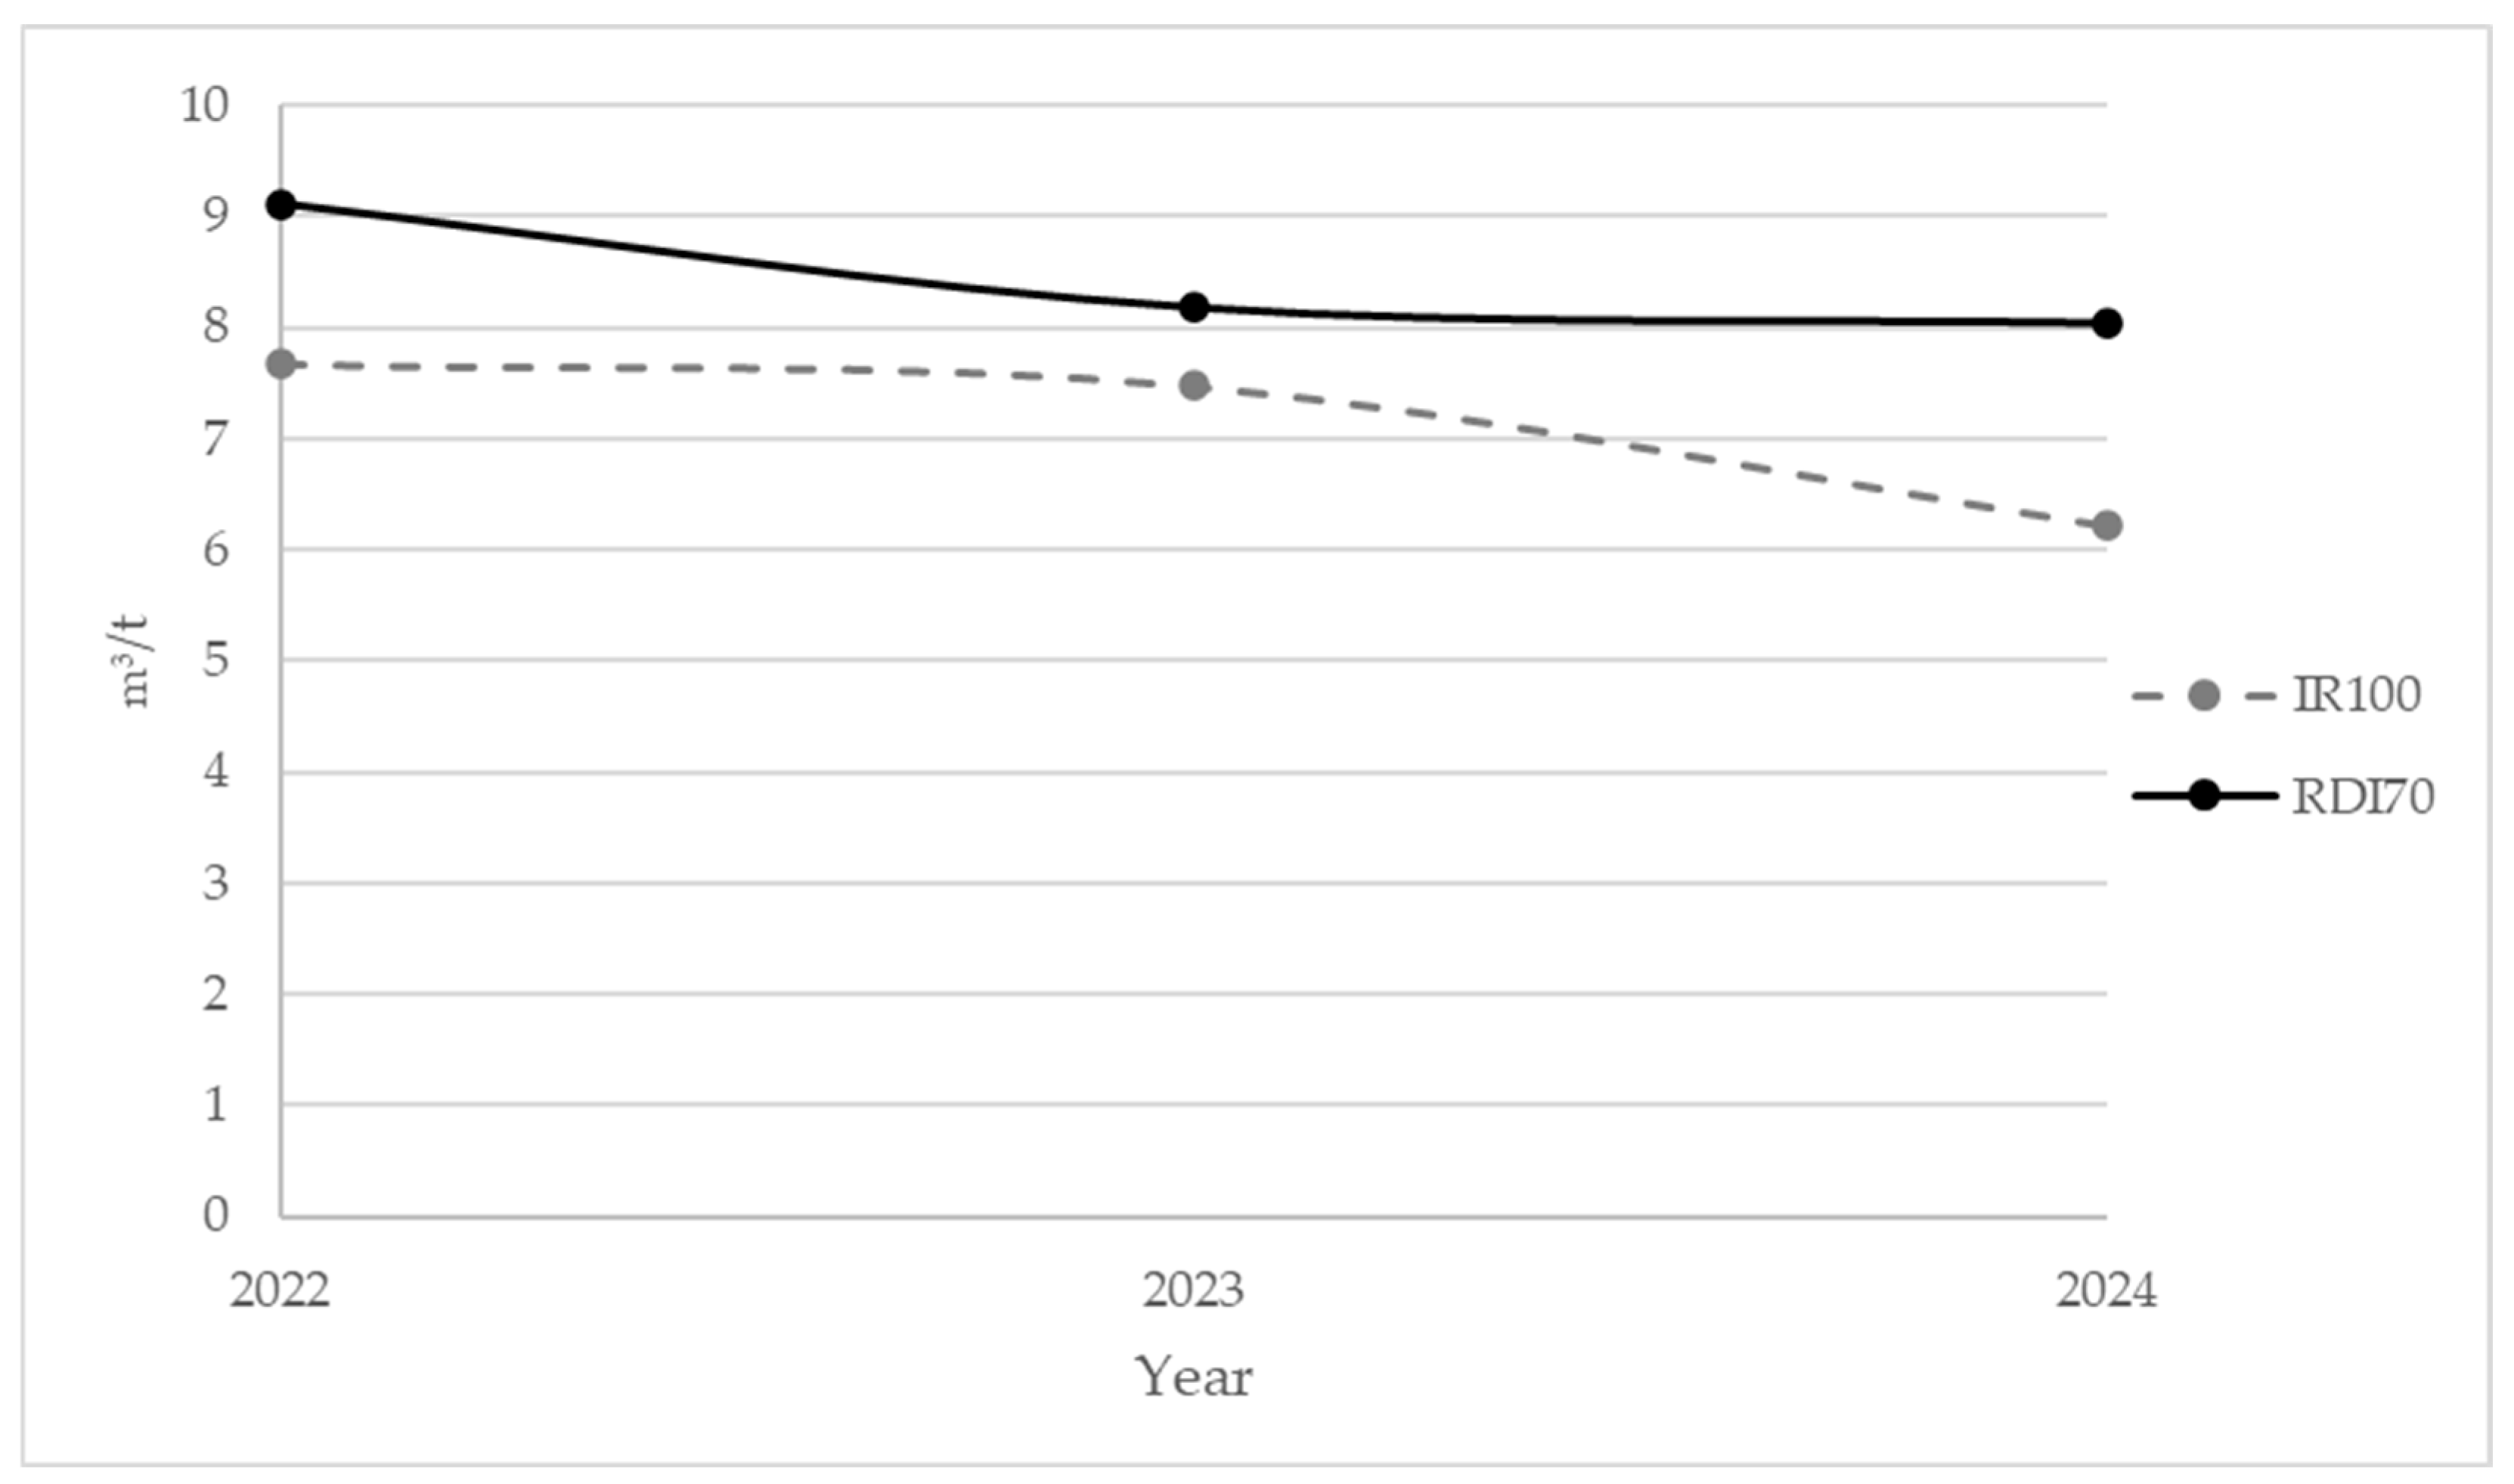
3.3.1. Water Footprint Green (WFgreen)

Table S13 shows the yields, CWUgreen, and WFgreen expressed as m3 of water used per ton of tomatoes harvested for the two methods and irrigation strategy used. The differences in the green water footprint among the various systems are mainly due to the yield of each analyzed system and the CWUgreen, which essentially depends on the crop water requirement and the precipitation in the production areas. In 2022, higher WFgreen values were recorded, with peaks reaching 5.42 m3 t−1, while in 2023, the values were lower, settling at 2.5 m3 t−1 and 2.74 m3 t−1. In 2024, it was possible to observe values of 3.53 m3 t−1 and 4.57 m3 t−1 (Figure 2).

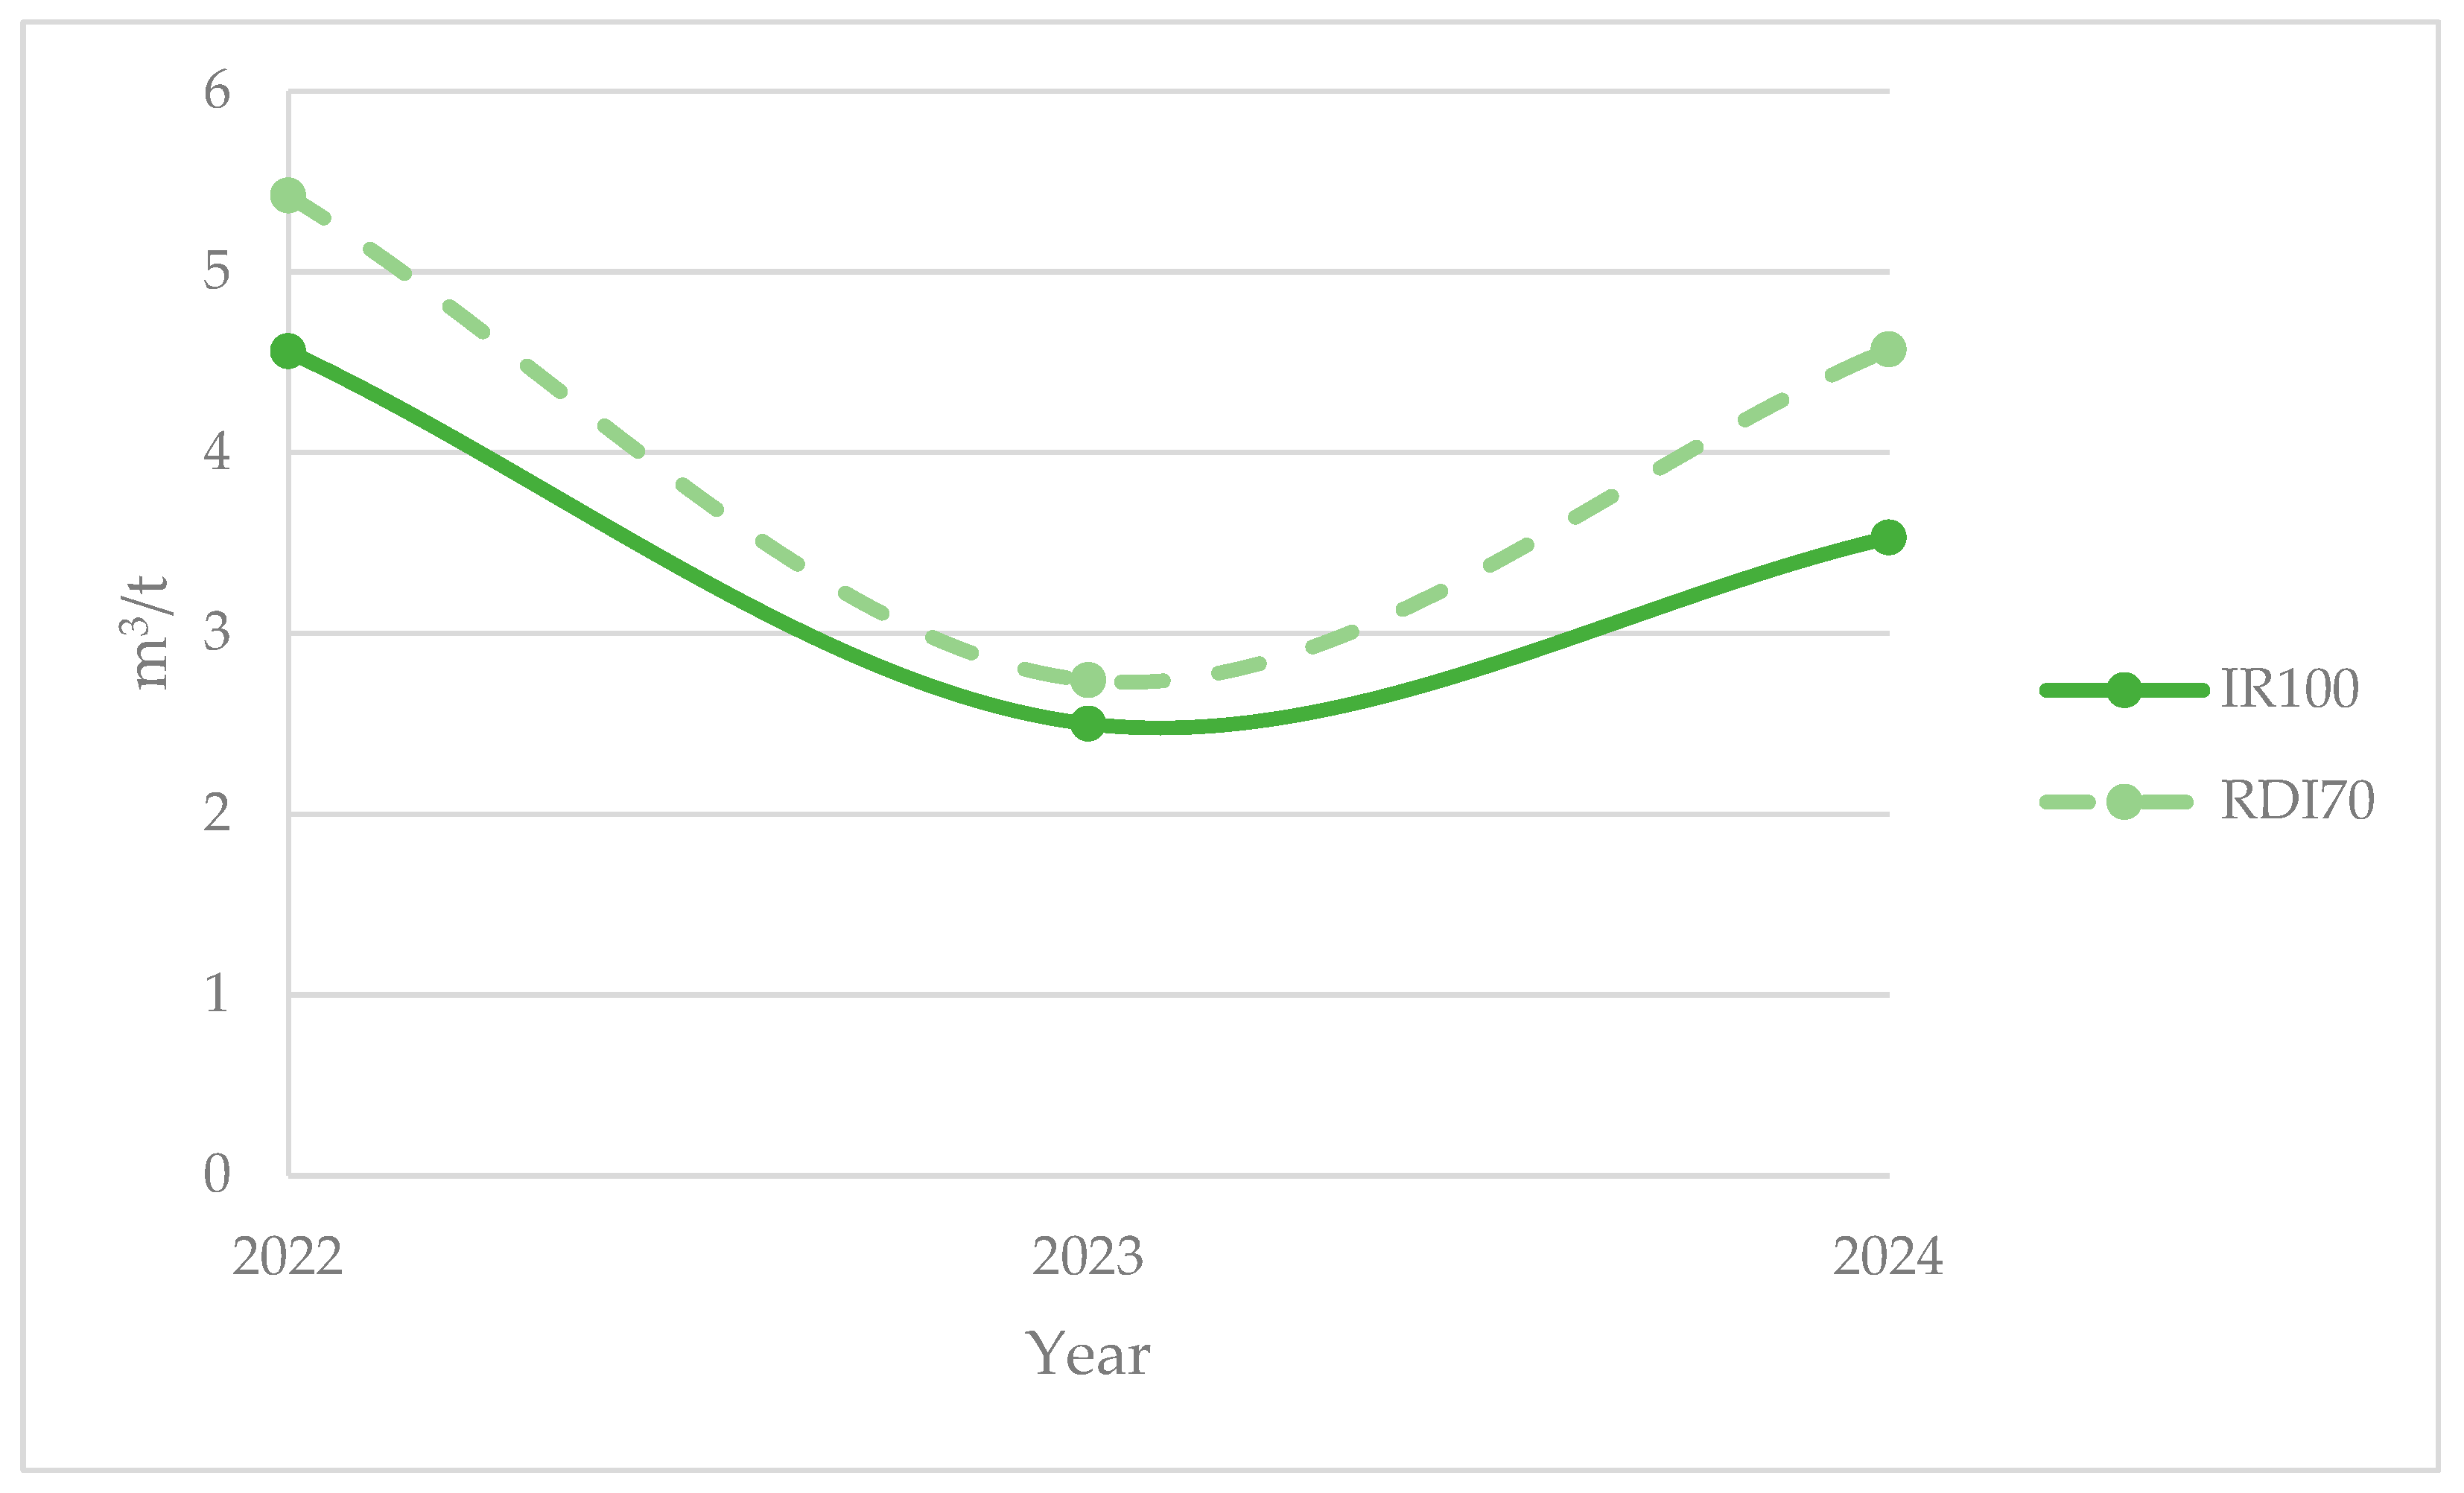
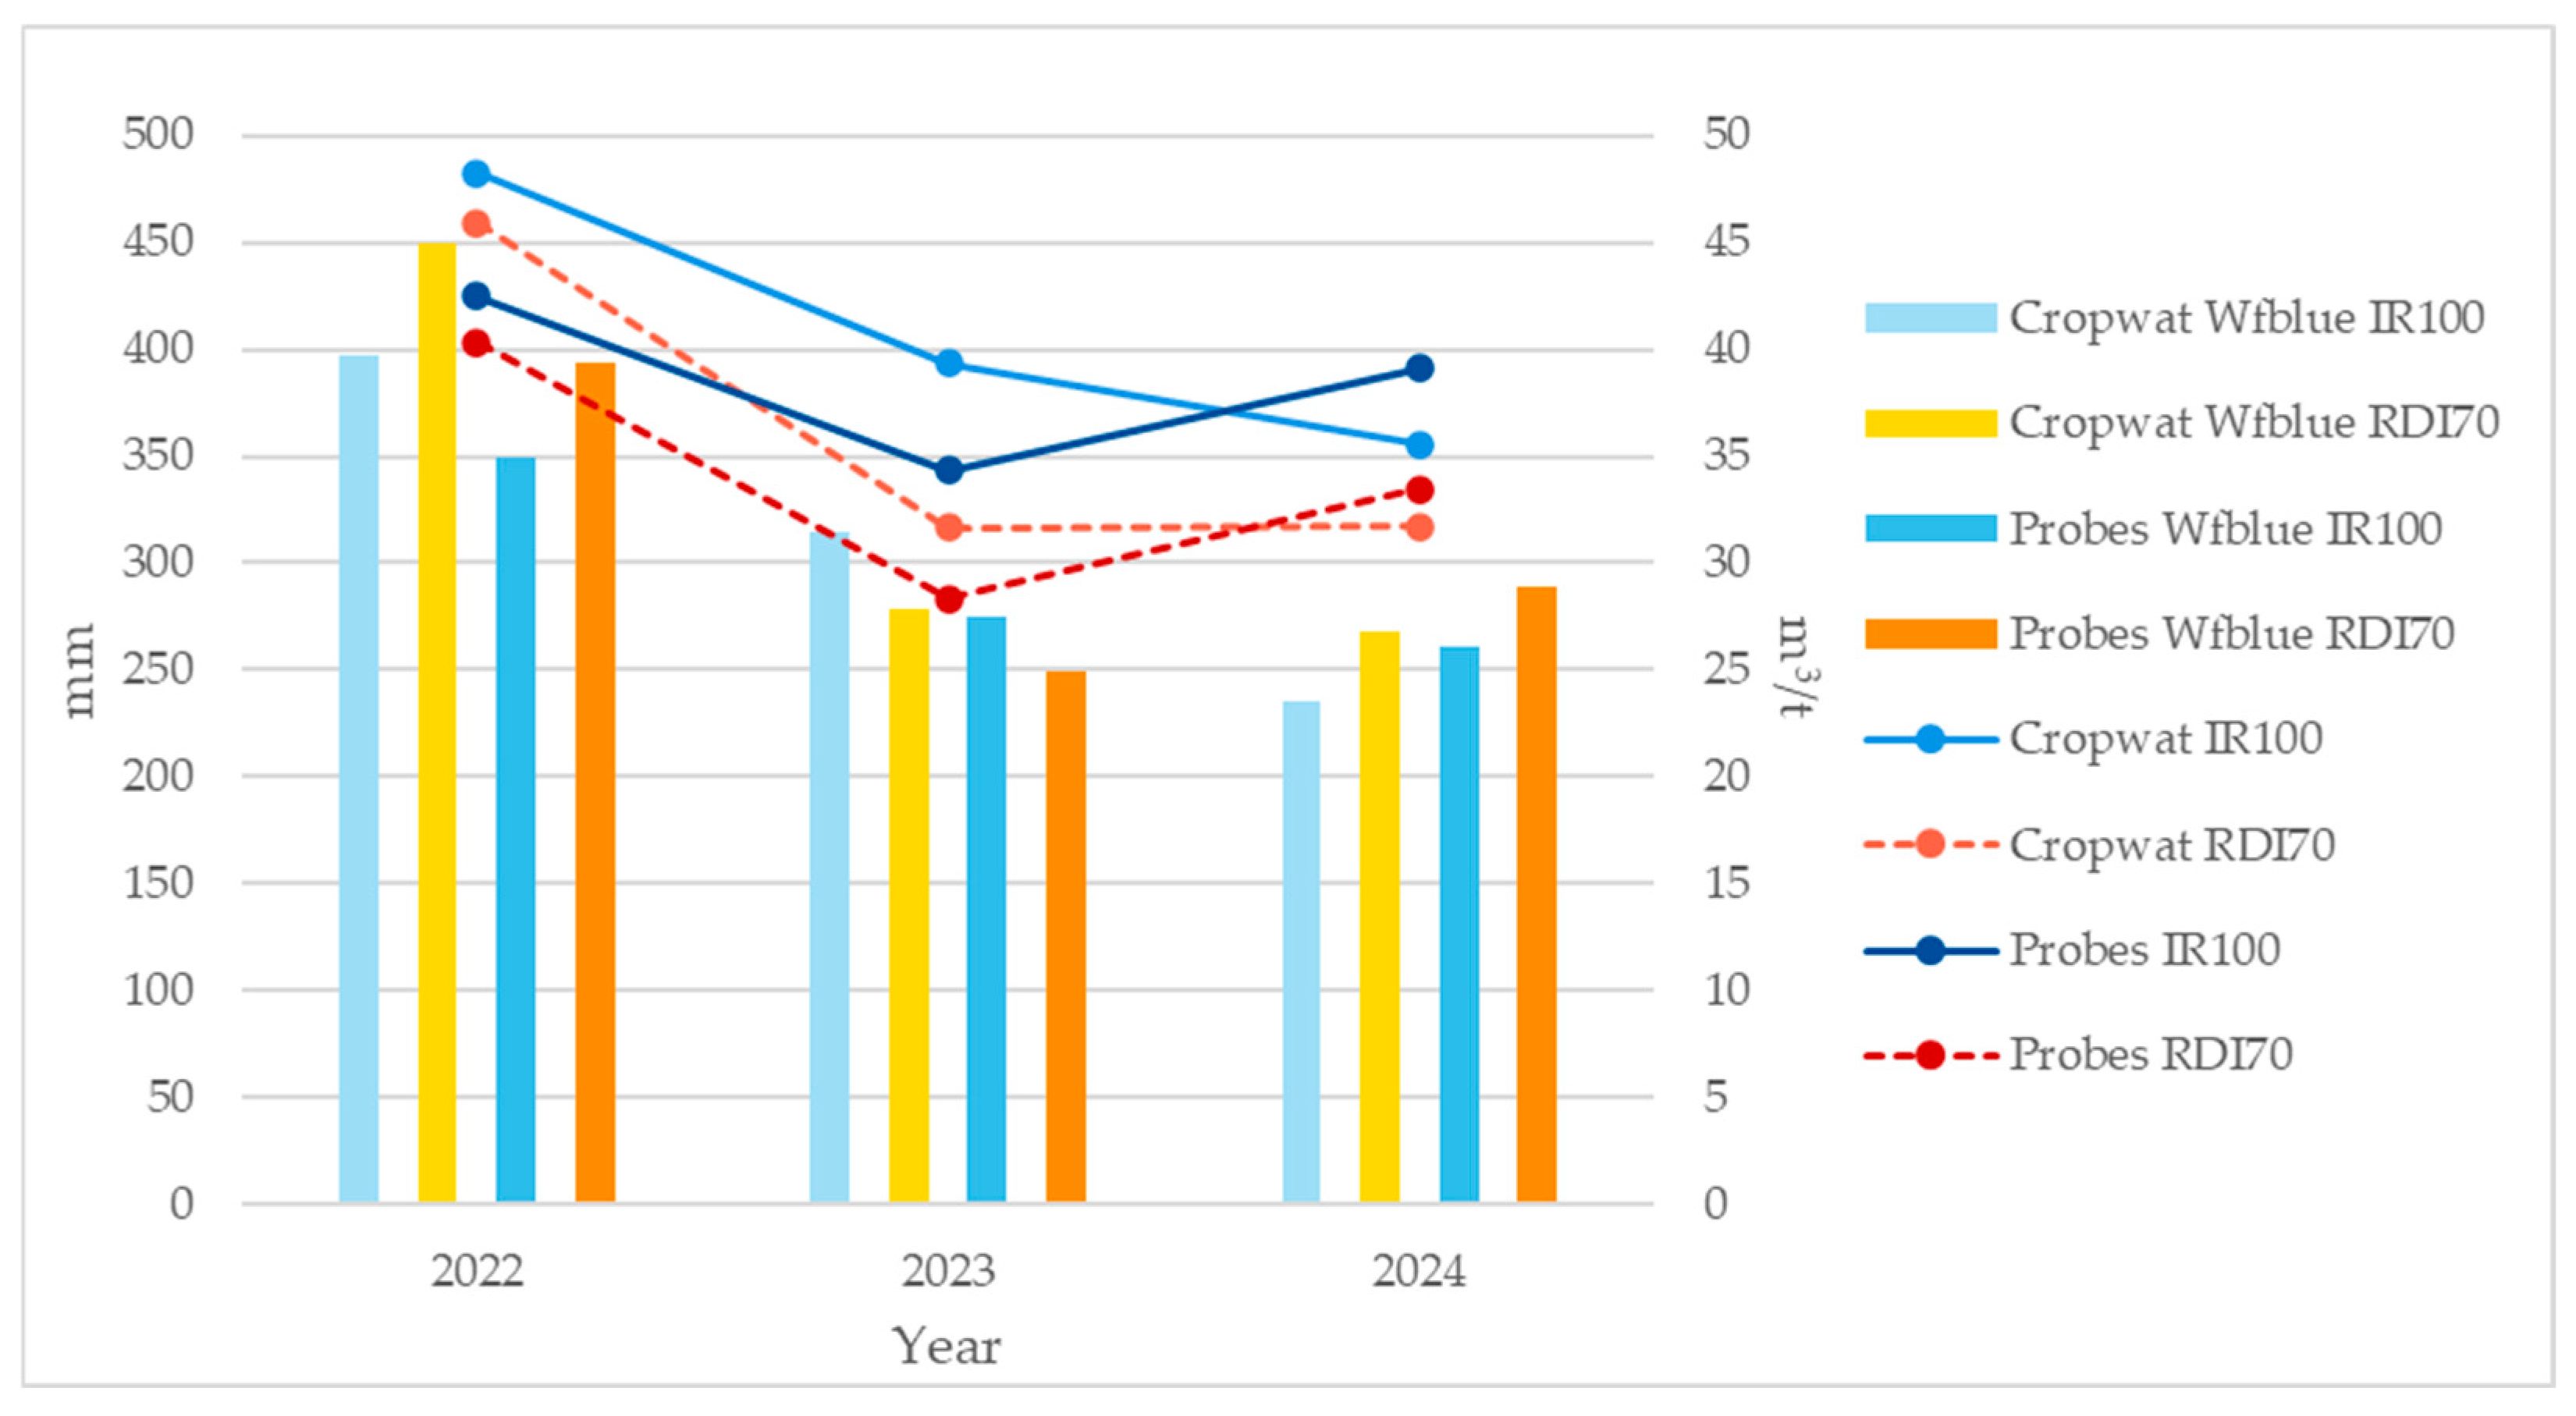
3.3.2. Water Footprint Blue (WFblue)

Table S14 shows the yields, CWUblue, and WFblue expressed as m3 of water used per ton of tomatoes harvested for the two methods and irrigation systems used. In 2022, water consumption reached the highest levels, with WFblue values exceeding 34.95 m3 t−1 and a peak of 44.90 m3 t−1 according to the CROPWAT method with the RDI70 system. Conversely, the lowest values were found in 2024, ranging between 23.51 and 26.07 m3 t−1 (Figure 3). This year was therefore the least impactful in terms of water consumption and had a lower environmental impact. The relationship between applied water volume (from CROPWAT and probe measurements) and the calculated WFblue values for the same methods across different treatments is shown in Figure 4.

3.3.3. Water Footprint Grey (WFgrey)

Table S15 shows the yields and the WFgrey expressed as m3 of water used per ton of tomatoes harvested for the two irrigation systems used. According to Hoekstra et al. [30], the grey component of the WF was calculated considering only nitrogen fertilizers, as they are considered the most critical. As mentioned earlier, WFgrey represents the volume of freshwater needed to assimilate pollutants, respecting existing environmental quality standards. From Table S15, it can be observed that, for all three years, the values range between 6.22 m3 t−1 and 9.12 m3 t−1, with the maximum peak recorded in 2022 for the RDI70 system and the minimum peak in the year 2024 for the IR100 system (Figure 5).

3.3.4. Water Footprint Total (WFtotal)

Table S16 shows the WFtotal differentiated into its components. Specifically, the values of WFgreen, WFblue, WFgrey, and WFtotal have been grouped in detail for each year and for the respective irrigation system used. It was found that 2022 is confirmed as the year with the highest environmental impact in terms of water consumption, recording WFtotal values of 51.91 m3 t−1 and 59.44 m3 t−1 for the IR100 and RDI70 systems, respectively, according to the CROPWAT method and 47.19 m3 t−1 and 53.95 m3 t−1 for the IR100 and RDI70 systems, respectively, according to the probe method. The minimum peak was found in 2023 with the probe method for the RDI70 system, with a value of 35.81 m3 t−1 (Figure 6).

4. Discussion

4.1. Importance of Soil Water Content Monitoring for Irrigation Management

The continuous knowledge of the soil water content, influenced by the complex soil–plant–atmosphere system, is fundamental for the efficient management of water resources in agriculture. This is particularly relevant today, in a context where freshwater scarcity imposes the careful use of water reserves to support agricultural production and contribute to environmental sustainability. Several global climate models predict a trend towards increased crop water requirements (CWR), mainly due to rising temperatures, which lead to higher evapotranspiration rates [43,44,45]. This scenario highlights the importance of researching effective agricultural measures and water conservation strategies aimed at restoring soil moisture to the level required for each crop, for the specific phenological phase and based on the set objectives. In this study, the water requirement of processing tomato plants, estimated by the CROPWAT 8.0 model with current field data, was evaluated and compared with that estimated by probes during a three-year experimental period. The CROPWAT model is a widely used tool for estimating crop water requirements and irrigation scheduling, using data related to soil, crops, and meteorological factors, both historical and current [46]. More recent technologies, such as sensors for estimating soil water content, which provide real-time and highly accurate measurements, also allow consideration of the spatiotemporal variability of the site [47]. Both tools have been extensively evaluated, tested, and compared with direct methods of measuring evapotranspiration, such as lysimeters, which have confirmed their reliability. However, few studies in the scientific literature directly compare the two methods. The application of in situ probes allowed the calculation of crop coefficients (Kc) specific to each experimental area and year, using the irrigation volumes applied during the crop cycle as a function of water fluctuations in the soil where the crop resided. The Kc values corrected with respect to FAO-56 Kc were entered into the CROPWAT model to predict CWR values, in order to reduce errors attributable to the use of Kc not suitable for the specific site, as demonstrated in other studies [48]. Indeed, for an accurate determination of crop water requirements, it is essential to develop site-specific crop coefficients, since, as many researches have highlighted over time, crop coefficients vary depending on factors such as local climate, soil types, irrigation regime, management practices, and other environmental factors, even for the same crop [49,50]. However, although to date the direct method with lysimeters is the most accurate for calculating actual evapotranspiration and therefore Kc, it remains relegated to scientific research due to the high costs and long times required [50,51]. In fact, this limitation leads to the widespread use worldwide of the Kc published in the FAO-56 manual, with risks of underestimation or overestimation of water requirements and, therefore, to a loss of efficiency in water management [48]. In our analysis, the Kc values for the initial, mid-season, and late-season growth stages, for all experimental years, generally showed higher values than those published in the FAO-56 manual (0.6, 1.15, 0.7–0.9, 0.6) [19]; The exception was the trial carried out at Carboj in 2023, where the values were lower for the initial, mid-season, and late-season stages (IR70: Sini = 0.49, Sint = 0.87, Sfin = 0.53). This prevented deficient or excessive irrigation, which would have had a significant impact on the quality and yield of the tomatoes, considering the high sensitivity of the crop to water conditions [52,53]. This variability in Kc values is attributable to differences in seasonal conditions and the specific climatic factors of the station.

4.2. Comparing CROPWAT and Probe-Based Estimations of Crop Water Requirements

Furthermore, from the comparison between the ETc and CWR values calculated through management with probes and those simulated with the CROPWAT 8.0 software, significant differences emerged for all years of observation and for both irrigation managements. In fact, the ETc values estimated by the software with our current data, and consequently the CWR values, were always overestimated compared to the actual water applications. In 2022, there was an overestimation of CWR of 13.50% for IR100 and 13.92% for IR70, which translates into volumes of water that would have been lost, 574 and 562 m3 ha−1. In 2023, the differences were 14.52% and 11.65% for the IR100 and IR70 treatments, respectively. This difference, despite the use of corrected Kc, can be attributed to the use of average values in mathematical models, such as climatic data for the calculation of ET0, which may not capture field variables related to microclimatic phenomena, such as shading, wind, or specific microclimates that could influence evapotranspiration. Furthermore, the CROPWAT model assumes that soil parameters are constant and also based on average values and may not consider differences in water runoff. In fact, the measurement of soil moisture is difficult, as it varies spatially, depending on the heterogeneity of the land surface, and temporally, depending on the dynamic factors of precipitation and evapotranspiration. Having field measurements, in fact, allows for a more accurate assessment [54]. A study conducted in India [26], on the other hand, reported insignificant differences, with overestimations of 3% of CWR with CROPWAT compared to probes in the first year of experimentation and underestimations of −8.53% in the second year. These different results highlight the importance of having site-specific studies and references. In our environments, considering the three years of experimentation, the CWR quantified and actually applied with IR100 irrigation ranged between 343.25 and 424.95 mm, while IR70 predicted applications between 283.57 and 403.24 mm. These values are consistent with the water requirements of tomatoes grown in hot, arid environments similar to ours [27,46,55,56]. In the case of IR100 irrigation, yields varied between 121.00 t ha−1 (value recorded in 2022) and 150.01 t ha−1 (value recorded in 2024). Instead, with IR70, tomato yields were between 102.30 and 115.98 t ha−1.

4.3. Comparing CROPWAT and Probe-Based Estimations of Water Footprint Analysis

The CWR and yield data of this study were used to evaluate the environmental impact that tomatoes grown in Sicily have on water resources. To this end, in fact, the water footprint (WF) was analyzed and compared both between the two calculation methods (CROPWAT 8.0 and probes) and between the two types of management (IR100 and IR70). From our analysis, the water footprints (WFtotal) of tomatoes varied between 33.26 and 51.91 m3 t−1 with the CROPWAT model and between 35.82 and 47.19 m3 t−1 with the probes for IR100, while for RDI70 the values ranged between 38.72 and 59.44 m3 t−1 with the CROPWAT method and between 35.81 and 53.95 m3 t-1 with the probe method. The component that most affects each scenario is WFblue, which constitutes most of the water footprint of tomatoes in general, due to insufficient rainfall to meet water requirements in both irrigation strategies, as reported in other studies [57]. According to both methods, WFgreen showed increases of 18.85%, 9.60%, and 29.46% for the years 2022, 2023, and 2024, going from IR100 to RDI70. The WFgrey calculated for the three years also showed the highest values with the RDI70 strategy, with values between 8.05 and 9.12 m3 t−1, compared to IR100, which reported values between 6.22 and 7.68 m3 t−1. The greatest variability was observed for the blue component, between the experimental years, between the irrigation strategies, and between the data derived from the CROPWAT model and those obtained from the probes. The highest WFblue was obtained from the data derived from the prediction with CROPWAT, as expected, given that this model overestimated water application. In fact, for the three years of experimentation, the water application according to the CROPWAT model prediction led to a WFblue that would have ranged between 23.67 and 39.67 m3 t−1, while with the actual application data, for IR100, the WFblue varied between 26.07 and 34.95 m3 t−1. Regarding RDI70, in the three years 2022, 2023, and 2024, reductions in yield and variations in WFblue were observed compared to IR100, respectively, of 15.86% and +13.19% (2022), 8.73% and −11.75% (2023), and 22.69% and +15.55% (2024).

4.4. Implications for Water Footprint and Sustainable Management in Processing Tomato Cultivation

The WFtotal resulting from this analysis was lower in all scenarios than reported in other studies conducted on processing tomatoes [27,32,58]. However, this variability depends on the climatic conditions, the soil characteristics of each area, and the different yields. For example, a study conducted in Greece reported WFtotal values varying between 37 and 131 m3 t−1 [59]. In fact, one of the problems encountered is the high variability of the estimates related to the WF of processing tomatoes reported in the literature, which can generate a margin of uncertainty. This may depend on multiple factors, including the lack of solid data on which to calculate all components of the WF. Some studies adopt simplifications or estimates for the calculation of the components, rather than relying on data measured or estimated in experimental plots. Another weakness observed by Egea et al. (2024) [27] is that most studies on WF estimate crop evapotranspiration (ET) under standard conditions (e.g., non-limiting soil water conditions and surface drip irrigation), without analyzing the impact that other irrigation scenarios, such as deficit irrigation and/or subsurface drip irrigation, can have on ET and therefore on the WF of the crop. An interesting observation concerns the fact that, although many studies, including ours, emphasize the importance of deficit irrigation in order to reduce irrigation inputs without significantly compromising yields [16], the water footprint analysis showed generally higher values with RDI70 compared to Full irrigation (IR100). Our study contrasts with what is reported in the literature, where a mild to moderate water deficit (15–20%) did not significantly reduce yield and showed similar or significantly lower water footprint values, depending on the years, compared to IR100 [27]. This difference depends on the type of deficit irrigation adopted; in fact, the strategy adopted in this study (RDI70), which involved the controlled reduction of irrigation volumes before the flowering phase and after the fruit enlargement phase, was not sufficient to improve the WFtotal, which instead worsened. In fact, it is known that the effectiveness of water-saving techniques can vary depending on several factors, including the timing of deficit induction [11]. Ultimately, our results regarding WFtotal showed that, as the authors had hypothesized, the CWR estimated with CROPWAT was generally higher than the data derived from the probes. For the years 2022 and 2023, an average percentage variation of +13.4% was observed, while in 2024 this variation was −7.20%. Furthermore, from the comparison between the two strategies, it emerged that RDI70, compared to IR100, consumed more water per ton of products; in fact, WFtotal recorded an increase of 14.32% in 2022 and 15.77% in 2024, while in 2023 a water savings of 4.40% was noted.

5. Conclusions

Technological advancements, such as probes or decision support models for accurately quantifying crop water requirements, ET, and yields, will improve the availability of data on water consumption in agriculture. This study demonstrated that the use of site-specific (soil and weather conditions) and crop-specific (kc) values led to limited error margins in estimating tomato water requirements using the CROPWAT 8.0 software. However, differences were observed between the two methods, especially for the values related to 2024. The maximum peaks were recorded by CROPWAT in 2022 with the IR100 strategy, where the ETc and irrigation requirement values were 540.0 mm and 482.3 mm, respectively, and therefore very different from the values obtained in the following year at the same site. With the refinement of calculation methodologies, it was possible to also obtain accurate estimates with reduced error margins for the calculation of WF. The total water footprint (WFtotal) estimates reflected the data collected over the years of experimentation, considering the different water requirements and evapotranspiration (ETc). In 2022, the CROPWAT method highlighted the greatest environmental impact, with values of 51.91 m3 t−1 for the IR100 strategy and 59.44 m3 t−1 for the RDI70. In almost all the study years, the values obtained with the RDI70 strategy were higher than those of IR100. In a Mediterranean environmental context characterized by a dry period and high temperatures, the water footprint blue values (ranging between 44.90 m3 t−1 and 23.67 m3 t−1 exceeded the values related to the water footprint green and grey. This result was predictable, as it is in line with the high-water needs of the crop during the summer season, in which irrigation is the only source of water supply. For further research, it is essential to evaluate the spatiotemporal variability of water blue availability and how much of it can be used sustainably in a given basin without negatively impacting the ecosystem. Therefore, in conclusion, we can state that, in regions with water scarcity, the application of the CROPWAT 8.0 model, modified with real data, and the adoption of smart systems such as capacitive and tensiometric probes could be a reliable method for estimating crop water requirements, addressing an urgent concern related to water security in the context of sustainable agriculture.

Supplementary Materials

The following supporting information can be downloaded at https://www.mdpi.com/article/10.3390/agronomy15071533/s1, Figure S1: Input data related to climatic parameters for the year 2022; Figure S2: Input data related to climatic parameters for the year 2023; Figure S3: Input data related to climatic parameters for the year 2024; Figure S4: Effective rainfall data for 2022. Eff rain: effective rainfall; Figure S5: Effective rainfall data for 2023; Figure S6. Effective rainfall data for 2024; Figure S7: Input data related to crop parameters for the year 2022. IR100 (a), RDI70 (b); Figure S8: Input data related to crop parameters for the year 2023. IR100 (a), RDI70 (b); Figure S9: Input data related to crop parameters for the year 2024. IR100 (a), RDI70 (b); Figure S10: Input data related to soil parameters. Year 2022: IR100 and RDI70 (a); Table S1: Estimation of CWR using the CROPWAT 8.0 method, year 2022, for the IR100 irrigation strategy; Table S2: Estimation of CWR using the CROPWAT 8.0 method, year 2023, for the IR100 irrigation strategy; Table S3: Estimation of CWR using the CROPWAT 8.0 method, year 2024, for the IR100 irrigation strategy; Table S4: Estimation of CWR using the CROPWAT 8.0 method, year 2022, for the RDI70 irrigation strategy; Table S5: Estimation of CWR using the CROPWAT 8.0 method, year 2023, for the RDI70 irrigation strategy; Table S6: Estimation of CWR using the CROPWAT 8.0 method, year 2024, for the RDI70 irrigation strategy; Table S7: Estimation of CWR using the probe method, year 2022, for the IR100 irrigation strategy; Table S8: Estimation of CWR using the probe method, year 2023, for the IR100 irrigation strategy; Table S9: Estimation of CWR using the probe method, year 2024, for the IR100 irrigation strategy; Table S10: Estimation of CWR using the probe method, year 2022, for the RDI70 irrigation strategy; Table S11: Estimation of CWR using the probe method, year 2023, for the RDI70 irrigation strategy; Table S12: Estimation of CWR using the probe method, year 2024, for the RDI70 irrigation strategy; Table S13: Water Footprint Green for CROPWAT and probes; Table S14: Water Footprint Blue for CROPWAT and probes; Table S15: Water Footprint Grey for CROPWAT and probes; Table S16: Water Footprint Total divided into its components (green, blue, and grey) in the analyzed systems.

Author Contributions

Conceptualization, N.I. and T.T.; methodology, N.I., N.T., and C.B.; software, C.M. and M.S.; validation, N.I., M.S., and T.T.; formal analysis, N.I. and N.T.; investigation, N.I., N.T., and C.M.; resources, T.T.; data curation, N.I. and N.T.; writing—original draft preparation, N.I., N.T., C.M., and C.B.; writing—review and editing, N.I., M.S., and T.T.; visualization, N.I. and C.M.; supervision, T.T.; project administration, N.I. and T.T.; funding acquisition, T.T. All authors have read and agreed to the published version of the manuscript.

Funding

This research has been supported by the PRIN 2020 project ‘Looking back to go forward: reassessing crop water requirements in the face of global warming’ (REWATERING) funded by the Italian Ministry of University and Research (CUP: B53C22000110006; code: 2020FFWTJR_005).

Data Availability Statement

The data presented in this study are available on request from the corresponding author.

Acknowledgments

The authors would like to thank “Ente di Sviluppo Agricolo” (ESA) of the Sicilian Region and the “Buonfornello” farm (Michele Gatto) for providing the experimental fields.

Conflicts of Interest

The authors declare no conflicts of interest.

References

  1. Food and Agriculture Organization Corporate Statistical Database. Available online: http://www.fao.org/faostat/en/#data (accessed on 1 February 2025).
  2. National Association of Vegetable Food Preserving Industries. Available online: https://anicav.it/i-prodotti/pomodoro/ (accessed on 26 January 2025).
  3. Iacuzzi, N.; Tuttolomondo, T.; Farruggia, D.; Tortorici, N.; Alaimo, F.; De Santis, D.; Rossini, F.; Di Miceli, G. A Two-Year Evaluation of Biostimulant Effects on Yield and Quality Parameters of Tomato Landrace ‘Pizzutello Delle Valli Ericine’ Cultivated Without Irrigation. J. Sustain. Agric. Environ. 2024, 3, sae2.70028. [Google Scholar] [CrossRef]
  4. Intergovernmental Panel on Climate Change (IPCC). Climate Change 2021—The Physical Science Basis: Working Group I Contribution to the Sixth Assessment Report of the Intergovernmental Panel on Climate Change; Cambridge University Press: Cambridge, UK, 2023; Available online: https://www.ipcc.ch/report/ar6/wg1/ (accessed on 21 May 2025).
  5. Wu, B.; Tian, F.; Zhang, M.; Piao, S.; Zeng, H.; Zhu, W.; Liu, J.; Elnashar, A.; Lu, Y. Quantifying Global Agricultural Water Appropriation with Data Derived from Earth Observations. J. Clean. Prod. 2022, 358, 131891. [Google Scholar] [CrossRef]
  6. Perelli, C.; Branca, G.; Corbari, C.; Mancini, M. Physical and Economic Water Productivity in Agriculture between Traditional and Water-Saving Irrigation Systems: A Case Study in Southern Italy. Sustainability 2024, 16, 4971. [Google Scholar] [CrossRef]
  7. Chen, X.; Dong, H.; Qi, Z.; Gui, D.; Ma, L.; Thorp, K.R.; Malone, R.; Wu, H.; Liu, B.; Feng, S. Potential Deficit Irrigation Adaptation Strategies under Climate Change for Sustaining Cotton Production in Hyper–Arid Areas. Agric. Water Manag. 2025, 312, 109417. [Google Scholar] [CrossRef]
  8. Añibarro-Ortega, M.; Pereira, A.; Pinela, J.; Liava, V.; Chaski, C.; Alexopoulos, A.A.; Barros, L.; Petropoulos, S.A. Enhancing Tomato Growth and Quality Under Deficit Irrigation with Silicon Application. Agronomy 2025, 15, 682. [Google Scholar] [CrossRef]
  9. Belkher, S.; Latrech, B.; Bekri, W.; Markwordt, F.; Rahim, M.A.; Dupont, C.; Ben Abdallah, M.A.; Daghari, H.; Rezig, M. Deficit Irrigation and an IoT-Based System for Improving Yield and Water Use Efficiency of Winter Wheat Grown Under Semi-Arid Conditions. Agronomy 2025, 15, 157. [Google Scholar] [CrossRef]
  10. Katerji, N.; Mastrorilli, M.; Rana, G. Water Use Efficiency of Crops Cultivated in the Mediterranean Region: Review and Analysis. Eur. J. Agron. 2008, 28, 493–507. [Google Scholar] [CrossRef]
  11. Burato, A.; Fusco, G.M.; Pentangelo, A.; Nicastro, R.; Modugno, A.F.; Scotto Di Covella, F.; Ronga, D.; Carillo, P.; Campi, P.; Parisi, M. Regulated Deficit Irrigation to Boost Processing Tomato Sustainability and Fruit Quality. Sustainability 2024, 16, 3798. [Google Scholar] [CrossRef]
  12. Martí, R.; Valcárcel, M.; Leiva-Brondo, M.; Lahoz, I.; Campillo, C.; Roselló, S.; Cebolla-Cornejo, J. Influence of Controlled Deficit Irrigation on Tomato Functional Value. Food Chem. 2018, 252, 250–257. [Google Scholar] [CrossRef]
  13. Patanè, C.; Cosentino, S.L. Effects of Soil Water Deficit on Yield and Quality of Processing Tomato under a Mediterranean Climate. Agric. Water Manag. 2010, 97, 131–138. [Google Scholar] [CrossRef]
  14. Jin, N.; Zhang, D.; Jin, L.; Wang, S.; Yang, X.; Lei, Y.; Meng, X.; Xu, Z.; Sun, J.; Lyu, J.; et al. Controlling Water Deficiency as an Abiotic Stress Factor to Improve Tomato Nutritional and Flavour Quality. Food Chem. X 2023, 19, 100756. [Google Scholar] [CrossRef] [PubMed]
  15. Giuliani, M.M.; Carucci, F.; Nardella, E.; Francavilla, M.; Ricciardi, L.; Lotti, C.; Gatta, G. Combined Effects of Deficit Irrigation and Strobilurin Application on Gas Exchange, Yield and Water Use Efficiency in Tomato (Solanum lycopersicum L.). Sci. Hortic. 2018, 233, 149–158. [Google Scholar] [CrossRef]
  16. Mukherjee, S.; Dash, P.K.; Das, D.; Das, S. Growth, Yield and Water Productivity of Tomato as Influenced by Deficit Irrigation Water Management. Environ. Process. 2023, 10, 10. [Google Scholar] [CrossRef]
  17. Lovelli, S.; Potenza, G.; Castronuovo, D.; Perniola, M.; Candido, V. Yield, Quality and Water Use Efficiency of Processing Tomatoes Produced Under Different Irrigation Regimes in Mediterranean Environment. Ital. J. Agron. 2017, 12, 795. [Google Scholar] [CrossRef]
  18. Ferrarezi, R.S.; Van Iersel, M.W.; Testezlaf, R. Monitoring and Controlling Ebb-and-Flow Subirrigation with Soil Moisture Sensors. HortScience 2015, 50, 447–453. [Google Scholar] [CrossRef]
  19. Allen, R.G. (Ed.) Crop Evapotranspiration: Guidelines for Computing Crop Water Requirements; FAO Irrigation and Drainage Paper; Food and Agriculture Organization of the United Nations: Rome, Italy, 2000; ISBN 978-92-5-104219-9. [Google Scholar]
  20. De Oliveira, H.F.E.; De Moura Campos, H.; Mesquita, M.; Machado, R.L.; Vale, L.S.R.; Siqueira, A.P.S.; Ferrarezi, R.S. Horticultural Performance of Greenhouse Cherry Tomatoes Irrigated Automatically Based on Soil Moisture Sensor Readings. Water 2021, 13, 2662. [Google Scholar] [CrossRef]
  21. Pereira, L.S.; Paredes, P.; Jovanovic, N. Soil Water Balance Models for Determining Crop Water and Irrigation Requirements and Irrigation Scheduling Focusing on the FAO56 Method and the Dual Kc Approach. Agric. Water Manag. 2020, 241, 106357. [Google Scholar] [CrossRef]
  22. Smith, M. CROPWAT: A Computer Program for Irrigation Planning and Management; FAO Irrigation and Drainage Paper; Ver. 5.7; Food and Agriculture Organization of the United Nations: Rome, Italy, 1992; ISBN 978-92-5-103106-3. [Google Scholar]
  23. Etissa, E.; Dechassa, N. Estimation of Yield Response (Ky) and Validation of CropWat for Tomato under Different Irrigation Regimes. Irrig. Drain. Syst. Eng. 2016, 5, 1–6. [Google Scholar] [CrossRef]
  24. Gebremariam, F.T.; Habtu, S.; Yazew, E.; Teklu, B. The Water Footprint of Irrigation-Supplemented Cotton and Mung-Bean Crops in Northern Ethiopia. Heliyon 2021, 7, e06822. [Google Scholar] [CrossRef]
  25. Constantin, D.M.; Mincu, F.I.; Diaconu, D.C.; Burada, C.D.; Băltățeanu, E. Water Management in Wheat Farming in Romania: Simulating the Irrigation Requirements with the CROPWAT Model. Agronomy 2024, 15, 61. [Google Scholar] [CrossRef]
  26. Champaneri, D.D.; Desai, K.D.; Ahlawat, T.R.; Shrivastava, A.; Pampaniya, N.K. Assessment of CROPWAT 8.0 Model Accuracy under Deficit Irrigation Scheduling: A Sustainable Path toward Smart Water Supply. Water Supply 2024, 24, 3423–3437. [Google Scholar] [CrossRef]
  27. Egea, G.; Castro-Valdecantos, P.; Gómez-Durán, E.; Munuera, T.; Domínguez-Niño, J.M.; Nortes, P.A. Impact of Irrigation Management Decisions on the Water Footprint of Processing Tomatoes in Southern Spain. Agronomy 2024, 14, 1863. [Google Scholar] [CrossRef]
  28. Salomone, R. Pathways to Environmental Sustainability: Methodologies and Experiences; Springer: Cham, Switzerland, 2014; ISBN 978-3-319-03826-1. [Google Scholar]
  29. Ridoutt, B.G.; Pfister, S. A Revised Approach to Water Footprinting to Make Transparent the Impacts of Consumption and Production on Global Freshwater Scarcity. Glob. Environ. Change 2010, 20, 113–120. [Google Scholar] [CrossRef]
  30. Hoekstra, A.Y.; Chapagain, A.K.; Aldaya, M.M.; Mekonnen, M.M. The Water Footprint Assessment Manual: Setting the Global Standard; Earthscan from Routledge: London, UK; Washington, DC, USA, 2011; ISBN 978-1-84971-279-8. [Google Scholar]
  31. Payen, S.; Basset-Mens, C.; Perret, S. LCA of Local and Imported Tomato: An Energy and Water Trade-Off. J. Clean. Prod. 2015, 87, 139–148. [Google Scholar] [CrossRef]
  32. Chico, D. The Water Footprint and Virtual Water Exports of Spanish Tomatoes; Fundación Marcelino Botín: Santander, Spain, 2010; ISBN 978-84-96655-80-5. [Google Scholar]
  33. Vinci, G.; Campana, P.; Gobbi, L.; Prencipe, S.A.; Ruggeri, M. Integrated Evaluation of Sustainability and Quality of Italian Tomato Cultivars Grown Under Irrigated and Non-Irrigated Systems. Agriculture 2025, 15, 416. [Google Scholar] [CrossRef]
  34. Pathak, T.B.; Stoddard, C.S. Climate Change Effects on the Processing Tomato Growing Season in California Using Growing Degree Day Model. Model. Earth Syst. Environ. 2018, 4, 765–775. [Google Scholar] [CrossRef]
  35. Dane, J.H.; Topp, G.C.; Campbell, G.S. (Eds.) Methods of Soil Analysis: Part 4: Physical Methods; Number 5 in the Soil Science Society of America Book Series; Soil Science Society of America: Madison, WS, USA, 2002; ISBN 978-0-89118-893-3. [Google Scholar]
  36. CROPWAT Software, FAO, Land and Water Division. Available online: http://www.fao.org/land-water/databases-and-software/cropwat/en/ (accessed on 20 October 2024).
  37. Savva, A.P.; Frenken, K. Irrigation Manual: Planning, Development, Monitoring and Evaluation of Irrigated Agriculture with Farmer Participation; Food and Agriculture Organization of the United Naitons (FAO), Sub-Regional Office for East and Southern Africa (SAFR): Harare, Zimbabwe, 2001; ISBN 978-0-7974-2318-3. [Google Scholar]
  38. Ewaid, S.H.; Abed, S.A.; Al-Ansari, N. Crop Water Requirements and Irrigation Schedules for Some Major Crops in Southern Iraq. Water 2019, 11, 756. [Google Scholar] [CrossRef]
  39. Muratoglu, A.; Bilgen, G.K.; Angin, I.; Kodal, S. Performance Analyses of Effective Rainfall Estimation Methods for Accurate Quantification of Agricultural Water Footprint. Water Res. 2023, 238, 120011. [Google Scholar] [CrossRef]
  40. EN ISO 14046; Environmental Management Water Footprint Principles, Requirements and Guidelines. International Organization for Standardization (ISO): Geneva, Switzerland, 2016. Available online: https://www.iso.org/standard/43263.html (accessed on 23 February 2025).
  41. Pellegrini, G.; Ingrao, C.; Camposeo, S.; Tricase, C.; Contò, F.; Huisingh, D. Application of Water Footprint to Olive Growing Systems in the Apulia Region: A Comparative Assessment. J. Clean. Prod. 2016, 112, 2407–2418. [Google Scholar] [CrossRef]
  42. Mekonnen, M.M.; Hoekstra, A.Y. The Green, Blue and Grey Water Footprint of Crops and Derived Crop Products. Hydrol. Earth Syst. Sci. 2011, 15, 1577–1600. [Google Scholar] [CrossRef]
  43. Bouregaa, T.; Chetioui, C. Assessment of Climate Change Impact on Wheat Water Demand and Yield in Setif, Algeria. Water Conserv. Sci. Eng. 2025, 10, 1. [Google Scholar] [CrossRef]
  44. Gabr, M.E. Impact of Climatic Changes on Future Irrigation Water Requirement in the Middle East and North Africa’s Region: A Case Study of Upper Egypt. Appl. Water Sci. 2023, 13, 158. [Google Scholar] [CrossRef]
  45. N’guessan, K.J.-Y.; Adahi, B.; Konan-Waidhet, A.-B.; Masayoshi, S.; Assidjo, N.E. Assessment of Climate Change Impact on Water Requirement and Rice Productivity. Rice Sci. 2023, 30, 276–293. [Google Scholar] [CrossRef]
  46. Ronghang, R.; Patle, G.T.; Vashisht, A.K.; Kusre, B.C.; Jhajharia, D.; Kumar, M. Crop Water Demand Estimation and Irrigation Scheduling for Sustainable Water Management and Crop Planning in Selected Watersheds of Meghalaya, India. Water Environ. Res. 2025, 97, e70038. [Google Scholar] [CrossRef]
  47. Kc, B.; Schultz, B.; Mohssen, M.; Chau, H.W.; Pandey, V.P.; Prasad, K.; Anthony, P. Assessing Effective Pasture Root Depth for Irrigation Scheduling by Water Balance and Soil Moisture Monitoring. Irrig. Drain. 2022, 71, 971–979. [Google Scholar] [CrossRef]
  48. Kanzari, S.; Daghari, I.; Šimůnek, J.; Younes, A.; Ilahy, R.; Ben Mariem, S.; Rezig, M.; Ben Nouna, B.; Bahrouni, H.; Ben Abdallah, M.A. Simulation of Water and Salt Dynamics in the Soil Profile in the Semi-Arid Region of Tunisia—Evaluation of the Irrigation Method for a Tomato Crop. Water 2020, 12, 1594. [Google Scholar] [CrossRef]
  49. Bayisa, G.D.; Ayana, M.; Mekonnen, B.; Hordofa, T.; Dinka, M.O. Drainage Lysimeter Based Measurement of Water Requirement and Crop Coefficient of Bread Wheat under Semi-Arid Climate of Melkassa, Ethiopia. Heliyon 2024, 10, e36969. [Google Scholar] [CrossRef] [PubMed]
  50. Kebede, N.; Ayana, M.; Mekonnen, B. Quantification of Onion (Allium cepa L.) Evapotranspiration and Crop Coefficient via Weighable Lysimeter under Semi-Arid Climate of Melkasa, Ethiopia. Heliyon 2025, 11, e42566. [Google Scholar] [CrossRef] [PubMed]
  51. Loos, C.; Gayler, S.; Priesack, E. Assessment of Water Balance Simulations for Large-Scale Weighing Lysimeters. J. Hydrol. 2007, 335, 259–270. [Google Scholar] [CrossRef]
  52. Wu, Y.; Yan, S.; Fan, J.; Zhang, F.; Zhao, W.; Zheng, J.; Guo, J.; Xiang, Y.; Wu, L. Combined Effects of Irrigation Level and Fertilization Practice on Yield, Economic Benefit and Water-Nitrogen Use Efficiency of Drip-Irrigated Greenhouse Tomato. Agric. Water Manag. 2022, 262, 107401. [Google Scholar] [CrossRef]
  53. Balendonck, J.; Hemming, J.; van Tuijl, B.A.J.; Incrocci, L.; Pardossi, A.; Marzialetti, P. Sensors and wireless sensor networks for irrigation management under deficit conditions (FLOW-AID). Presented at the AgEng2008, International Conference on Agricultural Engineering, Crete, Greece, 23–25 June 2008. [Google Scholar]
  54. Braaten, M.; Ireson, A. A Critical Assessment of Geological Weighing Lysimeters: Part 1—Monitoring Field Scale Soil Moisture Storage. Hydrol. Process. 2025, 39, e70042. [Google Scholar] [CrossRef]
  55. Reta, B.G.; Hatiye, S.D.; Finsa, M.M. Crop Water Requirement and Irrigation Scheduling under Climate Change Scenario, and Optimal Cropland Allocation in Lower Kulfo Catchment. Heliyon 2024, 10, e31332. [Google Scholar] [CrossRef]
  56. Garofalo, P.; Riccardi, M.; Di Tommasi, P.; Tedeschi, A.; Rinaldi, M.; De Lorenzi, F. AquaCrop Model to Optimize Water Supply for a Sustainable Processing Tomato Cultivation in the Mediterranean Area: A Multi-Objective Approach. Agric. Syst. 2025, 223, 104198. [Google Scholar] [CrossRef]
  57. Khaskhoussy, K.; Zarai, B.; Zouari, M.; Nasr, Z.; Hachicha, M. The Impact of Climate Change on Tomato Water Footprint under Irrigation with Saline Water in a Kairouan Irrigated Area (Tunisia Center). Horticulturae 2024, 10, 1267. [Google Scholar] [CrossRef]
  58. Aldaya, M.M.; Hoekstra, A.Y. The Water Needed for Italians to Eat Pasta and Pizza. Agric. Syst. 2010, 103, 351–360. [Google Scholar] [CrossRef]
  59. Evangelou, E.; Tsadilas, C.; Tserlikakis, N.; Tsitouras, A.; Kyritsis, A. Water Footprint of Industrial Tomato Cultivations in the Pinios River Basin: Soil Properties Interactions. Water 2016, 8, 515. [Google Scholar] [CrossRef]
Figure 1. Decadal irrigation requirements determined for probe method, years 2022, 2023, and 2024, for IR100 and RDI70 irrigation strategy. Jun: June; Jul: July; Aug: August; Sep: September.
Agronomy 15 01533 g001
Figure 2. Water footprint green for CROPWAT and probes. The graph compares the results for Full irrigation (IR100) and regulated deficit irrigation (RDI70) strategies.
Agronomy 15 01533 g002
Figure 3. Water footprint blue for CROPWAT and probes. The graph compares the results for Full irrigation (IR100) and regulated deficit irrigation (RDI70) strategies.
Agronomy 15 01533 g003
Figure 4. Crop water requirement and water footprint blue for the period 2022–2024.
Agronomy 15 01533 g004
Figure 5. Water footprint grey for CROPWAT and probes, for IR100 and RDI70 irrigation strategies.
Agronomy 15 01533 g005
Figure 6. Water footprint total for CROPWAT and probes, for IR100 and RDI70 irrigation strategies.
Agronomy 15 01533 g006
Table 1. Physicochemical properties of the soil at the experimental site.
ParametersUnit of MeasurementSoil 2022Soil 2023Soil 2024
Sandy%645958
Loam%131313
Clay%232829
N totg kg−11.31.142.0
P2O5mg kg−1213610.3
K2Omg kg−1136211103
C organicg kg−111.617.0515.7
Organic matter%1.461.341.57
Electrical conductivityµS cm−1189.3233.4729.6
pH 7.07.47.9
Table 2. Daily duration of phenological phases and computation of respective growing degree days (GDD).
SitesGrowing Season Length
DATGDD
InitDeveMidLateInitDeveMidLate
Carboj 200226242622429.1424.8375.1372.9
Carboj 202326192722377.3346.1437.1341.6
Buonfornello 202429281618357.8429.8295.85295.25
Init: initial; Deve: development; Mid: mid-season; Late: late-season; DAT: days after transplant; GDD: growing degree days.
Table 3. Soil hydrological data.
SitesθFC
[m3 m−3]
θIP
[m3 m−3]
Carboj 2022 IR1000.2570.226
Carboj 2022 RDI700.2570.226
Carboj 2023 IR1000.2570.218
Carboj 2023 RDI700.2300.199
Buonfornello 2024 IR1000.3370.308
Buonfornello 2024 RDI700.3370.186
Disclaimer/Publisher’s Note: The statements, opinions and data contained in all publications are solely those of the individual author(s) and contributor(s) and not of MDPI and/or the editor(s). MDPI and/or the editor(s) disclaim responsibility for any injury to people or property resulting from any ideas, methods, instructions or products referred to in the content.

