1. Introduction
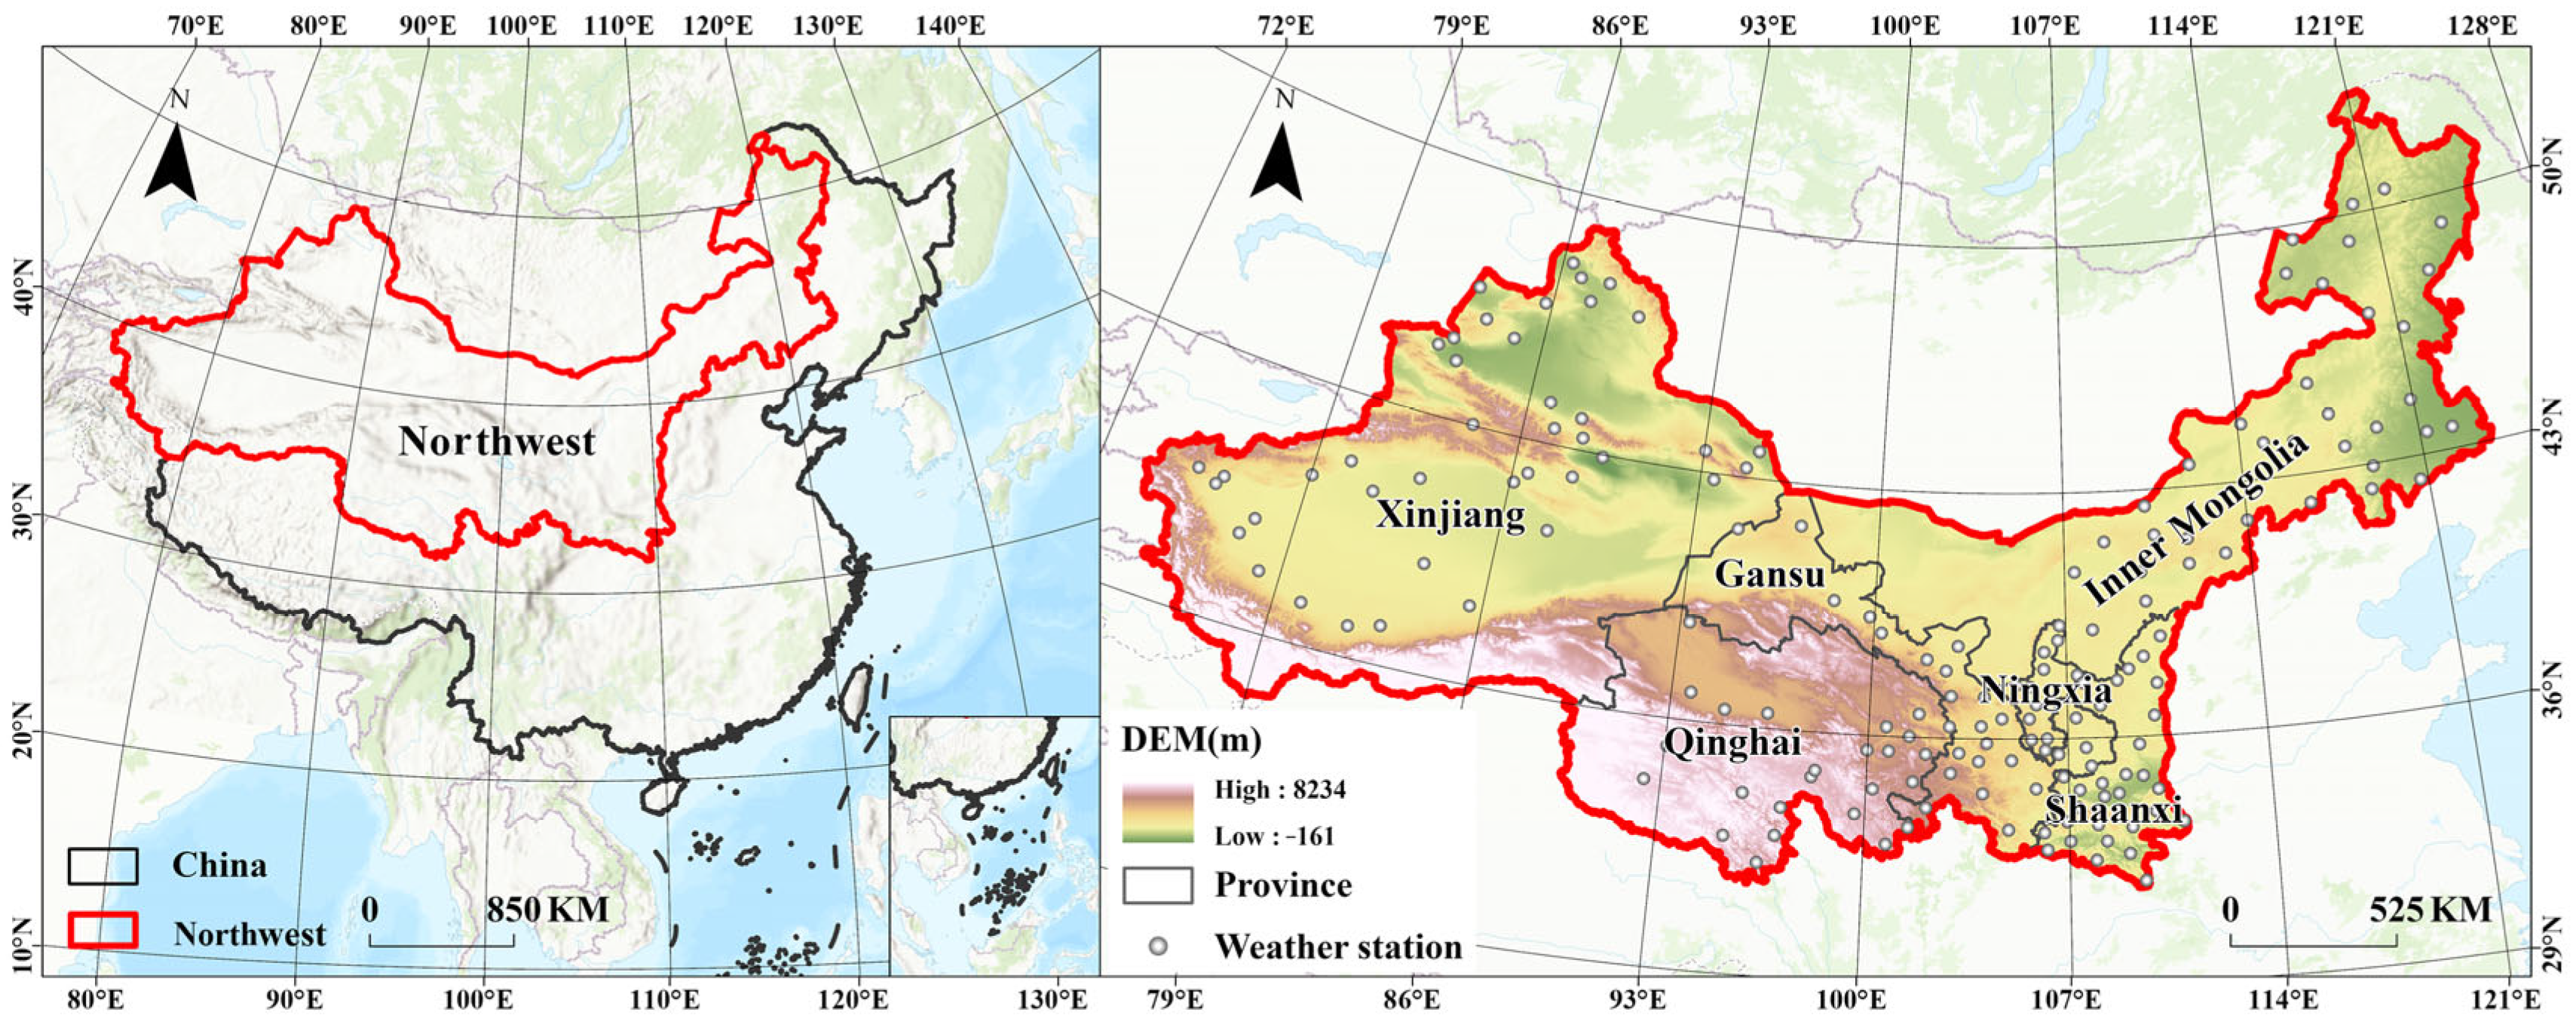
The arid and semi-arid regions of Northwest China, recognized as a strategic core for national food security, have made the efficiency and sustainability of agricultural water resource utilization a critical scientific issue for regional development. The region produces 12% of the national grain output while using only 10% of the country’s water resources and 15% of its arable land, forming a distinctive “low water, high grain” production model [
1]. However, the rapid agricultural modernization and continued expansion of irrigated land have led to increasing agricultural water demand, intensifying the imbalance between water supply and demand [
2]. Inefficient water management and overexploitation have disrupted regional water allocation, severely hindering sustainable economic development [
3]. In this context, optimizing agricultural water management to ensure sustainable use has become a pressing scientific challenge demanding urgent action.
The crop water footprint theory, a comprehensive indicator of crop water consumption [
4], provides a multidimensional framework for systematically evaluating agricultural water use by integrating the blue (surface and groundwater), green (rainwater), and grey (the amount of water needed to dilute non-point source pollution) water footprints [
5]. With the deepening integration of water footprint theory into traditional agricultural water resource research [
6], and the broad recognition of the robustness of the CROPWAT model [
7], this framework has enabled assessments of agricultural water use at both global and regional scales. Feng et al. conducted multi-scale assessments of maize, wheat, and rice water footprints at the global level [
8]. Mekonnen et al. found that over half of the global blue water footprint is being used unsustainably [
9]. Based on crop–water relationships, Cao et al. reported that green water consumption accounts for more than 50% of total agricultural water use in China [
10]. At the county scale, Nie Hanlin et al. showed that the water footprint of winter wheat and summer maize in the Guanzhong region is primarily composed of blue water [
11]. Feng et al. identified significant spatial clustering of crop water footprints in the Huai River Basin [
12].
Various analytical methods have been employed to investigate driving mechanisms. The BP neural network–decision model [
13] and path analysis [
14] are suitable for capturing nonlinear relationships, the STIRPAT model [
15] and input-output model [
16] are used to decompose socio-economic drivers; and grey relational analysis [
17] is particularly useful when data availability is limited. The Logarithmic Mean Divisia Index (LMDI) method effectively addresses zero-value issues in datasets and can eliminate residuals [
18]. It enables annual quantification of individual influencing factors throughout the study period, thereby capturing the temporal evolution of combined effects on crop water footprints [
19]. Research on water resource evaluation systems has mainly focused on selecting appropriate methods and optimizing indicators, resulting in methodological frameworks that incorporate fuzzy comprehensive evaluation [
20], the analytic hierarchy process [
21], grey target model [
22] and principal component analysis [
23]. Evaluation dimensions have moved beyond traditional single-indicator approaches. For example, Wade et al. proposed the Blue Water Sustainability Index and established a global assessment framework [
24]. Chaves et al., using the pressure–state–response framework, applied the Watershed Sustainability Index to evaluate river basins in Brazil [
25].
In recent years, growing attention has been paid to the dynamics of crop water footprints and the sustainable management of agricultural water use in arid regions. Mizyed et al. [
26] used the CROPWAT model to assess the agricultural water footprint in the Gaza Strip, revealing that blue water was the primary source of water consumption. Similarly, studies in the arid regions of Northwest China have shown that blue water accounts for up to 80% of the total crop water footprint. Expanding the cultivation of vegetables, tubers, and legumes has been identified as an effective strategy to reduce water consumption and improve ecological benefits [
27]. Despite recent progress in this field in Northwest China, several limitations persist: (1) unbalanced analytical dimensions, with excessive emphasis on the blue water footprint and insufficient consideration of the systemic relationships among multiple water footprint types; (2) methodological limitations in analyzing driving mechanisms, particularly due to small sample sizes causing multicollinearity and attribution bias; and (3) a single-dimensional evaluation system lacking an integrated analytical framework. Therefore, this study applies the LMDI method to decompose the contributions of technological progress, water-saving management, economic development, tertiary sector structure, policy and institutional factors, and population scale to changes in the water footprint. Furthermore, a comprehensive multi-dimensional evaluation system was developed, structural, economic, ecological, and sustainability indicators. This approach offers a more systematic understanding of the driving mechanisms and their spatial heterogeneity. The findings not only expand the methodological applications in arid regions of Northwest China but also provide more specific policy recommendations for optimizing regional agricultural water resource management.
3. Results
3.1. Agricultural Water Footprint and Its Crop Composition
The agricultural water footprint in Northwest China from 2000 to 2020 exhibited a three-phase “decline–increase–decline” trend. From 2000 to 2003, adjustments in cropping structure and a reduction in sown area led to a decrease in the water footprint from 90.98 billion m
3 to 82.51 billion m
3. Between 2003 and 2017, agricultural subsidy policies stimulated planting expansion, causing the water footprint to peak at 133.49 billion m
3. From 2017 to 2020, farmland conversion to construction land and the implementation of ecological protection policies reduced planting areas, resulting in a decline in water footprint to 129.30 billion m
3 (
Figure 2). The average annual values of blue, green, and grey water footprints were 55.97, 43.33, and 136.73 billion m
3, respectively—all showing upward trends. Among them, the blue water footprint contributed approximately 50% of the total, making it the dominant component of agricultural water consumption. Disparities in crop water footprints across provinces in Northwest China have become increasingly pronounced, mainly due to imbalances in cultivated land area and water resource distribution. The ranking of total agricultural water footprints was: Xinjiang > Inner Mongolia > Shaanxi > Gansu > Ningxia > Qinghai. Xinjiang exhibited the most rapid increase and the highest total consumption, gradually becoming the province with the greatest water demand. In contrast, Ningxia and Qinghai showed relatively stable water footprints, with fluctuations remaining within 3 billion m
3. Green water footprint was the main source of agricultural water consumption in Qinghai and Shaanxi, while blue water footprint dominated in the other provinces. Notably, Xinjiang experienced the largest increase in blue water use, which constituted the majority of its total agricultural water footprint.
WFY in the Northwest region significantly decreased from 1117.96 m
3/t to 658.20 m
3/t during the study period (
Figure 3). Except for the year 2003, the WFY
blue was generally higher than the WFY
green in most years. This disparity primarily stems from the region’s arid climate, low precipitation, and limited green water availability, which compel crops to rely heavily on blue water for growth. However, after 2012, WFY
blue and WFY
green gradually converged, reflecting that advancements in irrigation and cultivation technologies substantially improved crop yields per unit area, thereby reducing the overall WFY.
Variations in agricultural crop water footprints were primarily driven by crop water requirements during the growing season and the scale of cultivation. Maize, wheat, and cotton were the main contributors to the total agricultural water footprint. The water footprints of maize and cotton exhibited increasing trends, while that of wheat declined significantly (
Figure 4). Overall, the total agricultural water footprint showed a declining trend during the periods 2000–2003 and 2017–2019. Specifically, the water footprint of wheat decreased from 21.6 billion m
3 to 16.7 billion m
3, mainly due to cropping pattern adjustments that reduced its cultivated area. In contrast, the water footprint of maize increased from 16.4 billion m
3 to 35.7 billion m
3, and that of cotton rose from 8.5 billion m
3 to 20.8 billion m
3, primarily because their growing seasons coincide with peak temperature periods. Driven by market demand, the water footprints of fruits and vegetables also increased significantly. The vegetable water footprint rose from 9.1 billion m
3 to 18.8 billion m
3, while the fruit water footprint increased from 8.9 billion m
3 to 14.1 billion m
3.
Agricultural crops in Northwest China were classified into three categories: food crops (wheat, rice, maize, potatoes, and beans), cash crops (cotton, oil crops, and vegetables), and fruits (apples, grapes, pears, and melons) (
Figure 5). In terms of water footprint contribution, food crops accounted for the largest share, followed by cash crops and fruits. Spatial variation revealed distinct regional differences. In Xinjiang, cash crops contributed more to the water footprint than food crops and fruits, whereas in other provinces, food crops remained the dominant contributor, followed by cash crops and fruits. Notably, cash crops in Xinjiang, food crops in Inner Mongolia, and fruits in Shaanxi exhibited substantial growth, indicating a coordinated adjustment mechanism shaped by the interaction between regional resource endowments and market demand.
3.2. Spatiotemporal Evolution of the Crop Water Footprint Pattern
Standard deviation ellipse analysis conducted using ArcGIS 10.8 revealed clear spatial expansion and migration patterns of the crop water footprint in Northwest China (
Figure 6). From 2000 to 2020, the standard deviation ellipse gradually expanded along the northwest–southeast axis. The spatial centroid of the crop water footprint underwent two distinct phases of migration. Between 2000 and 2014, it shifted northwestward, centering in northern Qinghai and progressively moving toward Xinjiang. This shift corresponded with the rapid agricultural development in Xinjiang, particularly the expansion of cotton cultivation—a highly water-intensive crop. During this period, the proportion of cotton in the total sown area increased from 33% to 45%, raising the agricultural water footprint from 8.5 to 20.8 billion m
3. Between 2014 and 2020, the centroid migrated toward southwestern Inner Mongolia, driven by an increase in both sown area and crop production. Specifically, the region saw an expansion of 880 thousand hectares in cultivated area and an increase of 3.48 million tons in output, resulting in a 990 million m
3 rise in crop water footprint.
Substantial spatial differences were observed in both the crop water footprint and crop composition across provinces in Northwest China (
Figure 7). Inner Mongolia, Xinjiang, and Gansu exhibited relatively high crop water footprints, with an overall increasing trend and the most pronounced changes occurring around 2014. In contrast, Ningxia and Qinghai consistently maintained low crop water footprints, ranging between 1 and 10 billion m
3, while Shaanxi’s values fluctuated between 20 and 30 billion m
3. These significant interprovincial disparities were primarily driven by differences in cropping structure. Xinjiang, as the leading cotton-producing region in China, recorded the highest proportion of crop water footprint attributed to cotton, which has continued to rise. In Inner Mongolia and Gansu, maize accounted for a substantial share of the water footprint, also exhibiting an upward trend. In Qinghai, oils represented the largest component of the crop water footprint, although a declining trend was observed. Meanwhile, the proportions of vegetable-related water footprints were relatively high in Ningxia and Shaanxi, both showing a notable increasing trend.
3.3. LMDI-Based Analysis of Crop Water Footprint Drivers in Northwest China
The evolution of crop water footprints in Northwest China was driven by a combination of multiple factors, whose influence varied significantly in intensity (
Figure 8). These driving forces can be categorized into three types: inhibitory factors (water-saving management and population scale effects), promoting factors (policy and institutional effects, economic development, and the tertiary sector structure), and bidirectional drivers (technological progress).
Among the inhibitory factors, the water-saving management effect included a positive contribution from the expansion of effectively irrigated areas (1.07 billion m3). In contrast, agricultural water use per unit of cultivated area and per capita exerted negative effects, contributing −8.40 billion m3 and −1.48 billion m3, respectively. The population scale effect contributed −1.62 billion m3, indicating increasing constraints on agricultural water use due to demographic pressure, which is closely tied to the regional water resource carrying capacity. Among the promoting factors, the policy and institutional effect (1.96 billion m3) and the economic development effect (8.81 billion m3) were the dominant positive drivers. Notably, policy implementation in 2002 alone contributed 8.27 billion m3. The rise in economic output per unit of cultivated land, coupled with intensified water use, suggests that an extensive growth model still predominates. Agricultural economic expansion has led to the overexploitation of water resources, thereby constraining the efficient use and management of water in crop production. The tertiary sector structure contributed 481 million m3; however, industrial restructuring has not yet significantly reduced pressure on agricultural water consumption. In fact, shifts in agriculture’s share within the tertiary sector continue to drive increased water demand. Technological progress, as a bidirectional driver, showed dual effects: a reduction in water footprint per unit of crop output (−2.22 billion m3) and an increase in yield per unit area (2.92 billion m3). In 2002, both components acted as restraining forces, reflecting the trade-off between improved technical efficiency and the expansion of cultivation scale. These findings highlight persistent technological bottlenecks in achieving efficient water resource utilization.
Based on the contribution analysis, the ranking of influencing factors on crop water footprint in Northwest China was as follows: policy and institutional effect > economic development effect > technological progress > water-saving management > population scale > tertiary sector structure. Policy and institutional effects, along with economic development, emerged as the dominant drivers, jointly contributing over 49% of the total change. Significant interprovincial differences were observed: policy and institutional effects consistently ranked first across all regions, largely due to the ongoing implementation of water-saving and efficiency-enhancing initiatives. The strong influence of economic development is closely tied to the region’s agricultural industrialization, marked by the steady expansion of cash crop cultivation. In particular, the large-scale production of water-intensive cotton in Xinjiang has significantly increased the water footprint per unit of agricultural output value. The effects of technological progress and water-saving management varied notably across provinces. In Xinjiang, the pilot implementation of agricultural water rights trading has led to a substantially higher contribution from water-saving management compared to other provinces, demonstrating the efficiency gains from market-based mechanisms in water resource allocation. In contrast, Inner Mongolia exhibited a relatively lower contribution from technological progress, mainly due to delays in modernizing irrigation infrastructure in pastoral areas.
3.4. Comprehensive Evaluation of the Utilization Efficiency of Crop Water Footprint
3.4.1. Structural Indicators of Crop Water Footprint
The assessment of crop water footprint structure indicators in Northwest China from 2000 to 2020 revealed notable patterns in the transformation of water resource utilization (
Figure 9). Overall, the region exhibited a relatively balanced reliance on blue and green water, primarily attributed to improvements in the efficiency of rainfed agriculture, which gradually reduced dependence on artificial irrigation. At the inter-provincial level, water resource dependence displayed significant spatial heterogeneity. Qinghai and Shaanxi showed a greater reliance on green water compared to blue water, owing to higher levels of natural precipitation. In contrast, Inner Mongolia exhibited fluctuating patterns of dependence, reflecting variability in both precipitation and irrigation practices. In the remaining provinces—and in the region as a whole—blue water dependence exceeded that of green water, although a gradual decline in blue water reliance was observed over time. This trend indicates progress in optimizing water use efficiency across the region. Qinghai and Shaanxi developed green water-dominated structures due to relatively abundant precipitation, whereas Inner Mongolia experienced interannual fluctuations in green-blue water reliance. The other provinces remained predominantly blue water-dependent, albeit with a gradual shift toward more balanced use. The evolution of the grey water footprint presented a polarized pattern. In Ningxia, Qinghai, and Gansu, dependence on grey water declined, largely driven by enhanced water–fertilizer use efficiency and improved pollution control measures. Conversely, Shaanxi, Xinjiang, and Inner Mongolia experienced increased reliance on grey water, resulting from the expansion of cultivated land and the corresponding rise in fertilizer application. This divergence underscores substantial regional disparities in the management of non-point source pollution and highlights the need for differentiated strategies for agricultural pollution control.
3.4.2. Efficiency Indicators of Crop Water Footprint
From 2000 to 2020, crop water footprint efficiency indicators in Northwest China demonstrated pronounced spatiotemporal heterogeneity in regional water resource utilization (
Figure 10). Overall, the land-based crop water footprint density ranged from 5.0 to 6.1 × 10
8 m
3/km
2, primarily driven by increasing agricultural water consumption across provinces. However, resource-use efficiency exhibited a clear polarization pattern: Ningxia, despite having a relatively small cultivated area, registered the highest water footprint density, indicating a pronounced mismatch between land availability and water resource consumption. In contrast, Inner Mongolia, which had the largest cultivated area, displayed the lowest variation in land-based water footprint density. Population density per unit of water footprint ranged from 9 to 15 persons per 10
4 m
3, with Qinghai showing notable elasticity in its water-carrying capacity—its population-supporting capacity per unit of water footprint was nearly double that of other provinces. Economic output per unit of water footprint varied substantially, from 6 to 57 yuan/m
3. Qinghai recorded the most significant increase, driven by the expansion of high-value specialty crop cultivation and the widespread adoption of water-saving technologies. Comprehensive evaluations indicated that, although regional water use efficiency improved considerably over the study period, rising water consumption per unit output and a declining population-supporting capacity exposed underlying systemic vulnerabilities. Notably, Xinjiang emerged as a critical area of concern, characterized by high water consumption, low economic output per unit water use, and limited population-supporting capacity. To address these challenges, it is imperative to strengthen the coordination among water, land, and economic systems. This can be achieved through the optimization of crop structures and the implementation of precision irrigation technologies tailored to regional resource conditions.
3.4.3. Ecological Indicators of Crop Water Footprint
Ecological indicators of the crop water footprint in Northwest China from 2000 to 2020 revealed an overall pattern of stability accompanied by pronounced spatial polarization in water resource pressure (
Figure 11). Both sown area and crop yield across provinces exhibited a continuous upward trend, while overall water pressure remained relatively stable, primarily attributable to improvements in irrigation efficiency and an increasing proportion of drought-tolerant crops. However, the uneven spatial distribution of water resources and significant inter-provincial differences in agricultural water use resulted in marked spatial disparities in water pressure. Regarding total water pressure, the region as a whole was generally under moderate stress. Qinghai experienced negligible water pressure, as it possessed 20% of the region’s water resources but contributed only 2% of the total crop yield, leading to a relatively low pressure level. Xinjiang and Inner Mongolia faced low to moderate water pressure, whereas Shaanxi and Gansu were subjected to moderate to high pressure. Ningxia, with only 1% of the regional water resources but approximately 6% of crop output, endured high to severe water pressure, making it the most water-stressed province in Northwest China. Among the three types of water pressure, green water pressure remained at moderate to high levels across the region. Blue water pressure exhibited clear spatial polarization, with Ningxia under severe pressure and Qinghai facing virtually no pressure. Grey water pressure consistently remained high in Ningxia, reflecting inadequate management of non-point source pollution in the province.
3.4.4. Sustainability of Crop Water Footprint
The sustainability assessment of crop water footprints in Northwest China from 2000 to 2020 revealed considerable variability in water resource availability (
Figure 12). Smaller negative growth values corresponded to greater reductions in water resources, which were primarily driven by uneven spatial distribution and frequent natural disasters. Overall, sustainable agricultural water use was achieved in only half of the years during the study period. In Xinjiang, sustainable water use occurred in just one-third of the years, largely attributable to irrational cropping patterns and insufficient precipitation. Notably, in 2004, all provinces experienced unsustainable water use conditions, primarily due to a sharp decline in available water resources. This highlighted the poor sustainability of agricultural water use, low efficiency in resource utilization, and urgent challenges to securing agricultural water resources across the region.
4. Discussion
In crop water footprint assessment, the crop water footprint has become a key indicator for quantifying agricultural water consumption and evaluating the sustainability of water resource use [
40]. During drought years, dynamic variations are pronounced—blue water footprints tend to increase significantly, while green water footprints decline—indicating that reduced precipitation forces agriculture to rely more heavily on irrigation to compensate for natural water deficits [
41]. This phenomenon is particularly evident in Gansu, where the blue water footprint in 2011 exceeded the trend value by over 15%, as well as in Shaanxi and Ningxia, highlighting the heightened sensitivity of water resource systems under extreme climatic conditions [
42]. The mismatch between cropping structure and water resource endowment further exacerbates regional pressure. In arid areas such as Xinjiang, the planting area of high water-consuming crops (cotton, fruits, and vegetables) is poorly aligned with limited precipitation. Conversely, in relatively humid regions such as Shaanxi, more than 50% of cultivated land is allocated to medium- and low-water-consuming crops (maize and wheat), yet green water utilization efficiency remains low [
43]. Climate warming is driving a northward shift in cropping zones [
44], significantly affecting planting systems, spatial layouts, and varietal choices [
45], while also contributing to increases in cropping intensity and yield per unit area [
46]. For example, the water footprint of maize in Inner Mongolia rose from 5.64 billion m
3 to 15.5 billion m
3, and cotton production has increasingly shifted to Xinjiang, where planting area expanded by 12% [
47]. The promotion of late-maturing rice and maize varieties has also led to notable yield improvements [
48]. Water resource pressure in Northwest China exhibits a spatial pattern of “dual polarization.” Qinghai represents a “high endowment–low efficiency” region, accounting for approximately 25% of the total regional water resources but suffering from low agricultural water use efficiency due to mismatched cropping structures and suboptimal water planning. In contrast, Ningxia shows a “resource-overloaded scarcity” pattern, with agricultural water consumption exceeding local water availability by a factor of seven, intensifying the risk of allocation imbalance [
49]. Collectively, these findings underscore a systemic contradiction between “declining water availability” and “increasing water demand,” resulting in unsustainable crop water supply levels in about half of the years across Northwest China.
In comparing and analyzing the results obtained in this study, the reliability of crop water footprint estimates based on the CROPWAT model was assessed by selecting representative crops and comparing the calculated values with those reported in previous studies (
Table 3). Overall, the water footprint values derived in this study are largely consistent with existing literature in terms of both magnitude and temporal trends, indicating that the CROPWAT model exhibits strong applicability in Northwest China. However, some regional discrepancies were observed: estimates of water footprint in most parts of Northwest China were generally higher than those in earlier studies, except for certain areas in Xinjiang. These differences may be attributed to several factors: (1) the data used in this study reflect recent trends in cropping structure adjustments, which are strongly spatially correlated with the distribution of water footprints [
27]; (2) although previous studies covered similar regions, differences in crop types selected and sample sizes may have influenced the comparability of the results; and (3) uncertainties in input parameters—such as crop coefficients, cropping systems, and climatic data—may have led to slight underestimations for certain crops. Therefore, this comparative analysis not only confirms the rationality of using the CROPWAT model to estimate crop water use in arid regions of Northwest China, but also provides a methodological foundation for the precise regulation of regional agricultural water resources.
Despite offering valuable insights, this study has several limitations and implications for future research. Using meteorological station data and the CROPWAT model, the crop water footprint in Northwest China was evaluated, with results showing consistency with previous studies in terms of both spatial distribution and temporal trends. However, the analysis is constrained by limited data availability. Specifically, the lack of long-term historical datasets and multi-temporal scale comparisons limits a more comprehensive understanding of water footprint dynamics. Additionally, the estimation of the grey water footprint only considers nitrogen fertilizer as the primary pollutant, overlooking other potential sources such as phosphorus fertilizers and pesticides, which may lead to an underestimation of actual pollution loads. Furthermore, although the LMDI model was used to quantify the contribution of key driving factors, the direct and indirect effects of climatic variables were not fully explored. Future studies should address these limitations by investigating the spatiotemporal variability of crop water footprints at finer spatial scales (county level), integrating field observations with remote sensing data to optimize parameter calibration and improve estimation accuracy. A more comprehensive analytical framework is also needed to reveal the mechanisms through which natural and anthropogenic factors affect agricultural water use, thereby enhancing the integrated assessment of regional water resource systems. From a practical standpoint, promoting drought-tolerant crops (millet and quinoa) and water-saving varieties (such as drought-resistant cotton and water-efficient potatoes), while reducing the cultivation of high water-demand crops, is crucial. The widespread adoption of precision irrigation technologies, integrated water–fertilizer management, and biodegradable mulching films should also be prioritized. In ecologically fragile areas like the Hexi Corridor, efforts should be made to gradually phase out 30% of overloaded farmland, followed by the rehabilitation of medium- and low-yield fields and the development of high-efficiency agricultural zones. In addition, key ecological zones such as inland river headwater areas in Northwest China should receive stronger protection. Priority should be given to implementing ecological water diversion projects in the oasis–desert transition zones of the Hexi Corridor. In the Tarim Basin, an integrated approach that combines water-saving technologies, ecological agriculture, and green finance mechanisms could be applied. In solar-rich areas such as the Hexi Corridor, pilot initiatives involving agroforestry-livestock systems and photovoltaic agriculture are also recommended.
5. Conclusions
This study employed a multi-scale spatiotemporal analysis by integrating the CROPWAT model with GIS techniques to systematically examine the temporal dynamics and driving forces of crop water footprints in Northwest China from 2000 to 2020. The results revealed a fluctuating “decline–increase–decline” pattern in crop water footprints, accompanied by an overall upward trend and spatial expansion along the northwest–southeast axis. Among crop types, food crops exhibited the highest water footprints, followed by cash crops and fruit crops. The analysis of driving forces indicated that policy and institutional factors, along with economic development, were the primary contributors, jointly accounting for up to 49% of the variation. Although irrigation demand was partially alleviated, the region remained under moderate water stress overall, with sustainable water use achieved in only half of the study years. Given rising national food demand, agricultural water resource pressure remains high. Therefore, tailored management strategies that consider regional water and soil conditions, coupled with the promotion of smart agriculture, are essential to relieve water stress and ensure the sustainable use of agricultural water resources in Northwest China.


