Article

Optimization of Sorghum Spike Recognition Algorithm and Yield Estimation

1
College of Agricultural Engineering, Shanxi Agricultural University, Jinzhong 030801, China
2
Dryland Farm Machinery Key Technology and Equipment Key Laboratory of Shanxi Province, Jinzhong 030801, China
3
College of Agriculture, Shanxi Agricultural University, Jinzhong 030801, China
*
Author to whom correspondence should be addressed.
Agronomy 2025, 15(7), 1526; https://doi.org/10.3390/agronomy15071526
Submission received: 29 May 2025 / Revised: 21 June 2025 / Accepted: 22 June 2025 / Published: 23 June 2025

Abstract

In the natural field environment, the high planting density of sorghum and severe occlusion among spikes substantially increases the difficulty of sorghum spike recognition, resulting in frequent false positives and false negatives. The target detection model suitable for this environment requires high computational power, and it is difficult to realize real-time detection of sorghum spikes on mobile devices. This study proposes a detection-tracking scheme based on improved YOLOv8s-GOLD-LSKA with optimized DeepSort, aiming to enhance yield estimation accuracy in complex agricultural field scenarios. By integrating the GOLD module’s dual-branch multi-scale feature fusion and the LSKA attention mechanism, a lightweight detection model is developed. The improved DeepSort algorithm enhances tracking robustness in occlusion scenarios by optimizing the confidence threshold filtering (0.46), frame-skipping count, and cascading matching strategy (n = 3, max_age = 40). Combined with the five-point sampling method, the average dry weight of sorghum spikes (0.12 kg) was used to enable rapid yield estimation. The results demonstrate that the improved model achieved a mAP of 85.86% (a 6.63% increase over the original YOLOv8), an F1 score of 81.19%, and a model size reduced to 7.48 MB, with a detection speed of 0.0168 s per frame. The optimized tracking system attained a MOTA of 67.96% and ran at 42 FPS. Image- and video-based yield estimation accuracies reached 89–96% and 75–93%, respectively, with single-frame latency as low as 0.047 s. By optimizing the full detection–tracking–yield pipeline, this solution overcomes challenges in small object missed detections, ID switches under occlusion, and real-time processing in complex scenarios. Its lightweight, high-efficiency design is well suited for deployment on UAVs and mobile terminals, providing robust technical support for intelligent sorghum monitoring and precision agriculture management, and thereby playing a crucial role in driving agricultural digital transformation.

1. Introduction

Shanxi Province is an important base for the sorghum planting and brewing industry in China, and its sorghum planting area and output rank first in the country all year round. Sorghum is not only a traditional dominant crop in Shanxi, but also an important pillar in promoting agricultural economic development and ensuring food security [1]. However, traditional sorghum yield estimation relies on manual field surveys or climate factor regression models, which suffer from issues such as low efficiency and poor adaptability. This is especially problematic when counting spikes during the milk, dough, and maturity stages, as factors such as spike occlusion, varying scales, and uneven lighting lead to significant manual counting errors. Therefore, researching a sorghum spike detection method with high accuracy and effectiveness is of great significance for improving sorghum yield and harvest, as well as for the innovation of intelligent agricultural machinery and equipment [2,3].
In recent years, single-stage object detection algorithms, represented by the YOLO series, have been widely adopted in agricultural applications due to their end-to-end architecture advantages. YOLOv8 significantly improves detection accuracy and real-time performance through its anchor-free detection head and task-decoupled structure [4,5,6]. Researchers continue to refine models to address challenges in agricultural scenarios: Shi et al. significantly enhanced both robustness and accuracy for rice grain recognition in complex environments by incorporating cross-scale connection paths and introducing a weighted feature fusion mechanism into YOLOv8-seg [7]. To address challenges in UAV-based perspectives, the RICE-YOLO model proposed by Lan et al. effectively mitigates issues of small-target rice panicle recognition, image distortion, and dense occlusion [8]. This is achieved by integrating an EMA multi-scale attention mechanism, redesigning the neck structure, and adopting the SIoU loss function, enabling high-precision real-time detection and in-field counting. In the field of video object tracking, the DeepSORT algorithm successfully combines Kalman filtering for motion prediction with deep learning-based appearance feature matching. This maintains ID continuity during partial occlusion or overlap of targets and has been widely adopted for tracking agricultural objects [9,10,11]. Tu et al. refined DeepSORT’s feature matching strategy based on YOLOX-S, achieving 98.6% MOTA for group-housed pig tracking with an 80% reduction in ID switches [12]. Du et al. combined a lightweight YOLOv5s with an adaptive ReID model to achieve 95.33% average counting precision (ACP) for in-field pepper counting [13]. Lou et al. enhanced occlusion positioning accuracy by embedding the CBAM module for channel-spatial dual-path calibration in YOLOv5s, coupled with a dynamic coordinate update strategy that boosted tracking accuracy by 9.2% [14].
Crop panicle detection technology based on UAV imagery advanced rapidly, with researchers conducting in-depth exploration into high-density occlusion, small target recognition, and natural in-field conditions. Consuelo et al. significantly enhanced sorghum panicle detection performance by leveraging geometric and pixel-level test time augmentation (TTA) strategies within a RetinaNet framework [15], while integrating NMS, soft-NMS, and weighted box fusion (WBF) approaches—particularly achieving a 0.95 mAP with the WBF strategy. In lightweight deployment, Qiu et al. developed a panicle detection model with a compact size of only 7.56 MB. On the Jetson Nano platform, it achieves real-time detection at 6.95 frames per second (FPS) while maintaining 91.80% mAP and 93.70% recall rate under dense occlusion [16]. Xu et al. optimized the backbone network by replacing CBH modules with compression boost feature (CBF) modules and substituting CSP structures with Specter modules. This implementation on Jetson TX2 delivers an average inference speed of 0.072 s for prickly ash fruit detection with only 20.11% GPU utilization, providing efficient support for intelligent agricultural equipment [17].
Despite significant breakthroughs in the aforementioned technologies—including algorithm innovations in attention mechanisms, structural optimizations, enhanced strategies such as TTA, feature fusion, and lightweight deployment—formidable challenges persist when applied to sorghum panicle detection scenarios [18,19,20]. At the detection level: severe occlusion from dense panicle overlap triggers missed and false detections; significant shape/color variations and cultivar differences demand exceptional model generalization; and leaf interference (due to visual similarity) and complex lighting conditions amplify accurate differentiation challenges. At the tracking level: high visual similarity among targets frequently causes ID switches; maintaining accuracy while meeting real-time, and high-frame-rate processing requirements emerges as a critical bottleneck. To address these challenges, this paper proposes a detection and tracking framework based on YOLOv8s-GOLD-LSKA + DeepSORT. The solution builds upon the lightweight YOLOv8s model by embedding a globally optimized GOLD-LSKA module to enhance feature representation capabilities, with particular emphasis on improving perception of small and occluded sorghum panicle targets. Simultaneously, we enhance DeepSORT by introducing more robust appearance matching strategies, strengthening target re-identification capabilities during occlusion events to effectively reduce ID switches and duplicate counting. This study aims to further enhance the accuracy and real-time performance of sorghum panicle detection and tracking. By providing robust technical support for intelligent in-field monitoring, precise yield estimation, and phenotypic analysis of sorghum, it advances the intelligent development of precision agriculture.

2. Materials and Methods

2.1. Image Acquisition and Pre-Processing

During August to October 2023, 2000 images were collected from the Sorghum Experimental Base at Shanxi Agricultural University with three critical growth stages of sorghum: the milk stage, wax stage, and mature stage. The varieties used for image collection were Jin Nuo 3 and Jin Za 22. To address the issue of occlusion of sorghum spikes in natural field backgrounds and meet the requirement for large-scale recognition, images were collected from three different viewing angles: horizontal (1 m away), downward (3 m vertically), and a 45° working angle (3 m in height). The original resolution of the images was 4032 × 3024 pixels, in JPG format. Based on image clarity, target integrity, and notability, invalid samples were removed. The remaining high-quality images were uniformly compressed to 1024 × 768 pixels and manually annotated in YOLO format using LabelImg (v1.8.1), as shown in Figure 1. The targets were consistently labeled as “sorghum,” and corresponding XML files were generated to provide annotation data for subsequent multi-target detection algorithms. In order to address the risk of model overfitting in complex field scenarios, a multi-dimensional augmentation strategy was applied to expand the dataset to 4500 images. As shown in Figure 2, geometric transformations included random rotation and mirroring; brightness and contrast adjustments were applied; and random cropping, translation, and scaling were used to improve scale adaptability. Finally, the dataset was split into training, validation, and test sets using stratified random sampling with an 8:1:1 ratio, ensuring a balanced distribution of maturity stages and viewing angles across all subsets. This provided a reliable data foundation for model training, validation, and performance evaluation.

2.2. YOLOv8s Model and Improvements

2.2.1. YOLOv8 Model Architecture

YOLOv8, introduced by Ultralytics in 2023, is the next-generation model in the You Only Look Once (YOLO) series, designed for multi-task vision applications, as shown in Figure 3. Its architecture continues the classic four-module structure: input, backbone, neck, and head. Additionally, YOLOv8 supports three key tasks [21,22]: object detection, instance segmentation, and image classification. The core innovations of YOLOv8 are reflected in three main aspects: First, the backbone network uses an upgraded C2f module, which optimizes gradient flow through cross-stage connections and feature re-direction mechanisms, improving feature extraction efficiency. Second, the neck network incorporates an optimized bidirectional feature pyramid network (BiFPN), which employs bidirectional cross-scale connections to achieve deep fusion of multi-level features, enhancing the model’s ability to capture multi-scale targets. Lastly, the detection head introduces an anchor-free detection method based on the FCOS architecture, eliminating the traditional anchor box design and directly predicting the target’s location and class. This reduces computational complexity while effectively improving small object detection accuracy [23,24,25].
The YOLOv8 model is available in five variations—YOLOv8n, YOLOv8s, YOLOv8m, YOLOv8l, and YOLOv8x—differentiated by the feature extraction modules and the number of convolutional kernels, with their parameter scale and storage requirements increasing sequentially. For sorghum detection and yield estimation, this study aims to balance speed, accuracy, and model size, and we ultimately chose YOLOv8s as the base framework for model development.

2.2.2. Experimental Environment and Parameter Configuration

All tests in this study were conducted with identical hardware, with detailed environmental specifications provided in Table 1. CUDA serves as NVIDIA’s GPU parallel programming platform, while CuDNN constitutes its acceleration library optimized for deep learning. We adopted stochastic gradient descent (SGD) to optimize the YOLOv8s network, enabling end-to-end training. The training regimen comprised 300 epochs with a batch size of 5 samples. Regularization was implemented through batch normalization (BN) layers while dynamically updating model weights. Key hyperparameters included momentum (0.946) and weight decay coefficient (0.0005). Upon training completion [26], the detection model weights were automatically saved and evaluated using the test dataset.

2.2.3. Improvement of the YOLOv8s Model

(1)
Improvement of the neck module using the GOLD feature pyramid module
The traditional feature pyramid network (FPN) in YOLOv8s exhibits issues such as low information transfer efficiency between layers and insufficient global semantic integration during multi-scale feature fusion. In this experiment, we propose an improved feature pyramid module based on the global collection and distribution (GOLD) mechanism. The GOLD module adopts a dual-branch collaborative architecture: The Low-GD branch uses a feature alignment module (FAM) to achieve geometric alignment and standardization of shallow multi-scale features. It combines PSP pooling and RepConv for local feature fusion and employs an attention mechanism to inject enhanced global context information into the B3 and B4 layers, improving small object detection performance. The High-GD branch introduces a transformer module to replace traditional convolutions, using self-attention mechanisms to establish long-range dependencies in deep features, thereby enhancing the spatial semantic modeling ability for large objects. The entire process is divided into three stages: feature collection, information fusion (IFM), and dynamic distribution. After standardizing the features in the feature alignment module (FAM), global semantics are integrated in the IFM. Finally, the fused features are distributed across layers through an information injection module, enabling nonlinear global interaction of multi-level features. Compared to the traditional FPN with linear propagation, the GOLD mechanism balances local details and global semantics, effectively improving the model’s robustness to scale variations. While maintaining the lightweight nature and real-time performance of YOLOv8s, experiments demonstrate that this method significantly enhances detection performance for both small and large objects in complex scenes.
(2)
Improvement of SPPF module using LSKA attention mechanism
In YOLOv8s, the SPPF effectively aggregates features across multiple scales. In this experiment, we introduce the LSKA attention mechanism within the SPPF. LSKA consists of three components: initialization convolution, spatial dilated convolution, and attention fusion. The initialization convolution extracts horizontal and vertical features to generate an initial attention map. The spatial dilated convolution expands the receptive field with multiple dilation rates, capturing a wide context without significantly increasing computational complexity. The fusion convolution generates the final attention map, which is element-wise multiplied with the original feature map to enhance important features and suppress redundancy. The LSKA is inserted between the three MaxPool2d operations and the second convolution layer in the SPPF: the input first passes through the cv1 convolution, then undergoes three consecutive pooling operations followed by concatenation, before being sent to the LSKA and output through cv2.
The improved YOLOv8s-GOLD-LSKA model structure is shown in Figure 4. The introduction of the GOLD feature pyramid module enhances the information fusion capability of the YOLOv8s model’s neck module, enabling the model to more accurately capture target features when detecting objects at different scales, significantly improving detection performance. Additionally, the LSKA attention mechanism is applied to the SPPF module, dynamically allocating weights to allow the network to focus more on important features, effectively eliminating interference from redundant information. This further enhances the model’s detection accuracy and robustness.

2.3. Sorghum Spike Tracking Algorithm in Dynamic Scenes

2.3.1. Principles of Sorghum Tracking Process Based on DeepSort Algorithm

In video detection, sorghum spikes frequently reappear in consecutive frames, resulting in high similarity between adjacent frames. To eliminate duplicate counting, the system needs to predict the position of the target in subsequent frames based on the current frame, and then perform continuous tracking through trajectory computation, as shown in Figure 5. The DeepSort algorithm primarily consists of three key stages: feature extraction, feature matching, and position prediction.
First, an image preprocessing pipeline is constructed to enhance the quality of the input data. Then, target detection is performed through the improved YOLOv8s-GOLD-LSKA network architecture, followed by the development of a dynamic prediction and data association mechanism. This ultimately forms a complete closed-loop tracking system. This study focuses on the sorghum spike phenotype observation scenario and highlights the algorithmic principles behind the two core modules: state prediction and target matching.
(1)
State estimation and Kalman filtering
DeepSort’s state estimation involves predicting and correcting the motion trajectory of each tracked object. The object’s trajectory is represented by an 8-dimensional state vector [u, v, y, h, u ˙ ,   v ˙ ., y ˙ ., h ˙ ]. where u, v are the coordinates of the detection box’s center in the current frame, y is the aspect ratio (width-to-height) of the predicted bounding box, h is the height of that box, and u ˙ , v ˙ ., y ˙ ., and h ˙ encode the temporal velocities of u, v, y, and h, once the current state vector is obtained, a Kalman filter—a highly efficient autoregressive filter—is applied to predict the object’s next state. Its basic operations are as follows:
(a)
State prediction
X ( k | k 1 ) = A X ( k 1 | k 1 ) + B U ( k ) .
Here, U(k) denotes the value of the system input at time k; A is the state transition matrix; B is the control matrix; X(k − 1|k − 1) is the system’s estimate at the previous time step; and X(k|k − 1) is the predicted state at time k based on the preceding state.
(b)
Covariance prediction
P ( k | k 1 ) = A P ( k 1 | k 1 ) A T + Q
where P (k − 1|k − 1) and P (k|k − 1) are the covariances of the previous states X (k − 1|k − 1) and X (k|k − 1), respectively. Q is the covariance matrix of system noise.
(c)
Kalman gain calculation
K = P ( k | k 1 ) H T H P ( k | k 1 ) H T + R .
K is the Kalman gain value; R is the covariance matrix of noise; and H is the observation matrix.
(d)
Status update
X ( k | k ) = X ( K | K 1 ) + K ( Z ( k ) H K ( k | k 1 ) ) .
Z(k) denotes the noisy measurement at time k; and X(k|k) is the optimal state estimate at time k, computed from the measurement at k, the prior estimate, and the Kalman gain.
(e)
Covariance update
P ( k | k ) = ( I K H ) P ( k | k 1 ) .
I denotes the unit matrix; P (k − 1|k − 1) denotes the updated covariance matrix.
When labeling multiple targets in video tracking, three scenarios can arise. Correct tracking: a target detected in the previous frame is successfully associated—via its predicted position—with a detection in the current frame, and the tracking loop continues. Target loss: a target detected in the previous frame fails to match any detections for the next n frames, at which point it is removed from the tracking list. New target appearance: A detection in the current frame does not match any existing tracks, but continues to be matched in subsequent frames, and is therefore initialized as a new target. Flowchart of the tracking system as shown in Figure 6.
(2)
Feature matching and similarity measure
The matching problem is the core component of the DeepSort algorithm, whose goal is to correctly associate detection bounding boxes in the current frame with existing tracks. Building on the Sort framework, DeepSort uses the IoU between current frame detections and tracker-predicted boxes as association information and employs two key similarity metrics—Mahalanobis distance and appearance features—to resolve matching from the perspectives of motion consistency and appearance similarity, respectively.
Mahalanobis distance accounts for uncertainty in the state by using the Kalman filter to predict a track’s state, such as its position and velocity, and then computing the motion similarity between a detection bounding box and that predicted state. This approach effectively handles sensor noise and inaccuracies in the motion model. The formula is given as follows:
D M ( d , t ) = ( d t ) T 1 ( d t )
where d is the state vector of the detection frame, t is the state vector of the predicted tracking trajectory, and ( d t )T is the transpose of both deviation vectors.
Appearance similarity matching addresses the problem of identity maintenance when tracked targets are occluded, deformed, or cross paths. It extracts feature vectors for both detection bounding boxes and trajectories using the detection model, then computes the cosine similarity between the detection features and the track features. Even if a target temporarily disappears or its motion trajectory changes, appearance features still provide a stable basis for correct association. The formula is as follows:
D A ( f d , f t ) = 1 f d f t f d f t
where fd and ft denote the appearance feature vectors of the detection frame and tracking trajectory, respectively.
(3)
Cascade matching optimization mechanism
To address the high false detection rate and frequent identity switches of the Sort algorithm, DeepSort introduces a cascade matching strategy, as shown in Figure 7. This mechanism establishes a layered processing priority based on the duration of trajectory loss: short-term lost trajectories are prioritized for matching, followed by long-term lost trajectories, thereby enhancing the continuity of high-frequency target tracking. The Hungarian algorithm is used to perform optimal matching assignments between detection boxes and predicted trajectories, outputting three types of states: unmatched trajectories, unmatched detections, and matched trajectories. This effectively improves the robustness of trajectory association in complex scenes.
The cascade matching strategy assigns an initial timer value of 0 to each trajectory. When a trajectory fails to be matched, the timer value is incremented by 1; otherwise, it is reset to 0. This process records the time elapsed since the last successful match for each trajectory. After a trajectory is successfully matched consecutively for n times, its status is changed from unconfirmed to confirmed in order to reduce the impact of false detections by the detector. Unconfirmed trajectories are then matched using the IoU method, while confirmed trajectories are subject to cascade matching. In cascade matching, unmatched trajectories are no longer directly discarded. Instead, a default save time of 30 frames is set, during which the prediction and updating of unmatched trajectories are maintained. If a trajectory is not successfully re-matched after 30 frames, it is then deleted. This approach provides better detection and tracking performance when the target undergoes occlusion and can effectively preserve the target’s ID. In this study, during video detection, occlusion is commonly observed between sorghum spikes. The use of cascade matching significantly enhances tracking performance and improves detection accuracy. Since the camera moves slowly during video capture, after careful consideration, the parameters n and max_age are set to 3 and 40, respectively, to achieve better tracking results.

2.3.2. Improved Sorghum Spike Detection Model Based on DeepSort Algorithm

This study, based on the improved YOLOv8s-GOLD-LSKA object detection model, integrates the DeepSort multi-object tracking algorithm to build a real-time detection and counting system for sorghum spikes. As shown in Figure 8, this technical approach consists of a dual processing flow: first, the pre-trained YOLOv8s-GOLD-LSKA model is used for frame-by-frame object detection on the video sequence to extract the spatial feature information of sorghum spikes; then, the DeepSort algorithm is employed to build a spatiotemporal association model, enabling continuous tracking and identity preservation of the target trajectories across frames. In the target tracking process, by setting the trajectory matching threshold as the condition for successful association across three consecutive frames, this approach effectively overcomes the target occlusion problem in complex scenarios, ensuring the reliability of the counting process.
(1)
Removal of heavily shaded sorghum spikes
As the shooting angle changes, the occlusion between sorghum spikes also changes. Even if severely occluded sorghum ears are detected, the detection effect is not ideal, making it difficult to track and count them in the future. Additionally, during video capture, sorghum spikes in the background area are inevitably recorded, leading to false detections. Experimental research has shown that sorghum spikes with severe occlusion or those in the background typically have a lower confidence threshold. In this study, sorghum spikes in a 200 cm × 50 cm plot were randomly selected as detection targets. Through multiple sets of control experiments, the absolute difference between the number of detected sorghum spikes and the actual number was calculated for different threshold values, as shown in Figure 9. The results indicate that when the confidence threshold is set to 0.46, the detection error is minimized. Therefore, the confidence threshold of the detection model was adjusted to 0.46 for this experiment.
(2)
Video Interval Counting
During the video capture process, a total of ten video segments were recorded within a 200 cm × 50 cm area, with a steady walking speed of approximately 0.3 m/s. The height of the stabilizer was kept constant throughout the recording, and the frame rate was set to 30 frames per second. If the camera movement speed is too fast, the captured video will be unclear. On the other hand, if the camera moves too slowly, there will be little change in the target positions between adjacent frames, and performing detection and counting on every frame will increase the computational load of the model. To improve the model’s detection speed, this study adopts a frame-skipping counting method for processing the video frames. The video was frame extracted using Adobe Premiere Pro software (23.6.0), and different frame rate settings were applied when exporting the video sequence. After analyzing all the output results and considering the actual conditions during filming, it was decided to count every fifth frame in the video (in the subsequent sections of the paper, the frames referenced are processed frames; for example, Frame 2 actually represents Frame 6, and so on). An example of the video frames after applying the frame-skipping counting method is shown in Figure 10.
(3)
DeepSort sorghum spike tracking
To achieve accurate sorghum spike counting, it is necessary to track the movement trajectories of the sorghum spikes, as the video essentially consists of a series of continuous images. Therefore, without tracking and labeling the detected sorghum spikes, the same target may be detected multiple times, leading to duplicate counting. Based on the possible situations that may arise during the tracking process, the results are categorized into four types: currently tracked sorghum spikes, newly detected sorghum spikes, disappeared sorghum spikes, and sorghum spikes that disappear and then reappear. Cross-frame tracking, as the core technology of the tracking algorithm, plays a crucial role in sorghum spike tracking. In the tracking process, the system will only consider a target as successfully tracked and add it to the tracking list for counting if it is successfully matched in three consecutive frames. If the target is matched in three consecutive frames but was not detected in previous frames, the system will treat it as a new target and continue tracking.
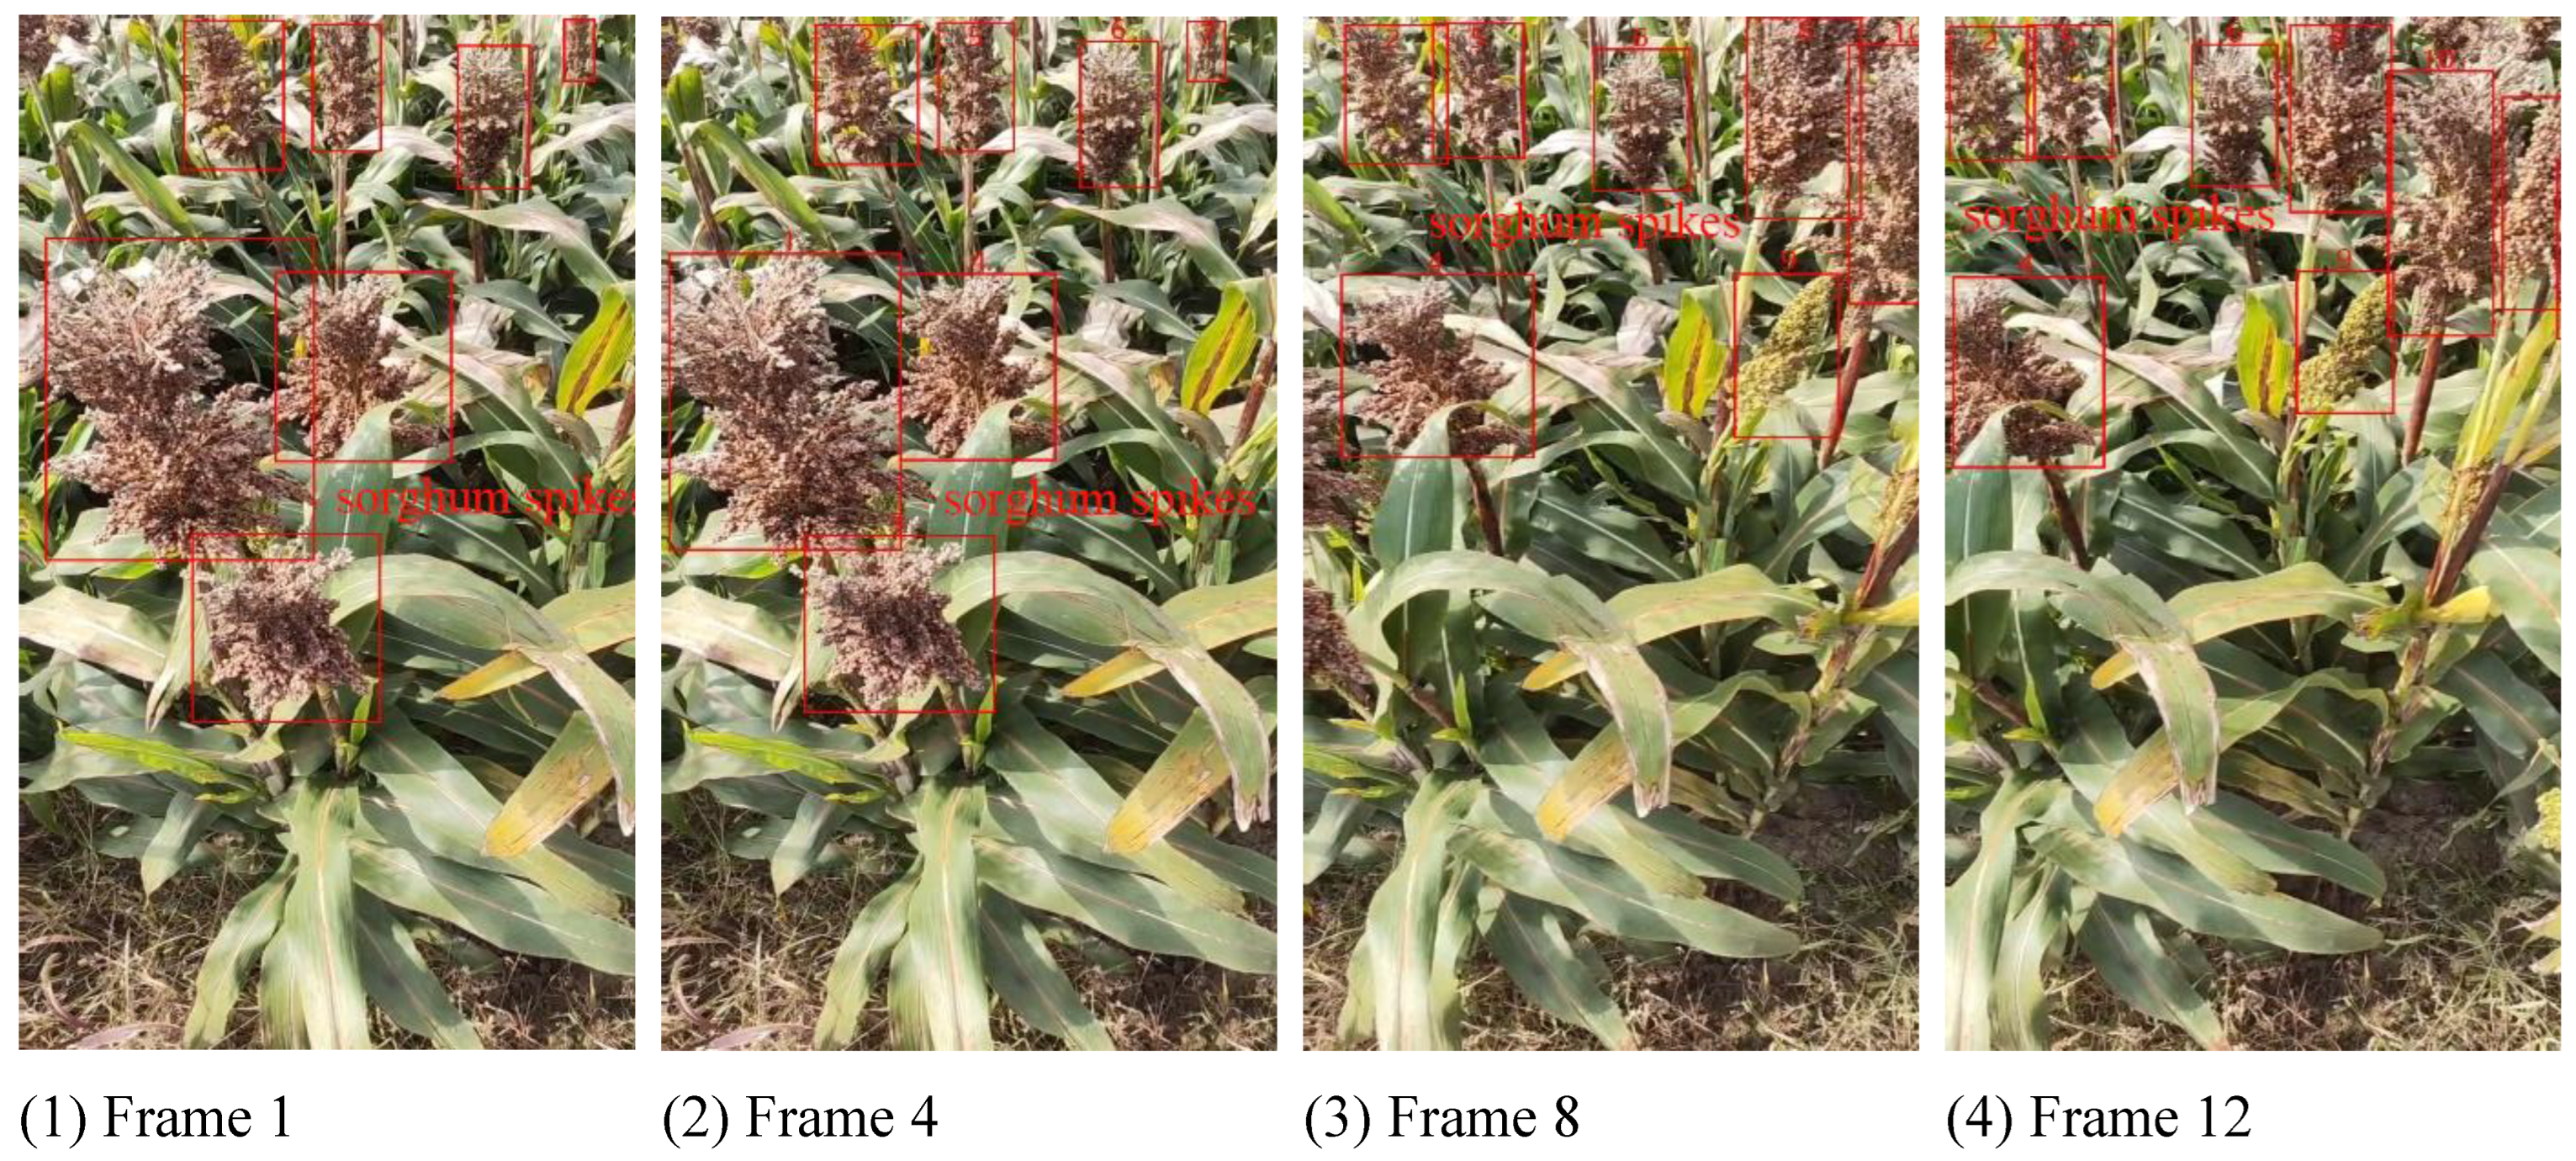
As shown in Figure 11, the sorghum spike is detected by the YOLOv8s-GOLD-LSKA model in Frame 1, but it cannot be tracked by the DeepSort algorithm because the system requires three consecutive frame matches to confirm tracking. By Frame 4, the DeepSort algorithm completes cross-frame tracking, and the seven sorghum spikes detected by YOLOv8s-GOLD-LSKA have all been successfully tracked and recorded in the tracking list. By Frame 9, sorghum spikes 1 and 3 exit the frame. By Frame 12, two new sorghum spikes appear on the right side of the frame and have not yet been matched or tracked by the system, thus being considered as new targets.
In actual shooting, it is also possible for a previously detected target to leave the frame and then reappear in subsequent frames, or for a confirmed target to reappear due to the disappearance of occlusion in earlier frames caused by a change in shooting angle. The cascade matching method used by the DeepSort algorithm allows the system to retain the trajectory state from the last frame before the target disappeared and preserve its original ID, even after the target has left the frame.

2.4. Research on Sorghum Yield Estimation Methods

Previous methods for estimating sorghum spikes yield relied on target detection bounding box pixel-to-physical-size ratios to compute individual spike mass via volumetric density. Although these approaches yielded single-spike weight estimates, they suffered from low computational efficiency and from distortion of the pixel-to-size ratio when the camera’s distance or angle varied—limitations that impede large-scale field deployment. To address these issues, our study abandons such complex algorithms in favor of a traditional, field-measured average spike weight method, thereby enhancing both the practicality and stability of the yield estimation.

2.4.1. Measurement of Average Dry Weight of Sorghum Spikes

Prior to harvest at the sorghum maturity stage, the field was divided into five zones according to the five-point sampling method, with one sampling point located at the center of each zone and arranged to ensure even coverage of the entire plot. At each sampling point, a 1 m2 quadrat was delineated, and all sorghum plants within this area were harvested, placed into labeled sample bags, and weighed to obtain fresh weight (FW). Each sorghum sample collected from the sampling points was placed in a far-infrared rapid drying oven (HYHG-II-270 model, Hengzi brand, Shanghai Yuejin Medical Equipment Co., Ltd., Shanghai, China) and dried at 105 °C until a constant weight was achieved (approximately 10 h). After drying, the samples were cooled in a desiccator and weighed to obtain dry weight (DW), from which moisture content (MC) was calculated. The average moisture content at physiological maturity was found to be 12%, and the average dry weight was 0.12 kg. The experimental apparatus is shown in Figure 12, and the specific calculation formulas are as follows:
F W ¯ = i = 1 5 F W i 5
M C = F W D W F W × 100 %
M C ¯ = i = 1 5 M C i 5
D W ¯ = F W ¯ × ( 1 M C ¯ ) .

2.4.2. Picture-Based Methods for Sorghum Yield Estimation

The number of spikes per acre is a crucial indicator for estimating sorghum yield. In this study, the number of sorghum spikes in a specific area was first calculated, and then the spike count per acre was estimated through unit conversion. Yield (kg/mu) = (spikes per unit area × dry weight per spike × 666.7)/1000. The experiment followed the five-point sampling method, placing 100 cm × 100 cm rectangular frames in the sorghum field to collect image data of the spikes from a unit area. The images were captured at a vertical downward angle. A total of 25 images were collected in five groups, and some of the collected images are shown in Figure 13. The improved YOLOv8s-GOLD-LSKA detection model was used to detect the sorghum spikes in each image, and the average count was calculated. The spike count per unit area was then multiplied by the average dry weight of the sorghum spikes of the specific variety, and the result was used to estimate the yield per acre through conversion.

2.4.3. Video-Based Methods for Sorghum Yield Estimation

To prevent camera shake, the smartphone was mounted on a gimbal, with the lens tilted at 45°. Videos were recorded over a 200 cm × 50 cm area at a steady walking speed of approximately 0.3 m/s, yielding ten segments while maintaining a constant gimbal height. Sampling locations included both the edge and interior of the sorghum field to reduce edge effects. Each video was processed by the improved YOLOv8s-GOLD-LSKA + DeepSort model to identify and count sorghum spikes, and the mean count per segment was calculated. Yield per mu was then estimated by multiplying the average spike count per unit area by the variety’s average spike dry weight. Sample frames from the captured videos are shown in Figure 14.

3. Results

3.1. Evaluation Indicators

In this study, the evaluation metrics include precision (P, %), recall (R, %), mean average precision (mAP), F1 score (F1, %), tracking target position error (MOTP), tracking accuracy (MOTA), frames per second (FPS), and model size. Precision measures the proportion of correctly predicted positive samples in the prediction results, while recall reflects the degree to which positive samples are correctly predicted in the dataset. The F1 score, combining both precision and recall, provides an overall performance assessment of the model. The mean average precision (mAP) takes into account detection accuracy at different IoU thresholds and is an important performance indicator. Tracking target position error and tracking accuracy are used to evaluate the precision of target tracking in video detection. Frames per second (FPS) measures the model’s speed and real-time performance. The size of the model determines the deployable ability of the algorithm, and a smaller size makes it easier to apply in practical scenarios. The calculation formulas are as follows:
P r e c i s i o n = T P T P + F P × 100 %
I O U = A T P + F N × 100 %
m A P = 1 C M = i N P k R k × 100 %
F 1 s c o r e = 2 × P r e c i s i o n × R e c a l l P r e c i s i o n + R e c a l l
M O T P = t , j d t , j t c t
M O T A = t ( F N t + F P t + I D S t ) t G T t
F P S = 1 T

3.2. YOLOv8s-GOLD-LSKA Results Analysis

The trend of the loss value with respect to the number of training iterations reflects the model’s training effectiveness: the smaller the loss value, the better the model’s performance and the more successful the training process. The training loss curve and performance curve of the improved YOLOv8s-GOLD-LSKA model in this study are shown in Figure 15. The box_loss, cls_loss, and dfl_loss of the training and validation sets continuously decrease and stabilize as the number of iterations increases, indicating that the model optimization is stable, with no overfitting and good generalization. The model achieved 85.86% mAP on the validation set, and with dfl_loss optimization, recall and precision were improved to 76.81% and 90.72%, respectively, while the F1 score reached 81.19%. The model size is 7.48 MB, with an average detection time of 0.0168 s per image, achieving an efficient balance between detection accuracy, speed, and model compactness.

3.2.1. Ablation Experiments

To validate the effectiveness of the improved model in this study, ablation experiments were conducted using a self-constructed sorghum spike dataset. Building on our previous research, we added video tracking detection to predict sorghum yield, the specific results of the ablation experiments are shown in Table 2. A “√” indicates that the corresponding method was used to improve the model, while a “-” indicates that the method was not used.
When the GOLD module was added individually to the model, the recall and mAP of YOLOv8s increased by 4.2% and 2.35%, respectively. These results indicate that the GOLD module enhances the information fusion capability of the YOLOv8s backbone network, improving the model’s performance in detecting sorghum spikes of varying sizes. When the LSKA module was introduced individually, it improved the recall by 1.32% while reducing the model size by 0.79 MB. These results indicate that the LSKA module enhances the ability of the SPPF module to aggregate features across multiple scales, reducing computational complexity and memory usage, thereby effectively improving the model’s performance. The improved model in this study achieved an F1 score of 81.19% and a mAP of 85.86%, which represent increases of 5.42% and 6.63%, respectively, compared to the original YOLOv8s model. The model size decreased from 9.61 MB to 7.48 MB, a reduction of 2.13 MB. There was also a significant decrease in the number of parameters and floating-point operations. The results indicate that the improved YOLOv8s-GOLD-LSKA model shows significant improvements in all detection metrics, except for detection time, and a notable reduction in model complexity.

3.2.2. Comparative Experiments

To evaluate the model’s performance, this study conducted comparative experiments between YOLOv8s-GOLD-LSKA and traditional models such as YOLOv5, SSD, and YOLOv8 on the self-constructed sorghum spike dataset. The experimental conditions were kept consistent, and the specific performance comparison data can be found in Table 3.
The results show that the improved YOLOv8s-GOLD-LSKA model proposed in this study demonstrates significant advantages in the natural field sorghum spike detection task. Compared to YOLOv5, SSD, and the original YOLOv8, the improved model’s F1 score increased by 10.11%, 7.54%, and 5.42%, respectively, reaching 81.19%. The mAP value achieved 85.86%, indicating higher detection accuracy. Additionally, the model’s detection time is lower than that of YOLOv5 and SSD, and its model size is smaller than all three. This demonstrates that the improved model not only ensures high detection performance, but also offers faster detection speed and a smaller model size, making it more suitable for performing sorghum spike detection tasks in natural field environments.

3.3. Analysis of the Results of the DeepSort Algorithm

A comparison was made between the detection counting models before and after the improvement, and the detection performance was tested separately. This study selected 10 video segments, and the actual number of sorghum spikes in each segment was manually counted. The models then performed detection, and the experimental results are shown in Figure 16. From the figure, it is evident that the detection error of the improved model is significantly reduced compared to the model before improvement. By calculating the results from the 10 video segments, the average precision of the improved model is 81.2%, which is an increase of 22.7% compared to the model before improvement.
To further validate the model’s performance, the improved YOLOv8s-GOLD-LSKA + DeepSort model was compared with YOLOv5 + DeepSort, SSD + DeepSort, and YOLOv8 + DeepSort models under the same experimental conditions. The tracking and counting results of the four models were tested on 10 video segments. As shown in Table 4, the improved YOLOv8s-GOLD-LSKA + DeepSort model achieved a MOTA value of 67.96%, which is 7.81%, 12.54%, and 4.34% higher than YOLOv5 + DeepSort, SSD + DeepSort, and YOLOv8 + DeepSort models, respectively. The MOTP and FPS values also showed significant improvement compared to the other three models. Therefore, the improved YOLOv8s-GOLD-LSKA + DeepSort model not only ensures high tracking accuracy, but also offers faster detection speed and better performance, making it more suitable for sorghum spike video detection tasks.

3.4. Sorghum Yield Estimation Results

3.4.1. Image-Based Sorghum Yield Estimates

We tested the above yield estimation protocol on five images and compared the model’s sorghum spike counts against manual counts and the actual yields measured at harvest. As shown in Table 5, the estimation accuracy ranged from 89% to 96%. Because the top-down shooting angle reduces spike occlusion, detection accuracy was further improved. Thus, this protocol can effectively perform sorghum spike yield estimation in natural field environments.

3.4.2. Video-Based Sorghum Yield Estimation Results

We evaluated the proposed yield-estimation protocol on five video segments (see Table 2). We then compared the sorghum spike counts and the estimated yields against manual counts from still images and the actual yields measured at harvest (see Table 6). The estimation accuracy ranged from 75% to 93%, and the model’s predictions were consistently higher than the manual measurements. This overestimation can be attributed to false positives generated when spikes outside the intended field of view enter the frame during video capture. Consequently, care must be taken during video acquisition to control the filming range and minimize background interference.

4. Discussion

The proposed YOLOv8s-GOLD-LSKA + DeepSORT framework significantly enhances intelligent sorghum panicle monitoring through synergistic optimizations: The GOLD feature pyramid employs a dual-path architecture (Low-GD branch enabling local feature geometric alignment [27,28,29,30,31]; High-GD branch establishing long-range semantic dependencies via Transformer), overcoming limitations of insufficient hierarchical information fusion in conventional FPN structures. The LSKA attention module augments cross-scale feature discriminability through multi-dilation rate convolutions. These synergistic innovations collectively elevate mAP by 6.63 percentage points to 85.86% while compressing model size to 7.48 MB. The enhanced DeepSORT algorithm (n = 3, max_age = 40) achieves 67.96% MOTA under occlusion scenarios—a 4.34 percentage point improvement over baseline [32,33,34,35]. However, dynamic yield estimation accuracy exhibits significant fluctuations (ranging from 75% to 93% in video sequences vs. 89% to 96% in static imagery), primarily attributable to increased panicle overlap (>60% overlap rate at 45° viewing angles) induced by perspective distortion and compounded by background interference. The current model exhibits limited generalization capability for red panicle cultivars (preliminary tests show a 15.2 ± 2.1% increase in missed detection rates). Compared to existing approaches, our solution demonstrates comparative advantages across three dimensions: achieving a 3.43 percentage point higher mAP than Shi’s method through enhanced multi-scale feature fusion, reducing model volume to merely 52.3% of Xu’s solution for improved lightweight deployment, and decreasing ID switch rates by 12.7% against Lou’s model under occlusion scenarios. Future work should develop background noise suppression algorithms and explore adversarial domain adaptation techniques to enhance multi-cultivar adaptability.

5. Conclusions

This study presents an integrated system combining an improved YOLOv8s-GOLD-LSKA model with an optimized DeepSort algorithm, substantially enhancing field-based sorghum spike detection and yield estimation. By incorporating the GOLD module and LSKA attention mechanism, the detector achieved a mAP of 85.86% and an F1 score of 81.19%, reduced its model size to 7.48 MB, and processed frames at 0.0168 s per frame. The improved DeepSort algorithm (YOLOv8s-GOLD-LSKA + DeepSort) achieved a MOTA of 67.96% and a processing speed of 42 FPS. Compared to the most competitive baseline, YOLOv8 + DeepSort (63.62% MOTA, and 28 FPS), our method improved MOTA by 4.34 percentage points and increased processing speed by approximately 50%. Additionally, the MOTA of our method significantly outperforms that of YOLOv5 + DeepSort (60.15%) and SSD + DeepSort (55.42%) by 7.81 and 12.54 percentage points, respectively, effectively addressing the challenges of object tracking under occlusion. When coupled with a five-point sampling dry weight estimation protocol, the system delivered image/video test accuracies of 89~96% and 75~93%, respectively, with a single-frame inference latency of 0.047 s. This work offers a practical solution for rapid sorghum yield assessment and intelligent agricultural monitoring, provides valuable guidance for extending precision agriculture techniques to other crops, and lays the groundwork for future UAV-based inspections and large-scale field management.

Author Contributions

Conceptualization, S.Q.; methodology, J.G. and M.H.; software, J.G.; validation, M.H., Q.C. and C.W.; writing—original draft preparation, M.H.; writing—review and editing, M.H., J.G. and S.Q.; resources, C.W., Q.C. and X.Y.; supervision, S.Q.; project administration, S.Q.; funding acquisition, S.Q. and X.Y. All authors have read and agreed to the published version of the manuscript.

Funding

This research work was supported by National Natural Science Foundation of China (No. 52305268); Fundamental Research Program of Shanxi Province (Project No.: 20210302124374), China Agriculture Research System (Project No: CARS-06-14.5-A28), Modern Agro-industry Technology Research System (Project No.: 2024CYJSTX04-19) and Doctoral Research Launch Project of Shanxi Agricultural University (No. 2021BQ87).

Data Availability Statement

Data are contained within the article.

Acknowledgments

The authors thank the editor and anonymous reviewers for providing helpful suggestions for improving the quality of this manuscript.

Conflicts of Interest

The authors declare no conflicts of interest.

Abbreviations

The following abbreviations are used in this manuscript:
YOLOYou Only Look Once
MOTAMultiple Object Tracking Accuracy
FPSFrames Per Second
IDIdentity Document
UAVSUnmanned Aerial Vehicles
BiFPNBidirectional Feature Pyramid Network
ReIDRe-Identification
CBAMConvolutional Block Attention Module
FCOSFully Convolutional One-Stage Object Detection
C2fCSPDarknet53 to 2-Stage FPN
FPNFeature Pyramid Network
FAMFeature Alignment Module
PSPPyramid Scene Parsing
SPPFSpatial Pyramid Pooling—Fast
IoUIntersection over Union
MOTPMultiple Object Tracking Precision
FWFresh Weight
DWDry Weight
MCMoisture Content

References

  1. Ren, Q.; Duan, X.; Lin, H.Y. Based on SWOT analysis, the research on the countermeasures for the high-quality development of sorghum industry in Shanxi Province. Agric. Technol. 2025, 45, 177–180. [Google Scholar] [CrossRef]
  2. Xu, Y.; Wu, Q.; Zhang, B.; Zhou, L. Progress in the application of lightweight deep learning networks in crop object detection. Chin. J. Agric. Mech. 2025, 46, 261–270. [Google Scholar] [CrossRef]
  3. Zhao, C. Development status and future prospects of smart agriculture. J. South China Agri-Cult. Univ. 2021, 42, 1–7. [Google Scholar] [CrossRef]
  4. Mosley, L.; Pham, H.; Bansal, Y.; Hare, E. Image-Based Sorghum Head Counting When You Only Look Once. In Analytics and Decision Support for Green IS and Sustainability Applications; Scholar Space: London, UK, 2022. [Google Scholar]
  5. Yadav, S.P. An Improved Deep Learning-Based Optimal Object Detection System from Images. Multimedia Tools Appl. 2024, 83, 30045–30072. [Google Scholar] [CrossRef]
  6. Feng, F.; Hu, Y.; Li, W.; Yang, F. Improved YOLOv8 Algorithms for Small Object Detection in Aerial Imagery. J. King Saud Univ. Comput. Inf. Sci. 2024, 36, 102113. [Google Scholar] [CrossRef]
  7. Shi, H.; Chen, J.; Li, Y.; Zhu, Y.; Chen, Y.; Yang, P. An accurate segmentation method of rice grain image based on the improved YOLOv8-seg model. J. Nanjing Agric. Univ. 2025, 1–10. [Google Scholar]
  8. Lan, M.; Liu, C.; Zheng, H.; Wang, Y.; Cai, W.; Peng, Y.; Xu, C.; Tan, S. RICE-YOLO: In-Field Rice Spike Detection Based on Improved YOLOv5 and Drone Images. Agronomy 2024, 14, 836. [Google Scholar] [CrossRef]
  9. Sun, J.; Qian, L. Apple Detection in Orchard Complex Environment Based on Improved RetinaNet. Transac-Tions CSAE 2022, 38, 314–322. [Google Scholar] [CrossRef]
  10. Fan, T.; Gu, J.; Wang, W.; Zuo, Y.; Ji, C.; Hou, Z.; Lu, B.; Dong, J. A lightweight honeysuckle identification method based on improved YOLOv5s. Trans. CSAE 2023, 39, 192–200. [Google Scholar] [CrossRef]
  11. Zambre, Y.; Rajkitkul, E.; Mohan, A.; Peeples, J. Spatial Transformer Network YOLO Model for Agricultural Object Detection. In Proceedings of the 2024 International Conference on Machine Learning and Applications (ICMLA), Miami, FL, USA, 18–20 December 2024. [Google Scholar]
  12. Tu, S.; Zeng, Q.; Liang, Y.; Liu, X.; Huang, L.; Weng, S.; Huang, Q. Automated Behavior Recognition and Track-ing of Group-Housed Pigs with an Improved DeepSORT Method. Agriculture 2022, 12, 1907. [Google Scholar] [CrossRef]
  13. Du, P. Green Pepper Fruits Counting Based on Improved DeepSort and Optimized Yolov5s. Front. Plant Sci. 2024, 15, 1417682. [Google Scholar] [CrossRef] [PubMed]
  14. Lou, H.; Li, G.; Fu, X.; Li, L.; Wang, X.; Huang, W.; Fu, T. Online target detection and rapid localization of citrus fruits under irregular disturbance. Trans. CSAE 2024, 40, 155–166. [Google Scholar] [CrossRef]
  15. Consuelo Gonzalo-Martín Improving Deep Learning Sorghum Head Detection through Test Time Augmentation. Comput. Electrons Agric. 2021, 186, 106179. [CrossRef]
  16. Qiu, S.; Li, Y.; Gao, J.; Li, X.; Yuan, X.; Liu, Z.; Cui, Q.; Wu, C. Research and Implementation of Millet Ear Detection Method Based on Lightweight YOLOv5. Sensors 2023, 23, 9189. [Google Scholar] [CrossRef] [PubMed]
  17. Xu, Z.; Huang, X.; Huang, Y.; Sun, H.; Wan, F. A Real-Time Zanthoxylum Target Detection Method for an Intel-ligent Picking Robot under a Complex Background, Based on an Improved YOLOv5s Architecture. Sensors 2022, 22, 682. [Google Scholar] [CrossRef]
  18. Li, H.; Wang, P.; Huang, C. Comparison of Deep Learning Methods for Detecting and Counting Sorghum Heads in UAV Imagery. Remote Sens. 2022, 14, 3143. [Google Scholar] [CrossRef]
  19. Guo, M.; Liu, Y.; Li, W. Real-time estimation of kiwifruit yield in orchards based on video tracking algorithm. Trans. CSAM 2023, 54, 178–185. [Google Scholar] [CrossRef]
  20. Chen, X.; Liang, J.; Tang, C.; Zhang, E.; Chen, Y.; Dang, P.; Qi, L. Rice plant identification in complex paddy field environment based on improved YOLOv7 model. Agric. Mech. Res. 2025, 47, 9–17. [Google Scholar] [CrossRef]
  21. Ma, N.; Su, Y.; Yang, L.; Li, Z.; Yan, H. Wheat Seed Detection and Counting Method Based on Improved YOLOv8 Model. Sensors 2024, 24, 1654. [Google Scholar] [CrossRef]
  22. Duan, S.; Wang, T.; Li, T.; Yang, W. M-YOLOv8s: An Improved Small Target Detection Algorithm for UAV Aerial Photog-raphy. J. Vis. Commun. Image Represent. 2024, 104, 104289. [Google Scholar] [CrossRef]
  23. Wang, A.; Qian, W.; Li, A.; Xu, Y.; Hu, J.; Xie, Y.; Zhang, L. NVW-YOLOv8s: An Improved YOLOv8s Network for Real-Time Detection and Segmentation of Tomato Fruits at Different Ripeness Stages. Comput. Electron. Agric. 2024, 219, 108833. [Google Scholar] [CrossRef]
  24. Tu, S. A Passion Fruit Counting Method Based on the Lightweight YOLOv5s and Improved DeepSORT. Precis. Agric. 2024. [CrossRef]
  25. Zhang, J.; Yang, W.; Lu, Z.; Chen, D. HR-YOLOv8: A Crop Growth Status Object Detection Method Based on YOLOv8. Electronics 2024, 13, 1620. [Google Scholar] [CrossRef]
  26. Qiu, S.; Gao, J.; Han, M.; Cui, Q.; Yuan, X.; Wu, C. Sorghum Spike Detection Method Based on Gold Feature Pyramid Module and Improved YOLOv8s. Sensors 2024, 25, 104. [Google Scholar] [CrossRef]
  27. Tan, M.; Pang, R.; Le, Q.V. EfficientDet: Scalable and Efficient Object Detection. In Proceedings of the IEEE/CVF Conference on Computer Vision and Pattern Recognition, Seattle, WA, USA, 13–19 June 2020. [Google Scholar] [CrossRef]
  28. Li, Z. Real-Time Detection and Counting of Wheat Ears Based on Improved YOLOv7. Comput. Electron. Agric. 2024, 218, 108670. [Google Scholar] [CrossRef]
  29. Sulzbach, E. Deep Learning Model Optimization Methods and Performance Evaluation of YOLOv8 for En-hanced Weed Detection in Soybeans. Comput. Electron. Agric. 2025, 232, 110117. [Google Scholar] [CrossRef]
  30. Nomura, R.; Oki, K.; Takata, D. Development of Size Estimation Method for Occluded Circular Masks and Application to Infrared Peach Images. Sensors Mater. 2023, 35, 3715–3729. [Google Scholar] [CrossRef]
  31. Blok, P.M. Image-Based Size Estimation of Broccoli Heads under Varying Degrees of Occlusion. Biosyst. Eng. 2021, 208, 213–233. [Google Scholar] [CrossRef]
  32. Saravanan, K.S. Prediction of Crop Yield in India Using Machine Learning and Hybrid Deep Learning Models. Acta Geophys. 2024, 72, 4613–4632. [Google Scholar] [CrossRef]
  33. Wang, J.; Qi, Z.; Wang, Y.; Liu, Y. A Lightweight Weed Detection Model for Cotton Fields Based on an Improved YOLOv8n. Sci. Rep. 2025, 15, 457. [Google Scholar] [CrossRef]
  34. Yu, K.; Tang, G.; Chen, W.; Hu, S.; Li, Y.; Gong, H. MobileNet-YOLO V5s: An Improved Lightweight Method for Real-Time Detection of Sugarcane Stem Nodes in Complex Natural Environments. IEEE Access 2023, 11, 104070–104083. [Google Scholar] [CrossRef]
  35. Bali, N.; Singla, A. Deep Learning Based Wheat Crop Yield Prediction Model in Punjab Region of North India. Appl. Artif. Intell. 2021, 35, 1304–1328. [Google Scholar] [CrossRef]
Figure 1. LambelImg annotation interface.
Agronomy 15 01526 g001
Figure 2. Data enhancement.
Agronomy 15 01526 g002
Figure 3. YOLOv8 algorithmic framework.
Agronomy 15 01526 g003
Figure 4. Improved YOLOv8s-GOLD-LSKA model.
Agronomy 15 01526 g004
Figure 5. DeepSort tracking process.
Agronomy 15 01526 g005
Figure 6. Tracking system flow chart.
Agronomy 15 01526 g006
Figure 7. Cascade matching process.
Agronomy 15 01526 g007
Figure 8. Flowchart of the sorghum spike tracking and counting model.
Agronomy 15 01526 g008
Figure 9. Plot of the difference between the actual and detected quantities at different confidence levels.
Agronomy 15 01526 g009
Figure 10. Example of a video frame after using interval counting.
Agronomy 15 01526 g010
Figure 11. Tracking process.
Agronomy 15 01526 g011
Figure 12. Experimental equipment and operation.
Agronomy 15 01526 g012
Figure 13. Field collection pictures.
Agronomy 15 01526 g013
Figure 14. Partial field collection video test plot.
Agronomy 15 01526 g014
Figure 15. Training loss curves and performance curves for the YOLOv8s-GOLD-LSKA model.
Agronomy 15 01526 g015
Figure 16. Comparison of test results before and after model improvement.
Agronomy 15 01526 g016
Table 1. Operating environment configuration parameters.
Name Version
Operating SystemWindows 10, 64-bit
CPUAMD Ryzen 7 5800H
GPUNVIDIA GeForce RTX3060 Latop MECHREVO Latop (Suzhou, China)
RAM32 GB
PyCharm2023.3
CUDA11.4
cuDNN8.2.4
Python3.9.13
Table 2. Results of ablation experiments [26].
GOLDLSKAP/%R/%F1/%mAP/%Detection Speed/sModel Size/MB
--89.8165.5375.7779.230.01659.61
-90.1969.7378.6581.580.01819.43
-89.2466.8576.5079.360.01588.82
--87.4069.9177.6878.290.01657.74
90.6570.9679.6182.520.01808.47
-91.1475.2382.4285.060.01598.06
-90.4573.1080.8683.510.01727.79
90.7176.8181.1985.860.01687.48
Table 3. Comparison of detection performance of different network models [26].
ModelP/%R/%F1/%mAP/%Detection Speed/sModel Size/MB
YOLOv586.2260.4771.0873.080.018310.45
SSD88.3563.1473.6577.740.018711.26
YOLOv889.8165.5375.7779.230.01659.61
YOLOv8s-GOLD-LSKA90.7276.8181.1985.860.01687.48
Table 4. Performance comparison table.
ModelMOTA/%MOTP/%FPS
YOLOv5 + DeepSort60.1577.3619
SSD + DeepSort55.4276.1735
YOLOv8 + DeepSort63.6275.8428
YOLOv8s-GOLD-LSKA + DeepSort67.9682.5442
Table 5. Test result of the image.
Picture NumberManual Measurement/kgModel Test/kgPrecision/%Calculation Delay/s
11.041.0896.15%0.047
21.321.2090.91%0.048
30.980.9697.96%0.047
41.211.0889.26%0.047
51.080.9688.89%0.047
Table 6. Test results of video.
Segment NumberManual Measurement/kgModel Test/kgPrecision/%Calculation Delay/s
11.221.3291.802.07
21.171.0892.312.12
31.061.3275.472.25
41.241.3293.552.03
51.131.3281.192.16
Disclaimer/Publisher’s Note: The statements, opinions and data contained in all publications are solely those of the individual author(s) and contributor(s) and not of MDPI and/or the editor(s). MDPI and/or the editor(s) disclaim responsibility for any injury to people or property resulting from any ideas, methods, instructions or products referred to in the content.

