Article

Serial Dilution and EDTA Extraction Indicate Probable Phosphorus Minerals in Dairy, Goat, Swine, and Poultry Manure

by
Paulo H. Pagliari
1,* and
Fernando S. Galindo
2
1
Department of Soil, Water, and Climate, University of Minnesota, 23669 130th Street, Lamberton, MN 56152, USA
2
Department of Crop Production, College of Agricultural and Technological Sciences, São Paulo State University (UNESP), Rod. Cmte. João Ribeiro de Barros, km 651-Bairro das Antas, Dracena 17915-899, SP, Brazil
*
Author to whom correspondence should be addressed.
Agronomy 2025, 15(7), 1497; https://doi.org/10.3390/agronomy15071497
Submission received: 21 May 2025 / Revised: 10 June 2025 / Accepted: 13 June 2025 / Published: 20 June 2025
(This article belongs to the Special Issue Soil Pollution and Remediation in Sustainable Agriculture)

Abstract

The probable solid phases controlling phosphorus (P) salts solubility in goat, swine, chicken, and dairy manures were investigated using chemical modeling software, Visual Minteq, coupled with serial dilution and EDTA extraction. In the serial dilution scheme, the manure (wet weight) to water ratios (MWR) used were 1:1, 1:2, 1:5, 1:10, 1:50, and 1:100. The EDTA concentrations used were 1, 5, and 10 mmol L−1 at the 1:50 MWR. The total elemental concentrations in serially diluted samples were measured by ICP-OES, while in the EDTA extracts concentrations were measured by ICP-OES and P was also measured by the molybdate blue-P method. The percentage of total P dissolved from goat, swine, chicken, and dairy manure using serial dilution at 1:10 MWR was 4, 6, 7, and 34% of the total P; while at 1:100 MWR it was 44, 35, 36, and 65%, respectively. Chemical modeling suggested that between 1:1 to 1:10 MWR, Mg-phosphates, primarily struvite, was the probable solid phase controlling P salts solubility in all manures, except dairy. At the 1:50 and 1:100 MWR, the solid phases controlling P solubility shifted from Mg-phosphate to Ca-phosphate minerals in goat, swine, and chicken manures. The use of ICP or molybdate blue for chemical modeling showed the same solid phases in the EDTA extracts. From the EDTA extractions, it was determined that 5 mmol L−1 EDTA lowered Ca and Mg activities that no mineral phases likely remained in goat, swine, and chicken manures. In conclusion, under the conditions of this study, P dissolution from salts present in manure is controlled by the cation concentration in solution.

1. Introduction

The great amount of plant nutrient and organic compounds make manure not only an ideal nutrient source for plant growth, but also an important soil amendment [1,2,3]. Although animal manure has great value for crop production, over the past few decades it has also been regarded as a significant source of environmental pollution. The application of animal manure without nutrient management plans has led to an increase in environmental contamination with nitrogen (N) and, more importantly, phosphorus (P) [1,2,3,4]. This can be related to the difficulty in knowing how much P in manure might be water soluble and the mechanisms that control the amount of P dissolved from manure [5]. The complexity of the manure matrix leads to interesting interaction between the inorganic and organic phases. Fordham and Schwetman [6] described manure as being in a sensitive and balanced dynamic equilibrium state where minor changes in any property (chemical, physical, or biological) could affect the whole matrix. Bril and Salomons [7] reported that the majority of Ca and Mg are complexed with carbonates and organic compounds, and that potassium (K+), ammonium (NH4+), sodium (Na+), and chloride (Cl) ions were the most important regulators of manure solution ionic strength. Therefore, these ions would have control over the solid phases in the manure including those controlling P solubility. Understanding how the inorganic phases interact is the key to understanding P solubility, therefore minimizing losses to the environment [5].
Over the past few decades, several researchers have tried to better understand and characterize the mineral solid phases controlling P dissolution from animal manures. To characterize inorganic solid phases, some have used scanning electron microscopy coupled with microprobe analysis (SEM/Microprobe), solid-state and solution 31P nuclear magnetic resonance (31P NMR), X-ray diffraction, X-ray adsorption near edge structure (XANES), and chemical equilibrium software [7,8,9,10,11,12,13]. Solid phase analysis of swine manure using SEM/Microprobe revealed the presence of MgNH4PO4·6H2O (struvite) with a small amount of MgKPO4·6H2O (K-struvite), and also other magnesium and calcium minerals that could not be determined [7]. The SEM/Microprobe analysis also showed that Ca, K, and P were interacting with the organic fraction, forming organic salts [7]. Struvite and CaHPO4 (dicalcium phosphate—DCP) were the main form of inorganic P detected in cattle and dairy manure using SEM and X-ray diffraction [6,10]. Ajiboye et al. [12] used XANES to characterize P forms in biosolids and swine, dairy, beef, and poultry manures. The XANES spectrum of inorganic P in biosolids was dominated by AlPO4·2H2O (variscite—VAR, 86% of total P) and Ca10(PO4)6(OH)2 (hydroxyapatite—HAP, 14% of total P); swine manure was dominated by CaHPO4·2H2O (brushite, 50% of total P) and VAR (18% of total P); dairy manure was dominated by brushite (65% of total P); beef manure was dominated by struvite (68% of total P) and brushite (12% of total P); and poultry manure was dominated by brushite (18% of total P) and struvite (12% of total P). In contrast, Güngör et al. [14] reported that XANES alone can result in inaccurate speciation but the combination of XANES and X-ray diffraction showed improvement and yielded the best results.
These three physical methods described are very useful to identify and characterize mineral solid species in animal manure because little sample manipulation is required. In comparison, the use of solution 31P NMR gives less information about the specific mineral solid phases but it identifies a wide range of organic compounds. This is because sample preparation for solution 31P NMR requires extraction with alkaline solutions, which solubilizes all possible inorganic P present in the sample [11]. Solid-state 31P NMR can also be used, which does not require alkaline extraction. However, the presence of paramagnetic metal cations in the sample can impair NMR analysis [11]. For example, McDowell and Stewart [15], using solution 31P NMR, showed that 73% of total P in dairy manure was in the orthophosphate form, 19% was in the monoester-like P, 2% was phospholipid-like P, 3% was DNA and RNA-like P. The orthophosphate term is usually used to describe the inorganic fraction of P in animal manure when solution 31P NMR is used. In a different study, Leinweber et al. [8] using solution 31P NMR, reported that liquid swine manure had 77% of orthophosphate P, 13% monoester-like P, and 9% as diester-like P; and in chicken manure 20% was orthophosphate P, 65% was monoester, and 14% was diester. These results show the wide variety of P forms in manure from different animal species. However, they give little information on what are the probable mineral forms controlling inorganic P solubility in the manures. Therefore, NMR might not be the best approach to consider when trying to identify and understand the dynamic equilibrium between the solution and mineral solid phases in animal manure.
Chemical speciation using chemical equilibrium software can be extremely helpful in understanding the probable solid phases of compounds with complex matrix such as animal manure. Chemical modeling does not prove that a mineral phase exists as physical methods do, but it can establish that a substance behaves as if a particular mineral was present. The comparison of chemical model species, with SEM/Microprobe, X-ray, XANES, or chemically determined, can then validate the results obtained from the modeling. For example, Bril and Salomons [7] reported that in swine and chicken manure the P mineral phase was dominated by Mg and Ca minerals, struvite accounting for the largest amounts of P as determined by SEM/Microprobe. In their study, they also used a chemical equilibrium program that suggested that the manure solutions were in dynamic equilibrium with struvite, β–Ca3(PO4)2 (β-tricalcium phosphate—β-TCP), brushite, and DCP. Fordham and Schwertmann [6] calculated the solubility constant (Kso) values for probable mineral species in manure and compared those values with the literature. The authors reported that struvite, Mg3H(PO4)3·3H2O (trimagnesium phosphate), Ca4H(PO4)3·3H2O (octacalcium phosphate—OCP), brushite, and Ca(NH4)PO4·3H2O dominated the solid phases. When they performed X-ray diffraction, it was confirmed that struvite was present in their samples. These reports show that minerals predicted by chemical modeling are, in most cases, the same minerals present in manure as determined by other physical and chemical methods.
Serial dilution of animal manure when combined with chemical modeling can reveal how the solid phases controlling P solubility change as the manure solution becomes diluted. For example, Fordham and Schwertmann [6], using chemical modeling, found that concentrated cattle manure solution was dominated by struvite, brushite, and OCP minerals, while brushite was the main solid phase in dilute manure solutions. The authors also reported that treating the concentrated solution with acid to a pH of 6.7 released amounts of P and Mg that were consistent with concentrations one would get by dissolving struvite. In addition, further treatment of the solution to yet lower pH released concentrations of P and Ca consistent with the dissolution of Ca-phosphate minerals. Therefore, they were able to use chemical tests to validate their chemical modeling results. In comparison, Güngör and Karthikeyan [10] reported that the solid phase of concentrated dairy manure solutions was dominated by struvite and in dilute solutions OCP and β-TCP controlled the solid phase. These authors suggested that either the acidification of the solution or use of high extractant to manure ratio dissolved the more soluble struvite crystals, at which point the solid P phase became controlled by more stable Ca-phosphate minerals.
This literature review found that most of the research had focused on the species chicken, dairy, and swine. Therefore, in this research the same species were used in addition to manure from goat milk herds, so that results could be compared. The objectives of this research were to: (i) characterize and compare the probable inorganic P solid phases of four different animal species: dairy, swine, chicken, and goat; (ii) study the behavior of manure solution as a function of dilution with respect to pH, ionic strength, and ionic composition; and (iii) investigate the effects of ethylenediaminetetraacetic acid (EDTA) on P solubility in these manures.

2. Materials and Methods

2.1. Manure Collection and Chemical Analysis

The manure samples used in this study were collected during the summer of 2008 from different conventional farms across the state of Wisconsin and include one sample each of dairy, swine, chicken, and goat manure. The manures were collected from animals that were fed regular diets and there was no phytase addition to the feed of the monogastric species. The manure samples were frozen (−20 °C) within a few hours after collection to assure that manure chemistry did not change considerably from the time of sampling until the time they were used in the study. Manure samples were analyzed for total P, Ca, Mg, and K (dry ash method), using inductively coupled plasma-optical emission spectroscopy (ICP-OES, Thermo Jarrell Ash IRIS Advantage, Franklin, MA, USA), dry matter (DM) content, and total N (digestion) according to Peters et al. [16] (Table 1). This experiment took place in 2008 after collecting the manure.

2.2. Serial and EDTA Extraction of Manure Minerals

Each manure sample was extracted in a serial dilution scheme at six manures to de-ionized water ratios (MWRwet), 1:1, 1:2, 1:5, 1:10, 1:50, and 1:100, w/w, where the weight of the manure was the wet weight. These manure to water ratios were selected as an attempt to determine if the different amount of water plays any role on how much P can dissolve from manure. Deionized water was obtained by purifying water tap water using resin tanks that remove dissolved carbon, cations, and anions. After water passes through the resin tanks, a polisher filtration system was used to bring water EC down to 18.2 Megohn (ELGA water purification system, ELGA LabWater, Lane End, UK). Because the manures were weighed on a wet basis and most calculations used in the study were based on a manure dry weight basis, it was required to correct the ratios to a manure dry weight to water (MWRdry) ratio, which was calculated as:
MWR d r y = M W R w e t D M 1 + M W R w e t ( 1 D M )
where DM is the fractional dry matter content (w/w) of the manure. Thus, though the series of MWRwet values was constant for all treatments, the MWRdry differed with manure sample, reflecting the dry matter content. It should be noted that the 1:1 MWRwet is the greatest MWRdry (the most concentrated solution), and the 1:100 MWRwet is the lowest MWRdry (the most diluted solution).
Manure and water were weighed into 50-mL centrifuge tubes, capped, and placed vertically on an orbital shaker for 2 h at room temperature (21 °C). After shaking, solution pH and electrical conductivity (EC) were measured for each extract (using the Hanna Instrument HI9812-51 multiparameter probe, Woonsocket, RI, USA), followed by centrifugation at 3400× g for 30 min. Centrifuged samples were then filtered through 0.45 μm filter papers using a 12-mL disposable syringe. After filtration, one drop of concentrated nitric acid (70%) was added to the solution to prevent P minerals from precipitating and samples were stored at 4 °C for two days until they could be analyzed. The extracted samples were analyzed for total P, K, Ca, and Mg by ICP-OES, and total N according to Peters et al. [16] (Table 1). Each of the animal manures at each MWR were set up and analyzed in triplicate. It is unlikely that the different manure to water ratios caused any changes in microbial activity in the manure for the duration of the extraction.
For the EDTA experiment, each of the manures in duplicate were extracted in 1, 5, 10 mmol L−1 EDTA solutions buffered at pH 7.00. These EDTA concentrations were based on the amount of cations present in solution according to chemical tests. The MWRwet chosen for this study was 1:50 w/w and the same protocol for extraction of manure in water was used. In addition to ICP-OES and total NH4+ concentrations, inorganic P was also determined for EDTA extracts by the molybdate blue method [17].

2.3. Chemical Equilibrium Modeling

The chemical equilibrium program used in this study was Visual Minteq 2.61. This software has been used widely for the prediction of mineral formation [18,19,20]. As reported by those authors, Visual Minteq does not include struvite in the database; however, the software allows the user to input new compounds. The struvite mineral was added by entering the solubility product constant −log Ksp = 13.15 and the stoichiometry of reaction 1:1:1 for Mg2+, NH4+, and PO43− [21].
To perform a computer simulation, the concentrations of the species to be considered, the solution pH, and the ionic strength (IS) must be added to the system by the user. It is also important to set the program to not allow precipitation of any solid species before the simulation is started. The pH was measured directly from the solution; however, the IS parameter was estimated from the EC according to Snoeyink and Jenkins [22] as:
IS = EC (μS cm−1) × 1.6 × 10−5
The CO2 partial pressure, concentration of dissolved organic compounds, and the alkalinity (HCO3) can also be specified in the program. However, Güngör and Karthikeyan [10] reported that varying the dissolved organic acids from 0 to 3000 mg L−1 and HCO3 from 85 to 3000 mg L−1 (conditions observed under open and anaerobic conditions in manure digestion systems) did not significantly affect any of the calculations for the solid mineral species. As the measurement of these two parameters requires large amounts of solutions and increases the costs for research with no apparent benefit, we opted for not measuring these parameters.
After Visual Minteq performs the simulation, an output file is generated with a large list of probable solid species. Within the reported species, many are kinetically unfavorable to form. For example, Meyer and Eanes [23,24] reported that the transition from amorphous calcium phosphate to apatite is initially controlled by octacalcium phosphate, and after time there is a transition to a tricalcium phosphate phase. This transition requires a constant supply of Ca and also hydroxide (OH) ions. From the tricalcium phosphate phase, the development of apatite mineral also requires a long time and a constant supply of Ca and OH from the solution. Since the conditions in the manure are not optimal for apatite formation, as well as other kinetically unfavorable compounds, they are removed from the possible solid phase list generated after the simulation. Bril and Salomons [7] suggested the use of the saturation index (SI) to assist deciding which species should be removed and which ones should be kept in the output list. The SI is calculated as:
S I = l o g I A P K s p
where IAP is the ion activity product, and Ksp is the solubility product constant. The method consists in dropping from the output list any species that have an SI value less than −1 or greater than +1. From Equation (3), one can see that the values between −1 and +1 represent solution phases that are near equilibrium with the solid phase, therefore controlling the solubility of that species. The closer to 0 the SI value is, the more likely the solid phase is in dynamic equilibrium with the dissolved phase.

2.4. Statistical Analysis

The data analyzed using ANOVA was used to compare means when appropriate, using the statistical software SAS and the proc mixed procedure (version 9.4) [25]. Regression analysis was performed using the proc reg procedure in SAS.

3. Results and Discussion

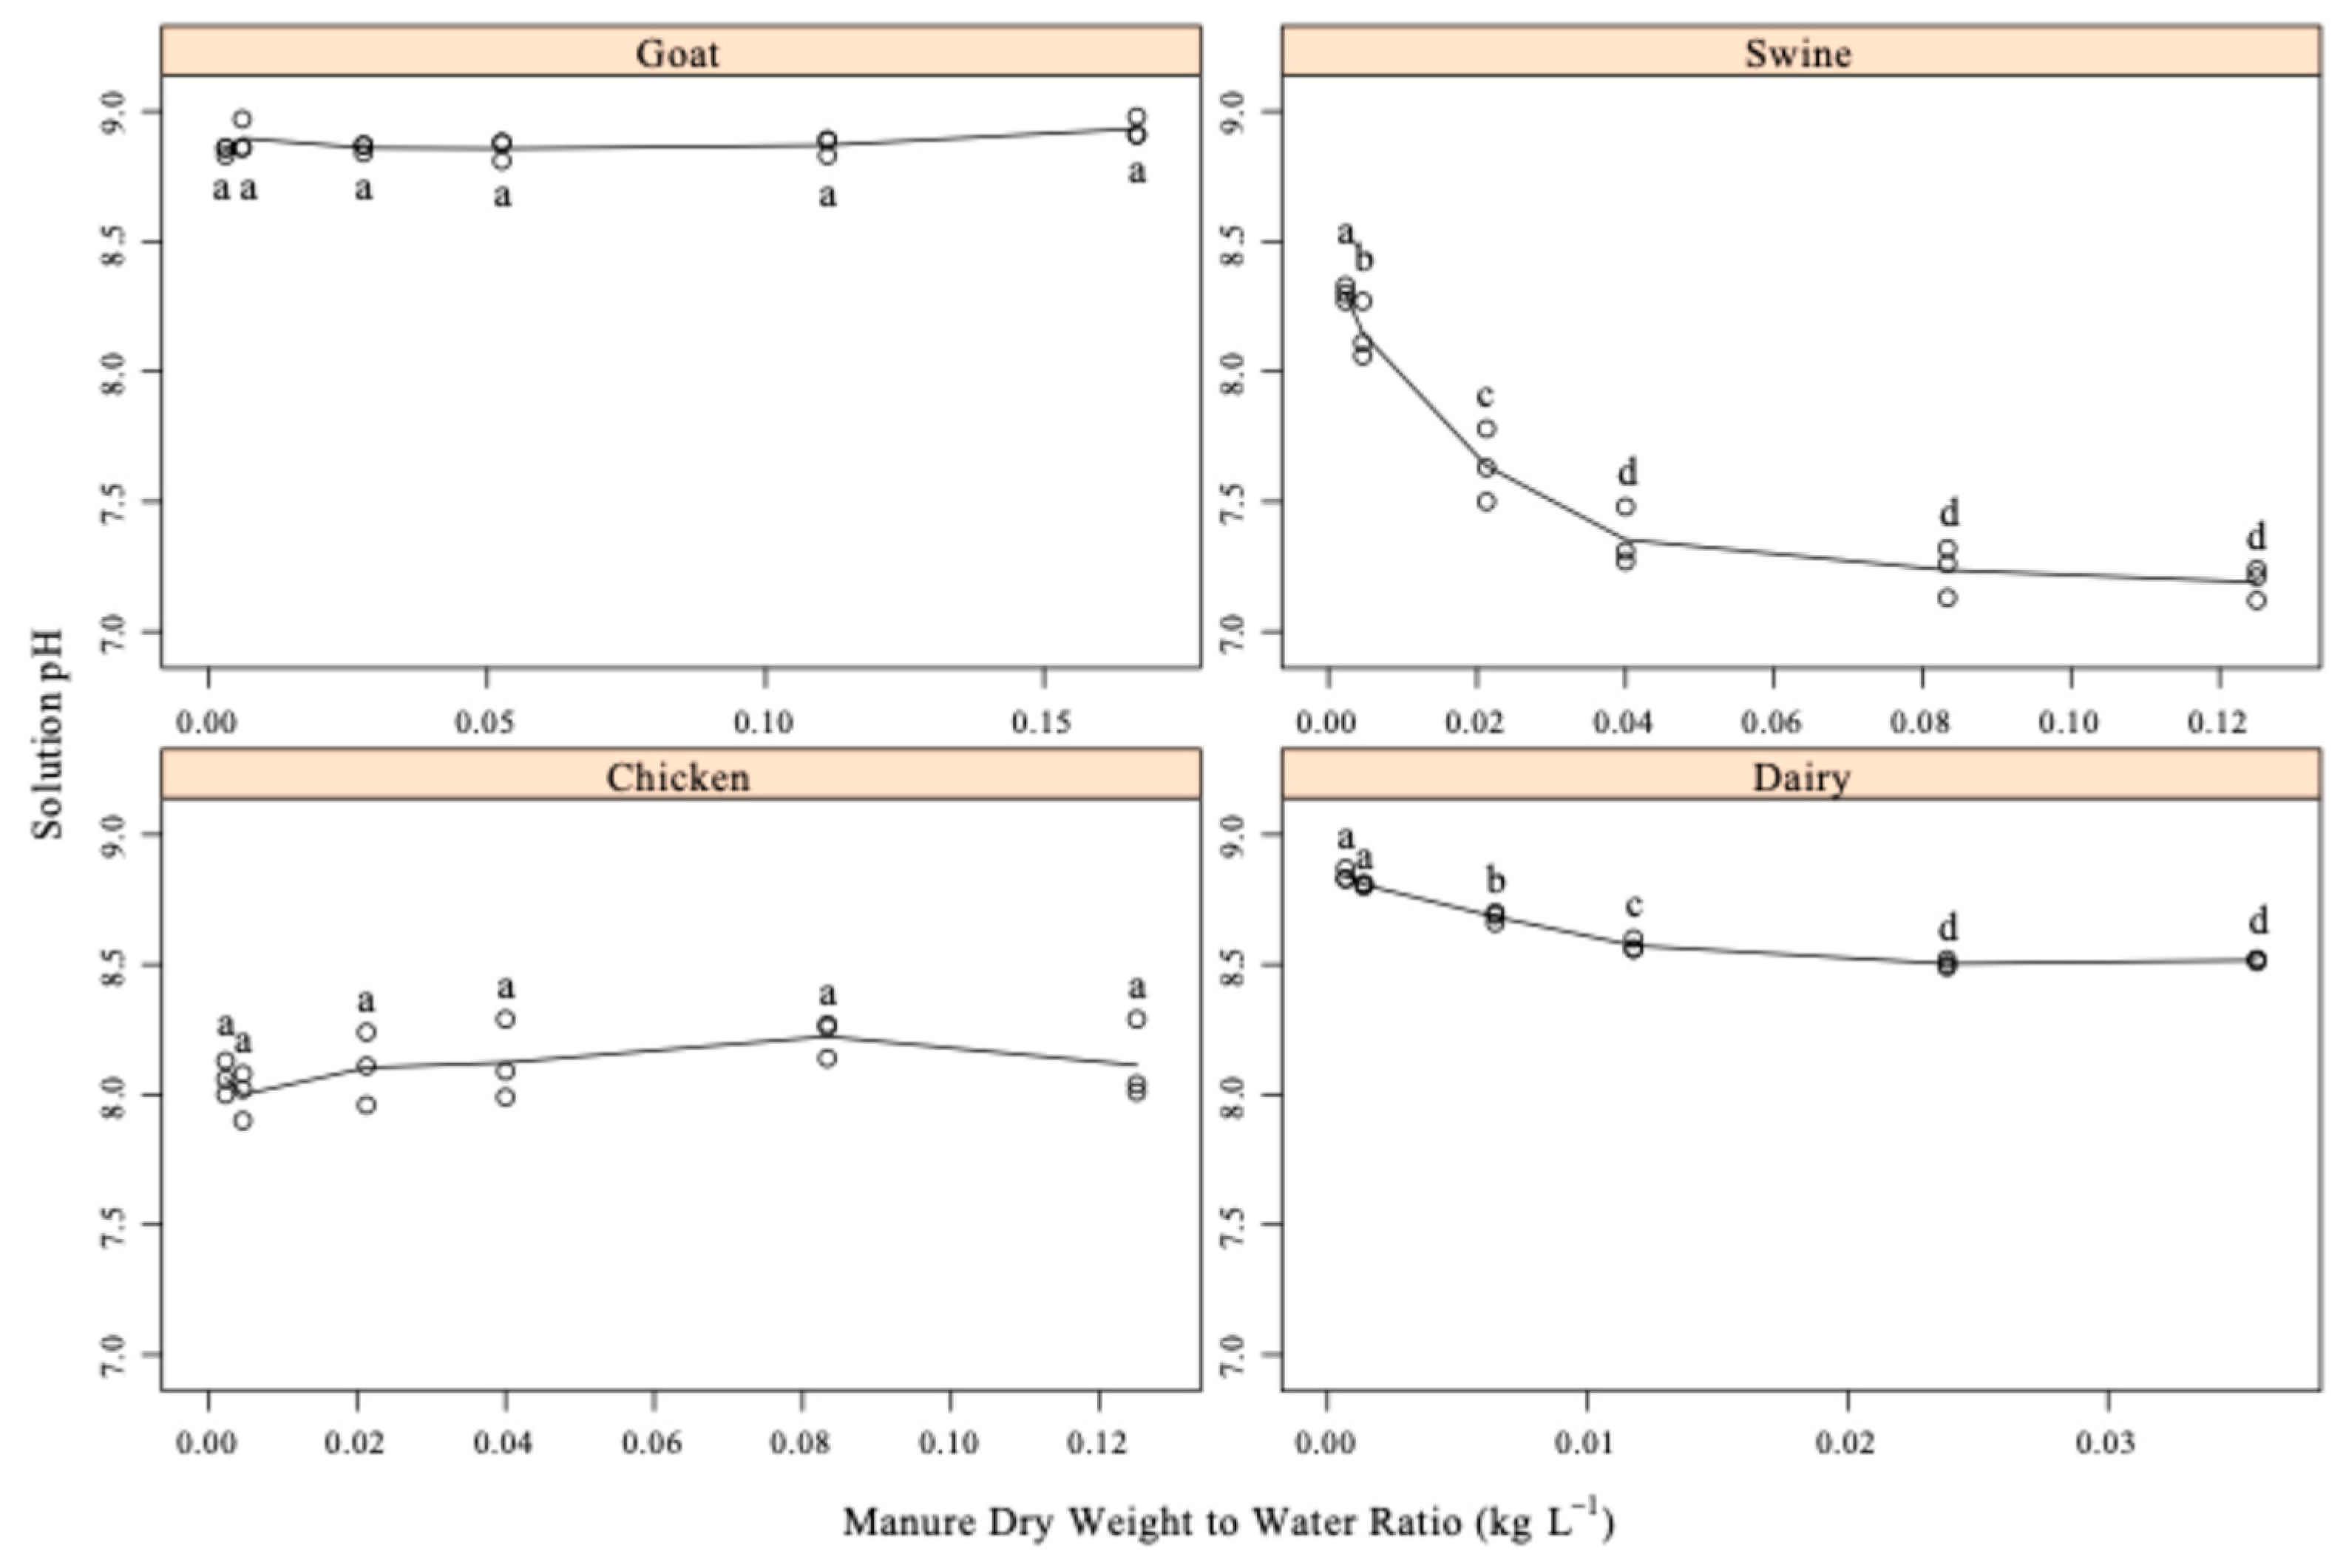
3.1. Solution pH and Ionic Strength

The solution pH after manure and water had equilibrated for 2 h was from circumneutral to slightly alkaline. Goat and chicken solutions showed little variation in pH with changes in MWRdry (Figure 1). Swine and dairy solutions showed a greater pH at high dilution (1:50 and 1:100) than low dilution (1:1 and 1:2), differing by 1.1 and 0.2 pH units, respectively. Güngör and Karthikeyan [10] reported that pH of anaerobic digested dairy manure solutions increased from 8.05 to 8.66 as the manure to water ratio changed from 1:3 to 1:127. This suggests a consumption of H+ protons from solutions such as certain minerals, including carbonates or some phosphates, are dissolving.
The ionic strength (IS) for all manures showed the same pattern of increasing IS with increasing MWRdry (from dilute to concentrated solution) according to a linear function, IS = a + b MWRdry (Figure 2). The slope of IS with respect to MWRdry carries units of mmol L−1/kg L−1, or mmol kg−1, and is the amount of dissolved salts (electrolytes imparting electrical conductivity and ionic strength) per unit amount of manure. This salt content is, as a first approximation, an intrinsic property of each sample. Addition of more or less water will dilute or concentrate the total salt concentration in accordance with the amount of water. The linear relationship further suggests that, in these manures, most of the cations and anions determining IS are neither precipitated as insoluble minerals nor complexed with organic materials. Overall, the salt content, as judged by slopes in Figure 2, was greater for chicken followed by goat, swine, and dairy manures.

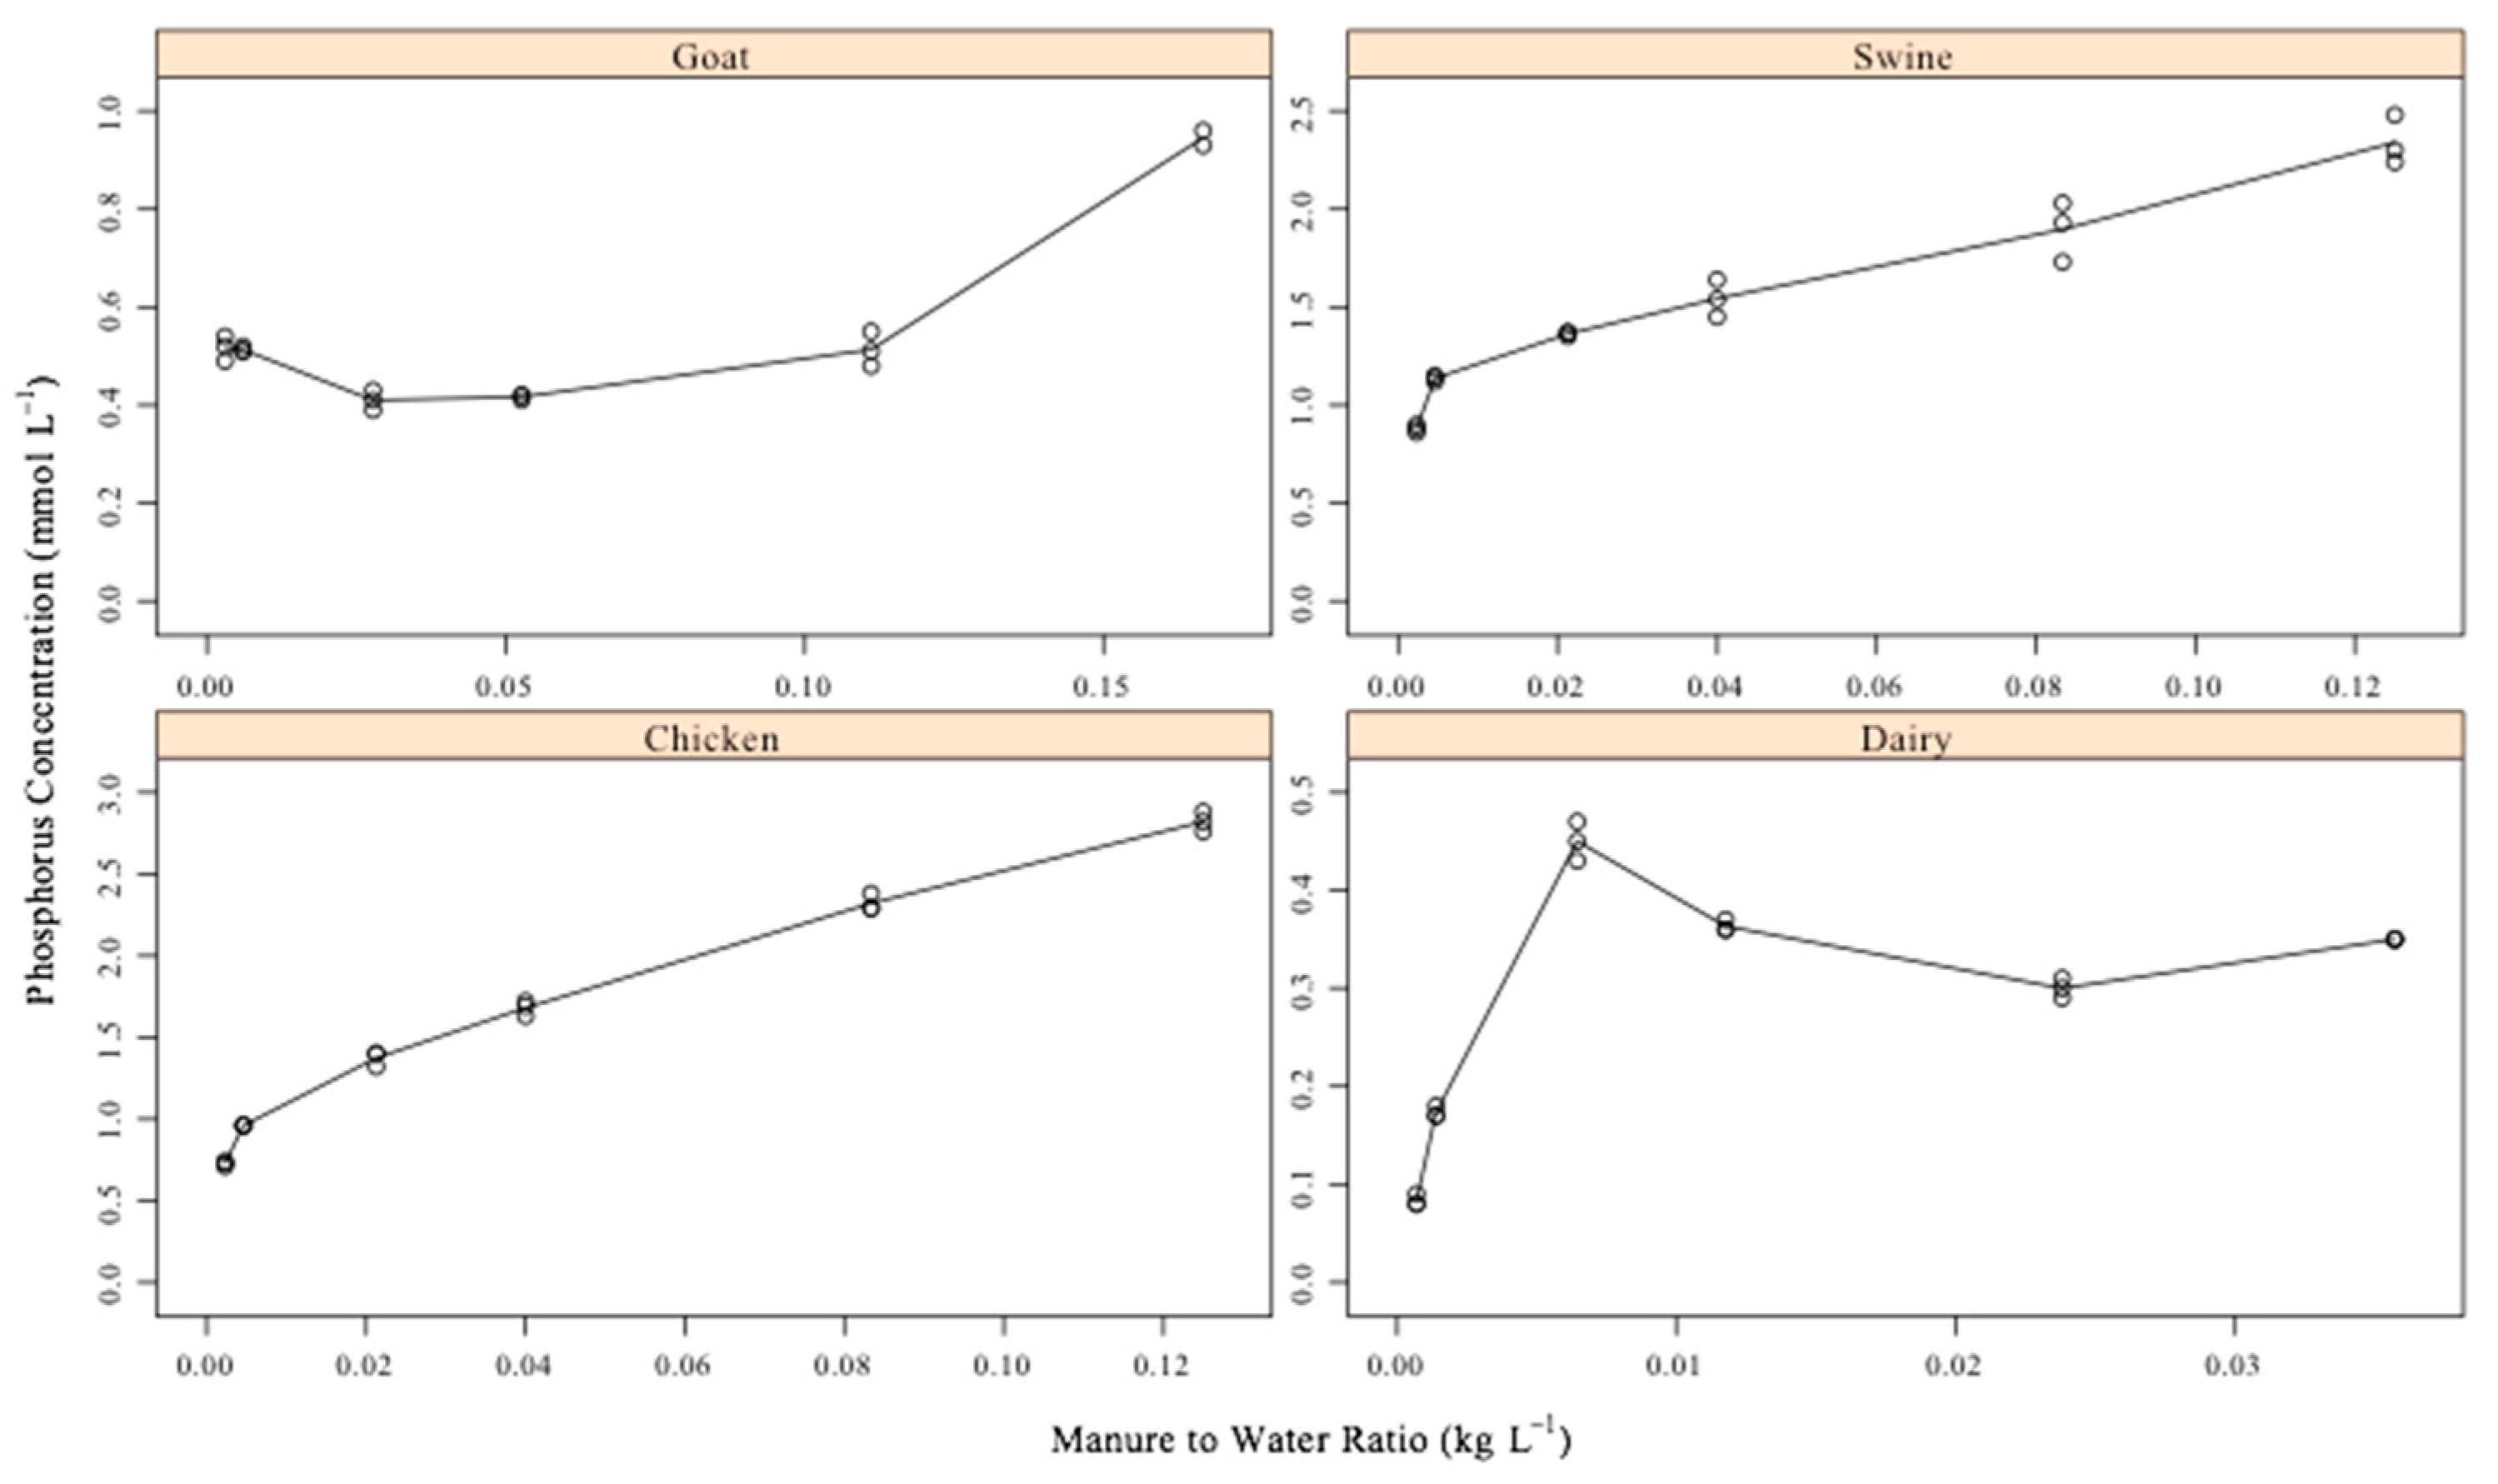
3.2. Manure P Extracted in Water Solutions

The total amount of P dissolved varied greatly among the manures tested. At the largest amount of water added (1:100), swine manure had the greatest amount of P dissolved per kilogram of manure dry matter, 11.9 g kg−1, followed by chicken (9.9 g kg−1), goat (5.4 g kg−1), and dairy (4.0 g kg−1) (Figure 3). In addition, for swine, chicken, and goat manure, adding 100 times more water than manure was not enough to dissolve all of the soluble P minerals. On the other hand, Figure 3 shows that in dairy manure all soluble P had dissolved by adding 50 times more water than manure. Table 1 shows total P concentration in these manures that are much greater than the P concentration in the water solutions. These results indicate that the majority of the P is still in a solid phase and would dissolve as more water is added, except for dairy manure. The lack of a linear relationship for dissolved P as a function of MWR suggest that swine and chicken manure at MWRwet from 1:1 to 1:10 have different minerals controlling P solubility compared with goat and dairy manures (Figure 3). These results agree with Liu et al. [26] who found that the higher the amount of water in manure, the higher the amount of extractable phosphate. In addition, Wang et al. [27] also reported that water extractable P increases as the amount of dry matter decreases.

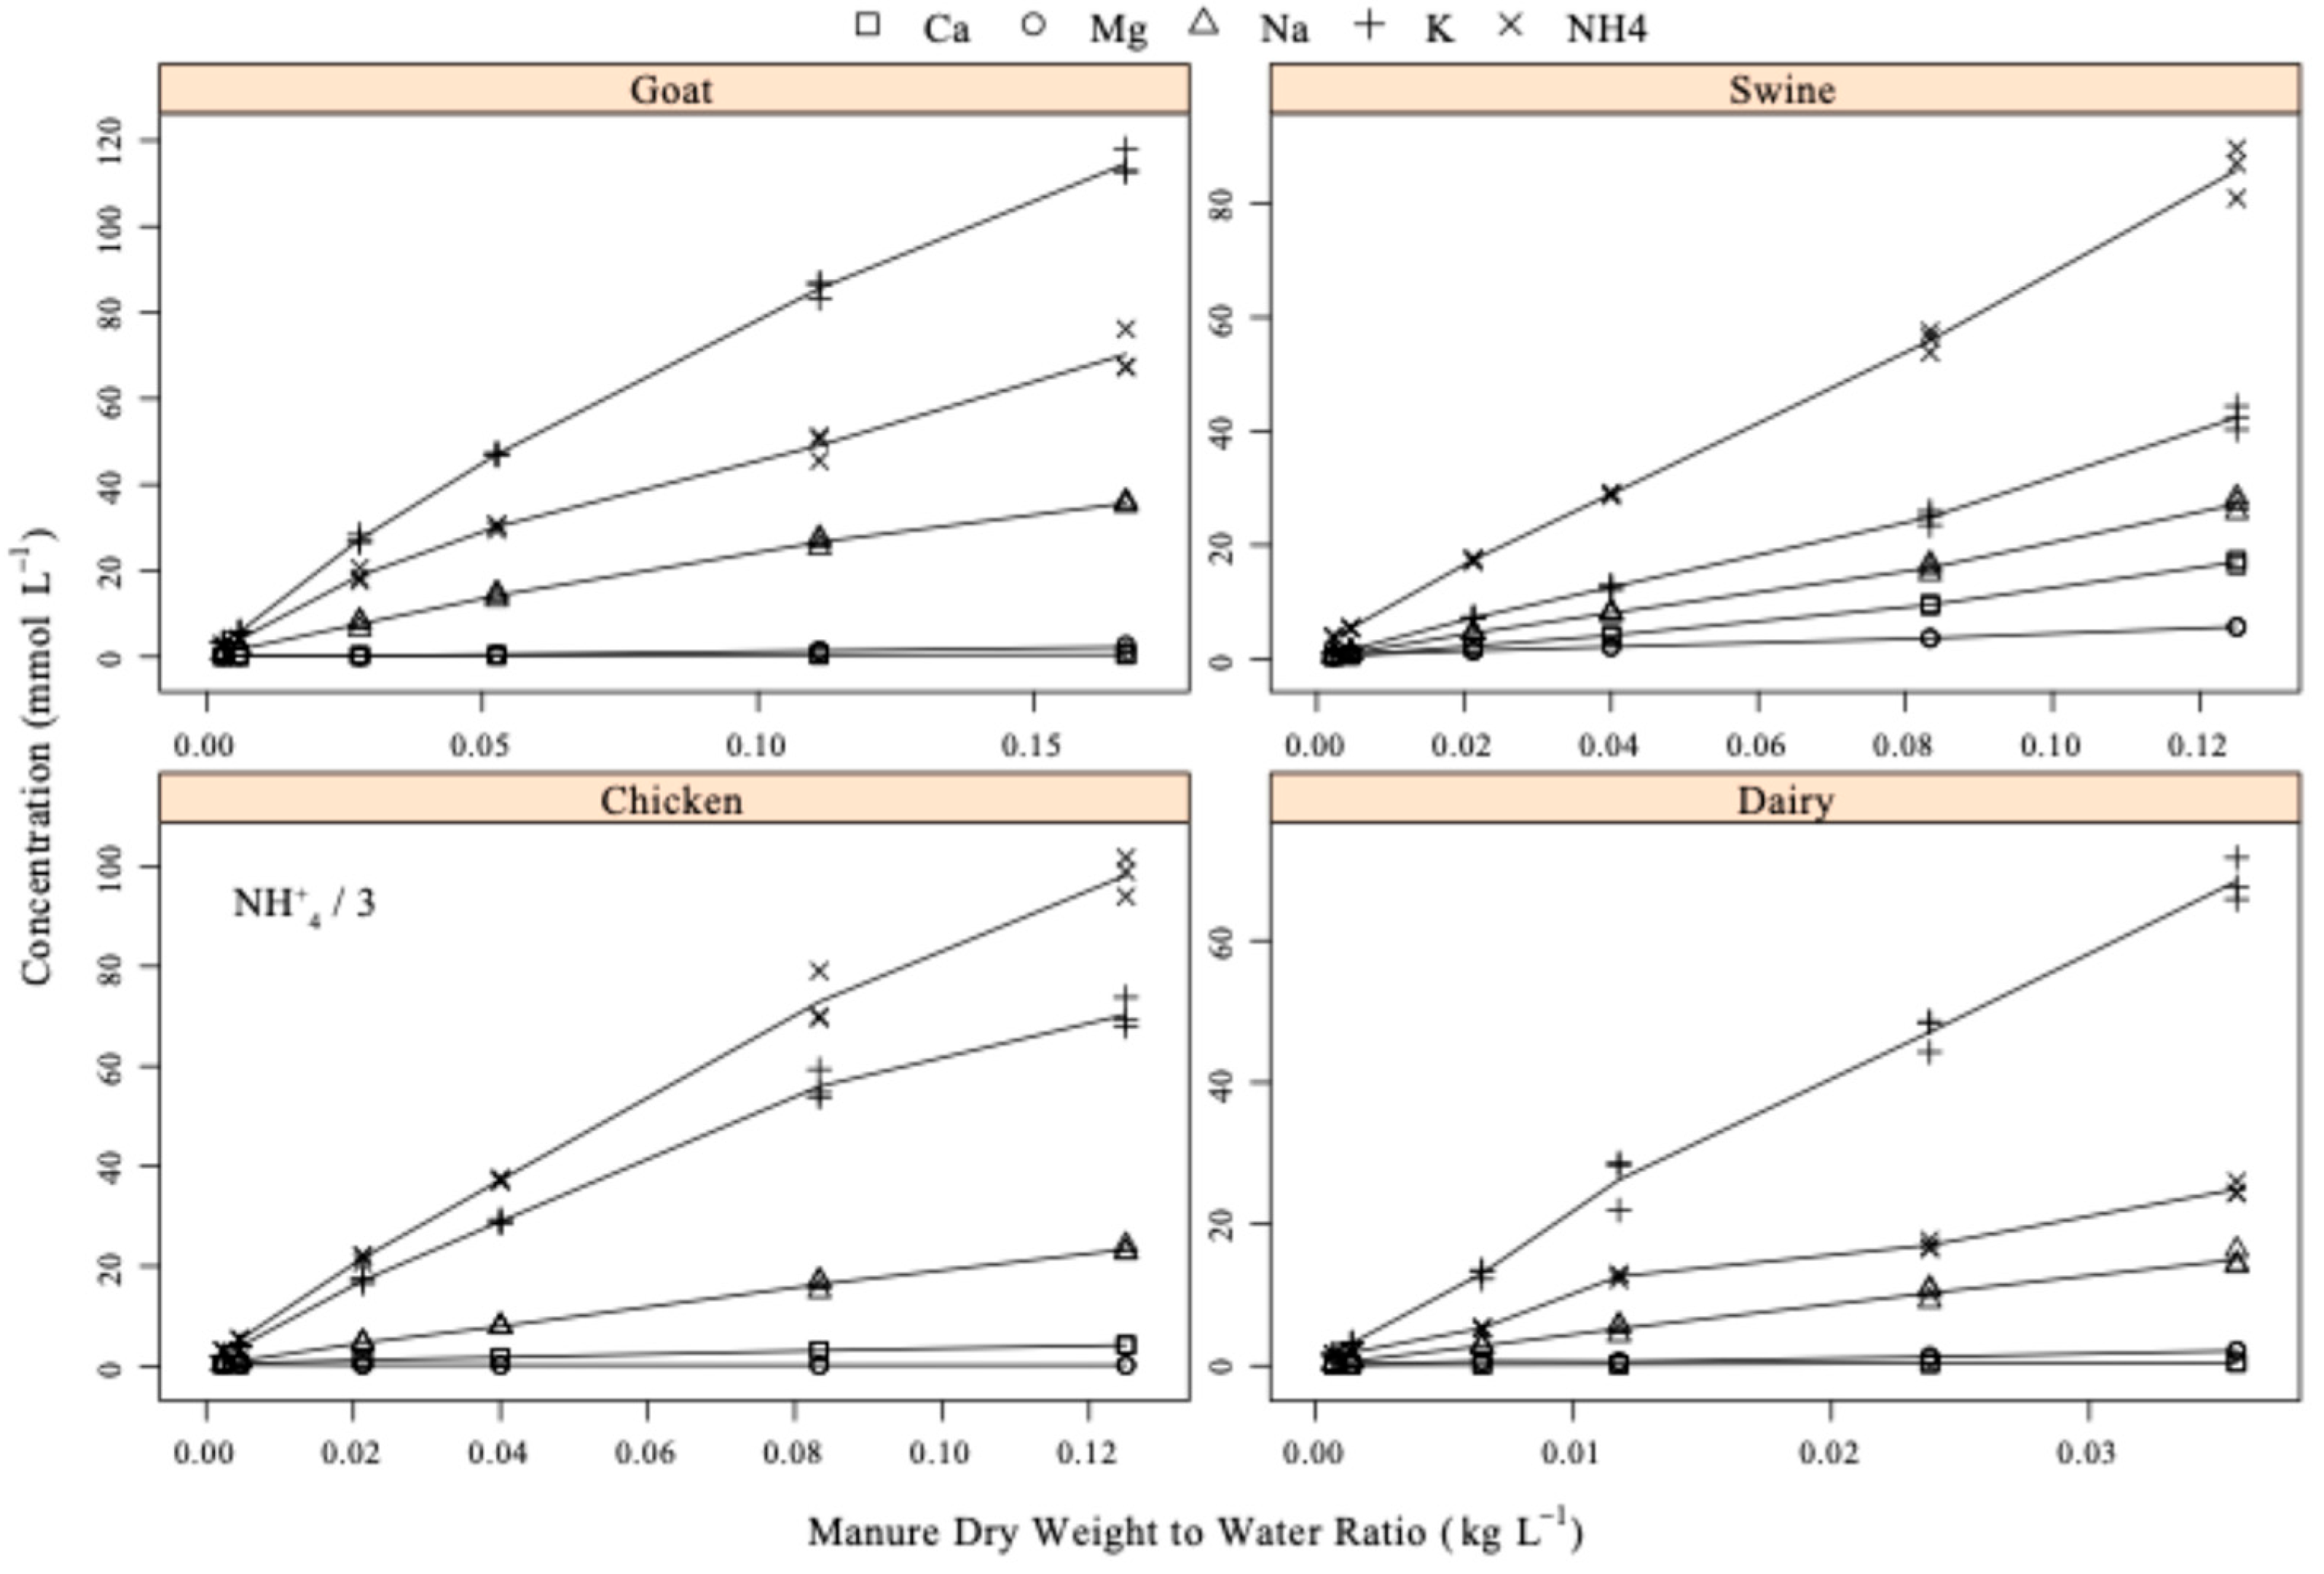
3.3. Ionic Composition of Water Extracts of Manure

On a concentration basis of the cations tested, dairy and goat manure solutions were dominated by K followed by NH4+ and Na, with yet lower concentrations of Mg and Ca (Figure 4). In contrast, swine and chicken manure solutions were dominated by NH4+, followed by K and Na, with yet lower concentrations of Ca and Mg (Figure 4). As with the relationship with ionic strength (above), the cation concentrations of swine and chicken manure solutions were linearly related to MWRdry, and was lower in the more dilute extracts, i.e., lower as the MWRwet went from 1:1 to 1:100, as expected for the dilution of soluble salts. The difference between the manure from the two ruminant species dominated by K and that from the monogastric species dominated by NH4+ is likely due to differences in diet, particularly the high intake of K-rich forage plants by ruminants. Consistent with the work of Wagner and Karthikeyan [28] who also reported that Ca, Mg, and NH4+ were the dominant cations in dairy manure; while Liu et al. [26] who also found that water extractable P had a strong relationship with the amount of cations in solution.
The behavior of P concentration in water extracts as a function of dilution (Figure 5) is quite different than that of the cations, which showed a relatively simple dilution process at work. In the goat manure extracts, dissolved P declined with increasing dilution but then abruptly showed an increase in dissolved P concentration at the greatest dilution tested, suggesting that some constraint on P solubility had been overcome by the process of dilution. Dissolved P concentrations of swine and chicken manure extracts show more curvature than expected by similar relationships for IS, K, NH4+, and Na. Dissolved phosphorus in dairy manure had the most complex behavior of all manures (Figure 5). From the most concentrated extract in dairy manure, P concentration increased somewhat upon increased dilution as if dilution was reducing solubility constraints, until a point at which subsequent dilution caused a near linear concentration decrease, suggesting that the simple dilution was at work from that point on. The behavior of dissolved P with dilution, and particularly the differences in behavior among the different manure sources, indicates that a more thorough understanding of the constraints on P solubility in the extracts using the other chemical constituents is required to make sense of the P data. Wagner and Karthikeyan [28] reported that Ca ions were controlling P behavior in anaerobically digested dairy manure.

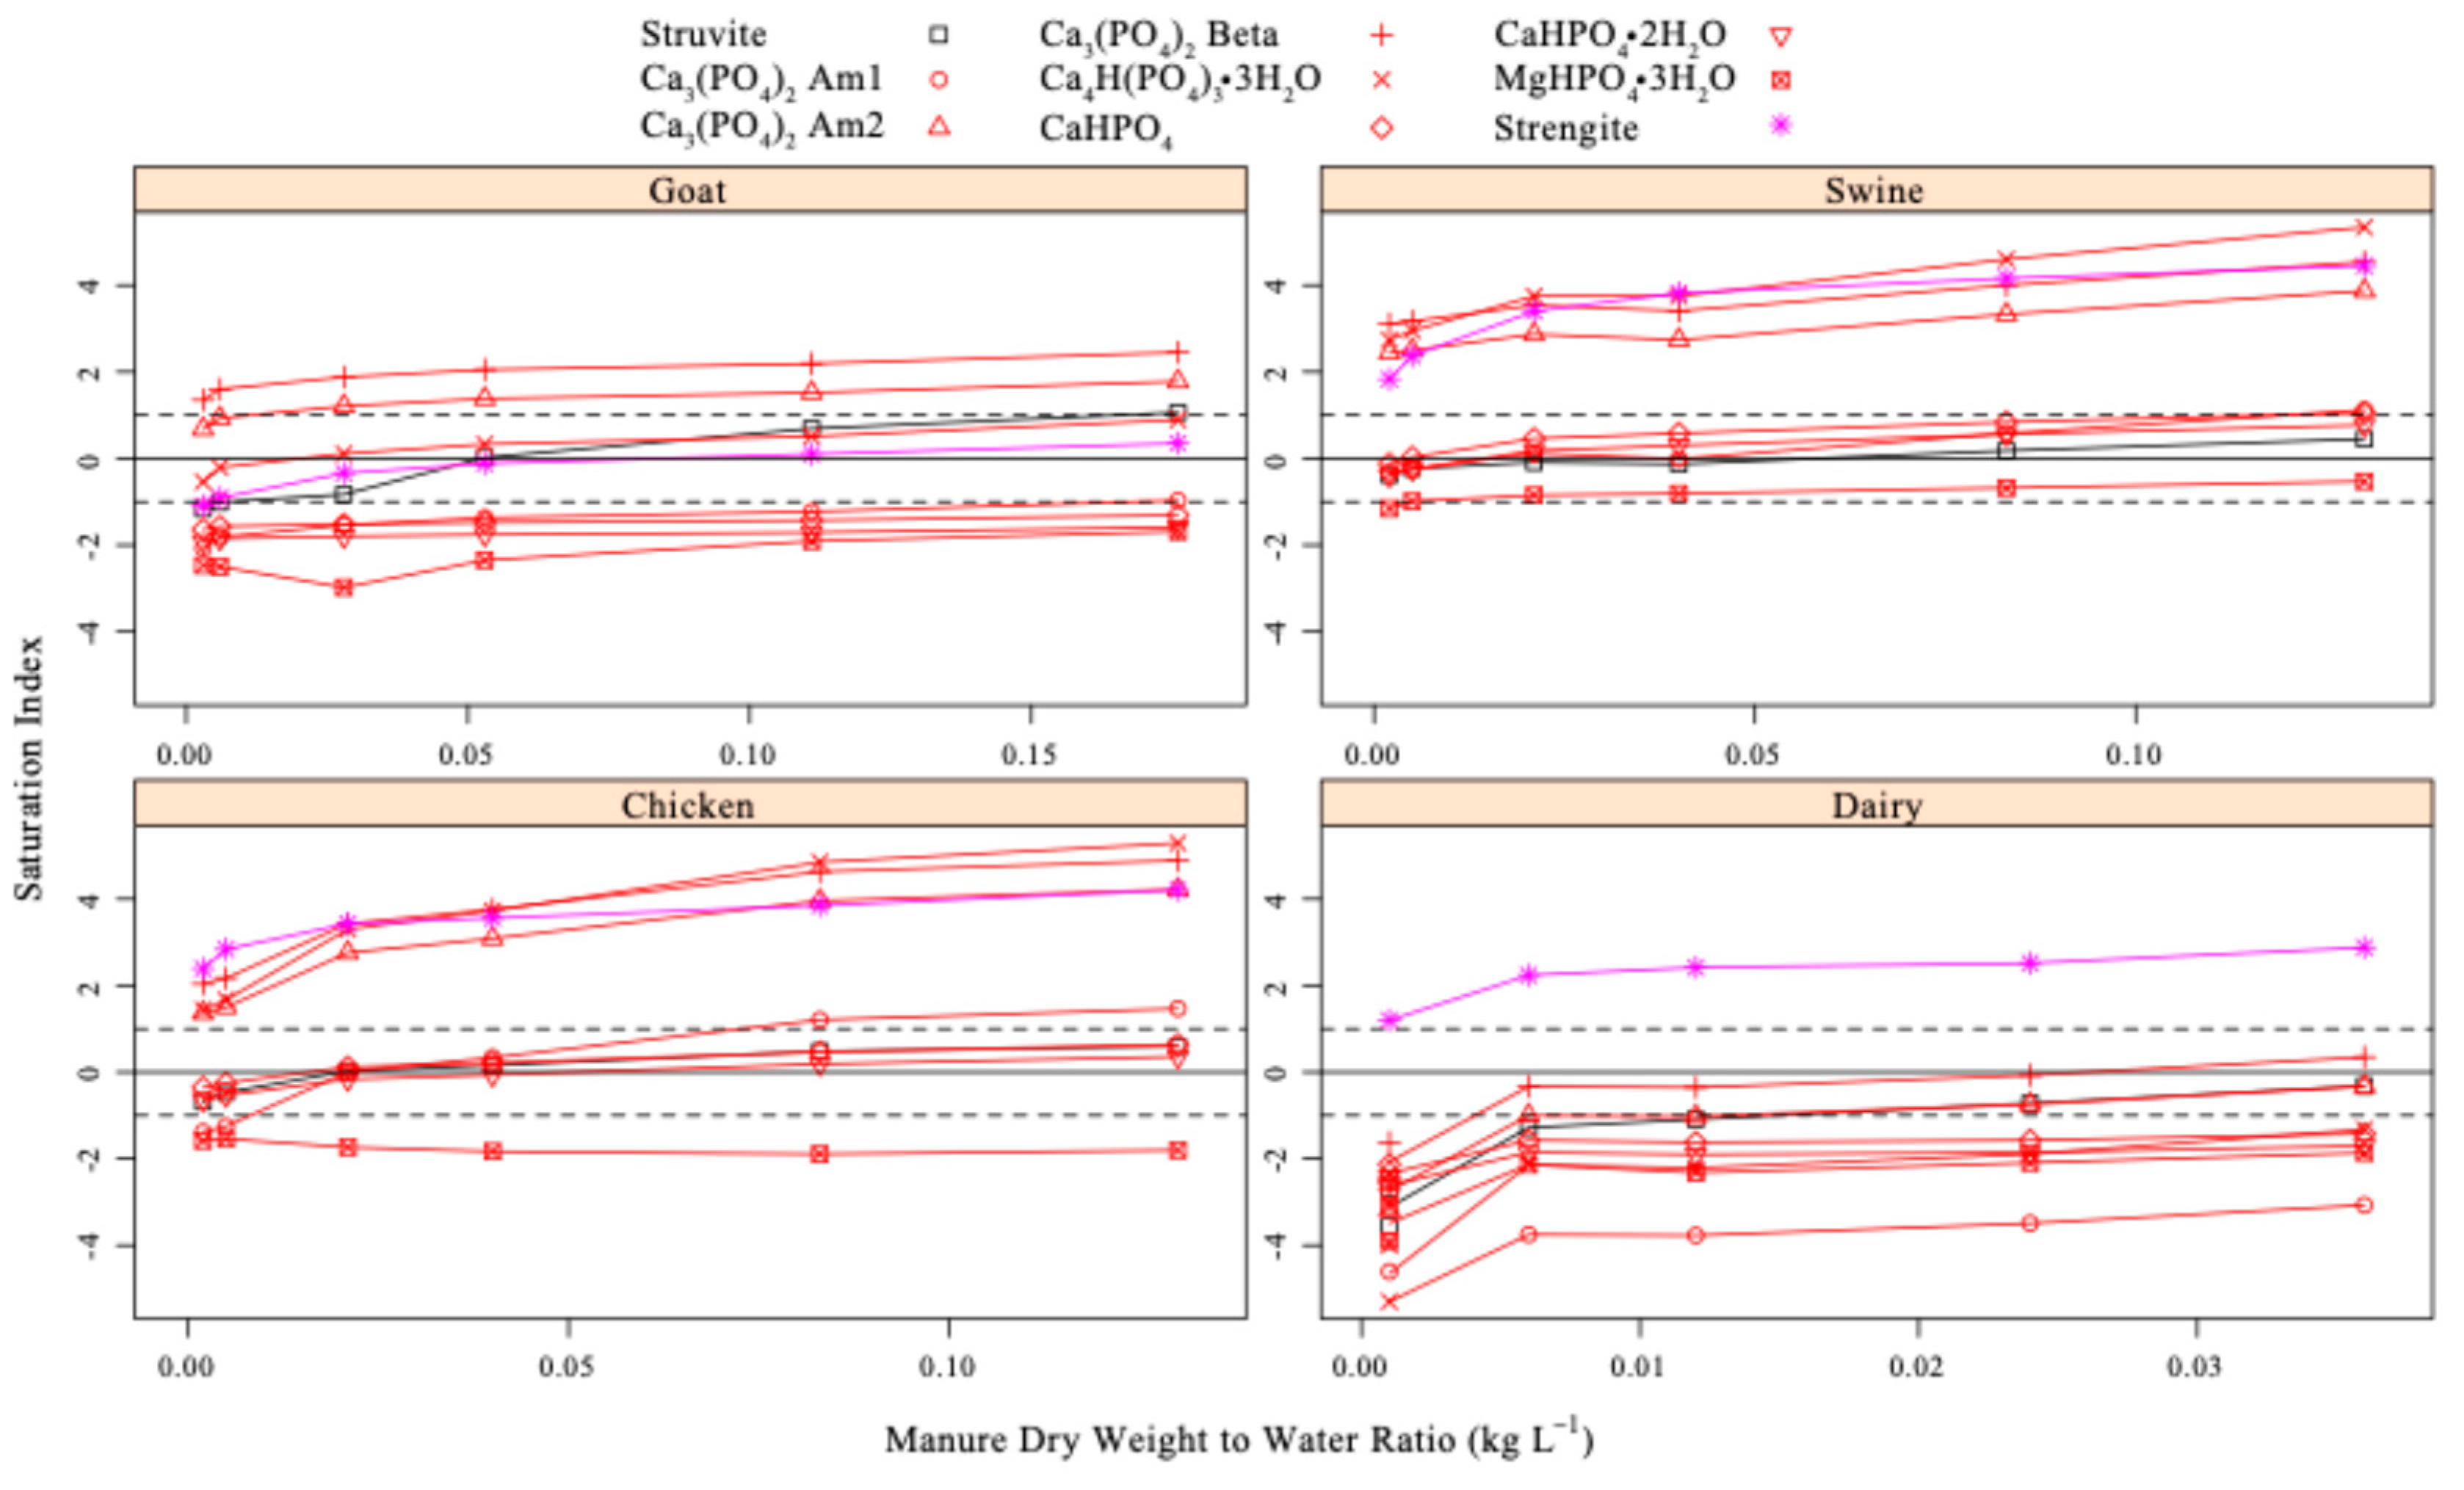
3.4. Probable Solid Phases Controlling P Solubility in Water Extracts

Chemical modeling of the manure solutions uses pH and IS data in conjunction with total dissolved concentrations of P, Ca, Mg, and NH4+ to calculate free ion activities of the various chemical components, after which comparisons to the solubility products of known mineral species can be made. Visual Minteq calculations showed different probable phases controlling P solubility in the manures based on the saturation index is (SI) plotted against MWRdry (Figure 6). The solid line at SI = 0 indicates dynamic equilibrium between the solid phase and the liquid phase. The dashed lines at SI = 1 and −1 indicate the upper and lower limit of the probable phases controlling the dissolution or precipitation of minerals [7]. Because this study is about the dissolution of the mineral phases, we shall keep the discussion to the dissolution phenomena only. However, the reader can refer to Babic-Ivancic et al. [29] and Doyle et al. [30] for discussion on the P precipitation phenomena. The mineral species that fall above the SI = 0 solid line can be regarded as supersaturated species and those that fall above the SI = 1 dashed line are kinetically unfavorable to form under the conditions inside of a manure pile. The mineral species that fall below the SI = 0 solid line can be regarded as undersaturated and therefore not controlling P solubility. For example, hydroxyapatite was supersaturated and trimagnesium phosphate (Mg3(PO4)2) was undersaturated for all manure tested; therefore, neither is expected to control P solubility.
In goat manure, the probable solid species controlling P solubility were struvite, TCP-2, OCP, and strengite, an iron phosphate mineral. Struvite started slightly above the limit SI = 1 at the 1:1 MWRwet and finished lower than the SI = −1 limit at the 1:100 MWRwet (Figure 6). TCP-2 started above the SI = 1 limit, and by the 1:100 MWRwet, was still above the dynamic equilibrium, SI = 0. For OCP and strengite, both started within the range SI = 0 to 1; at the 1:100 MWRwet, OCP was within the range SI = 0 to −1 whereas strengite was below the lower limit. Based on the results presented so far, it appears that from the 1:1 to 1:10 MWRwet, struvite, strengite, and OCP were the probable solid phases controlling P solubility, which then shifted to OCP and TCP-2 between the 1:10 and 1:100 MWRwet. Furthermore, the SI for the TCP-2 species at the 1:100 MWRwet is still well above the dynamic equilibrium SI = 0, suggesting that more P can dissolve.
In swine manure, the most probable species controlling P solubility were struvite, Ca3(PO4)2.amorphous1 (amorphous tricalcium phosphate, TCP-1), CaHPO4 (dicalcium phosphate—DCP), brushite, and MgHPO4·3H2O (MP) (Figure 6). Struvite and brushite were always within the SI = 1 to −1 range, whereas TCP-1 and DCP started slightly above the upper limit SI = 1 but were within the range SI = 1 to −1 by the 1:100 MWRwet. Magnesium phosphate was always below the dynamic equilibrium region SI = 0, and by the 1:100 MWRwet, was below the −1 limit. Based on these results, one can infer that from the 1:1 to the 1:10 MWRwet, the minerals struvite, brushite, and TCP-1 interchanged as the solid phases controlling P solubility, then shifted to struvite and DCP between the 1:50 and 1:100 MWRwet.
In chicken manure, the mineral species more likely to be controlling P solubility were struvite, TCP-1, DCP, and brushite (Figure 6). Struvite, DCP, and brushite were always within the SI = 1 to −1 range, while TCP-1 started well above the upper limit SI = 1 and finished below the lower limit S = −1. Based on this result and on the ionic concentration data, one can presume that struvite, DCP, and brushite were the mineral species more likely to be controlling P solubility in all MWR (Figure 6).
In dairy manure, the probable solid phases controlling P solubility were struvite, TCP-2, and β-TCP (Figure 6). Struvite and TCP-2 started below the SI = 0 line and by the 1:5, MWRwet was below the lower limit SI. Beta TCP started within SI = 0 and 1, but by the 1:50, MWRwet was below the lower limit SI = −1. For dairy manure, the quadratic relation between P concentration and MWRwet, reported previously, could be explained by the results from the chemical modeling. Perhaps from the 1:1 to the 1:10 MWRwet, all struvite and TCP-2 dissolved causing the initial linear decrease; between the 1:2 and the 1:10 MWRwet, β-TCP could have started to dissolve resulting in the increase in P concentration, which led to the quadratic behavior; finally, from the 1:50 to the 1:100 MWRwet, the trend was likely due to a dilution effect, as concentration decreased linearly with increasing water added.
The common result among these four manure samples is that a magnesium ammonium phosphate mineral, struvite, and one or more calcium phosphate minerals of varying composition and crystallinity, but similar solubility, appear to control the P solubility in these water extracts. The serial dilution results indicate that the P dissolved in water at the 1:100 MWRwet represented 44, 35, 37, and 61% of the total P that can dissolve from goat, swine, chicken, and dairy manure, respectively. These results show how complex the mineral phase in manure can be. Although chemical modeling does not provide physical proof for the presence of a mineral, it does suggest that a solution would behave accordingly if such minerals were present. Therefore, it is probable that more than one mineral solid phase is controlling P solubility in these animal manures. It is also possible that as one mineral dissolves, a less soluble mineral precipitates until the solution is diluted enough for it to solubilize [31]. Other researchers have also reported that phosphate minerals containing Mg and Ca are controlling phosphate solubility from manure [32,33]. Cooperband and Good [9] also reported that organic P from manure is not likely controlling the amount of P in solution, but rather the P minerals present in manure control its own solubility based on stoichiometry of the manure. Minerals like hydroxyapatite, dicalcium phosphate, brushite, and variscite have also been reported to be controlling P solubility in manure [6,10,12].
The P solubility does not appear to be completely buffered to a single concentration over the range of manure–water ratios employed here. It appears likely only in a single case, that of 1:100 MWRwet for dairy manure, was enough water present to dissolve all of the controlling mineral phases, as judged by the linear extrapolation to the origin, as observed for the soluble cations. To dissolve all the mineral P phases, either acidification or a chelating extract will likely be required in chicken, swine, and goat manures. For example, Liu et al. [26] showed that to precipitate P as struvite, oxalic acid had to be introduced to precipitate Ca out of solution, allowing all phosphate to dissolve. Other researchers have shown that phosphate dissolved from manure with increasing water-to-manure extraction ratios [32,34,35].

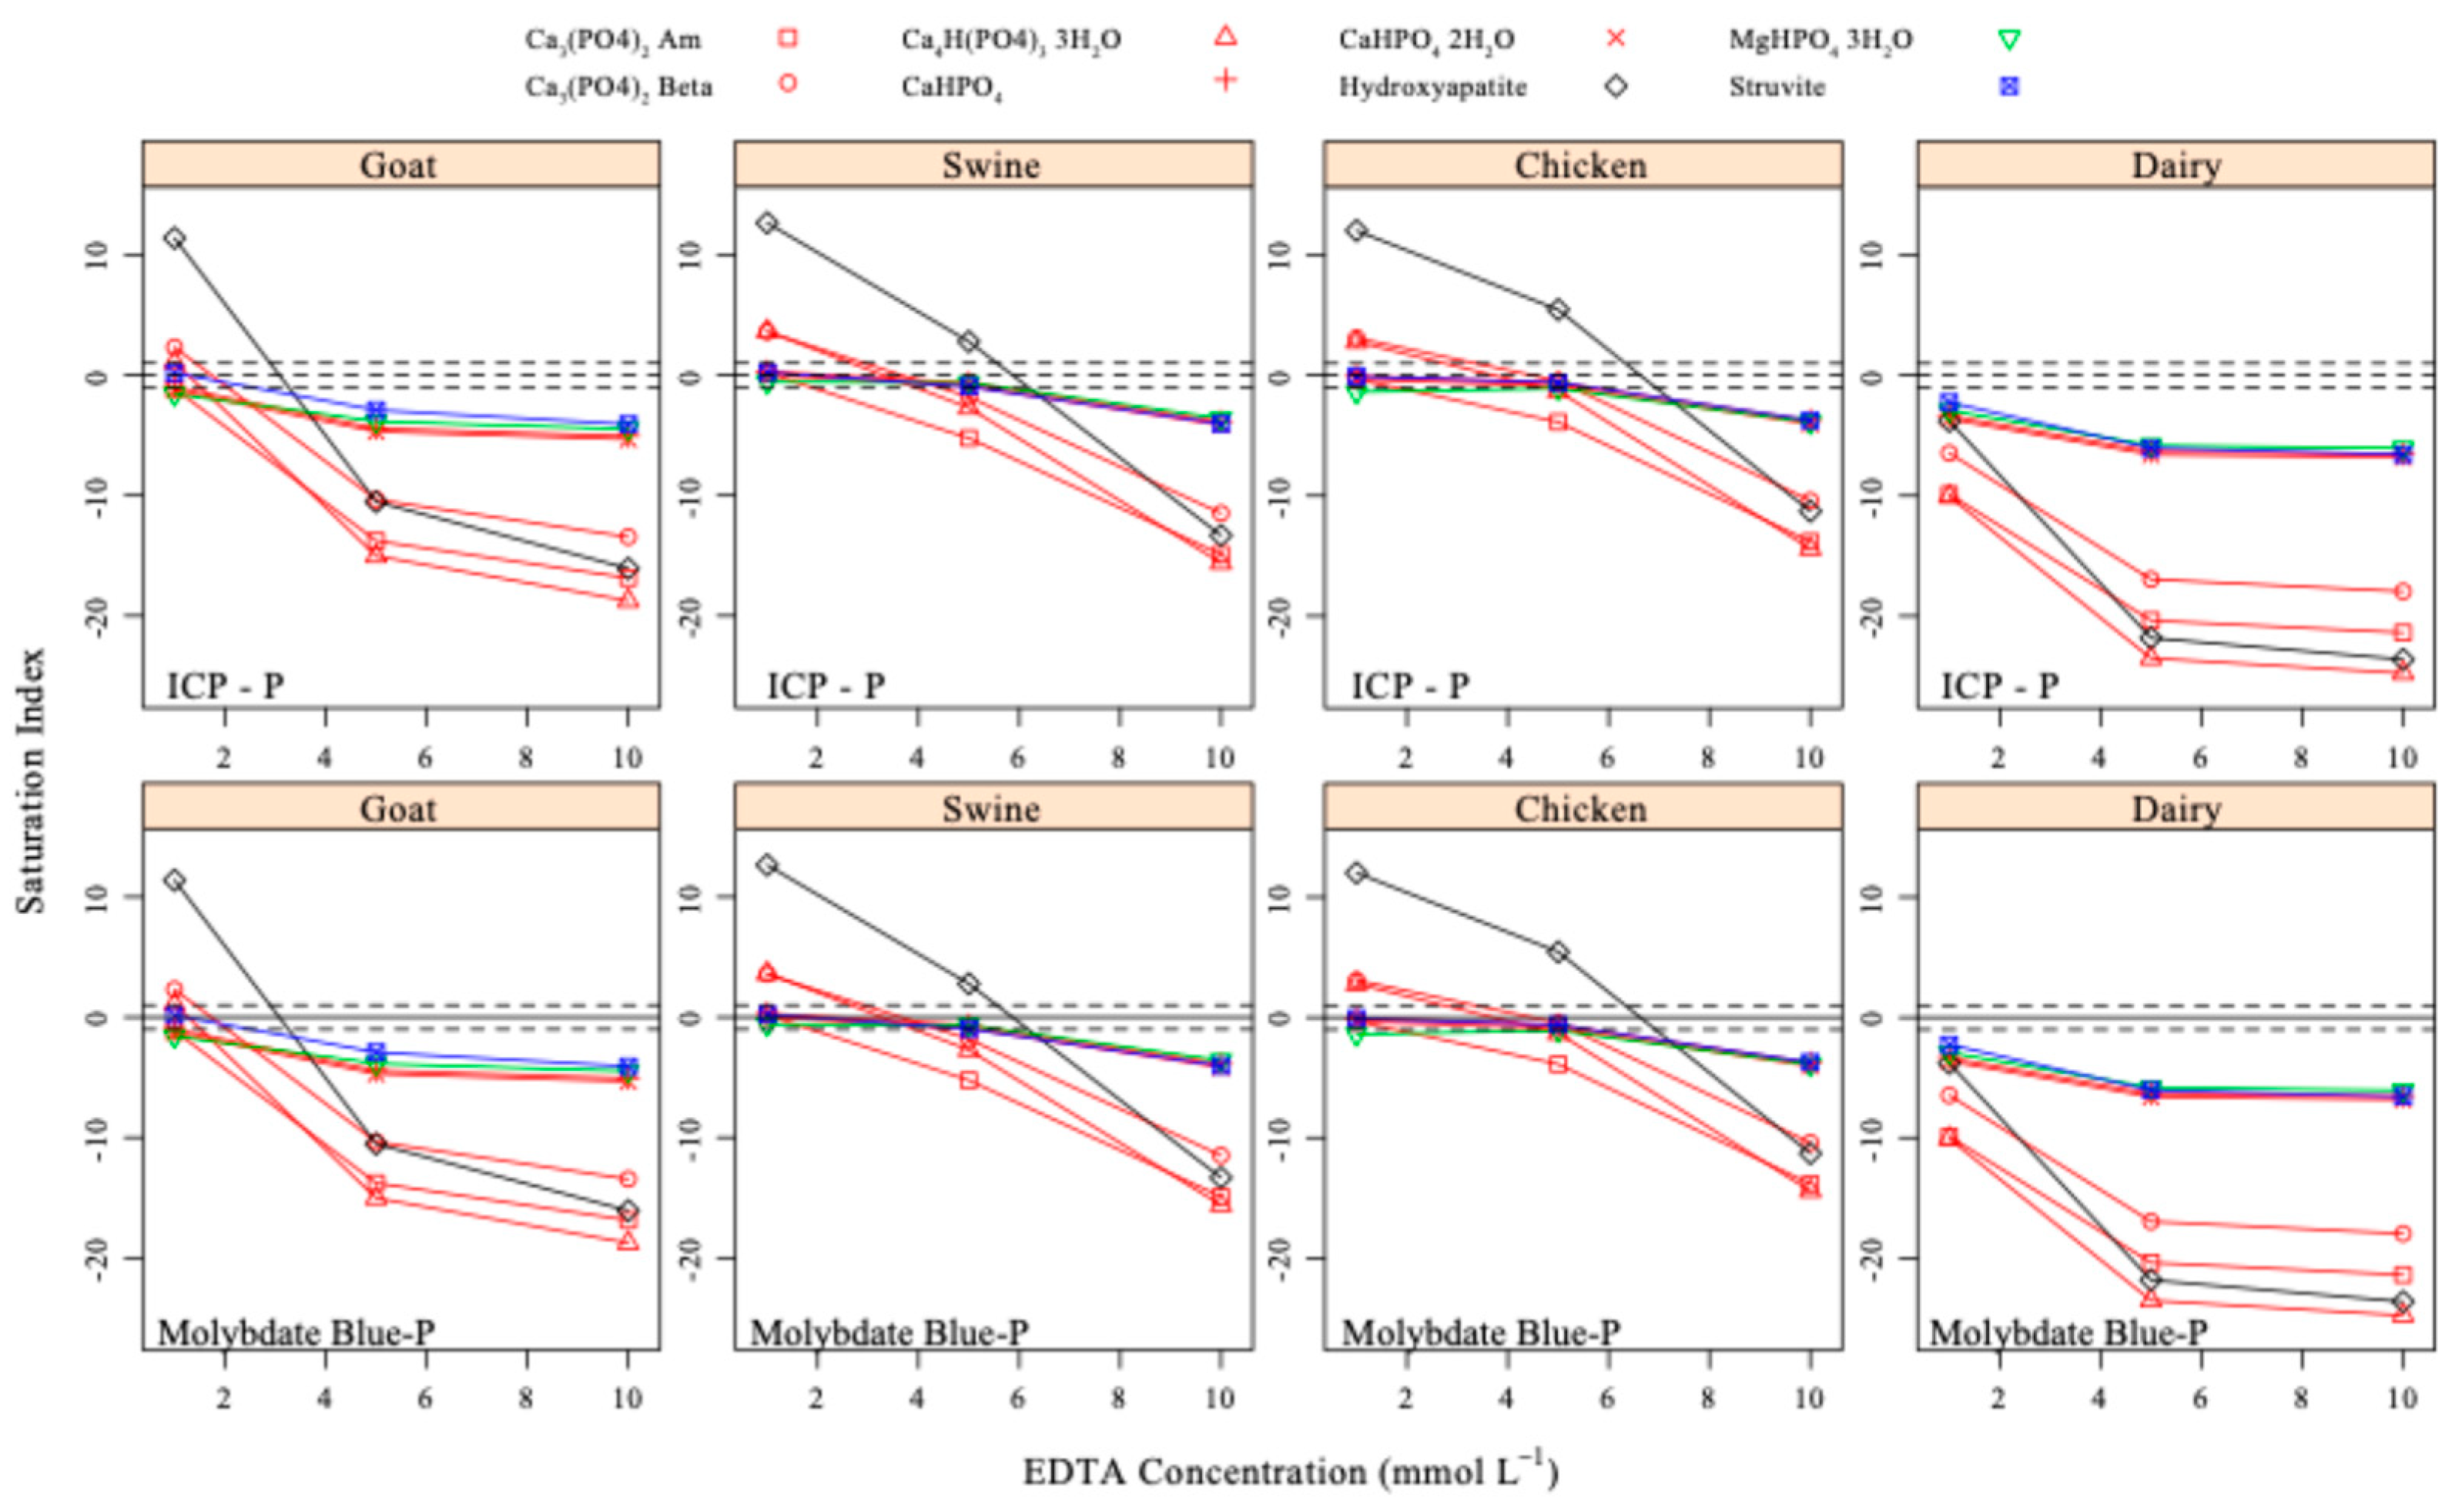
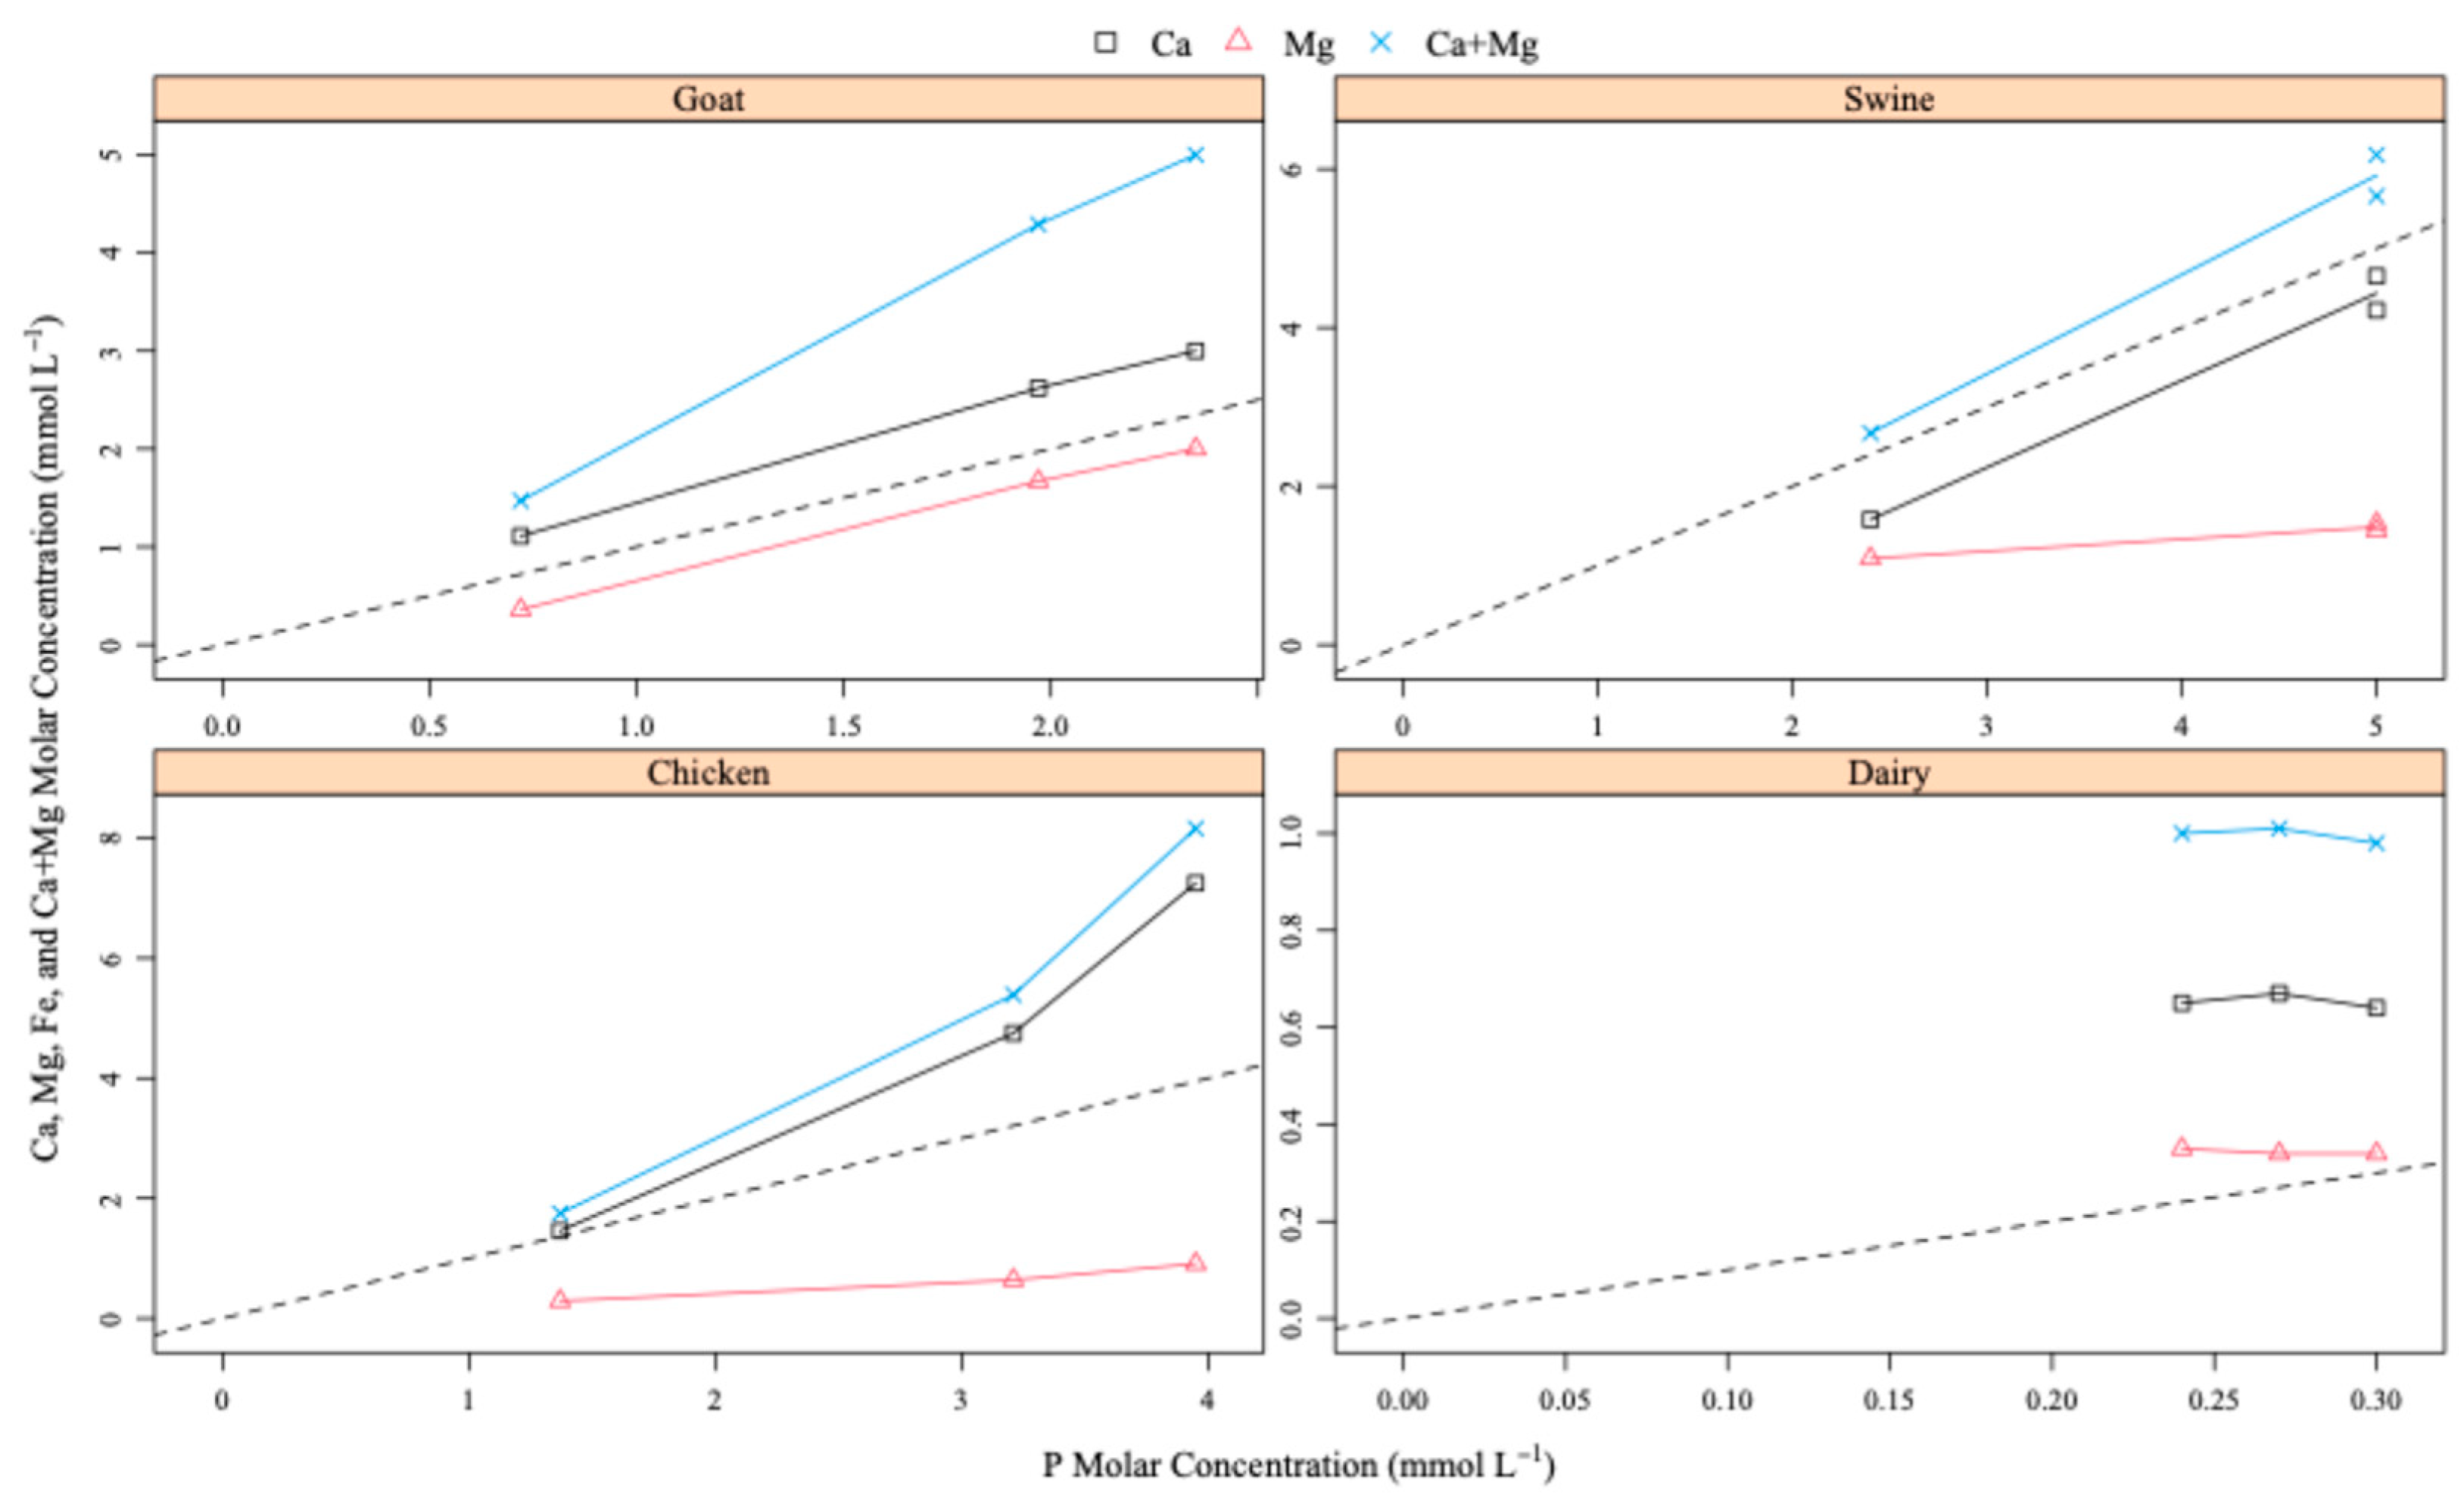
3.5. Manure P Extracted in EDTA Solutions and Probable Solid Phases

EDTA is a chelating molecule with a relatively high affinity for Ca2+, Mg2+, and Fe3+, particularly at neutral and alkaline pH values, and as such is used here to attempt to dissolve the mineral P phases that simple water extraction was not able to dissolve at reasonable manure–water ratios.
The EDTA extractions showed that the greatest P concentrations measured by ICP-OES (ICP-P) were observed in swine (34.2 g kg−1), followed by chicken (27.1 g kg−1), goat (12.4 g kg−1), and lastly dairy (6.6 g kg−1) manure (in a dry matter basis). These P concentrations are much greater than those obtained when manure was extracted using a 1:50 MWRwet without EDTA, which were 7.7, 6.4, 2.7, and 3.7 g kg−1 for swine, chicken, goat, and dairy, respectively (Figure 3). This result suggests that EDTA did dissolve a much greater amount of the mineral P phases in these manures as expected. The dry ash method showed that total P in swine, chicken, goat, and dairy manure was 31.4, 23.9, 13.1, and 8.0 g kg−1, which is fairly similar to the greatest P concentrations measured with ICP-OES in EDTA extracts. The small discrepancies in the values from the EDTA extractions compared with dry ash P are attributed to instrumental and experimental errors.
Chemical modeling of EDTA solution showed that addition of EDTA at 1 mmol L−1 dropped the free Ca and Mg activities to below 0.25 and 0.43 µM, respectively, in all manures. Increasing EDTA concentrations to 5 mmol L−1 reduced free Ca and Mg activities to below 0.02 and 0.26 mmol L−1, respectively, in all manures; and at the 10 mmol L−1 EDTA, the free activity for Ca and Mg in all manure solutions were below 0.0005 µM for both cations. Free Fe activity was below 0.0001 µmol L−1 at all EDTA concentrations, and therefore was less likely to be controlling any mineral phases. Consequently, the several Ca and Mg minerals that appeared to control P solubility in the water extracts are undersaturated once the EDTA concentration reached 5 mmol L−1 (Figure 7), apparently a concentration sufficient to chelate the majority of the Ca and Mg associated with the P minerals. The stoichiometry of the P minerals dissolved by EDTA from goat, swine, and poultry manure does not differ much from 1:1 with respect to Ca and Mg (Figure 8), consistent with previous inferences from solubility in water that struvite (Mg:P = 1:1), brushite, or monetite (for both Ca:P = 1:1) were present. The exception, dairy manure, is particularly interesting in Figure 8 because it seems that no Ca or Mg was dissolved by adding EDTA, and very little additional P was released either; this is in agreement with observations from the water extracts at MWRs of 1:50 and 1:100, where soluble P was undergoing simple dilution, consistent with all mineral phases having already dissolved in water at that dilution.

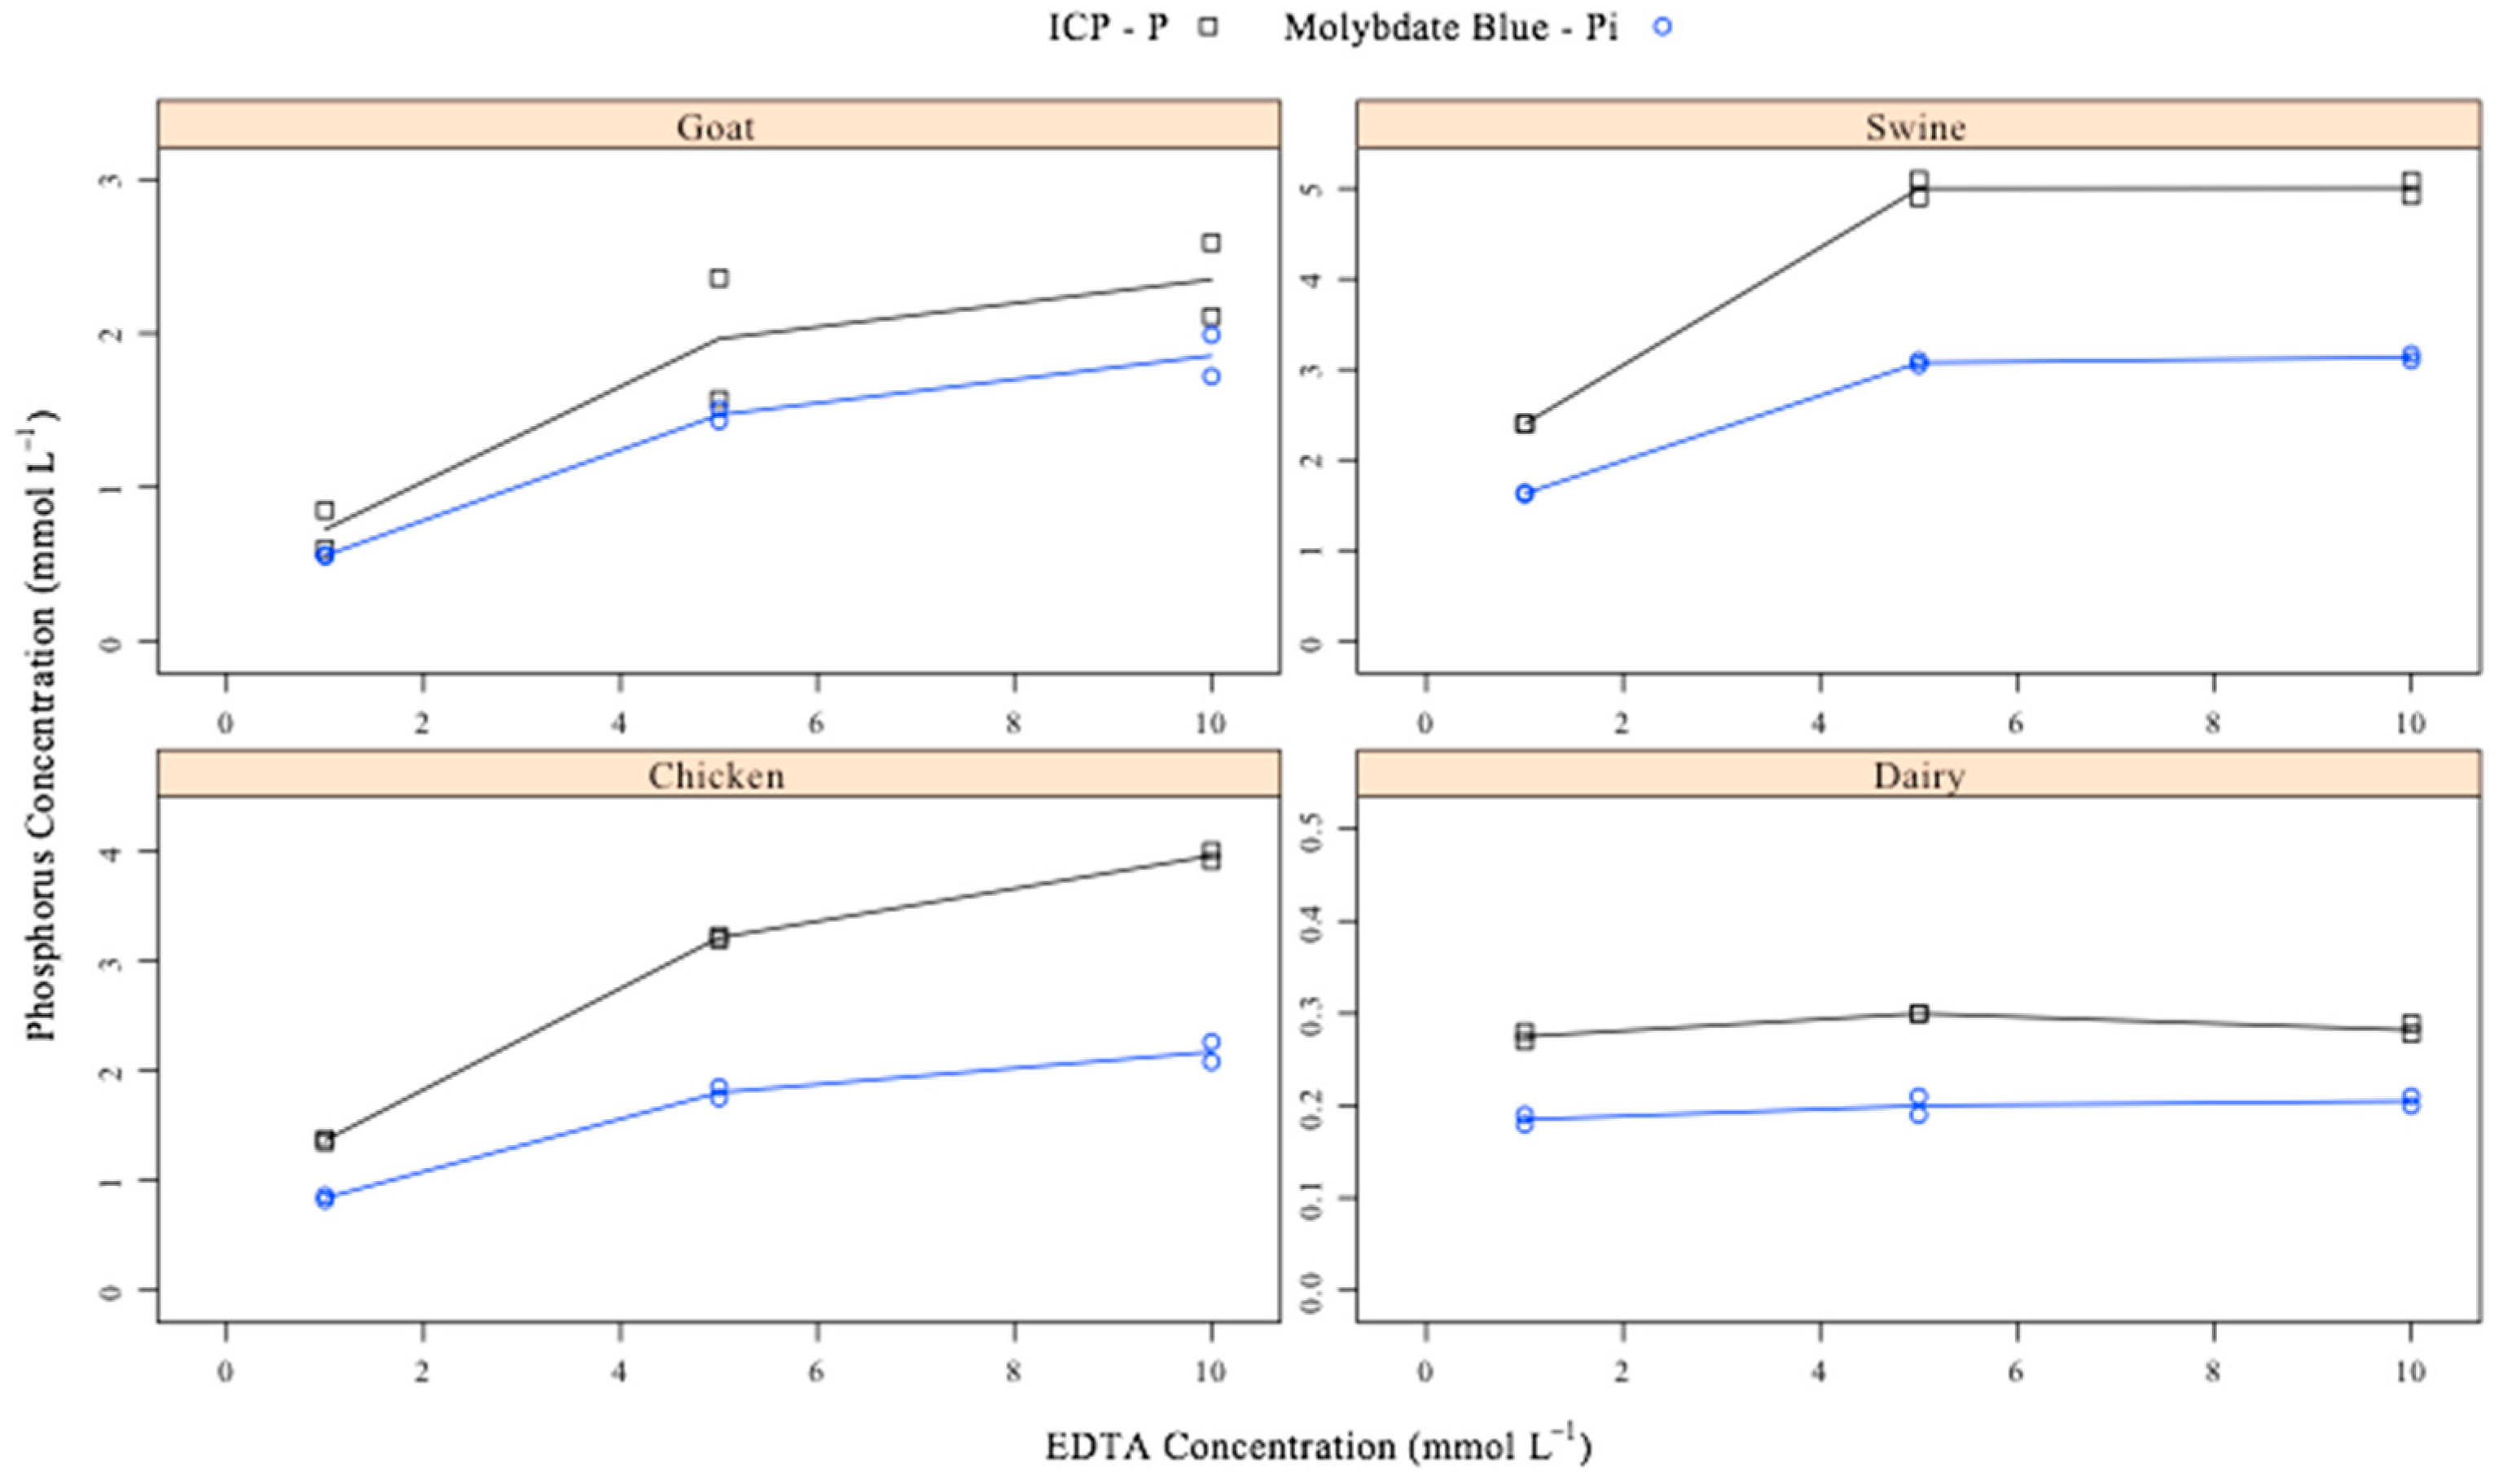
3.6. Effects of Using ICP-P or Molybdate Blue-P on SI

The addition of any extractant to animal manure will dissolve both inorganic and organic components. For example, there is prior research that quantified the amounts of inorganic and organic manure P extracted using water, NaHCO3, NaOH, HCl, glycine-HCl, TRIS-HCl, and Na acetate from different animal species [1,2,3,4,5,11,12,13,15,36,37,38]. However, there were no studies that reported how the P in solution measured with ICP-OES compared with the molybdate blue method, a measure of reactive orthophosphate, most likely strictly inorganic in nature, can affect chemical modeling. During most chemical modeling studies, it is assumed that the concentration being used is of inorganic origin. It is probable that using data from ICP-OES analysis, which measures both soluble organic and inorganic P in a sample, will introduce greater P concentration than would be desired for modeling. Therefore, the SI output might lead to erroneous interpretations of the probable solid phases controlling P solubility in manure. The data collected for the EDTA study was analyzed for both ICP-OES and molybdate blue method, which most likely only determines the inorganic P in a sample [17]. The reason for only using the data from the EDTA study in the ICP-OES and molybdate blue method was that EDTA solutions should have the greatest concentrations of both inorganic and organic P than water extracts at equivalent MWRwet [39,40]. If the results from these solutions confirmed that it is extremely important to know the exact amount of inorganic P, then inorganic P would have been measured in all samples used in the water solubility study.
The P concentrations measured with the molybdate blue method showed that the P concentrations with this method were lower than the ICP-OES concentrations and were on average 77, 64, 57, and 74% the value of ICP-OES; percentages which were constant at all EDTA concentrations for goat, swine, chicken, and dairy manures, respectively (Figure 9). This result indicates that organic P was 23, 36, 43, and 26% of the total P extracted in EDTA solutions for goat, swine, chicken, and dairy manures, respectively. Nascimento et al. [38] also reported that P concentration measured with ICP-OES is greater than those measured with the molybdate blue method. In addition, the constant ratio of inorganic to organic P dissolving with increasing EDTA concentrations indicates that organic P and inorganic P are both associated with the metals being complexed by EDTA. It is believed that the EDTA kept the concentration of Ca and Mg low in solution, thereby favoring the dissolution of not only inorganic but also organic P compounds. Phytate-like P has been reported to form strong complexes with Ca in animal manure and also to dissolve at increasing rates as a function of increasing EDTA concentration in solution [39].
It was observed that using P concentrations directly from ICP-OES analysis led to the calculation of slightly greater numeric ionic activity product (IAP) than using P concentrations from the molybdate blue method (Figure 7). However, analysis of variance showed that the numerical differences were not significantly different at the 5% probability level. Furthermore, the results reported in these two studies showed the same mineral solid phases controlling P solubility, as reported by the literature. Therefore, we conclude that using ICP-OES values for P in chemical modeling should not result in significant deviations from results that would be reported if the molybdate blue method was used, which corroborates the study of Nascimento et al. [38].

4. Conclusions

The results from this study confirmed what has been reported in the literature, where P solubility in animal manure in most cases is controlled by different solid phases based on the water content of the manure. For the manure samples studied in this research, it was observed that struvite and a series of Ca-phosphate minerals seem to control P solubility in manure–water extracts over a wide range of dilutions. Further consideration should be given to yet higher dilutions of the manure in water and finding a method to bootstrap the chemical speciation calculations to determine not only the presence but how much of each of the controlling mineral phase is in each sample. Using more manures would allow for brother assumptions of how the mineral solid phase controls phosphate solubility in animal manure.
The addition of 5 mmol L−1 EDTA at pH 7.0 was able to recover all P from the goat, swine, and chicken manures used in this study. This method could be used to estimate the total amount of inorganic P in animal manures in one single extraction. The use of P ionic concentration from ICP-OES analysis of EDTA extracted samples did not result in significant different SI calculations than one would expect by using the molybdate blue method. Therefore, one could use the results provided by the ICP-OES analysis directly to model which solid phases are more likely to be present in manure samples.
Further research should focus on relating the probable mineral phases controlling P solubility in animal manure with P in runoff from manured fields and also the effect of each probable P mineral on the increase in soil test phosphorus. This could help in risk assessments where certain manures with certain highly soluble solid phases should or should not be applied. In addition, further research could also focus on determining which organic P forms are extracted in EDTA solutions and their availability to microbial life, perhaps through enzymatic hydrolysis.

Author Contributions

Conceptualization, P.H.P.; methodology, P.H.P.; formal analysis, P.H.P.; investigation, P.H.P.; writing—original draft preparation, P.H.P. and F.S.G.; writing—review and editing, P.H.P. and F.S.G.; visualization, P.H.P.; All authors have read and agreed to the published version of the manuscript.

Funding

This research received no external funding.

Data Availability Statement

The data published in this manuscript can be made available upon request.

Conflicts of Interest

The authors declare no conflicts of interest.

References

  1. Pagliari, P.H.; Laboski, C.A.M. Investigation of the inorganic and organic phosphorus forms in animal manure. J. Environ. Qual. 2012, 41, 901–910. [Google Scholar] [CrossRef] [PubMed]
  2. Pagliari, P.; Laboski, C.A.M. Dairy manure treatment effects on manure phosphorus fractionation and changes in soil test phosphorus. Biol. Fertil. Soils 2013, 49, 987–999. [Google Scholar] [CrossRef]
  3. Pagliari, P.; Laboski, C.A.M. Effects of Manure Inorganic and Enzymatically Hydrolyzable Phosphorus on Soil Test Phosphorus. Soil. Sci. Soc. Am. J. 2014, 78, 1301–1309. [Google Scholar] [CrossRef]
  4. Waldrip, H.M.; Pagliari, P.H.; He, Z.; Harmel, R.D.; Cole, N.A.; Zhang, M. Legacy phosphorus in calcareous soils: Effects of long-term poultry litter application. Soil Sci. Soc. Am. J. 2015, 79, 1601–1614. [Google Scholar] [CrossRef]
  5. Pagliari, P.H. Variety and solubility of phosphorus forms in animal manure and their effects on soil test phosphorus. In Applied Manure and Nutrient Chemistry for Sustainable Agriculture and Environment; He, Z., Zhang, H., Eds.; Springer: Dordrecht, The Netherlands, 2014; pp. 141–161. [Google Scholar]
  6. Fordham, A.W.; Schwertmann, U. Composition and reactions of liquid manure (Gülle), with particular reference to phosphate: II. Solid phase components 1. J. Environ. Qual. 1977, 6, 136–140. [Google Scholar] [CrossRef]
  7. Bril, J.; Salomons, W. Chemical composition of animal manure: A modelling approach. Neth. J. Agric. Sci. 1990, 38, 333–349. [Google Scholar] [CrossRef]
  8. Leinweber, P.; Haumaier, L.; Zech, W. Sequential extractions and 31P-NMR spectroscopy of phosphorus forms in animal manures, whole soils and particle-size separates from a densely populated livestock area in northwest Germany. Biol. Fertil. Soils 1997, 25, 89–94. [Google Scholar] [CrossRef]
  9. Cooperband, L.R.; Good, L.W. Biogenic phosphate minerals in manure: Implications for phosphorus loss to surface waters. Environ. Sci. Technol. 2002, 36, 5075–5082. [Google Scholar] [CrossRef]
  10. Güngör, K.; Karthikeyan, K.G. Probable phosphorus solid phases and their stability in anaerobically digested dairy manure. Trans. ASAE 2005, 48, 1509–1520. [Google Scholar] [CrossRef]
  11. Toor, G.S.; Peak, J.D.; Sims, J.T. Phosphorus speciation in broiler litter and turkey manure produced from modified diets. J. Environ. Qual. 2005, 34, 687–697. [Google Scholar] [CrossRef]
  12. Ajiboye, B.; Akinremi, O.O.; Hu, Y.; Flaten, D.N. Phosphorus speciation of sequential extracts of organic amendments using nuclear magnetic resonance and X-ray absorption near-edge structure spectroscopies. J. Environ. Qual. 2007, 36, 1563–1576. [Google Scholar] [CrossRef] [PubMed]
  13. He, Z.; Senwo, Z.S.; Mankolo, R.N.; Honeycutt, C.W. Phosphorus fractions in poultry litter characterized by sequential fraction coupled with phosphate hydrolysis. J. Food Agric. Environ. 2006, 4, 304–312. [Google Scholar]
  14. Güngör, K.; Jürgensen, A.; Karthikeyan, K.G. Determination of phosphorus speciation in dairy manure using XRD and XANES spectroscopy. J. Environ. Qual. 2007, 36, 1856–1863. [Google Scholar] [CrossRef]
  15. McDowell, R.W.; Stewart, I. Phosphorus in fresh and dry dung of grazing dairy cattle, deer, and sheep: Sequential fraction and phosphorus-31 nuclear magnetic resonance analyses. J. Environ. Qual. 2005, 34, 598–607. [Google Scholar] [CrossRef]
  16. Peters, J.B.; Combs, S.; Hoskins, B.; Jarman, J.; Kovar, J.; Watson, M.; Wolf, A.; Wolf, N. Recommended Methods of Manure Analysis; UWEX Pub. no. A3769; University of Wisconsin-Extension: Madison, WI, USA, 2003. [Google Scholar]
  17. He, Z.; Honeycutt, C.W. A modified molybdenum blue method for orthophosphate determination suitable for investigating enzymatic hydrolysis of organic phosphates. Commun. Soil Sci. Plant Anal. 2005, 36, 1373–1383. [Google Scholar] [CrossRef]
  18. Buchanan, J.R.; Mote, C.R.; Robinson, R.B. Struvite control by chemical treatment. Trans. ASAE 1994, 37, 1301–1308. [Google Scholar] [CrossRef]
  19. Miles, A.; Ellis, T.G. Struvite precipitation potential for nutrient recovery from anaerobically treated wastes. Water Sci. Technol. 2001, 43, 259–266. [Google Scholar] [CrossRef]
  20. Çelen, I.; Buchanan, J.R.; Burns, R.T.; Robinson, R.B.; Raman, D.R. Using a chemical equilibrium model to predict amendments required to precipitate phosphorus as struvite in liquid swine manure. Water Res. 2007, 41, 1689–1696. [Google Scholar] [CrossRef] [PubMed]
  21. Buchanan, J.R.; Mote, C.R.; Robinson, R.B. Thermodynamics of struvite formation. Trans. ASAE 1994, 37, 617–621. [Google Scholar] [CrossRef]
  22. Snoeyink, V.L.; Jenkins, J. Water Chemistry; John Wiley and Sons: New York, NY, USA, 1980. [Google Scholar]
  23. Meyer, J.L.; Eanes, E.D. A thermodynamic analysis of the amorphous to crystalline calcium phosphate transformation. Calcif. Tissue Int. 1978, 25, 59–68. [Google Scholar] [CrossRef]
  24. Meyer, J.L.; Eanes, E.D. A thermodynamic analysis of the secondary transition in the spontaneous precipitation of calcium phosphate. Calcif. Tissue Int. 1978, 25, 209–216. [Google Scholar] [CrossRef] [PubMed]
  25. SAS Institute. SAS 9.4; SAS Institute: Cary, NC, USA, 2025. [Google Scholar]
  26. Liu, J.; Spargo, J.T.; Kleinman, P.J.; Meinen, R.; Moore, P.A., Jr.; Beegle, D.B. Water-extractable phosphorus in animal manure and manure compost: Quantities, characteristics, and temporal changes. J. Environ. Qual. 2018, 47, 471–479. [Google Scholar] [CrossRef] [PubMed]
  27. Wang, Y.; Zhang, T.; Akinremi, O.O.; Bittman, S.; Brown, C.; Hao, X.; Hunt, D.; Li, S.; Tan, C.S.; Ziadi, N. Phosphorus characteristics of Canada-wide animal manures and implications for sustainable manure management with a cleaner environment. Sci. Total Environ. 2022, 845, 157200. [Google Scholar] [CrossRef] [PubMed]
  28. Wagner, E.; Karthikeyan, K.G. Precipitating phosphorus as struvite from anaerobically-digested dairy manure. J. Clean. Prod. 2022, 339, 130675. [Google Scholar] [CrossRef]
  29. Babic-Ivancic, V.; Kontrec, J.; Kralj, D.; Brecevic, L. Precipitation diagrams of struvite and dissolution kinetics of different struvite morphologies. Croat. Chem. Acta 2002, 75, 89–106. [Google Scholar]
  30. Doyle, J.D.; Oldring, K.; Churchley, J.; Price, C.; Parsons, S.A. Chemical control of struvite precipitation. J. Envir. Engrg. 2003, 129, 419–426. [Google Scholar] [CrossRef]
  31. Taylor, A.W.; Frazier, A.W.; Gurney, E.L.; Smith, J.P. Solubility products of di- and trimagnesium phosphates and the dissociation of magnesium phosphate solutions. Trans. Faraday Soc. 1963, 59, 1580–1584. [Google Scholar] [CrossRef]
  32. Studnicka, J.S.; Bundy, L.G.; Andraski, T.W.; Good, L.W.; Powell, J.M. Measuring water-extractable phosphorus in manures to predict phosphorus concentrations in runoff. Commun. Soil Sci. Plant Anal. 2011, 42, 1071–1084. [Google Scholar] [CrossRef]
  33. Pizzeghello, D.; Berti, A.; Nardi, S.; Morari, F. Phosphorus forms and P-sorption properties in three alkaline soils after long-term mineral and manure applications in north-eastern Italy. Agric. Ecosyst. Environ. 2011, 141, 58–66. [Google Scholar] [CrossRef]
  34. Bundy, L.G.; Studnicka, J.S.; Powell, J.M. Manure Handling and Extraction Procedure Effects on Determination of Water-Extractable Phosphorus in Manures; 2004 Agronomy Abstracts; ASA: Madison, WI, USA, 2004. [Google Scholar]
  35. Güngör, K.; Karthikeyan, K.G. Phosphorus forms and extractability in dairy manure: A case study for Wisconsin on-farm anaerobic digesters. Bioresour. Technol. 2008, 99, 425–436. [Google Scholar] [CrossRef]
  36. He, Z.; Honeycutt, C.W.; Griffin, T.S. Enzymatic hydrolysis of organic phosphorus in extracts and resuspensions of swine manure and cattle manure. Biol. Fertil. Soils 2003, 38, 78–83. [Google Scholar] [CrossRef]
  37. Maguire, R.O.; Sims, J.T.; Saylor, W.W.; Turner, B.L.; Angel, R.; Applegate, T.J. Influence of phytase addition to poultry diets on phosphorus forms and solubility in litters and amended soils. J. Environ. Qual. 2004, 33, 2306–2316. [Google Scholar] [CrossRef]
  38. Do Nascimento, C.A.; Pagliari, P.H.; Schmitt, D.; He, Z.; Waldrip, H. Phosphorus concentrations in sequentially fractionated soil samples as affected by digestion methods. Sci. Rep. 2015, 5, 17967. [Google Scholar] [CrossRef] [PubMed]
  39. Boerth, T.J. Enzymatic Hydrolysis of Organic Phosphorus in Soils and Dairy Feces. Ph.D. Thesis, The University of Wisconsin-Madison, Madison, WI, USA, 2003. [Google Scholar]
  40. He, Z.; Waldrip, H.; Honeycutt, C.W.; Erich, M.S.; Senwo, Z. Enzymatic quantification of phytate in animal manure. Commun. Soil Sci. Plant Anal. 2009, 40, 566–575. [Google Scholar] [CrossRef]
Figure 1. Animal manure solution pH after manure from goat, swine, chicken, and dairy had equilibrated with water for 2 h. pH followed by different low cases letters are significantly different (p < 0.05).
Agronomy 15 01497 g001
Figure 2. Animal manure solution ionic strength after manure from goat, swine, chicken, and dairy had equilibrated with water for 2 h. Different graphs have their own scale so that the patterns can be observed for all manures.
Agronomy 15 01497 g002
Figure 3. Total phosphorus dissolved from manure as a function of water added.
Agronomy 15 01497 g003
Figure 4. Ionic concentration of swine, chicken, goat, and dairy manure solutions after equilibrating with water for 2 h. Ammonium concentration in samples from chicken was divided by 3 to keep the patterns visible for Ca, Mg, and Na. Different graphs have their own scale so that the patterns can be observed for all manures.
Agronomy 15 01497 g004
Figure 5. Phosphorus concentration in solution of swine, chicken, goat, and dairy manure after equilibrium with water for 2 h. Different graphs have their own scale so that the patterns can be observed for all manures.
Agronomy 15 01497 g005
Figure 6. Saturation index of probable mineral solid phases controlling P solubility in swine, chicken, goat, and dairy manure. Saturation indexes were calculated using Visual Minteq. Different graphs have their own scale so that the patterns can be observed for all manures. Dashed line represents the saturation index of 1.
Agronomy 15 01497 g006
Figure 7. Effects of EDTA on the saturation index of probable solid phases controlling P solubility in animal manure using ICP-OES measured P (Total P) and molybdate blue P (inorganic P). Water to manure ratio used was 50:1. Dashed line represents the saturation index of 1.
Agronomy 15 01497 g007
Figure 8. Calcium (Ca) and magnesium (Mg) stoichiometry relationship. Dashed line represents the 1:1 relationship.
Agronomy 15 01497 g008
Figure 9. Total phosphorus determined by ICP-OES (P) and inorganic P determined by the molybdate blue method (Pi) in solution as a function of EDTA concentration (mmol L−1). Manure to water ratio was 1:50.
Agronomy 15 01497 g009
Table 1. Manure dry matter (DM), total nitrogen (N), total phosphorus (P), total Ca, total Mg, and total potassium (K) of manures used in the study, determined according to Peters et al. [16].
ManureDMNPCaMgK
g kg−1
Goat29736.013.121.57.532.7
Dairy7331.08.026.96.762.4
Swine22937.031.439.57.617.7
Chicken23241.023.928.33.128.8
Disclaimer/Publisher’s Note: The statements, opinions and data contained in all publications are solely those of the individual author(s) and contributor(s) and not of MDPI and/or the editor(s). MDPI and/or the editor(s) disclaim responsibility for any injury to people or property resulting from any ideas, methods, instructions or products referred to in the content.

