Article

Alternating Wetting and Moderate Drying Irrigation Promotes Phosphorus Uptake and Transport in Rice

1
Jiangsu Key Laboratory of Crop Genetics and Physiology/Jiangsu Key Laboratory of Crop Cultivation and Physiology/Agricultural College, Yangzhou University, Yangzhou 225009, China
2
Jiangsu Co-Innovation Center for Modern Production Technology of Grain Crops, Yangzhou University, Yangzhou 225009, China
*
Authors to whom correspondence should be addressed.
These authors contributed equally to this work.
Agronomy 2025, 15(6), 1488; https://doi.org/10.3390/agronomy15061488
Submission received: 12 May 2025 / Revised: 14 June 2025 / Accepted: 16 June 2025 / Published: 19 June 2025

Abstract

:
Despite the essential role of phosphorus (P) in rice growth, P-use efficiency (PUE) remains low due to limited bioavailable P in soils and an over-reliance on chemical fertilizers, leading to resource waste and environmental risks, such as eutrophication. This study investigates whether and how alternating wetting and moderate drying (AWMD) irrigation promotes P absorption and transport in rice. This study was conducted over two years using a pot experiment. Conventional flooding (CF) irrigation was applied throughout the growing season, while AWMD irrigation was imposed from two weeks after transplanting to one week before harvest. AWMD improved shoot biomass by 8.7–9.4% and the photosynthetic rate by 12–15%, significantly enhanced PUE, and optimized root traits and enzyme activities related to P uptake. It also promoted leaf acid phosphatase and ribonuclease activities, facilitating P remobilization to grains. In conclusion, AWMD enhanced the ability of roots to absorb P and optimized the redistribution of P between vegetative organs and grains, synergistically increasing grain yield and PUE in rice.

1. Introduction

Rice (Oryza sativa L.) serves as a staple crop for humans worldwide and holds significant social and economic value [1]. Phosphorus (P) serves as a vital nutrient that constitutes essential molecules such as DNA, RNA, and ATP and underpins key physiological processes in plants, ranging from root development and photosynthesis to energy metabolism and protein synthesis, particularly in rice [2,3,4,5,6]. Phosphate rock is a non-renewable resource, and many regions worldwide struggle with both shortages and low P-use efficiency (PUE) [7]. Although soils contain ample total P, the available P that is immediately accessible and utilizable by rice is relatively low [8,9]. Therefore, rice often suffers from growth inhibition and yield losses under P deficiency [10]. The excessive application of chemical P fertilizers to compensate for this deficit wastes resources and exacerbates environmental problems, including water eutrophication [11,12,13,14]. Therefore, improving PUE is crucial for sustainable agricultural development. Enhancing the ability of crops to acquire and efficiently use soil-available P is an urgent issue that must be addressed in agricultural production.
Irrigation management practices are crucial for rice production. However, whether irrigation regimes can enhance P uptake and utilization remains unclear, representing a critical scientific question in the field of integrated water and nutrient management. The conventional flooding (CF) irrigation method typically uses large amounts of water, which not only reduces water use efficiency, but may also have a negative impact on rice yield [15,16]. In recent years, alternating wetting and drying, an innovative irrigation method, has gradually been widely applied in rice cultivation [17,18,19,20]. Compared to traditional alternating wetting and drying, alternating wetting and moderate drying (AWMD) maintains a lower level of dryness, offering a gentler and more stable water supply for rice, making it suitable for various rice varieties and soil conditions [21,22]. Previous studies have shown that AWMD not only reduces irrigation water use by 20–25%, but also increases grain yield and improves nitrogen uptake and utilization [23,24,25]. However, its impact on the mechanisms of P uptake and utilization remains to be further elucidated.
P acquisition and utilization by rice constitute a highly intricate biological process involving the coordinated action of multiple enzymes. Acid phosphatase (APase) hydrolyzes organic P compounds, releasing soluble inorganic P [26]. Proton-pump ATPase (H+-ATPase) facilitates the dissolution of insoluble phosphate compounds by secreting protons that acidify the rhizosphere environment [27]. Ribonuclease (RNase) degrades RNA fragments, converting them into P sources that are available for plant uptake [28,29]. However, the interrelationship between these enzymes and P acquisition and utilization in rice remains unclear, particularly under the AWMD regime.
This study verified the hypothesis that the AWMD regime significantly enhances P uptake and internal translocation, thereby increasing grain yield and PUE in rice. Several key parameters, including the biomass of shoots and roots, root physiological morphology, leaf photosynthetic rate, and the activity of key enzymes involved in P uptake and transport in both roots and leaves, were measured to explore the mechanisms underlying the aforementioned processes. The findings of this study will offer valuable theoretical perspectives for enhancing PUE in rice.

2. Materials and Methods

2.1. Experimental Site and Plant Cultivation

A pot trial was carried out at the Yangzhou University experimental farm (32°03′ N, 119°25′ E), with an indica rice variety of YD-6 grown throughout the growing seasons of May–October in both 2023 and 2024. Starting from May 11, YD-6 rice plants were raised and subsequently transplanted on June 10 into pots, and each pot contained 13.5 kg of air-dried soil (sandy loam soil), with a planting density of three hills (two seedlings per hill) per pot. The main physicochemical properties of the soil were as follows: pH, 6.8; total N, 0.94 g kg−1; total P, 0.179 g kg−1; total K, 4.91 g kg−1; organic C, 14.1 g kg−1; alkali-hydrolysable N, 76.1 g kg−1; Olsen-P, 9.8 mg kg−1; and exchangeable K, 56.7 mg kg−1. The soil had a gravimetric water content of 0.176 g/g and a bulk density of 1.29 g/cm3. Urea (CON2H4) was applied with a combined total of 5.6 g per pot, following the fertilizer application ratio of base fertilizer (before transplanting): tillering fertilizer: panicle initiation fertilizer: panicle maintenance fertilizer = 4:2:2:2. Additionally, each pot was supplemented with 1.54 g of KH2PO4 one day prior to transplanting. Strict control of pests, diseases, and weeds was maintained throughout the entire growing season.

2.2. Experimental Design

Two irrigation treatments were applied, in which CF served as the control throughout the entire growing season and AWMD was imposed from two weeks after transplanting until one week before harvest. Irrigation was withheld one week before harvest. Under CF, a 1–2 cm standing water layer was maintained continuously. For AWMD, irrigation was restored to a 1–2 cm depth whenever the soil water potential at 15–20 cm declined to between-10 and -15 kPa. A tensiometer was installed in each pot to monitor the soil water potential, with adjustments made by adding tap water (pH = 6.8; electrical conductivity = 192 μs cm−1) when necessary [30]. The pot experiment was conducted under a framed shelter equipped with a movable plastic film roof that admitted natural light and ambient air circulation while preventing direct rainfall.

2.3. Sampling and Measurements

2.3.1. Leaf Area and Biomass

Plant samples were taken at four key growth stages: middle tillering (MT), panicle initiation (PI), heading (HD), and maturity (MA). Immediately after separation from the stem, the measurement of the leaf area was conducted, as reported by Zhang et al. [31]. At each of the previously mentioned stages, three pots per treatment were sampled. The rice plants were divided into the following three or four parts: roots (washed with distilled water), stems, leaves (leaf blades + leaf sheaths), and panicles (from the heading stage onwards). Following the leaf area measurement, the plant samples from different organs were inactivated by drying in an oven at 105 °C for 30 min. The plant samples were oven-dried at 75 °C for 48 h until a constant dry weight was achieved and were subsequently used to determine the biomass of various organs and P contents.

2.3.2. Phosphorus Accumulation

The dried rice samples were ground and passed through a sieve. An accurately weighed 0.1 g sample was digested using ultrapure HNO3 in a microwave digestion system. An Inductively Coupled Plasma Mass Spectrometer (ICP-MS; Elan DRC-e, SpectraLab Scientific Inc., Amherst, NY, USA) was used to analyze the P accumulation in the plant samples. The following formulas were used to calculate P translocation efficiency (PTE), internal P-use efficiency (IPE), partial P productivity (PPP), and P harvest index (PHI).
P T E   ( % ) = P h P m P m × 100
I P E   ( % ) = G y P t m × 100
P P P   ( k g 1 k g 1 ) = G y P a p p l i e d
P H I   ( % ) = P g P t m × 100
Ph and Pm denote the P content in the stems and leaves at HD and MA stages, respectively (kg pot−1). Gy, Pg, Ptm, and Papplied correspond in turn to the grain yield, grain P accumulation, shoots P at MA, and P fertilizer input.

2.3.3. Leaf Water Potential

At midday on clear days, the leaf water potential was assessed using the uppermost, fully expanded leaf. Under the AWMD regime, observations were made during the soil drying phase (soil water potential ≈ −15 kPa) and the following rewatering period at the MT, PI, and HD stages. Six leaves were measured per treatment.

2.3.4. Leaf Photosynthetic Rate

During clear mornings between 9:00 and 11:00 a.m., leaf photosynthetic rates were evaluated at specified growth stages using a Li-Cor 6800 gas exchange system (LI-COR, Lincoln, NE, USA). Ten fully expanded leaves were sampled per treatment.

2.3.5. Root Oxidation Activity and Root Morphology

Plants from three pots were randomly sampled, and the roots were rinsed to remove soil in order to obtain clean samples. The roots were digitized using the Epson Expression 1680 scanner (Seiko Epson Corp., Tokyo, Japan), and the corresponding morphological traits were analyzed via WinRHIZO (Regent Instruments Inc., Quebec City, QC, Canada). The root oxidation activity (ROA) was determined using the α-naphthylamine (α-NA) method on 1 g of the remaining fresh root samples [32].

2.3.6. Activities of Enzymes Involved in Phosphorus Uptake and Transport

Fresh plant samples were finely ground with a high-throughput tissue homogenizer (MM400, Retsch GmbH, Haan, Germany) for subsequent analysis. A 0.1 g sample was thoroughly mixed with 1 mL of extraction buffer. The mixture was then centrifuged at 10,000× g for 10 min at 4 °C, and the supernatant was collected. The activities of APase and H+-ATPase in the rice roots tissues were measured using kits (Comin Biotechnology Co., Ltd., Suzhou, China). RNase activity in the rice roots and leaves was determined using an RNase activity detection kits (Kamai Shu Biotechnology Co., Ltd., Shanghai, China)

2.4. Final Harvest

At MA, six pots were selected from each treatment to assess the grain yield. The crops were manually harvested and hand-threshed. The grains were then dried to a moisture content of 14% before measuring the grain yield. The yield components included panicles per pot, spikelets per panicle, fully filled grains, and 1000-grain weight. The measurement protocol was rigorously executed according to the procedures reported by Yoshida et al. [33].

2.5. Statistical Analysis

Data normality (Shapiro–Wilk), homogeneity of variances, and independent sample t-tests were performed in SPSS 27.0, with statistical significance set at p < 0.05. The figures were produced using SigmaPlot 10.0 and Origin 2024 software.

3. Results

3.1. Grain Yield and PUE

Compared with CF, AWMD significantly increased the grain yield by 11.1% and 8.7% in the two years, respectively. AWMD significantly increased the grain yield over the two years by synergistically enhancing the number of grains per panicle, the percentage of fully filled grains, and the grain weight (Table 1). In August 2024, the experimental location in Yangzhou encountered extreme heat during the critical reproductive stages of the rice variety YD-6 (Figure 1). Compared with normal years, these high-temperature conditions significantly inhibited spikelet fertilization, resulting in reductions of 42.4–49.3% in the fertilization rate of spikelets, 45.3–52.3% in fully filled grains, and 57.9–60.9% in grain yield (Table 1).
In addition, the AWMD regime not only exhibited higher P uptake, but also showed increased PUE (PTE, IPE, PHI, and PPP) when compared with CF. Over the two years, the AWMD treatment increased PTE by 15.7% and 21.7%, IPE by 4.7% and 4.1%, PHI by 8.7% and 13.5%, and PPP by 11.2% and 19.5%, respectively (Figure 2).

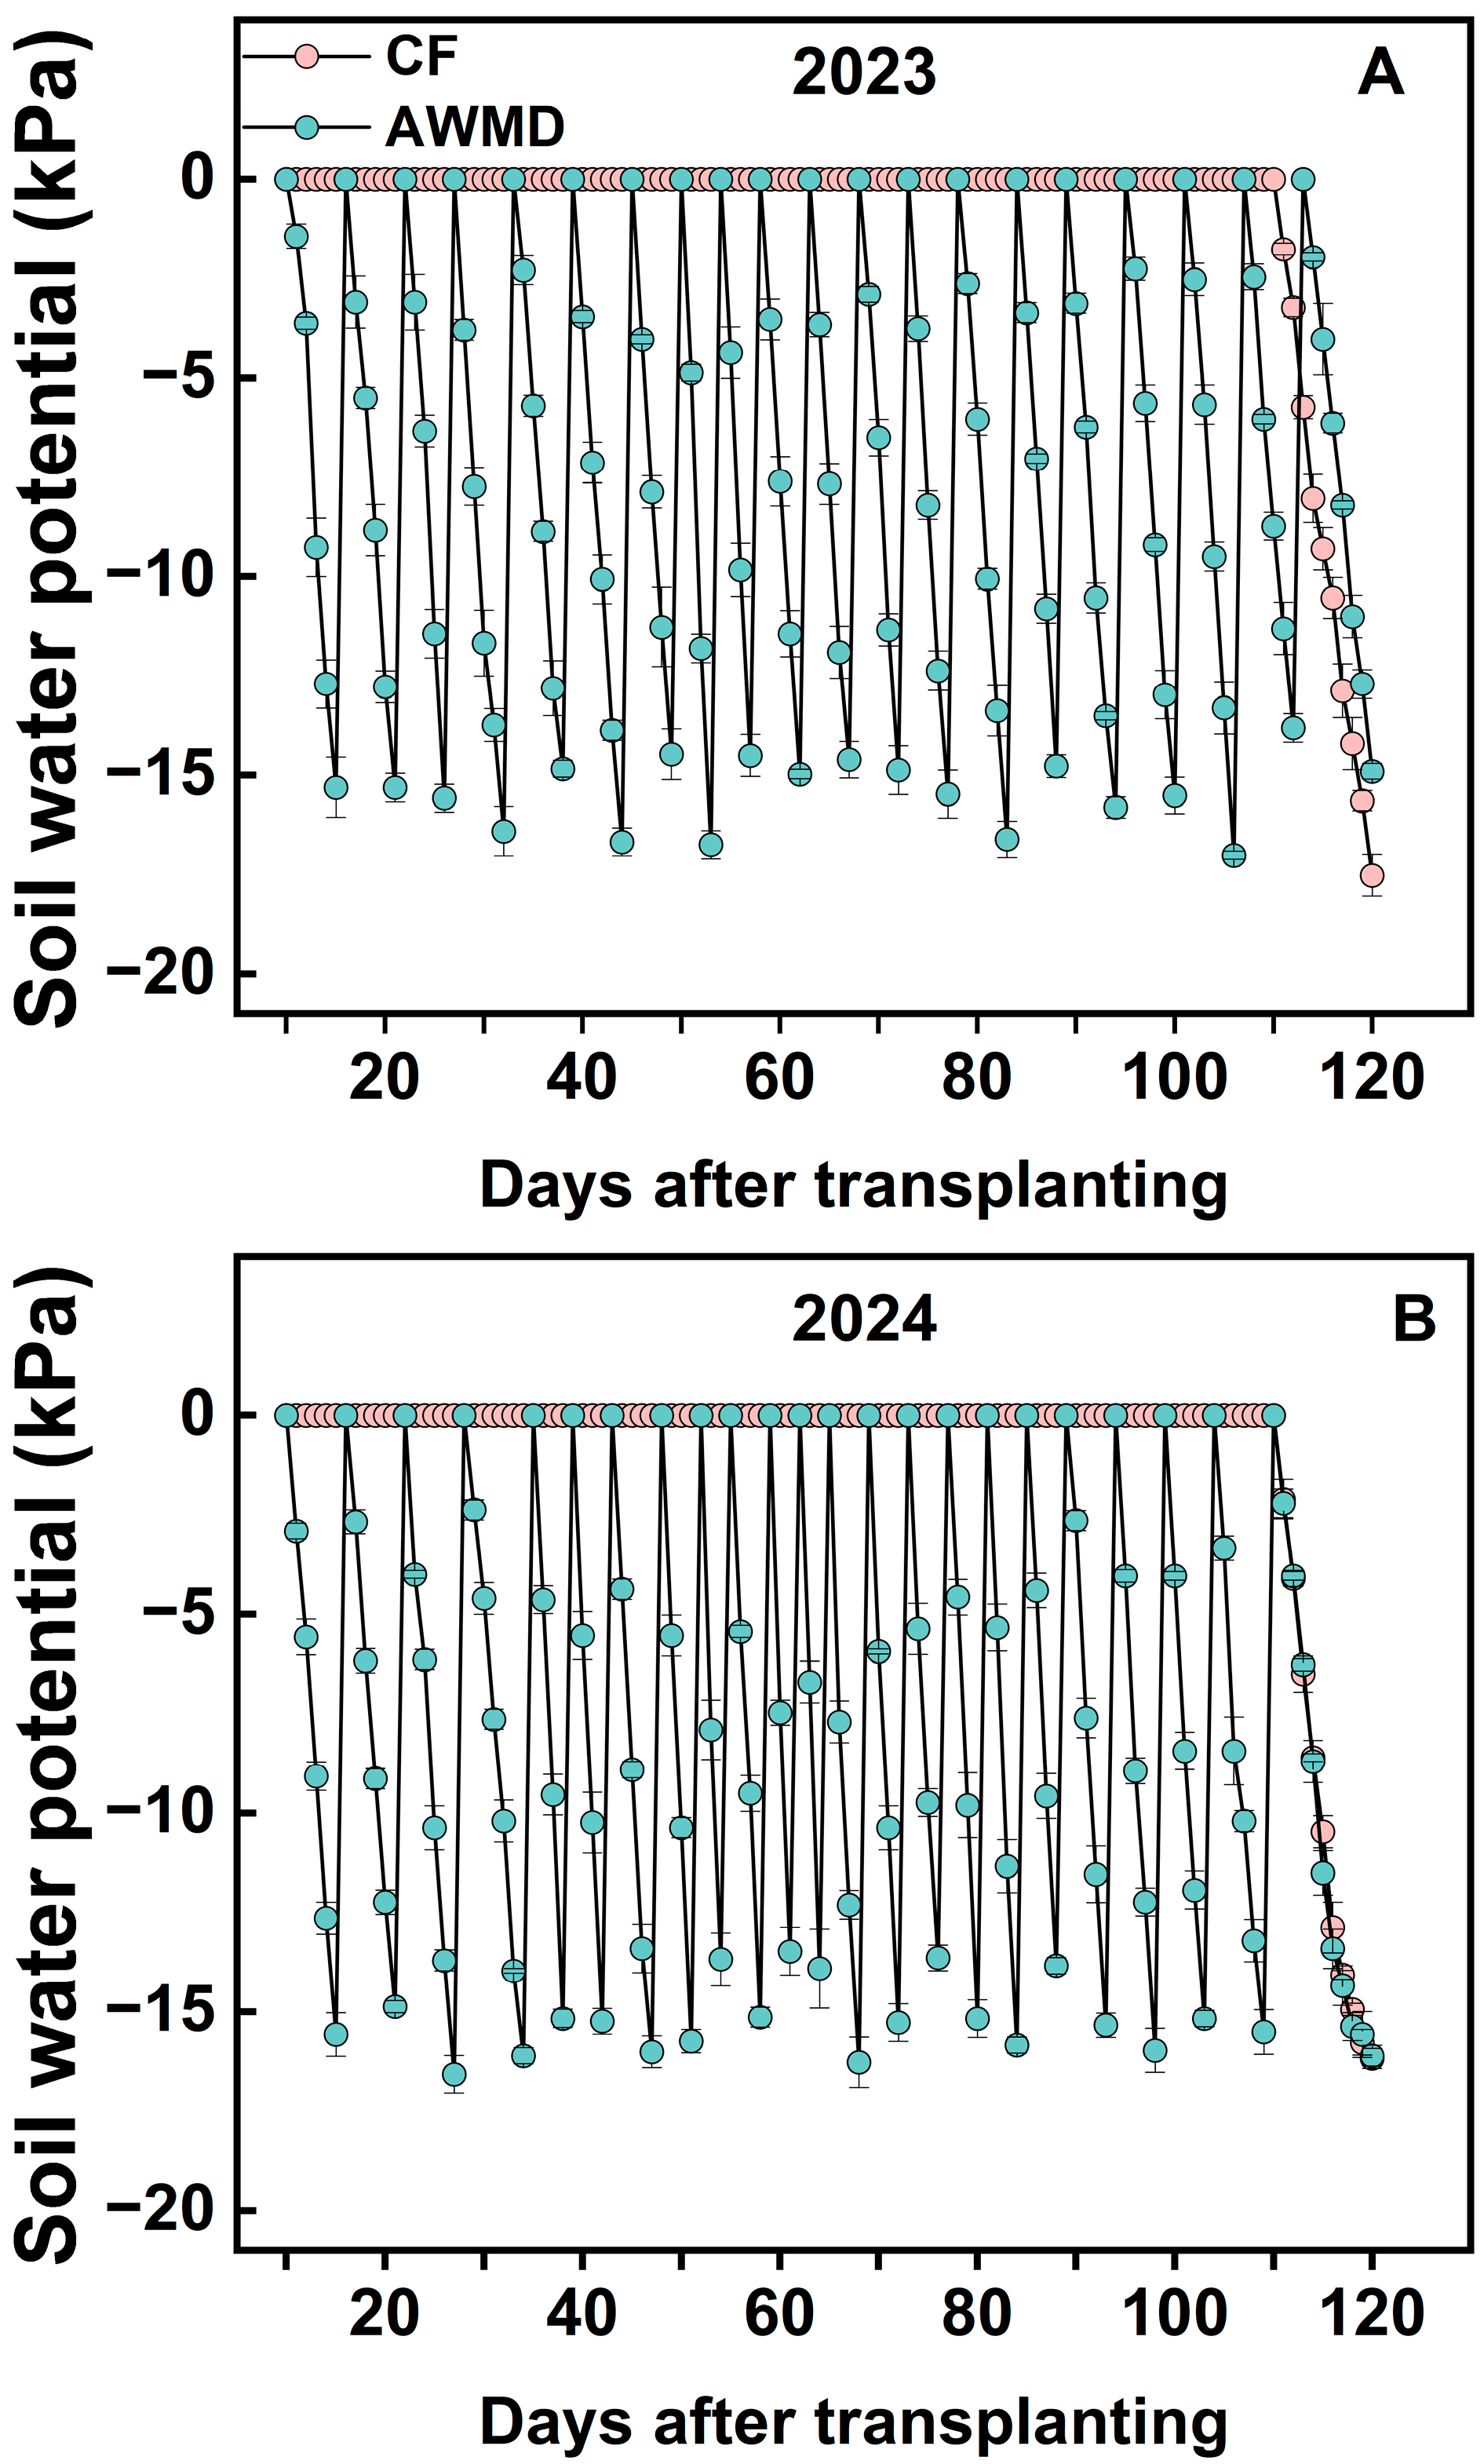
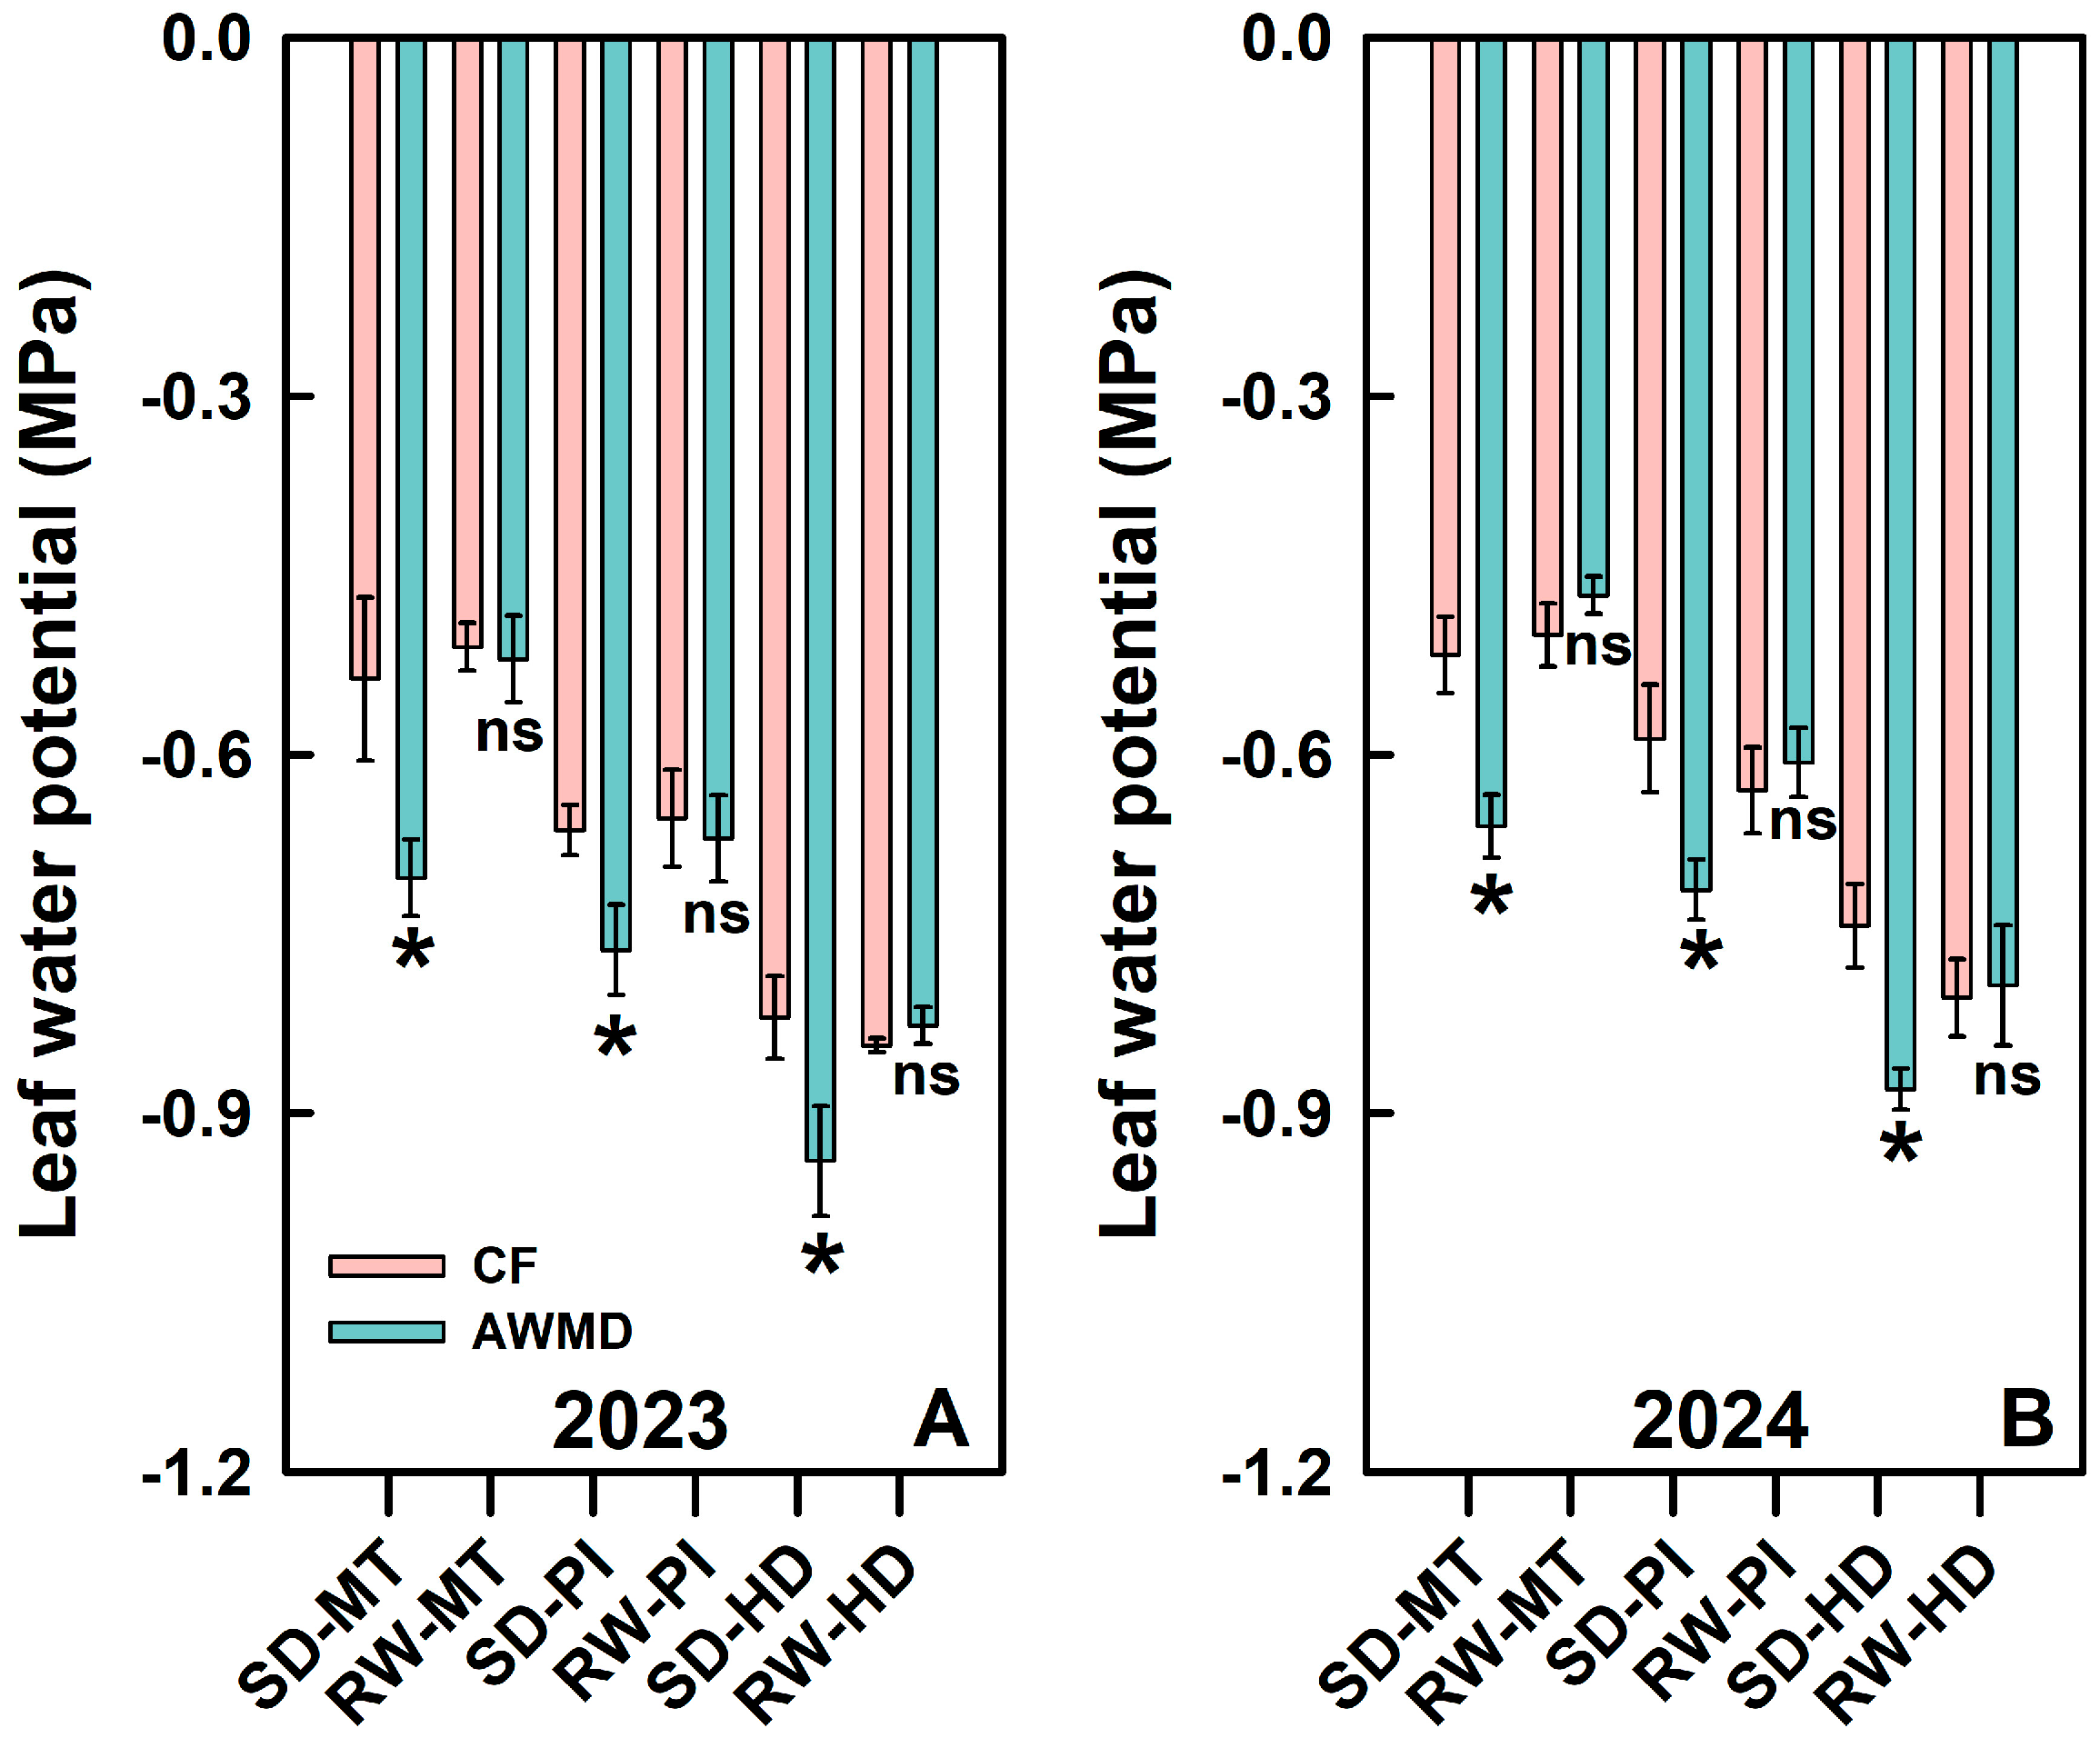
3.2. Soil Water Potential and Leaf Water Potential

During the normal growth process of YD-6, the soil water potential requires 3–6 days to reach −15 kPa. The entire growth period of rice undergoes approximately 20 cycles of the AWMD regime (Figure 3). During the soil drying phase at the MT, PI, and HD stages, the leaf water potential under the AWMD regime decreased significantly, however, after rewatering, it recovered to a level comparable to that observed under the CF regime (Figure 4).

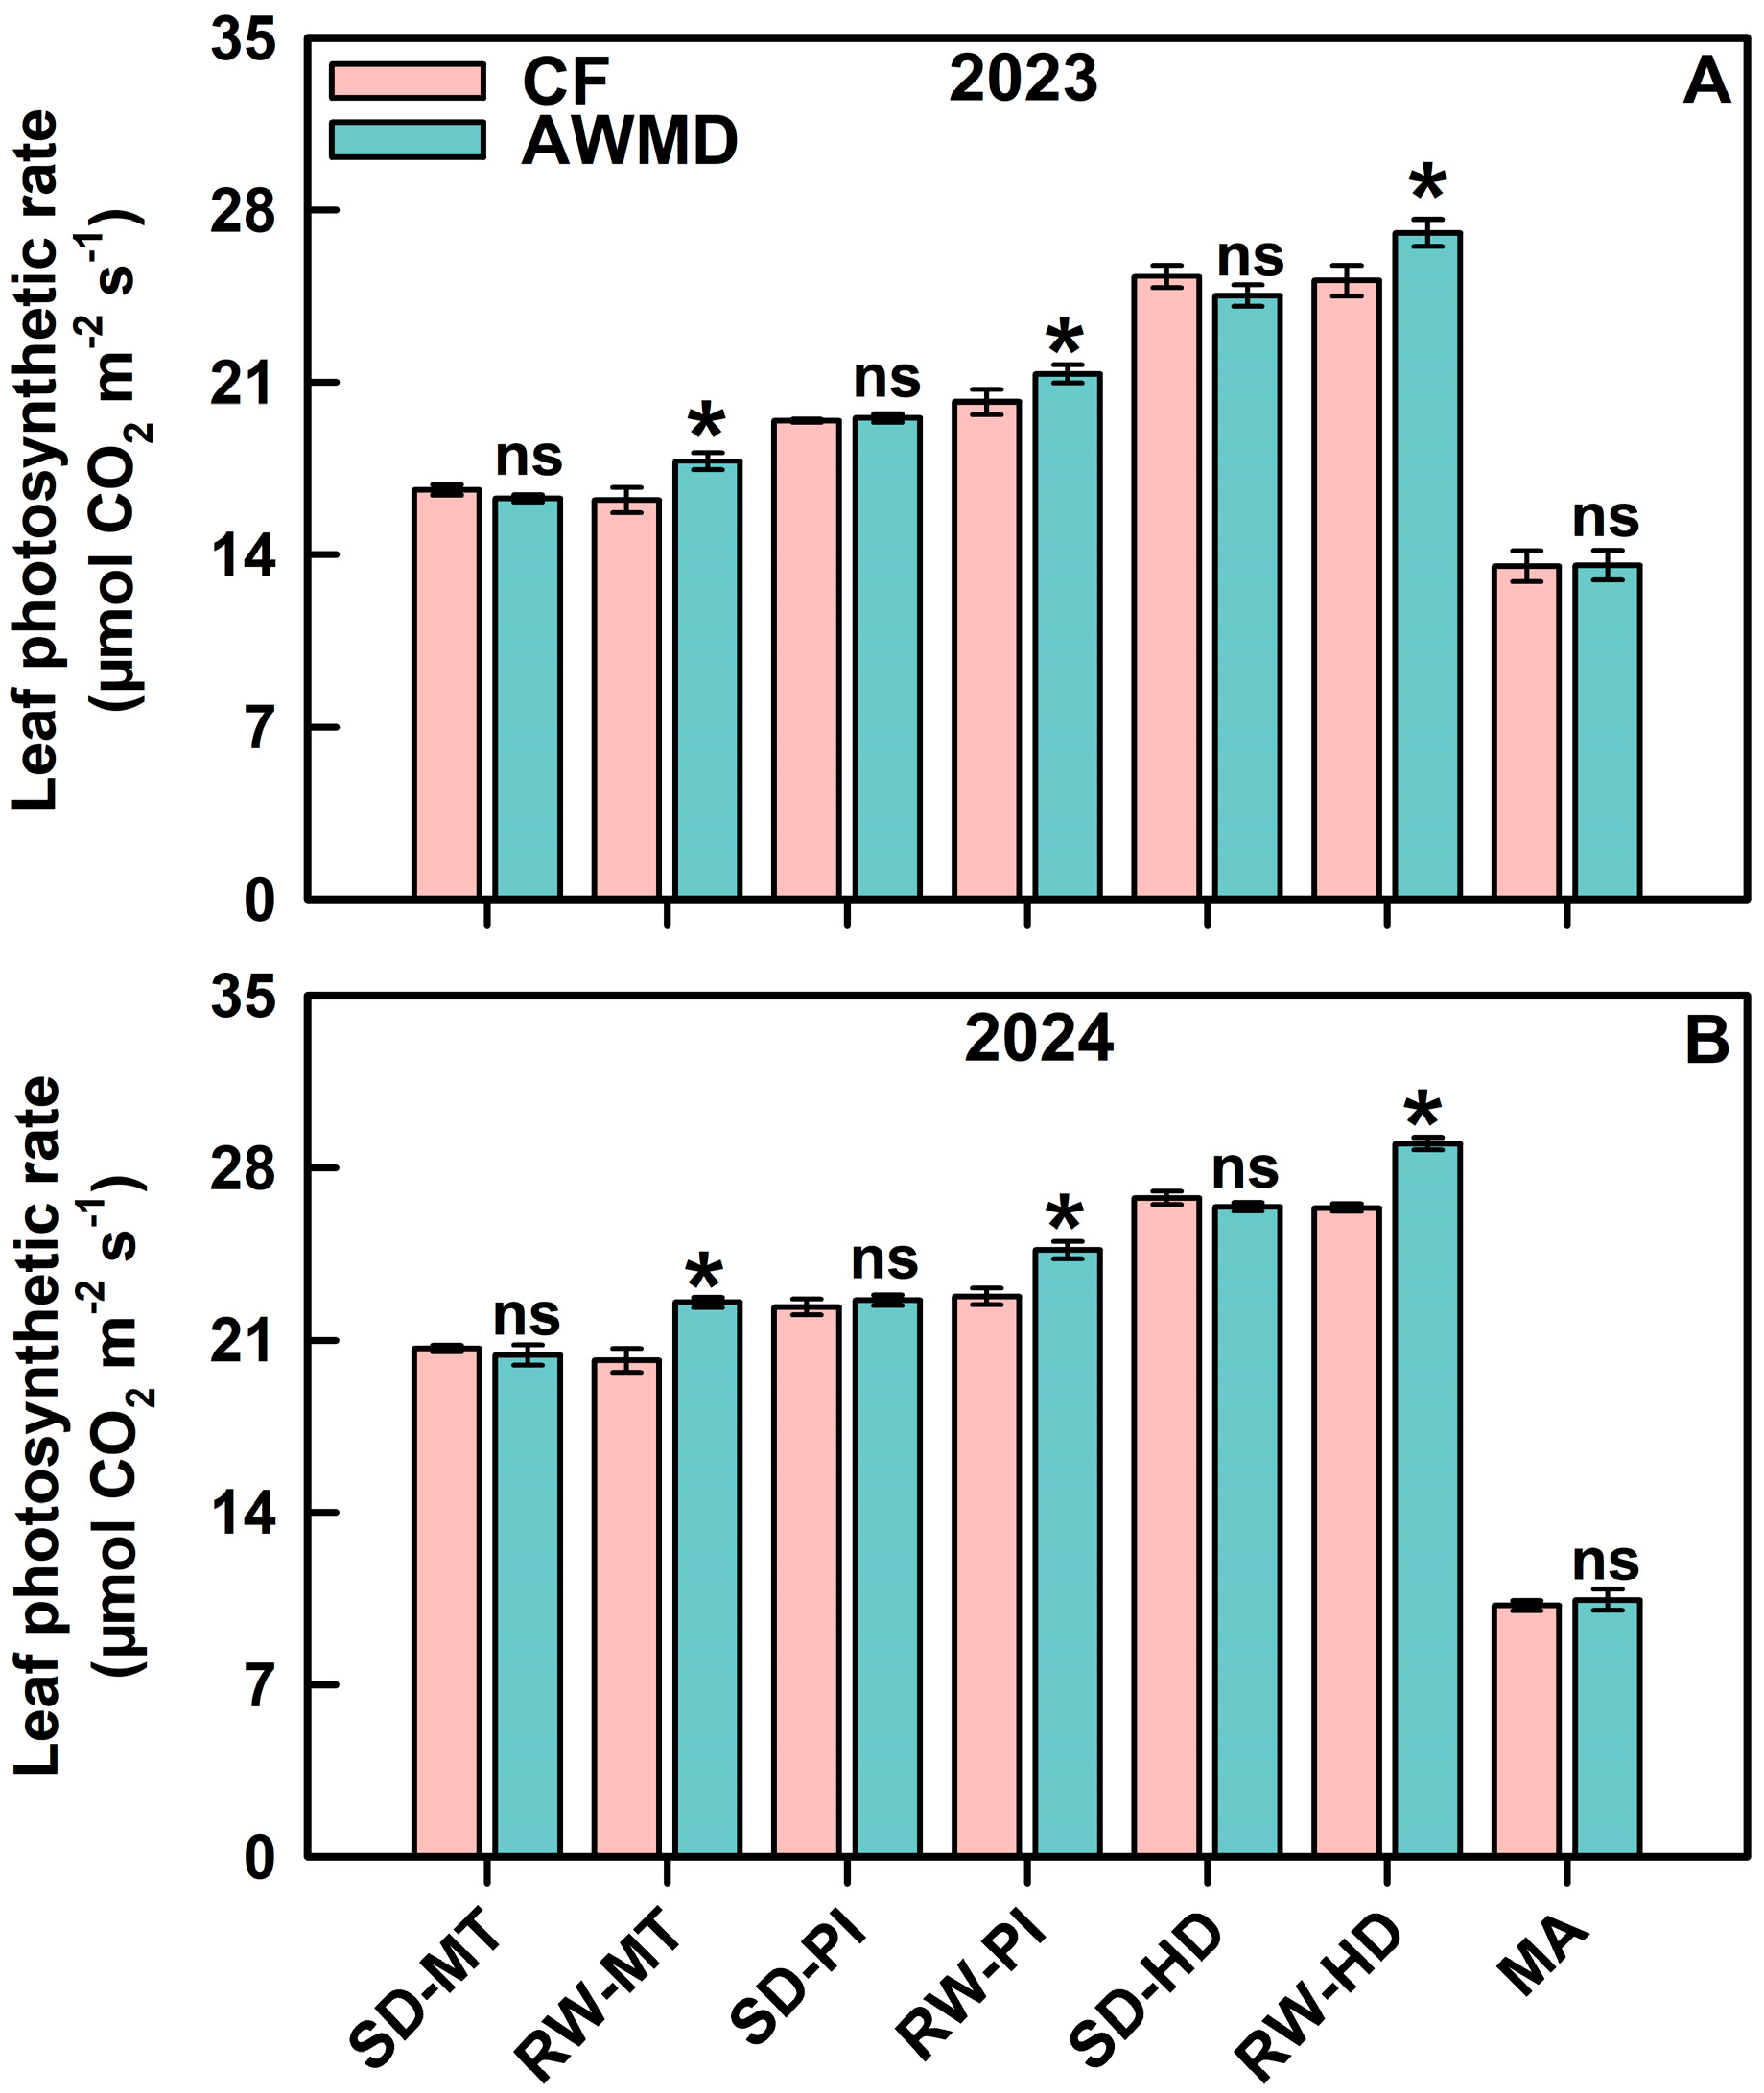
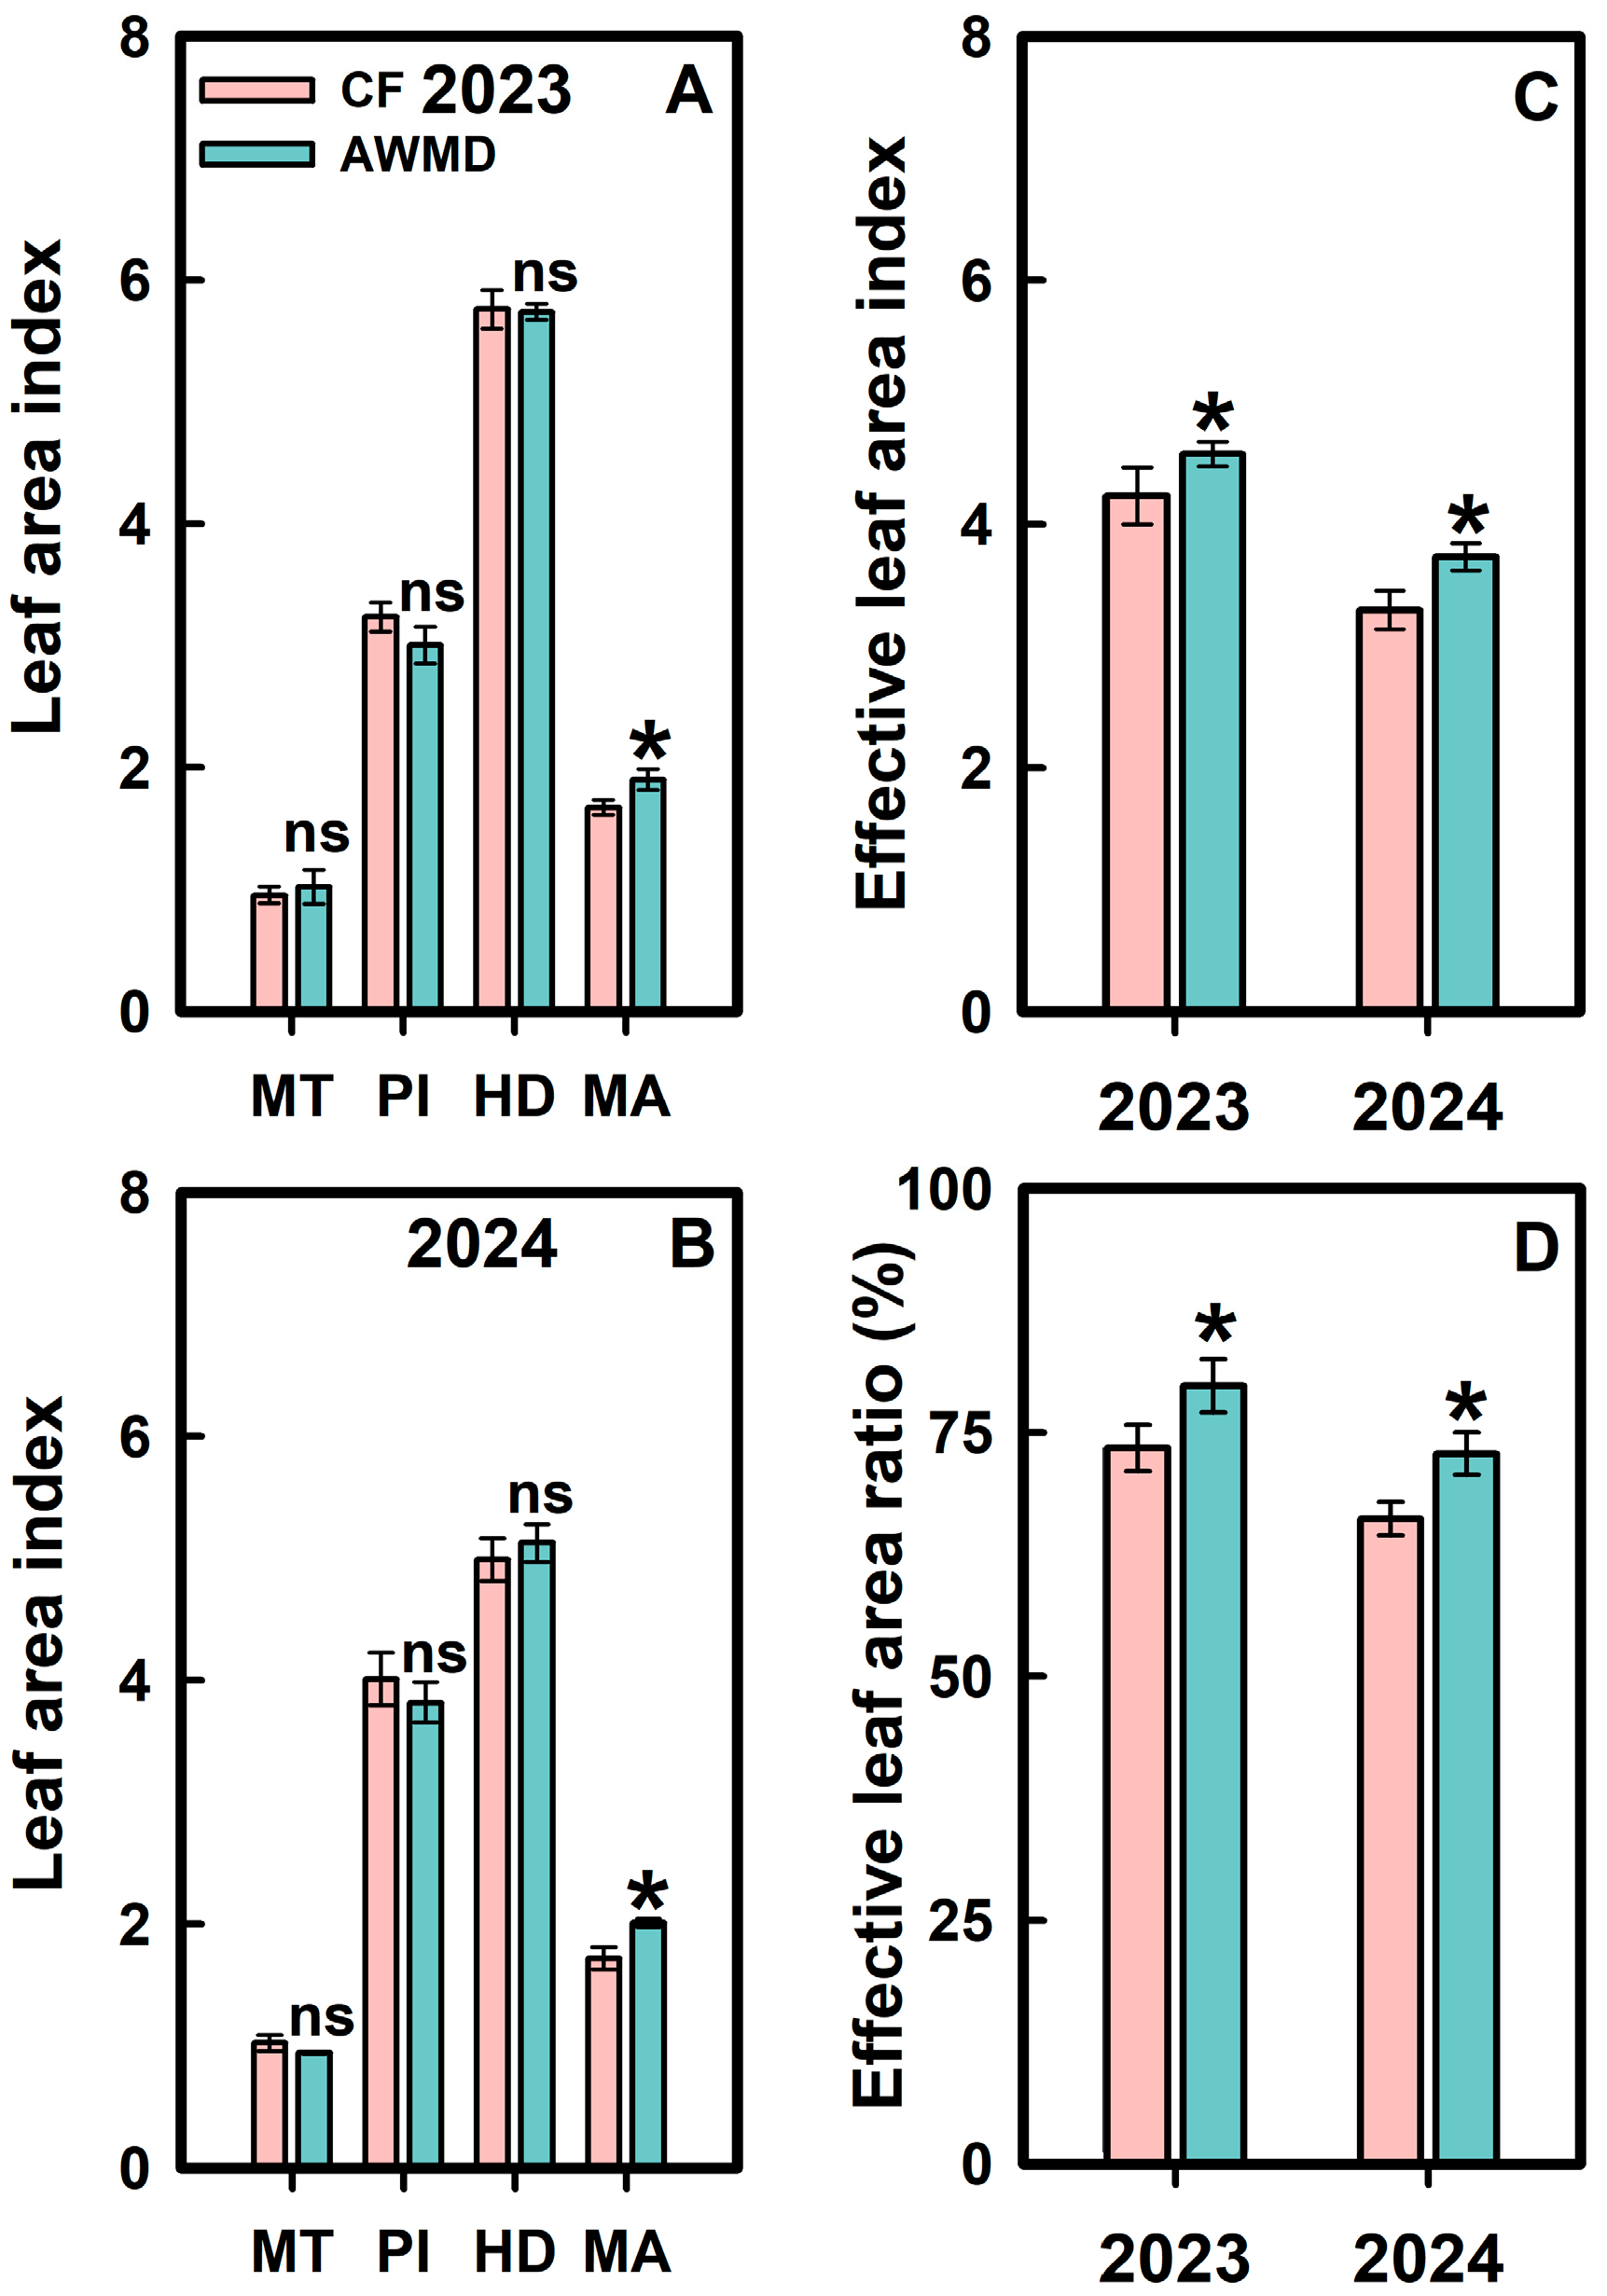
3.3. Leaf Photosynthetic Rate and Leaf Area Index

Relative to the CF regime, the AWMD regime significantly enhanced the leaf photosynthetic rate at the MT, PI, and HD stages. During the soil drying phase, statistical differences in the leaf photosynthetic rate between the two irrigation regimes were not evident (Figure 5). The AMWD regime significantly increased the leaf area index at the MA stage (Figure 6A,B). At HD, CF and AWMD exhibited comparable leaf area index values, but AWMD significantly improved both the leaf area index and the ratio of effective leaf area to the total leaf area during maturity (Figure 6C,D).

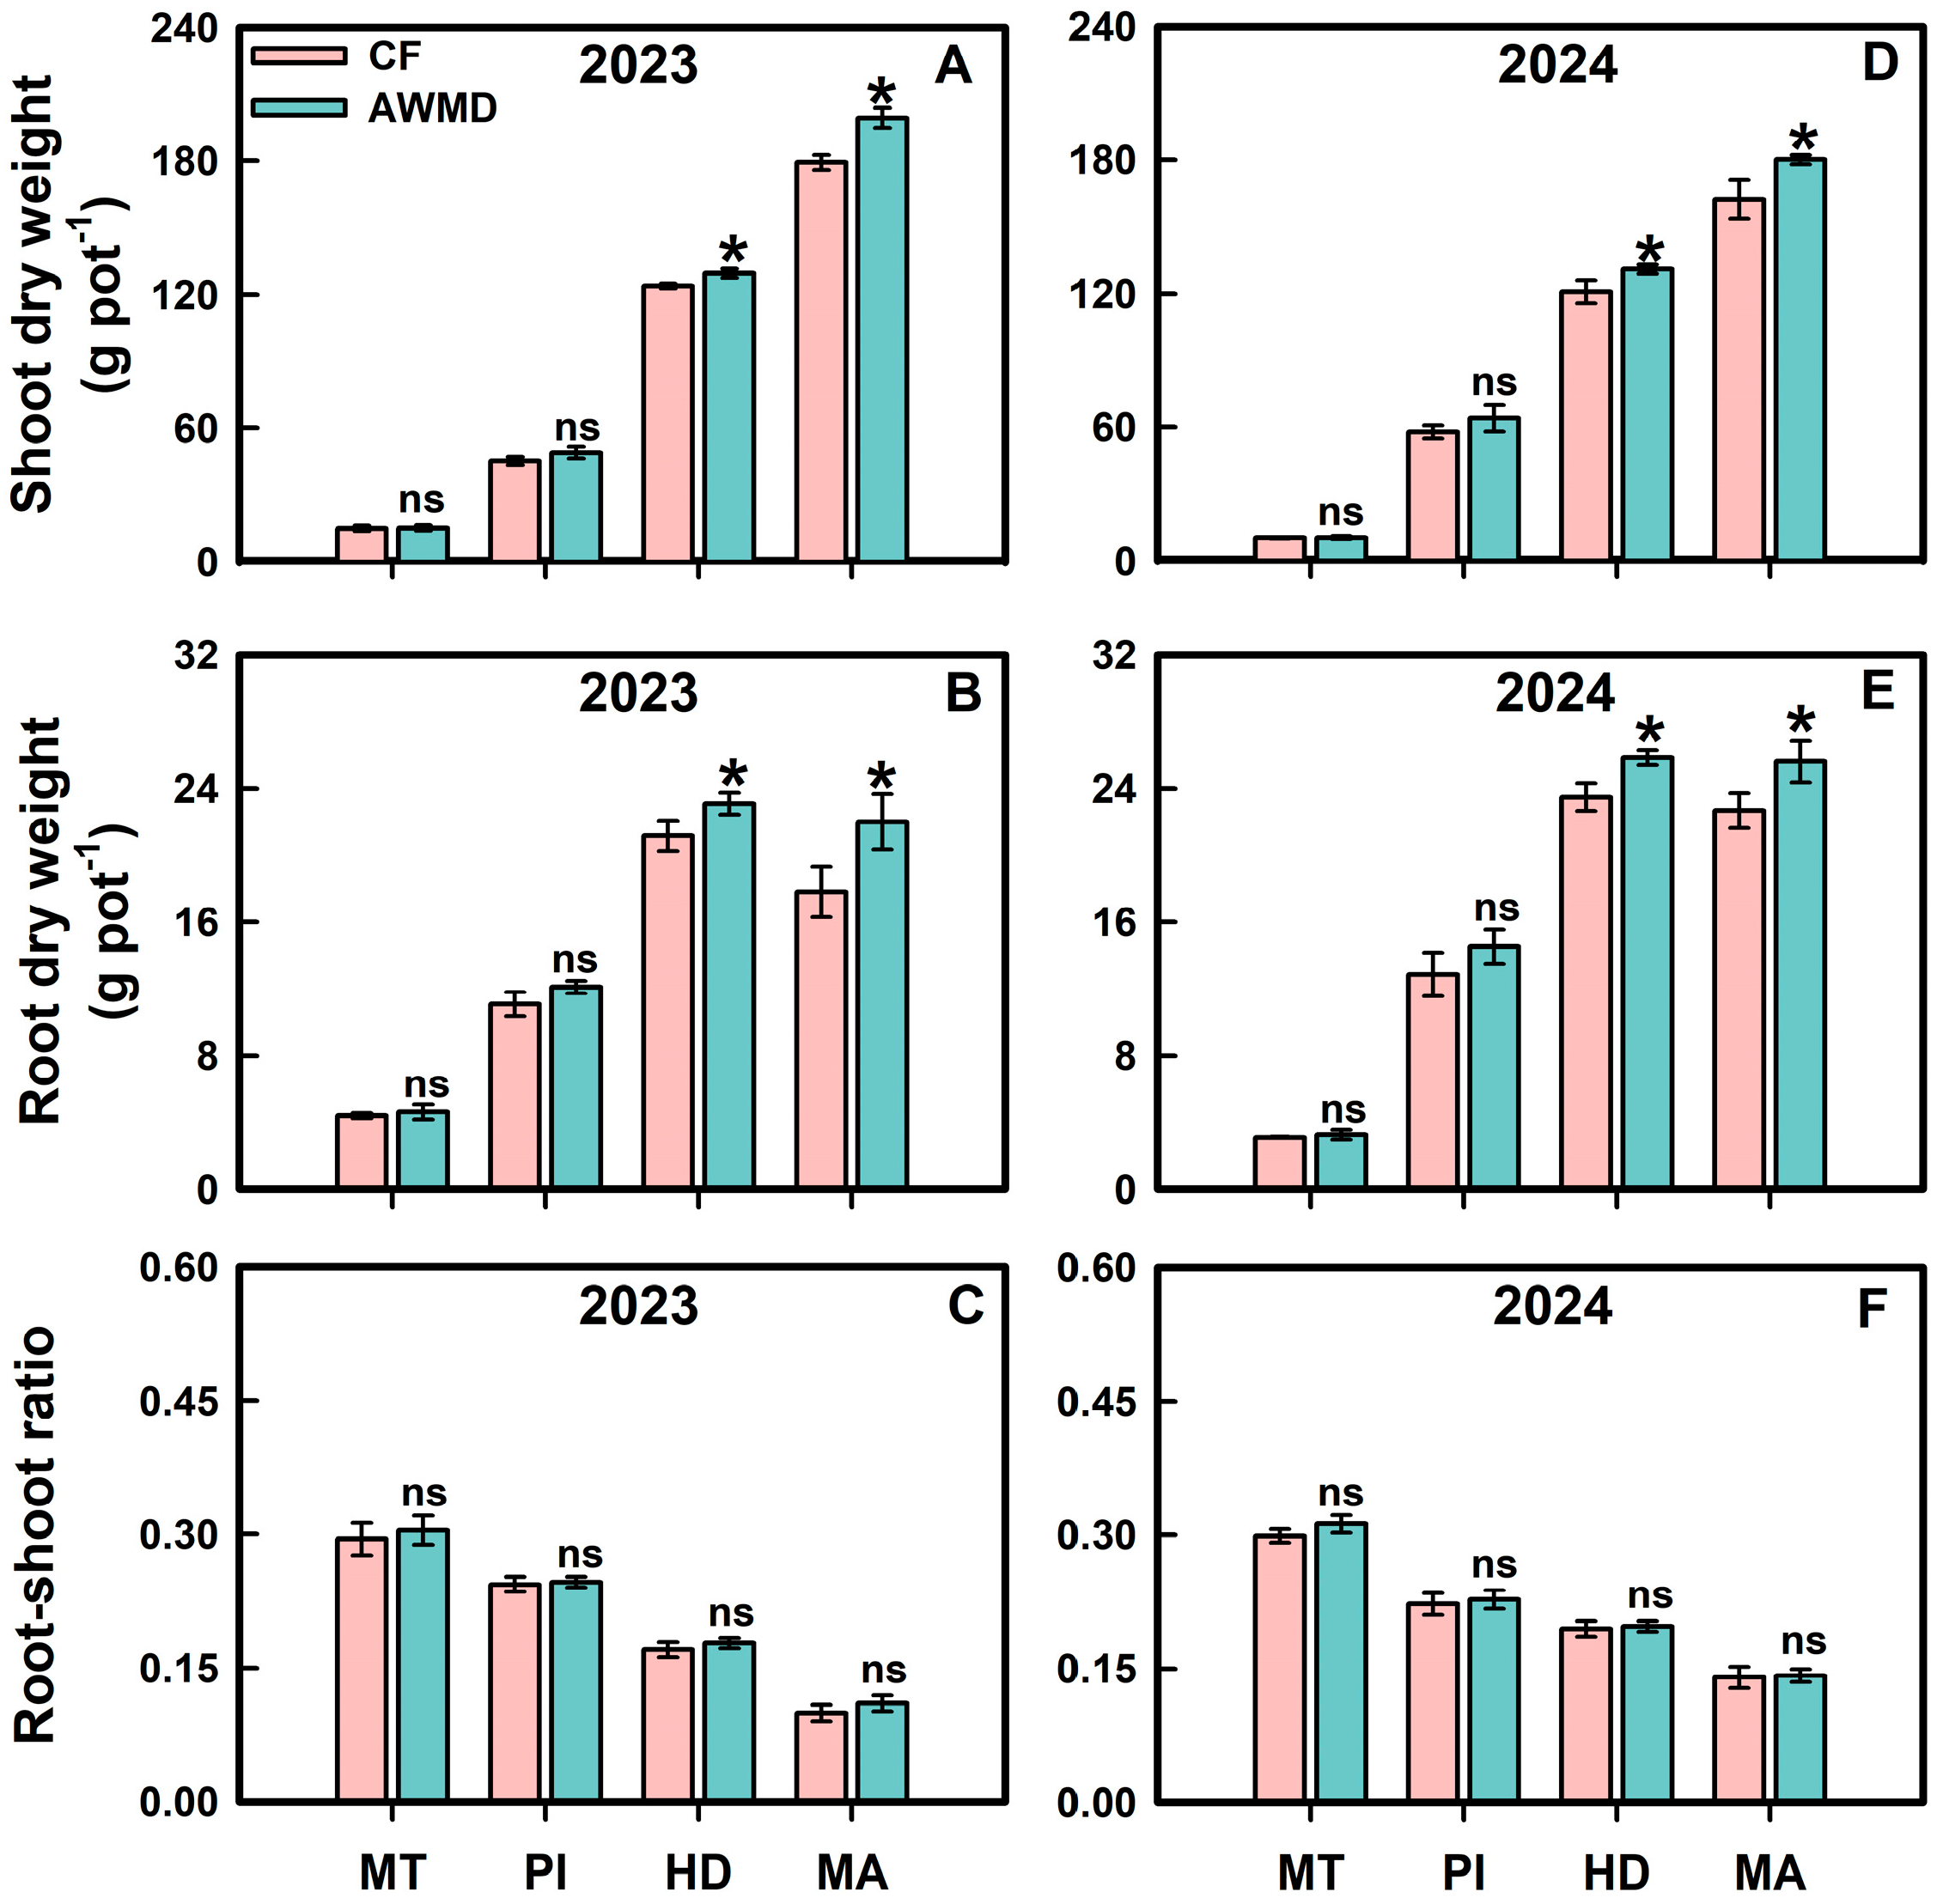
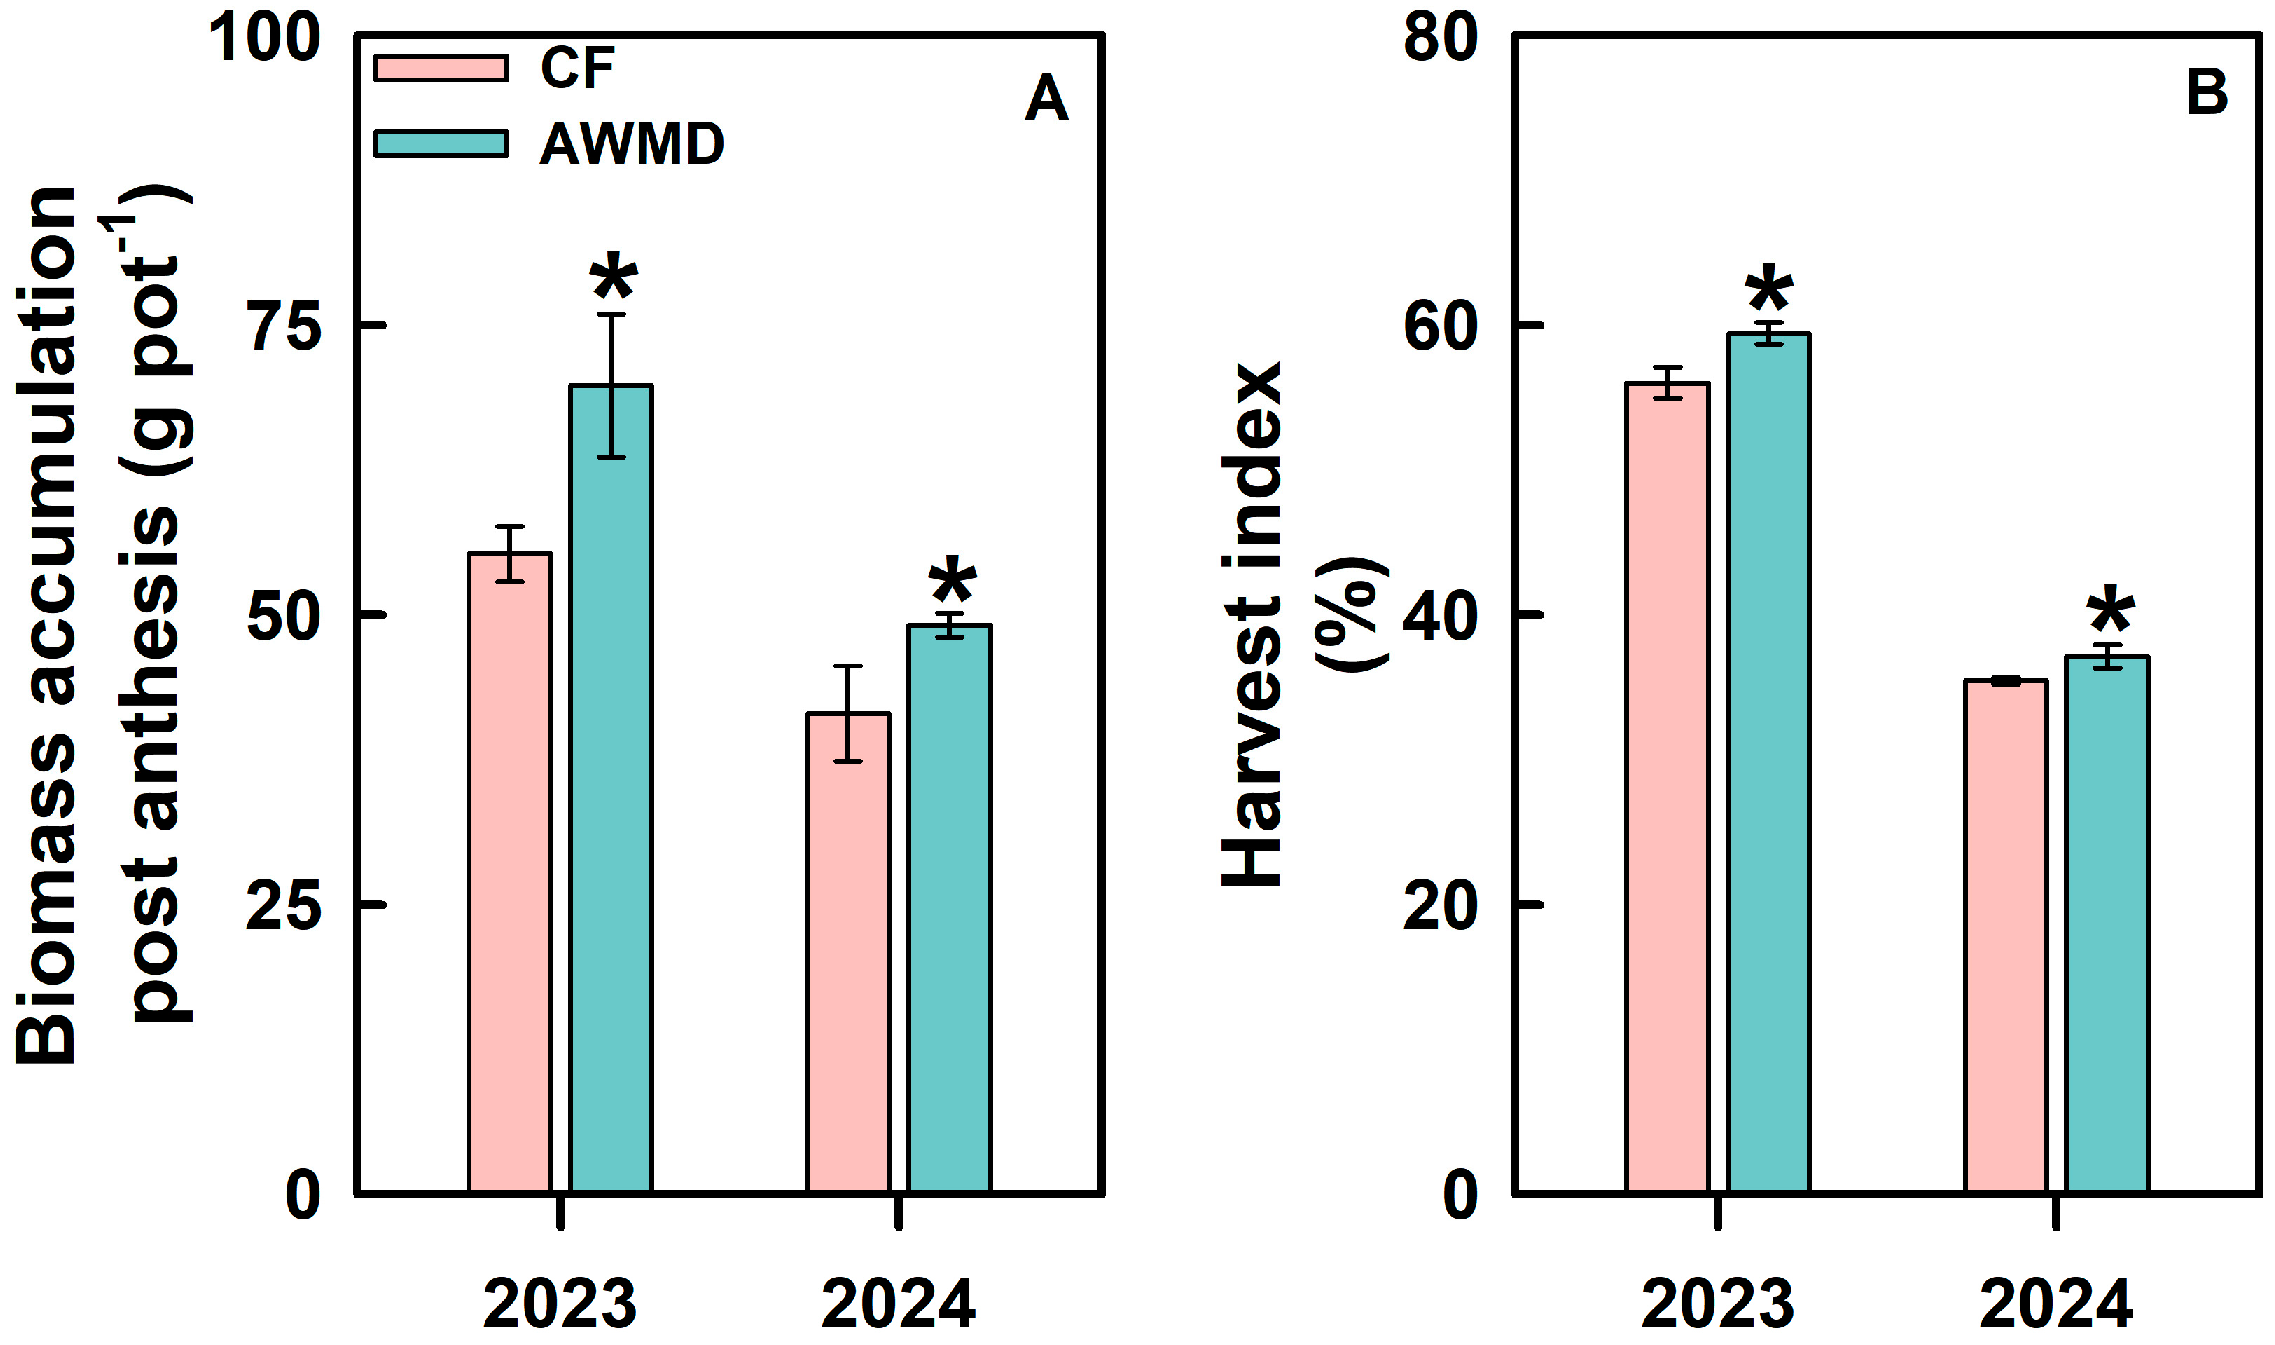
3.4. Biomass and Root–Shoot Ratio

Relative to the CF regime, the AWMD regime resulted in significantly greater root dry weight at HD and MA stages, with a similar trend observed in the above-ground biomass. The statistical analysis revealed no marked difference in the root–shoot ratio between CF and AWMD (Figure 7). In addition, the AWMD regime markedly increased the post-anthesis accumulation of above-ground biomass and raised the harvest index (Figure 8).

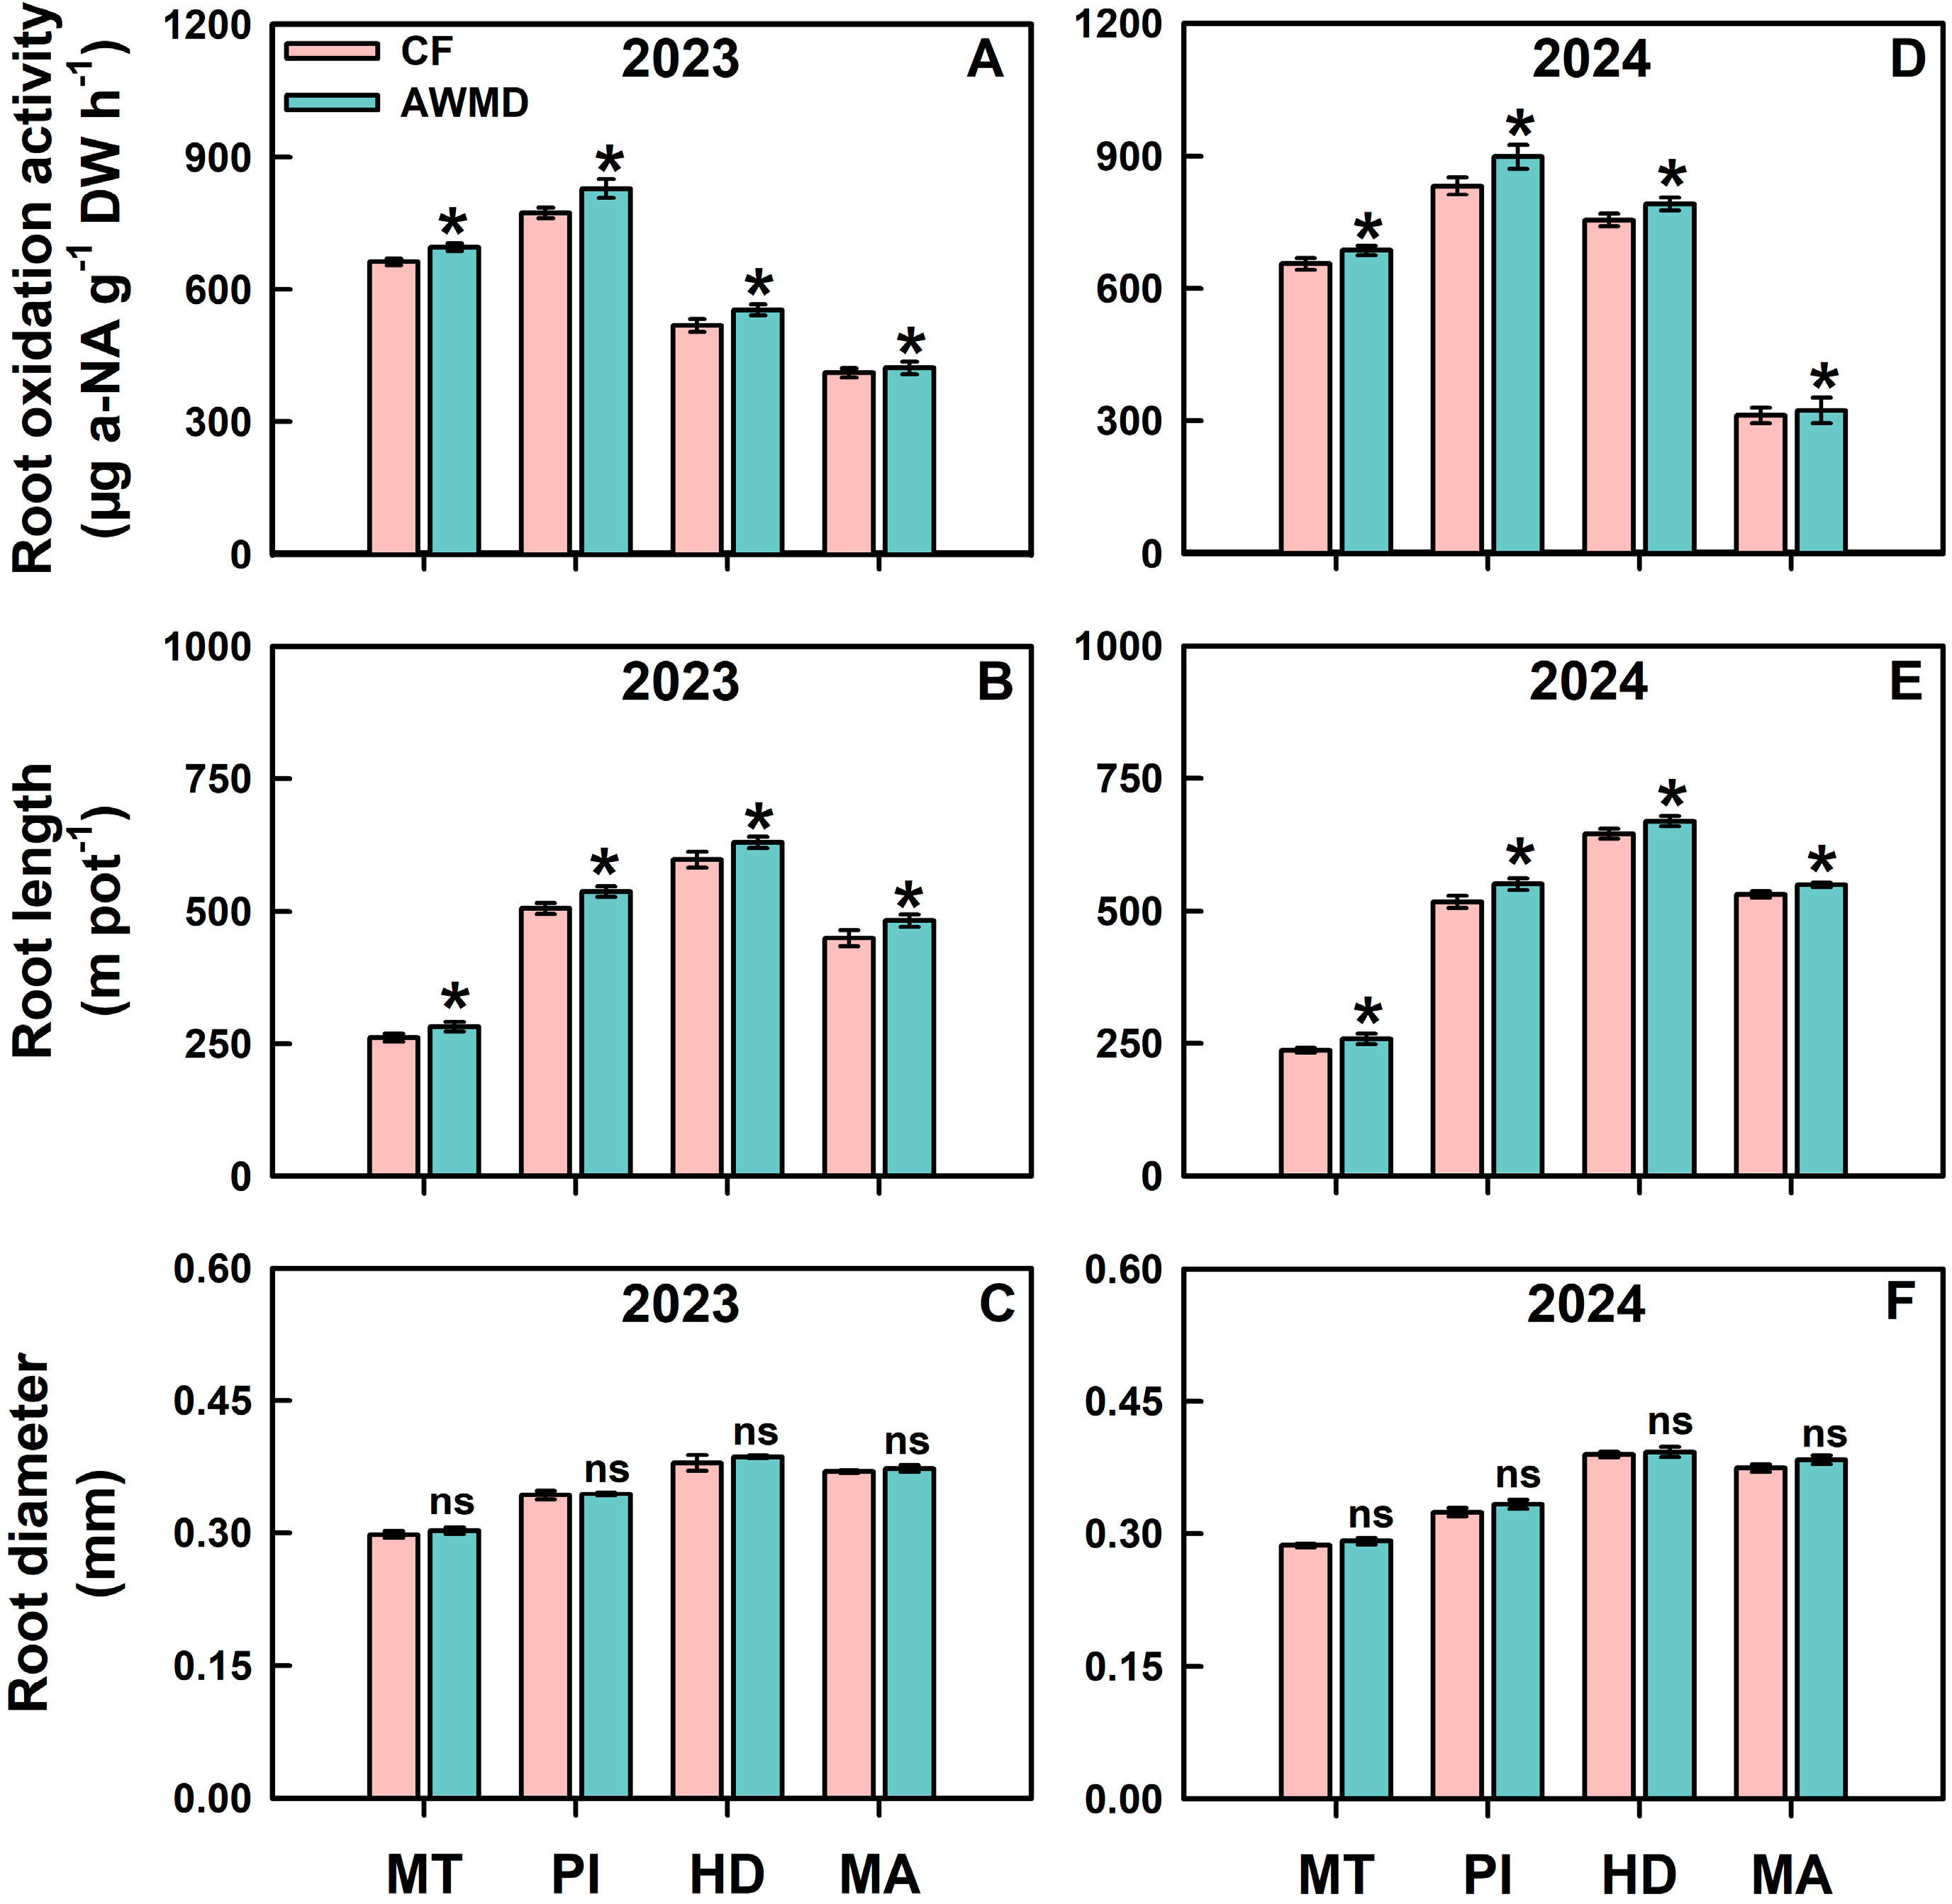
3.5. Root Oxidization Activity and Root Morphology

The AWMD regime led to markedly higher ROA and significantly greater root length than the CF regime at all growth stages. In contrast, the root diameter remained unaffected by the irrigation regime throughout the rice growth cycle, indicating that AWMD primarily influenced the root system architecture through elongation rather than radial expansion (Figure 9).

3.6. P Accumulation

AWMD significantly promoted P accumulation in the roots relative to the CF regime during the MT, PI, and HD stages. The AWMD regime increased P accumulation in the stems and leaves at the HD stage, and in the panicle at both the HD and MA stages. At both the MT and PI stages, the P accumulation in the plants showed no statistically significant variation under the CF and AWMD regimes. However, the AWMD regime significantly increased the P accumulation in the plants during the HD and MA stages (Figure 10).

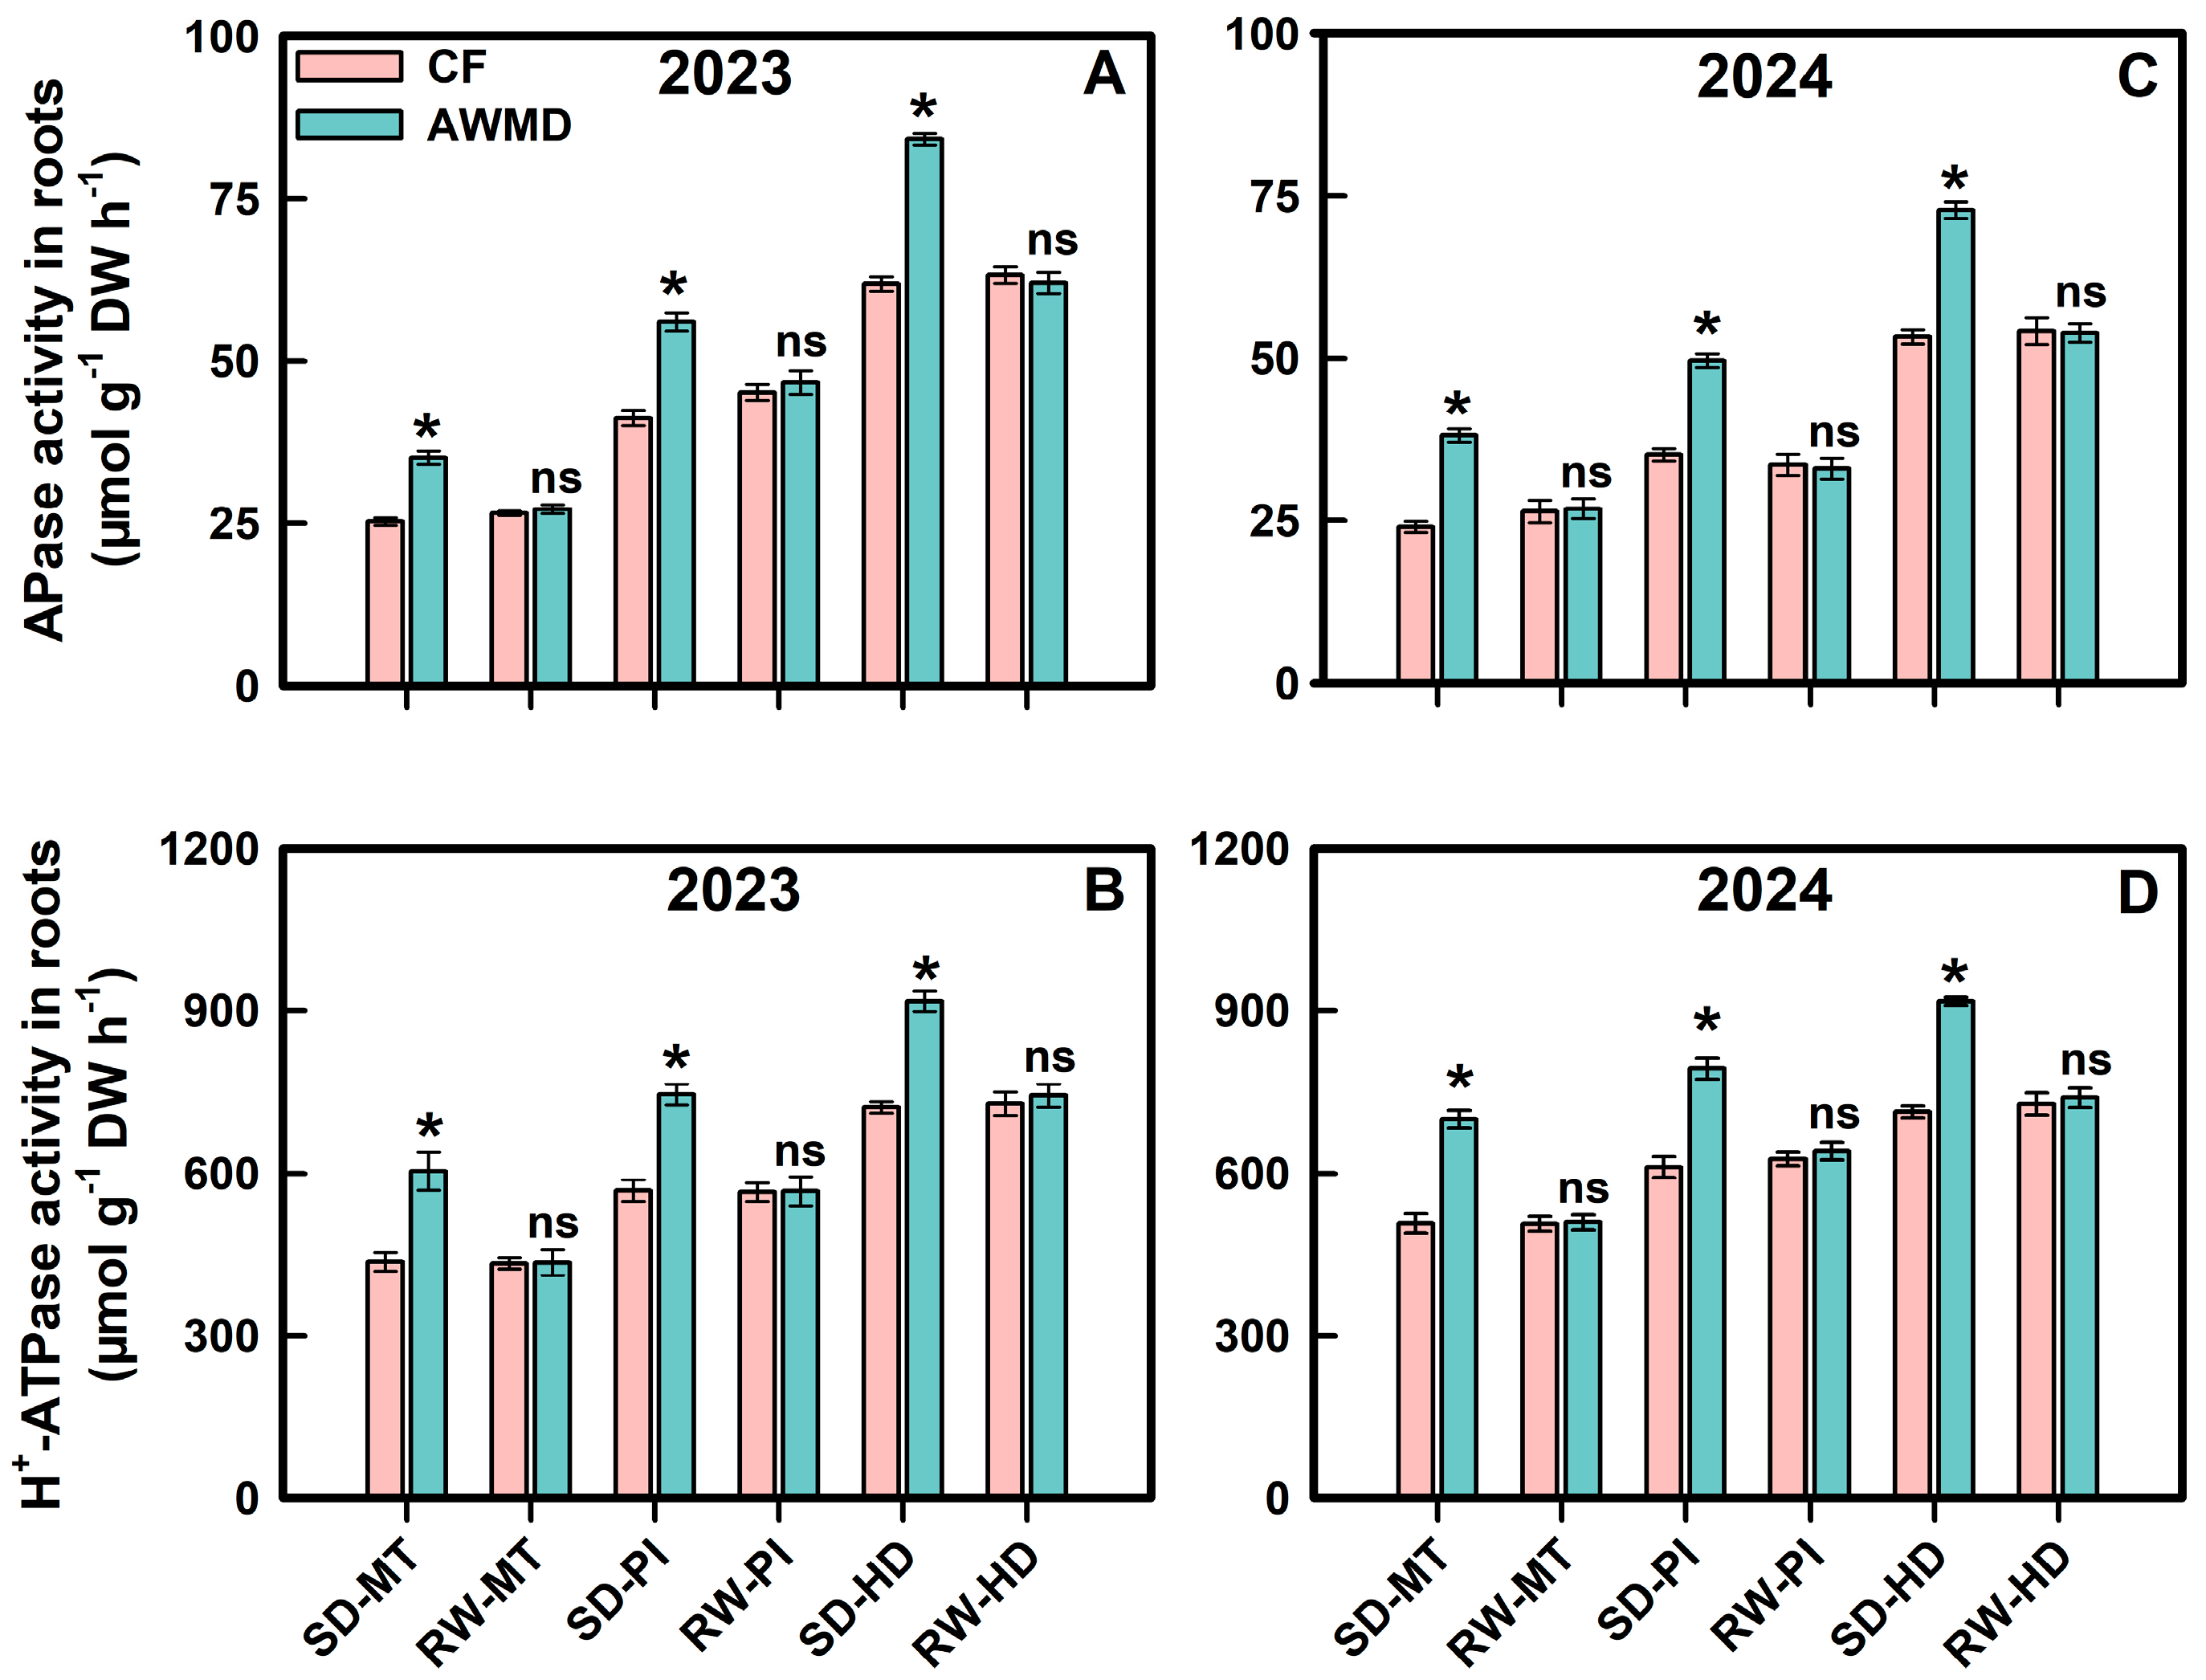
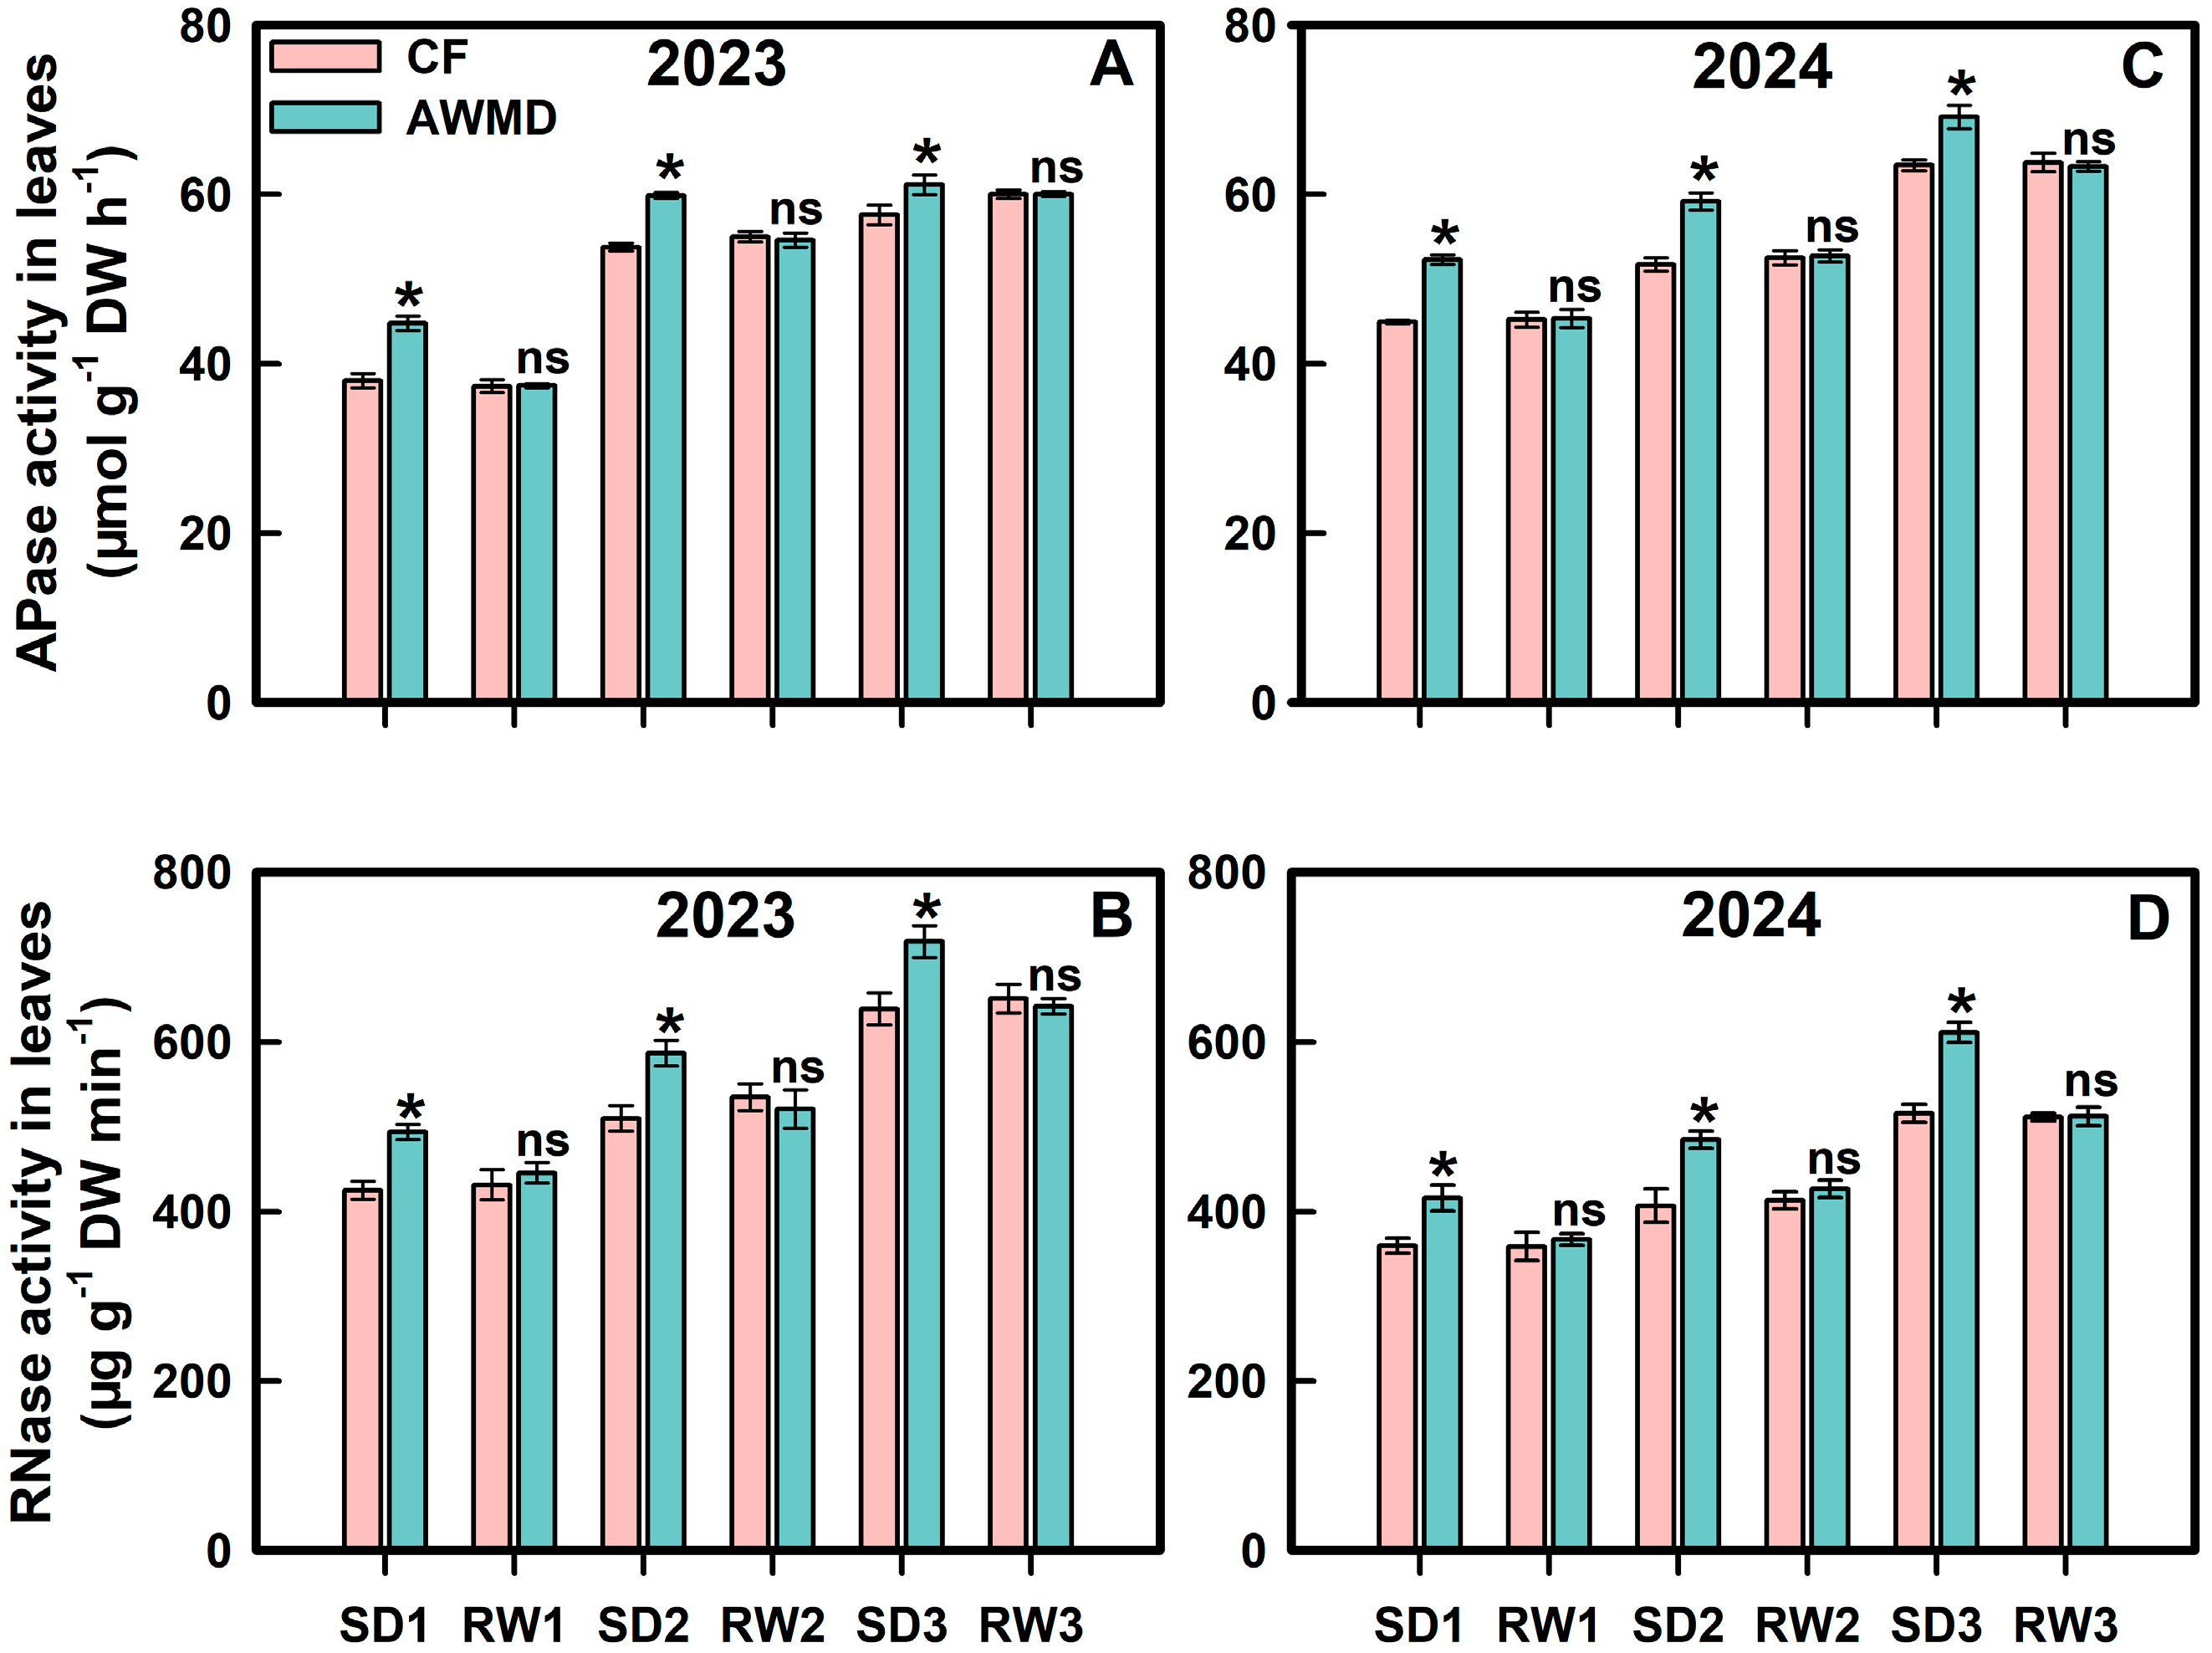
3.7. Activities of the Key Enzymes in P Uptake and Transport

During the MT, PI, and HD stages, the AWMD regime exhibited higher APase and H+-ATPase activities in roots compared to those observed in the CF regime (Figure 11). After HD, APase and RNase activities in the leaves under the AWMD regime rapidly increased during the soil drying period, significantly exceeding those observed under the CF regime. Upon rewatering, the activities of these enzymes in the AWMD regime returned to levels comparable to those observed in the CF regime (Figure 12).

4. Discussion

Although the benefits of AWMD on nitrogen absorption and utilization have been extensively documented [34,35,36,37], prior to this study, the effects of AWMD on P absorption and translocation in rice remained largely unexplored. The findings of this study have revealed that an AWMD regime could not only enhance the P-uptake capacity of vegetative organs, but also effectively facilitate the translocation of P accumulated in vegetative organs to the grains, thereby resulting in significantly higher P content in grains and an increased PHI (Figure 2B,F and Figure 10). Furthermore, the AWMD regime synergistically improved grain yield and PUE when compared to the CF regime (Table 1 and Figure 2).
Notably, it has been reported that, despite significant variations in soil water content across different soil types, the water status in plants remains consistent when the soil water potential is the same [31]. It has been noted that a midday leaf water potential higher than −1.05 MPa has no significant influence on rice photosynthesis [38]. Moreover, the data comparison of soil water potential, leaf water potential, and photosynthetic rate in rice between the CF and AWMD treatments, which was observed in this research, also supports this claim (Figure 3, Figure 4 and Figure 5). The results suggest that a midday leaf water potential between −0.95 MPa and −0.65 MPa, or a soil water potential of −20 kPa to −10 kPa at a 15–20 cm depth, could serve as a universal indicator for a safe AWMD in rice, regardless of soil type differences (Figure 3 and Figure 4).
The underlying mechanism by which an AWMD regime promotes the uptake and transport of P in rice is still not fully understood. Optimized root conditions are prerequisites for efficient nutrient uptake by rice roots. Previous studies have demonstrated that an AWMD regime can optimize the root environment, enhancing root vigor and promoting root development [39]. The results of this study indicated that, compared to the CF regime, the AWMD regime significantly enhanced P uptake, accompanied by increased ROA, root length, and root dry weight in rice (Figure 7B,E and Figure 9B,C,E,F). Moreover, the AWMD regime also strengthened root acidification capacity via upregulating the enzymatic activities of APase and H+-ATPase in roots (Figure 11). Therefore, the AWMD regime improves the P-uptake ability from the soil by enhancing root morphological and physiological functions in rice.
The transport status of P from vegetative organs to sink organs, in which key enzymes such as APase and RNase play vital roles, is also a key factor determining PUE in plants [40,41,42]. Specifically, APase hydrolyzes organic P, converting it into inorganic P, thereby increasing P availability, while RNase is involved in RNA metabolism, helping to optimize P distribution and utilization in plants [43,44]. In this study, it was observed that the activities of APase and RNase in the leaves were significantly increased during soil drying in the AWMD regime (Figure 12), which was consistent with the higher P accumulation and P harvest index under this treatment. Thus, it can be seen that the AWMD regime can very effectively re-activate the pre-stored P in the vegetative organs (especially the leaves), facilitating the easy transport of P to grains. By enhancing the activities of APase and RNase in the vegetative organs (especially leaves), it further improves PUE (especially the PHI) in rice.
High grain yield is an essential condition for the formation of high PUE (e.g., IPE and PPP) in rice. However, there is currently no unified understanding of how AWMD improves grain yield in rice. Interestingly, this study observed that, under the AWMD regime, the leaf photosynthetic rate decreased during soil drying but significantly increased after rewatering (Figure 5), highlighting a typical “rewatering effect” with rapid rebound of physiological activity upon water restoration. Moreover, without reducing the overall leaf area index, AWMD significantly increased both the effective leaf area index and the ratio of effective leaf area to the total leaf area at the heading stage (Figure 6). It also enhanced the above-ground biomass accumulation from flowering to maturity and the harvest index (Figure 8), indicating a “compensation effect” where AWMD effectively suppresses non-functional vegetative growth while optimizing biomass distribution between vegetative organs and grains. These results suggest that, compared with the traditional CF method, an AWMD regime achieves the synergy of high grain yield and PUE through the ‘’rewatering effect’’ and “compensation effect” in rice.
It should be recognized that environmental variables—such as soil type, temperature, relative humidity, reference evapotranspiration, and rainfall pattern—are potential factors affecting P uptake and translocation in rice. Even so, the pronounced improvements in P uptake and translocation under AWMD irrigation indicate that this regime is a promising strategy for enhancing PUE and grain yield in rice. Consequently, multi-site and long-term trials across diverse agro-ecological zones are warranted to validate these conclusions.

5. Conclusions

The AWMD regime is capable of synergistically augmenting rice grain yield and PUE. To be more specific, the improved root morphology, along with the increased activities of APase and H+-ATPase in roots, work together to promote the root’s absorption of P from the soil. In addition, soil drying under the AWMD regime during the grain-filling period can appropriately, and in a timely manner, increase the activities of APase and RNase in leaves. This enables the effective remobilization of P from vegetative organs to grains, consequently synergistically enhancing rice grain yield and PUE (Figure 13).

Author Contributions

Conceptualization, W.Z. and J.Y.; methodology, J.F., Y.L., Y.Z., K.Z., J.G., and Z.W.; software, J.F. and Y.L.; validation, J.F. and Y.L.; formal analysis, J.F. and Y.L.; investigation, J.F., Y.L., Y.Z., and K.Z.; data curation, J.F., Y.L., W.Z., and J.Y.; writing—original draft preparation, J.F. and Y.L.; writing—review and editing, W.Z. and J.Y.; visualization, J.F. and Y.L.; supervision, Z.W.; project administration, funding acquisition, supervision, and resources, J.Y. and W.Z. All authors have read and agreed to the published version of the manuscript.

Funding

This research was funded by the National Natural Science Foundation of China (32272198), the Priority Academic Program Development of Jiangsu Higher Education Institutions (PAPD-2020-01), and the Top Talent Supporting Program of Yangzhou University.

Data Availability Statement

Date are contained within the article.

Acknowledgments

The authors are grateful to all lab members for their useful suggestions and encouragement.

Conflicts of Interest

The authors declare no conflicts of interest.

References

  1. Sen, S.; Chakraborty, R.; Kalita, P. Rice-not just a staple food: A comprehensive review on its phytochemicals and therapeutic potential. Trends Food Sci. Technol. 2020, 97, 265–285. [Google Scholar] [CrossRef]
  2. Prathap, V.; Kumar, S.; Tyagi, A. Comparative proteome analysis of phosphorus-responsive genotypes reveals the proteins differentially expressed under phosphorous starvation stress in rice. Int. J. Biol. Macromol. 2023, 234, 123760. [Google Scholar] [CrossRef] [PubMed]
  3. Secco, D.; Wang, C.; Shou, H.; Schultz, M.D.; Chiarenza, S.; Nussaume, L.; Ecker, J.R.; Whelan, J.; Lister, R. Stress induced gene expression drives transient DNA methylation changes at adjacent repetitive elements. Elife 2015, 4, 09434. [Google Scholar] [CrossRef]
  4. Luan, M.; Tang, R.J.; Tang, Y.; Tian, W.; Hou, C.; Zhao, F.; Lan, W.; Luan, S. Transport and homeostasis of potassium and phosphate: Limiting factors for sustainable crop production. J. Exp. Bot. 2017, 68, 3091–3105. [Google Scholar] [CrossRef] [PubMed]
  5. Kumar, S.; Pallavi Chugh, C.; Seem, K.; Kumar, S.; Vinod, K.K.; Mohapatra, T. Characterization of contrasting rice (Oryza sativa L.) genotypes reveals the Pi-efficient schema for phosphate starvation tolerance. BMC Plant Biol. 2021, 21, 282. [Google Scholar] [CrossRef]
  6. Dissanayaka, D.; Ghahremani, M.; Siebers, M.; Wasaki, J.; Plaxton, W.C. Recent insights into the metabolic adaptations of phosphorus-deprived plants. J. Exp. Bot. 2021, 72, 199–223. [Google Scholar] [CrossRef]
  7. Chowdhury, R.B.; Moore, G.A.; Weatherley, A.J.; Arora, M. Key sustainability challenges for the global phosphorus resource, their implications for global food security, and options for mitigation. J. Clean. Prod. 2017, 140, 945–963. [Google Scholar] [CrossRef]
  8. Prathap, V.; Kumar, S.; Meena, N.L.; Maheshwari, C.; Dalal, M.; Tyagi, A. Phosphorus starvation tolerance in rice through combined physiological, biochemical, and proteome analyses. Rice Sci. 2023, 30, 613–631. [Google Scholar] [CrossRef]
  9. Ham, B.-K.; Chen, J.; Yan, Y.; Lucas, W.J. Insights into Plant Phosphate Sensing and Signaling. Curr. Opin. Biotechnol. 2018, 49, 1–9. [Google Scholar] [CrossRef]
  10. Rinasoa, S.; Rakotoson, T.; Rabeharisoa, L.; Tsujimoto, Y.; Nishigaki, T. Farmyard manure application increases lowland rice yield in phosphorus-deficient soils, but not in soils with high pH and phosphorus-fixing capacity. Field Crops Res. 2023, 296, 108906. [Google Scholar] [CrossRef]
  11. Xia, Y.; Zhang, M.; Tsang, D.C.W.; Geng, N.; Lu, D.; Zhu, L.; Igalavithana, A.D.; Dissanayake, P.D.; Rinklebe, J.; Yang, X.; et al. Recent advances in control technologies for non-point source pollution with nitrogen and phosphorous from agricultural runoff: Current practices and future prospects. Appl. Biol. Chem. 2020, 63, 8. [Google Scholar] [CrossRef]
  12. Liu, D.; Zhang, C.; Yan, N.; Yan, Y.; Duan, H. Eutrophication exacerbated organic pollution in lakes across China during the 1980s–2010s. Water Res. 2015, 268, 122782. [Google Scholar] [CrossRef] [PubMed]
  13. Lee, B.; Kim, M.; Geem, K.R.; Sung, J. Improving nutrient use efficiency of rice under alternative wetting and drying irrigation combined with slow-release nitrogen fertilization. Plants 2025, 14, 1530. [Google Scholar] [CrossRef]
  14. Adem, G.D.; Ueda, Y.; Hayes, P.E.; Wissuwa, M. Genetic and physiological traits for internal phosphorus utilization efficiency in rice. PLoS ONE 2020, 15, e0241842. [Google Scholar] [CrossRef] [PubMed]
  15. Negi, S.; Cheng, Y.C.; Wang, S.L.; Ho, S.T.; Pan, S.Y. Harvesting rice straw management synergies for lifecycle environmental and economic sustainability. Sci. Total Environ. 2025, 969, 178931. [Google Scholar] [CrossRef]
  16. Atwill, R.L.; Spencer, G.D.; Bond, J.A.; Walker, T.W.; Phillips, J.M.; Mills, B.E.; Krutz, L.J. Establishment of thresholds for alternate wetting and drying irrigation management in rice. Agron. J. 2023, 115, 1735–1745. [Google Scholar] [CrossRef]
  17. Hamoud, Y.A.; Shaghaleh, H.; Wang, R.; Gouertoumbo, W.F.; Hamad, A.A.A.; Sheteiwy, M.S.; Wang, Z.; Guo, X. Wheat straw burial improves physiological traits, yield and grain quality of rice by regulating antioxidant system and nitrogen assimilation enzymes under alternate wetting and drying irrigation. Rice Sci. 2022, 29, 473–488. [Google Scholar] [CrossRef]
  18. Hong Trang, V.; Nelson, K.M.; Samsuzzaman, S.; Rahman, S.M.; Rashid, M.; Salahuddin, A.; Sander, B.O. Institutional analysis for scaling alternate wetting and drying for low-emissions rice production: Evidence from bangladesh. Clim. Dev. 2022, 15, 10–19. [Google Scholar] [CrossRef]
  19. Natarajan, S.K.; Gowsalya, R.; Kathirvelan, P.; Venkatachalam, S.R.; Jaya Prabhavathi, S.; Elankavi, S.; Bhuvaneswari, J.; Sampathkumar, T.; Satheesh Kumar, N.; Pazhalanivelan, S. Impact of alternate wetting and drying irrigation (AWDI) on water saving and yield of transplanted rice. J. Exp. Agric. Int. 2025, 47, 451–460. [Google Scholar]
  20. Gharsallah, O.; Rienzner, M.; Mayer, A.; Tkachenko, D.; Corsi, S.; Vuciterna, R.; Romani, M.; Ricciardelli, A.; Cadei, E.; Trevisan, M.; et al. Economic, environmental, and social sustainability of alternate wetting and drying irrigation for rice in northern Italy. Front. Water 2023, 5, 1213047. [Google Scholar] [CrossRef]
  21. Phoeurn, C.A.; Degre, A.; Oeurng, C.; Ket, P. Evaluating the impact of climate change on yield and water use efficiency of different dry-season rice varieties cultivated under conventional and alternate wetting and drying conditions. Environ. Monit. Assess. 2024, 196, 1190. [Google Scholar] [CrossRef] [PubMed]
  22. Johnson, J.M.; Becker, M.; Dossou-Yovo, E.R.; Saito, K. Enhancing rice yields, water productivity, and profitability through alternate wetting and drying technology in farmers’ fields in the dry climatic zones of West Africa. Agric. Water Manag. 2024, 304, 109096. [Google Scholar] [CrossRef]
  23. Hoang, T.N.; Minamikawa, K.; Tokida, T.; Wagai, R.; Tran, T.X.P.; Tran, T.H.D.; Tran, D.H. Higher rice grain yield and lower methane emission achieved by alternate wetting and drying in central Vietnam. Eur. J. Agron. 2023, 151, 126992. [Google Scholar] [CrossRef]
  24. Song, T.; Xu, F.; Yuan, W.; Chen, M.; Hu, Q.; Tian, Y.; Zhang, J.; Xu, W. Combining alternate wetting and drying irrigation with reduced phosphorus fertilizer application reduces water use and promotes phosphorus use efficiency without yield loss in rice plants. Agric. Water Manag. 2019, 223, 105686. [Google Scholar] [CrossRef]
  25. Pramono, A.; Adriany, T.A.; Al Viandari, N.; Susilawati, H.L.; Wihardjaka, A.; Sutriadi, M.T.; Yusuf, W.A.; Ariani, M.; Wagai, R.; Tokida, T.; et al. Higher rice yield and lower greenhouse gas emissions with cattle manure amendment is achieved by alternate wetting and drying. Soil Sci. Plant Nutr. 2024, 70, 129–138. [Google Scholar] [CrossRef]
  26. Guo, M.X.; Zheng, L.; Zhao, X.S. Iron uptake, translocation and regulation in rice. Hereditas 2017, 39, 388–395. (In Chinese) [Google Scholar]
  27. Li, Y.; Zeng, H.; Xu, F.; Yan, F.; Xu, W. H+-ATPases in plant growth and stress responses. Annu. Rev. Plant Biol. 2022, 73, 495–521. [Google Scholar] [CrossRef]
  28. Shi, W.; Cao, T.; Yuan, Z.; Wang, Y.; Ying, Y. Phosphorus deficiency promotes root morphological and biochemical changes to enhance phosphorus uptake in phyllostachys edulis seedlings. Plant Soil 2025, in press. [Google Scholar] [CrossRef]
  29. Zhang, H.; Chen, M.; Xu, C.; Liu, R.; Tang, W.; Chen, K.; Zhou, Y.; Xu, Z.; Chen, J.; Ma, Y.; et al. H+-Pyrophosphatases enhance low nitrogen stress tolerance in transgenic arabidopsis and wheat by Interacting with a receptor-like protein kinase. Front. Plant Sci. 2023, 14, 1096091. [Google Scholar] [CrossRef]
  30. Yang, J.C.; Zhang, J.H.; Ye, Y.X.; Wang, Z.Q.; Zhu, Q.S.; Liu, L.J. Involvement of abscisic acid and ethylene in the responses of rice grains to water stress during filling. Plant Cell Environ. 2004, 27, 1055–1064. [Google Scholar] [CrossRef]
  31. Zhang, W.; Yu, J.; Xu, Y.; Wang, Z.; Liu, L.; Zhang, H.; Gu, J.; Zhang, J.; Yang, J. Alternate wetting and drying irrigation combined with the proportion of polymer-coated urea and conventional urea rates increases grain yield, water and nitrogen use efficiencies in rice. Field Crops Res. 2021, 268, 108165. [Google Scholar] [CrossRef]
  32. Gu, H.; Wang, X.; Zhang, M.; Jing, W.; Wu, H.; Xiao, Z.; Zhang, W.; Gu, J.; Liu, L.; Wang, Z.; et al. The response of roots and the rhizosphere environment to integrative cultivation practices in paddy rice. J. Integr. Agric. 2024, 23, 1879–1896. [Google Scholar] [CrossRef]
  33. Yoshida, S.; Coronel, V. Nitrogen nutrition, leaf resistance, and leaf photosynthetic rate of the rice plant. Soil Sci. Plant Nutr. 1976, 22, 207–211. [Google Scholar] [CrossRef]
  34. Nazari, B.; Liaghat, A.; Akbari, M.R.; Keshavarz, M. Irrigation water management in Iran: Implications for water use efficiency improvement. Agric. Water Manag. 2018, 208, 7–18. [Google Scholar] [CrossRef]
  35. Pan, J.; Liu, Y.; Zhong, X.; Lampayan, R.M.; Singleton, G.R.; Huang, N.; Liang, K.; Peng, B.; Tian, K. Grain yield, water productivity and nitrogen use efficiency of rice under different water management and fertilizer-N inputs in South China. Agric. Water Manag. 2017, 184, 191–200. [Google Scholar] [CrossRef]
  36. Singh, A.; Dass, A.; Dhar, S.; Singh, C.V.; Sudhishri, S.; Singh, T.; Rajanna, G.A.; Pande, P. Water management and planting methods influence growth, spikelet sterility and nutrient acquisition in aerobic rice. Int. J. Curr. Microbiol. Appl. Sci. 2019, 8, 554–565. [Google Scholar] [CrossRef]
  37. Shehzad, F.; Ali, Q.; Ali, S.; Al-Misned, F.A.; Maqbool, S. Fertigation with Zn-Lysine confers better photosynthetic efficiency and yield in water stressed maize: Water relations, antioxidative defense mechanism and nutrient acquisition. Plants 2022, 11, 404. [Google Scholar] [CrossRef] [PubMed]
  38. Yang, J.; Zhang, J. Approach and mechanism in enhancing the remobilization of assimilates and grain-filling in rice and wheat. Chin. Sci. Bull. 2018, 63, 2932–2943. (In Chinese) [Google Scholar] [CrossRef]
  39. Xu, G.; Lu, D.; Wang, H.; Li, Y. Morphological and physiological traits of rice roots and their relationships to yield and nitrogen utilization as influenced by irrigation regime and nitrogen rate. Agric. Water Manag. 2018, 203, 385–394. [Google Scholar] [CrossRef]
  40. Robinson, W.D.; Park, J.; Tran, H.T.; Del Vecchio, H.A.; Ying, S.; Zins, J.L.; Patel, K.; McKnight, T.D.; Plaxton, W.C. The secreted purple acid phosphatase isozymes Atpap12 and Atpap26 play a pivotal role in extracellular phosphate-scavenging by arabidopsis thaliana. J. Exp. Bot. 2012, 63, 6531–6542. [Google Scholar] [CrossRef]
  41. Kumar, S.; Agrawal, A.; Seem, K.; Kumar, S.; Vinod, K.K.; Mohapatra, T. Transcriptome analysis of a near-Isogenic line and its recurrent parent reveals the role of Pup1 Qtl in phosphorus deficiency tolerance of rice at tillering stage. Plant Mol. Biol. 2022, 109, 29–50. [Google Scholar] [CrossRef] [PubMed]
  42. Wang, L.; Li, Z.; Qian, W.; Guo, W.; Gao, X.; Huang, L.; Wang, H.; Zhu, H.; Wu, J.W.; Wang, D.; et al. The arabidopsis purple acid phosphatase Atpap10 is predominantly associated with the root surface and plays an important role in plant tolerance to phosphate limitation. Plant Physiol. 2011, 157, 1283–1289. [Google Scholar] [CrossRef] [PubMed]
  43. Wang, J.; Wei, Z.; Zhao, Y.; Xia, X.; Cui, J.; Li, S. The strategies for improving phosphorus-use efficiency in plant cell. Soil Sci. Plant Nutr. 2024, 71, 53–60. [Google Scholar] [CrossRef]
  44. Pavankumar, T.L. Rnase R Vs. Pnpase: Selecting the best-suited exoribonuclease for environmental adaptation. Extremophiles 2024, 28, 35. [Google Scholar] [CrossRef] [PubMed]
Figure 1. Maximum (A) and mean (B) daily temperatures during anthesis: historical average (1970–2010) and observations for 2023 and 2024.
Agronomy 15 01488 g001
Figure 2. P translocation efficiency (A,E), P harvest index (B,F), internal P-use efficiency (C,G), and P partial productivity (D,H) of YD-6 under various irrigation regimes. CF (conventional flooding) and AWMD (alternate wetting and moderate drying) denote the two irrigation regimes evaluated in this study. Error bars: ±SEM (n = 3), shown when larger than symbols. * indicates significance at p < 0.05; ns indicates non-significance (p > 0.05).
Agronomy 15 01488 g002
Figure 3. Soil water potential of YD-6 under various irrigation regimes in 2023 (A) and 2024 (B). CF (conventional flooding) and AWMD (alternate wetting and moderate drying) denote the two irrigation regimes evaluated in this study. Error bars represent ± standard error of the mean (n = 3), shown when larger than symbols.
Agronomy 15 01488 g003
Figure 4. Soil water potential of YD-6 under various irrigation regimes in 2023 (A) and 2024 (B). CF (conventional flooding) and AWMD (alternate wetting and moderate drying) denote the two irrigation regimes evaluated in this study. MT, PI, and HD represent the middle tillering, panicle initiation, and heading stages, while SD and RW denote the first soil drying phase and rewatering period, respectively. Error bars represent ± standard error of the mean (n = 3), shown when larger than symbols. * and ns indicate p < 0.05 and non-significance (p ≥ 0.05), respectively.
Agronomy 15 01488 g004
Figure 5. Leaf photosynthetic rate of YD-6 under various irrigation regimes in 2023 (A) and 2024 (B). CF (conventional flooding) and AWMD (alternate wetting and moderate drying) denote the two irrigation regimes evaluated in this study. MT, PI, HD, and MA represent the middle tillering, panicle initiation, heading, and maturity stages, while SD and RW denote the first soil drying phase and rewatering period, respectively. Error bars represent ± standard error of the mean (n = 3), shown when larger than symbols. * and ns indicate p < 0.05 and non-significance (p ≥ 0.05), respectively.
Agronomy 15 01488 g005
Figure 6. Leaf area index (A,B), effective leaf area index (C), and effective leaf area ratio (D) of YD-6 under various irrigation regimes. CF (conventional flooding) and AWMD (alternate wetting and moderate drying) denote the two irrigation regimes evaluated in this study. MT, PI, HD, and MA represent the middle tillering, panicle initiation, heading, and maturity stages, respectively. Error bars represent ± standard error of the mean (n = 3), shown when larger than symbols. * and ns indicate p < 0.05 and non-significance (p ≥ 0.05), respectively.
Agronomy 15 01488 g006
Figure 7. Shoot dry weight (A,D), root dry weight (B,E), and root–shoot ratio (C,F) of YD-6 under various irrigation regimes. CF (conventional flooding) and AWMD (alternate wetting and moderate drying) denote the two irrigation regimes evaluated in this study. MT, PI, HD, and MA represent the middle tillering, panicle initiation, heading, and maturity stages, respectively. Error bars represent ± standard error of the mean (n = 3), shown when larger than symbols. * and ns indicate p < 0.05 and non-significance (p ≥ 0.05), respectively.
Agronomy 15 01488 g007
Figure 8. Biomass accumulation post anthesis (A) and harvest index (B) of YD-6 under various irrigation regimes. CF (conventional flooding) and AWMD (alternate wetting and moderate drying) denote the two irrigation regimes evaluated in this study. Error bars represent ± standard error of the mean (n = 3), shown when larger than symbols. * indicate p < 0.05.
Agronomy 15 01488 g008
Figure 9. Root oxidation activity (A,D), root length (B,E), and root diameter (C,F) of YD-6 under various irrigation regimes. CF (conventional flooding) and AWMD (alternate wetting and moderate drying) denote the two irrigation regimes evaluated in this study. MT, PI, HD, and MA represent the middle tillering, panicle initiation, heading, and maturity stages, respectively. Error bars represent ± standard error of the mean (n = 3), shown when larger than symbols. * and ns indicate p < 0.05 and non-significance (p ≥ 0.05), respectively.
Agronomy 15 01488 g009
Figure 10. P accumulation and distribution in the plant organs of YD-6 under various irrigation regimes. (A,G) P accumulation in the root. (D,J) P accumulation in the stem. (B,H) P accumulation in the leaf. (E,K) P accumulation in the panicle. (C,I) P accumulation in the shoot. (F,L) P accumulation in the whole plant. CF (conventional flooding) and AWMD (alternate wetting and moderate drying) denote the two irrigation regimes evaluated in this study. MT, PI, HD, and MA represent the middle tillering, panicle initiation, heading, and maturity stages, respectively. Error bars represent ± standard error of the mean (n = 3), shown when larger than symbols. * and ns indicate p < 0.05 and non-significance (p ≥ 0.05), respectively.
Agronomy 15 01488 g010
Figure 11. Acid phosphatase activity (A,C) and proton-pump ATPase activity (B,D) in the roots of YD-6 under various irrigation regimes. CF (conventional flooding) and AWMD (alternate wetting and moderate drying) denote the two irrigation regimes evaluated in this study. MT, PI, and HD represent the middle tillering, panicle initiation, and heading stages, while SD and RW denote the first soil drying phase and rewatering period, respectively. Error bars represent ± standard error of the mean (n = 3), shown when larger than symbols. * and ns indicate p < 0.05 and non-significance (p ≥ 0.05), respectively.
Agronomy 15 01488 g011
Figure 12. Acid phosphatase activity (A,C) and ribonuclease activity (B,D) in the leaves of YD-6 under various irrigation regimes at the heading stage. CF (conventional flooding) and AWMD (alternate wetting and moderate drying) denote the two irrigation regimes evaluated in this study. SD and RW denote the first soil drying phase and rewatering period, respectively. Numbers 1, 2, and 3 indicate three consecutive experimental cycles. Error bars represent ± standard error of the mean (n = 3), shown when larger than symbols. * and ns indicate p < 0.05 and non-significance (p ≥ 0.05), respectively.
Agronomy 15 01488 g012
Figure 13. A descriptive model of how alternating wetting and moderate drying (AWMD) enhances phosphorus uptake, translocation, and utilization in rice. The AWMD regime stimulates root oxidation activity and optimized root morphology, upregulates phosphorus uptake key enzymes (acid phosphatase and proton-pump ATPase), and improves phosphorus uptake capacity. Concurrently, AWMD increases the leaf photosynthetic rate and effective leaf area and promotes shoot biomass accumulation. The AWMD treatment also enhances the activity of phosphorus translocation key enzymes in the leaves (acid phosphatase and ribonuclease), thereby increasing the phosphorus translocation capacity from source to sink. Accordingly, AWMD facilitates phosphorus accumulation in grains, leading to an improved phosphorus-use efficiency and increased grain yield in rice.
Agronomy 15 01488 g013
Table 1. Grain yield and its components of YD-6 under various irrigation regimes.
YearIrrigation
Regime
Panicles per PotSpikelets per PanicleFertization Rate
(%)
Fully Filled Grains
(%)
1000-Grain
Weight
(g)
Grain Yield
(g pot−1)
2023CF18.615988.484.828.165.9
AWMD17.9 ns165 *91.4 ns88.5 *28.3 *73.2 *
2024CF22.014861.440.427.327.7
AWMD21.1 ns156 *68.3 *48.3 *27.8 *30.1 *
CF (conventional flooding) and AWMD (alternate wetting and moderate drying) denote the two irrigation methods evaluated in this study. * and ns indicate p < 0.05 and non-significance (p ≥ 0.05), respectively.
Disclaimer/Publisher’s Note: The statements, opinions and data contained in all publications are solely those of the individual author(s) and contributor(s) and not of MDPI and/or the editor(s). MDPI and/or the editor(s) disclaim responsibility for any injury to people or property resulting from any ideas, methods, instructions or products referred to in the content.

