Article

Large-Scale Apple Orchard Identification from Multi-Temporal Sentinel-2 Imagery

1
Department of Geographic Information Engineering, College of Land Science and Technology, China Agricultural University, No. 2 West Old Summer Palace Road, Haidian District, Beijing 100193, China
2
Key Laboratory for Agricultural Land Quality Monitoring and Control, Ministry of Natural Resources, Beijing 100193, China
*
Author to whom correspondence should be addressed.
Agronomy 2025, 15(6), 1487; https://doi.org/10.3390/agronomy15061487
Submission received: 12 May 2025 / Revised: 15 June 2025 / Accepted: 17 June 2025 / Published: 19 June 2025
(This article belongs to the Section Precision and Digital Agriculture)

Abstract

:
Accurately extracting large-scale apple orchards from remote sensing imagery is of importance for orchard management. Most studies lack large-scale, high-resolution apple orchard maps due to sparse orchard distribution and similar crops, making mapping difficult. Using phenological information and multi-temporal feature-selected imagery, this paper proposed a large-scale apple orchard mapping method based on the AOCF-SegNet model. First, to distinguish apples from other crops, phenological information was used to divide time periods and select optimal phases for each spectral feature, thereby obtaining spectral features integrating phenological and temporal information. Second, semantic segmentation models (FCN-8s, SegNet, U-Net) were com-pared, and SegNet was chosen as the base model for apple orchard identification. Finally, to address the issue of the low proportion of apple orchards in remote sensing images, a Convolutional Block Attention Module (CBAM) and Focal Loss function were integrated into the SegNet model, followed by hyperparameter optimization, resulting in AOCF-SegNet. The results from mapping the Yantai apple orchards indicate that AOCF-SegNet achieved strong segmentation performance, with an overall accuracy of 89.34%. Compared to the SegNet, U-Net, and FCN-8s models, AOCF-SegNet achieved an improvement in overall accuracy by 3%, 6.1%, and 9.6%, respectively. The predicted orchard area exhibited an approximate area consistency of 71.97% with the official statistics.

1. Introduction

China is the leading country globally in terms of apple cultivation area and production, with the apple industry being a significant component of its agricultural economy [1,2]. The economic benefits of non-grain crops such as apples, along with the expansion of specialized agricultural production patterns, are driving farmers to adjust their planting structures towards non-grain directions. Accurately obtaining the spatial distribution information of apple orchards provides fundamental data support for assessing local apple cultivation scale and developing orchard management plans. This is of great significance for promoting the high-quality development of the apple industry in advantageous production regions [3]. Therefore, extracting spatial information on apple orchards in major production areas is crucial for accurately understanding the planting area and distribution of apple orchards.
The manual field measurement of crop planting areas and distributions is labor-intensive, time-consuming, and costly. With the development of remote sensing technology, its potential in land cover classification applications has been significantly recognized [4]. Utilizing satellite remote sensing data and drone imagery from sources such as Sentinel-2, Landsat 9, and GF-2 for the extraction of orchard information [5], including tree vigor and planting area, addresses issues like the long cycle for spatial data acquisition and limited observation scope at a lower cost. Sentinel-2, known for its high resolution and multispectral bands [6], provides essential vegetation indices for large-scale crop mapping, hence its widespread application in identifying small-scale orchards [3,7] and crops like tea [8], soybeans [9] and corn [10,11]. However, despite significant advancements in remote sensing technology for orchard and crop identification [12], research on large-scale apple orchard identification remains relatively scarce.
The spectral characteristics of apples can be confused with those of similar crops like pear and peach. Apples exhibit significant differences from similar crops at different growth stages, such as earlier flowering and later leaf shedding. Therefore, integrating phenological characteristics with multi-temporal remote sensing imagery is crucial for accurate apple identification [13]. High-resolution single-temporal imagery enables direct orchard extraction through linear relationships between land cover and its features [14]. Integrating machine learning with single-temporal imagery enhances identification efficiency and accuracy but struggles to leverage spatiotemporal information. Multi-temporal imagery provides insights into cyclical changes and relationships between land covers, and its proper use can significantly improve identification accuracy [15]. At different times, a crop’s spectral reflectance and indices show notable variations, following different trends [16]. The fusion of multi-temporal imagery and phase-specific features enriches phenological data, enhancing crop classification accuracy. Therefore, selecting the optimal time phase for apple orchard identification and optimizing features from different times are crucial for improving accuracy.
The choice of classification methods is crucial for apple identification. Machine learning models can demonstrate superior performance when dealing with datasets that have clear features and patterns [17], effectively recognizing different crop types [18]. random forest (RF) has been widely applied in remote sensing classification due to its ability to capture global nonlinear relationships and feature importance, as well as its high tolerance to noise and missing values [19,20,21]. However, RF also has certain limitations, such as weak sensitivity to local structures and high computational complexity. To mitigate these shortcomings, integrating random forest with K-means clustering is necessary. Although K-means has limited capability in representing global features and is sensitive to outliers, it effectively discovers local cluster structures in data and provides additional unsupervised information on data distribution for RF. This compensates for RF’s deficiency in capturing local features. By combining RF’s strong classification ability with the clustering information from K-means, this integration achieves complementary advantages and cross-validation, thereby avoiding the limitations of a single model in either global feature extraction or local structure identification. However, machine learning often relies on manually added features for classification tasks, and this dependence can limit classification results due to the constrained understanding of the data characteristics. With increasing task complexity, deep learning exhibits powerful capabilities in feature learning and data processing, thus showing more pronounced advantages in crop identification [22]. Especially when handling multi-dimensional remote sensing imagery data, deep learning models can automatically extract deeper features [23], achieving higher accuracy and robustness in identification. Apples are a precision crop and occupy a relatively small proportion in remote sensing images, making it difficult for traditional deep learning methods to focus effectively during identification, often requiring a substantial amount of sample data. Therefore, employing deep learning methods for large-scale apple orchard identification is a challenging research task.
This study primarily aims to address the issues of accuracy in large-scale apple orchard recognition and the difficulty in creating sample datasets, with the following main objectives: (1) to explore automatic methods for creating large-scale apple orchard datasets; (2) to analyze the phenological differences between apple and other crops and find the identification features that contain phenological and temporal information; and (3) to develop a deep learning model tailored for apple orchard recognition to generate an apple orchard map for Yantai City. Based on the above research objectives, this study addresses key challenges such as the difficulty of sample acquisition and spectral confusion with non-target objects. By integrating targeted solutions, it improves the accuracy of large-scale apple orchard identification and provides essential technical support for apple mapping at a global scale.

2. Materials and Methods

2.1. Study Area

Yantai City in Shandong Province, located between 119°34′ to 121°57′ E and 36°16′ to 38°23′ N (Figure 1a), lies within the globally recognized apple-growing belt of 35–50° latitude and is the birthplace of modern apple cultivation in China, as well as one of the four major apple-producing regions in the country. The spatial extent of the Google Earth ultra high-resolution imagery (Section Google Earth Ultra High-Resolution Imagery) of this study primarily covers three administrative regions under the jurisdiction of Yantai City: Qixia City, Muping District, and Laiyang City. With an area of 13,930.1 km2, a coastline of 909 km, and a warm temperate continental monsoon climate characterized by abundant sunshine and sufficient rainfall, Yantai’s landscape, predominantly consisting of low mountains and hills (Figure 1b), provides exceptional natural advantages and a strong foundation for apple cultivation.
Phenological analysis allows for a deeper understanding of crop biochemical conditions, enabling a more accurate identification of crop types and growth status. The life activities of fruit trees display certain patterns with seasonal changes [24], and understanding the phenological stages of apple trees is crucial for the extraction of apple orchard areas. As shown in Figure 2, apple trees enter the budding stage in early March, which lasts until early April. Following the completion of budding, the flowering stage occurs from early April to early May. The young fruit bagging period extends from mid-May to mid-June, during which apple trees typically stop the growth of spring shoots and start bagging. Fruit swelling occurs from late June to late August. September marks the fruit coloring stage. October is the fruit maturation period, signifying the start of the harvest season.

2.2. Data Source

The overall workflow of this study is as follows: sample data were first collected through field surveys and served as references for manual labeling. The labeled samples were then used to construct a training dataset for the random forest classifier. The preliminary classification results from random forest and K-means were combined by taking their intersection, and the intersected results were manually corrected to produce the dataset used for training the deep learning network.

2.2.1. Remote Sensing Data

Sentinel-2 Level-2A Imagery

Sentinel-2 is a multispectral remote sensing satellite that covers bands from visible to shortwave infrared, with a high spatial resolution of 10 m and a high revisit frequency of 5 days. The study area utilized Sentinel-2 (S2) imagery with cloud cover less than 10%, and all S2 images from 2022 were obtained from Google Earth Engine (GEE). Sentinel-2 consists of 13 spectral bands, including visible bands (Bands 2, 3, and 4, 10 m), red-edge bands (Bands 5, 6, 7, and 8A, 20 m), near-infrared (NIR) band (Band 8, 10 m), shortwave infrared (SWIR) bands (Bands 11 and 12, 20 m), and 3 additional bands (Bands 1, 9, and 10, 60 m). This study utilized seven bands (Bands 2 to 8), and the 20 m red-edge bands were resampled to 10 m to ensure uniform spatial resolution across all selected bands. Based on the six phenological periods of apples listed in Figure 2, the period from March to October 2022 was divided into six time phases. Sentinel-2 Level-2A data were used to perform median fusion for each time phase. Six different images were obtained from 1 March to 10 April, 11 April to 10 May, 11 May to 20 June, 21 June to 31 August, 1 September to 30 September, and 1 October to 31 October, respectively, and were named T1–T6 in chronological order. In this study, Sentinel-2 was used as input imagery for the random forest dataset construction (see Section Random Forest Apple Orchard Classification) and the semantic segmentation classification task (see Section 3.2).

Google Earth Ultra High-Resolution Imagery

The highest resolution of Google Earth imagery can reach sub-meter level [25]. In this study, Google Earth imagery was used as input imagery for the K-means dataset construction (see Section K-Means Apple Orchard Classification in Section 2.3.2) [26]. Due to the difference in the shooting time of images in different regions within the study area, and large volume of remote sensing imagery leading to the limitation of computing power, 17-level images with a spatial resolution of 2.15 m were selected for Qixia City, Muping District and Laiyang City, including three bands of red, green and blue.

2.2.2. Other Data

Field Measurements

The field samples for this study were collected from 28 September to 2 October 2021 and from 26 August to 31 August 2022. Using handheld GPS positioning instruments, a total of 379 samples were obtained with an accuracy of approximately 3 m. During the sample collection process, as many apple orchards and other orchards as possible were collected to facilitate the study of differences between apple orchards and other orchards during the visual interpretation stage. The number of samples for each land cover type is presented in Table 1. Considering that apples take 2–3 years from seedling to the first harvest, the selected samples are from apples that have been planted for at least three years.

Official Statistics

In 2021, the apple orchard planting area in Yantai was 132,900 ha, according to publicly available government data from the Shandong Statistical Yearbook (Table 13-10 Tea and Fruit Production in Various Cities, http://tjj.shandong.gov.cn/tjnj/nj2022/zk/zk/indexch.htm (accessed on 14 June 2025)). In this study, officially published data on the apple orchard planting area in Yantai were used for apple orchard identification cross-verification [27].

2.3. Methods

To address the issue of the small proportion of apple orchards in images and the difficulty of distinguishing them from other crops, the AOCF-SegNet (CBAM-FocalLoss-SegNet for Apple Orchard) model was proposed. Firstly, semantic segmentation samples were generated through machine learning classification. Secondly, spectral features with temporal information were determined using annual time series curves, combined with Sentinel-2 remote sensing images to obtain the multi-temporal feature-optimized imagery. Subsequently, the recognition results of apple orchards were compared using the FCN-8s, SegNet, and U-Net models, and development was conducted on the SegNet model. In addition, a Convolutional Block Attention Module (CBAM) and Focal Loss were integrated into SegNet, followed by the hyperparameter optimization of the model. Finally, the apple orchard recognition results were obtained. The detailed process is illustrated in Figure 3.

2.3.1. Data Preprocessing

In this study, Sentinel-2 L2A images with cloud coverage > 10% were removed through cloud coverage screening, and we completed the 2022 missing image using the 2021 image [28]. Considering the differences in spectral band spatial resolution, the spectral index features were resampled to a unified resolution of 10 m. To address potential discrepancies in channel weights caused by inputting spectral features, the spectral features were normalized using a min–max scaling linear function. Additionally, for the convenience of post-processing in the semantic segmentation model, the pixel depth transformation of the images was conducted using Python 3.8.10 percentile clipping and exponential transformation, converting them from a signed 32-bit floating point to unsigned 8-bit integers.

2.3.2. Dataset Construction

In this study, a semantic segmentation dataset construction method of apple orchard based on machine learning and multi-source data fusion was proposed. By comprehensively using multi-source information of Sentinel-2 and Google Earth imagery [17], two classical machine learning models were established to extract apple orchards, respectively, and the classification results of different models were fused [29]. The specific fusion method involves performing a raster intersection of the two classification results in ArcGIS, discarding all pixels outside the overlapping areas. Based on this intersection, the fused result is then manually corrected to obtain the final refined result. Finally, the refined vector classification results (the final refined output) were further converted to unsigned RGB channel raster image labels.

Random Forest Apple Orchard Classification

Random forest [30] is a nonparametric typical machine learning model, which has great advantages in solving classification problems. The model generates multiple decision trees through bootstrapping, with each tree working on a different data subset and selecting a random feature subset at each node for segmentation, enhancing the model’s generalization power [31]. Random feature selection is an effective way to mitigate overfitting and helps to accurately predict feature importance [32]. On the Google Earth Engine platform ee.Classifier.smileRandomForest, using Sentinel-2 imagery and a random forest algorithm can be an effective and accurate way to conduct large-scale 10 m image data classification [33]. In order to ensure the typicality and accuracy of the semantic segmentation dataset of apple orchards, this study selected parts of Qixia City, Laiyang City and Muping District as sample areas according to the investigation. A 10 km grid was established to randomly and uniformly select samples combined with the measured samples. The sample points were verified with the help of the NDVI change curve of each sample, and the samples that failed to pass the verification process were discarded. Upon selecting Sentinel-2 images from April 1 to May 31, 2022, using spectral indices and topographic features, all the ground crops were divided into two categories: apple orchard land and background ground crops.

K-Means Apple Orchard Classification

K-means is an unsupervised machine learning algorithm based on a central point, which is good at dealing with clustering problems. In this algorithm, each data point is assigned to the nearest random cluster center to form an initial cluster, and the center is updated to the mean of the points in the cluster. This iterative process continues until the change in the cluster center is below a preset threshold or the maximum iterations are reached, enabling automatic classification without prior knowledge and avoiding the need for labeled training data. This method is simple, efficient, and suitable for processing high-resolution Google Earth imagery and large-scale datasets. In this study, the K-means unsupervised classification tool in ENVI 5.3 software was applied to perform clustering analysis on high-resolution Google Earth imagery. The number of clusters was set to 20, with a maximum of three iterations. In the initial stage of the algorithm, 20 pixels were randomly selected as the initial cluster centers. During each iteration, the cluster centers were updated by computing the mean values of all pixels within each cluster across all spectral bands. The final clustering results were semantically merged based on the actual distribution of apple orchards obtained from field sampling data, resulting in two land cover categories: apple orchards and background vegetation. After obtaining the classification results, the majority analysis, clustering, filtering and other post-processing methods of small patches were carried out. Specifically, the majority analysis used a sliding window with a majority replacement method to remove noise and smooth the boundaries; adjacent pixel clustering was applied to enhance spatial continuity; and speckle suppression filtering was used to eliminate small patches. Finally, the processing results were resampled to 10 m in ArcGIS.

Multi-Source Classification Result Fusion

The fusion of Random Forest and K-means results enables the complementary integration of global and local features, thereby achieving the mutual validation and enhancement of different model outcomes. Multi-source classification results were intergrated in ArcGIS to verify the effect of the two kinds of apple orchard extraction results. Given the ultra-high resolution and the ability to view historical images of Google Earth, specific texture information and the growth status of apple orchards can be clearly distinguished through visual interpretation. Additionally, by utilizing the Google Earth Engine (GEE) platform to compare the NDVI time series trends with field samples of apples, further reference was provided. Therefore, Google Earth ultra-high resolution images and NDVI time series curves were used to visually inspect the fused results and manually correct unreasonable classification areas. Then, the corrected vector apple orchard classification results were converted into the unsigned bit-raster format satellite image data label diagram of the RGB channel. The label data were converted into unsigned 8-bit data through Python to obtain the final label.

Data Augmentation

In this study, a python sliding window was used to crop images in batches. In order to maximize the use of sample data, the image data and label data of 3 sample areas were synchronously clipped to 512 × 512 pixels, and a total of 91 groups of label image pairs were obtained and were divided into training sets, verification sets and test sets at a ratio of 15:4:4. The 91 pairs of labeled images specifically refer to 91 images and their corresponding 91 label maps. Each image may contain more than one class label. Small size data are conducive to improving the efficiency of model training. Therefore, the divided dataset was trimmed to 256 × 256 pixels with an overlap rate of 0.4, and a total of 540 pairs of training sets, 144 pairs of verification sets and 135 pairs of test sets were obtained. In this study, three methods of horizontal flip, vertical flip and diagonal mirror in geometric transformation were used for data enhancement, as shown in Figure 4. A total of 2160 pairs of training sets, 576 pairs of verification sets and 540 pairs of test sets were obtained.

2.3.3. Feature Optimization

This study extracted multi-temporal features and spectral indices from Sentinel-2, incorporating indices from different temporal phases as model inputs to enhance model performance by integrating multi-temporal information [34]. Based on the phenological information of apple trees, the spectral feature values of various land covers were calculated using six images from different temporal phases. Features refer to the distinctive and significant attributes or characteristic information within a target object that enable identification. In machine learning algorithms, features are used to describe the attributes or variables of data and serve as the foundation for model learning and prediction. After feature selection, the spectral indices ultimately used for classification are collectively referred to as features. To improve computational efficiency, this study conducted feature selection based on feature importance, ultimately selecting nine features [35], as shown in Table 2.

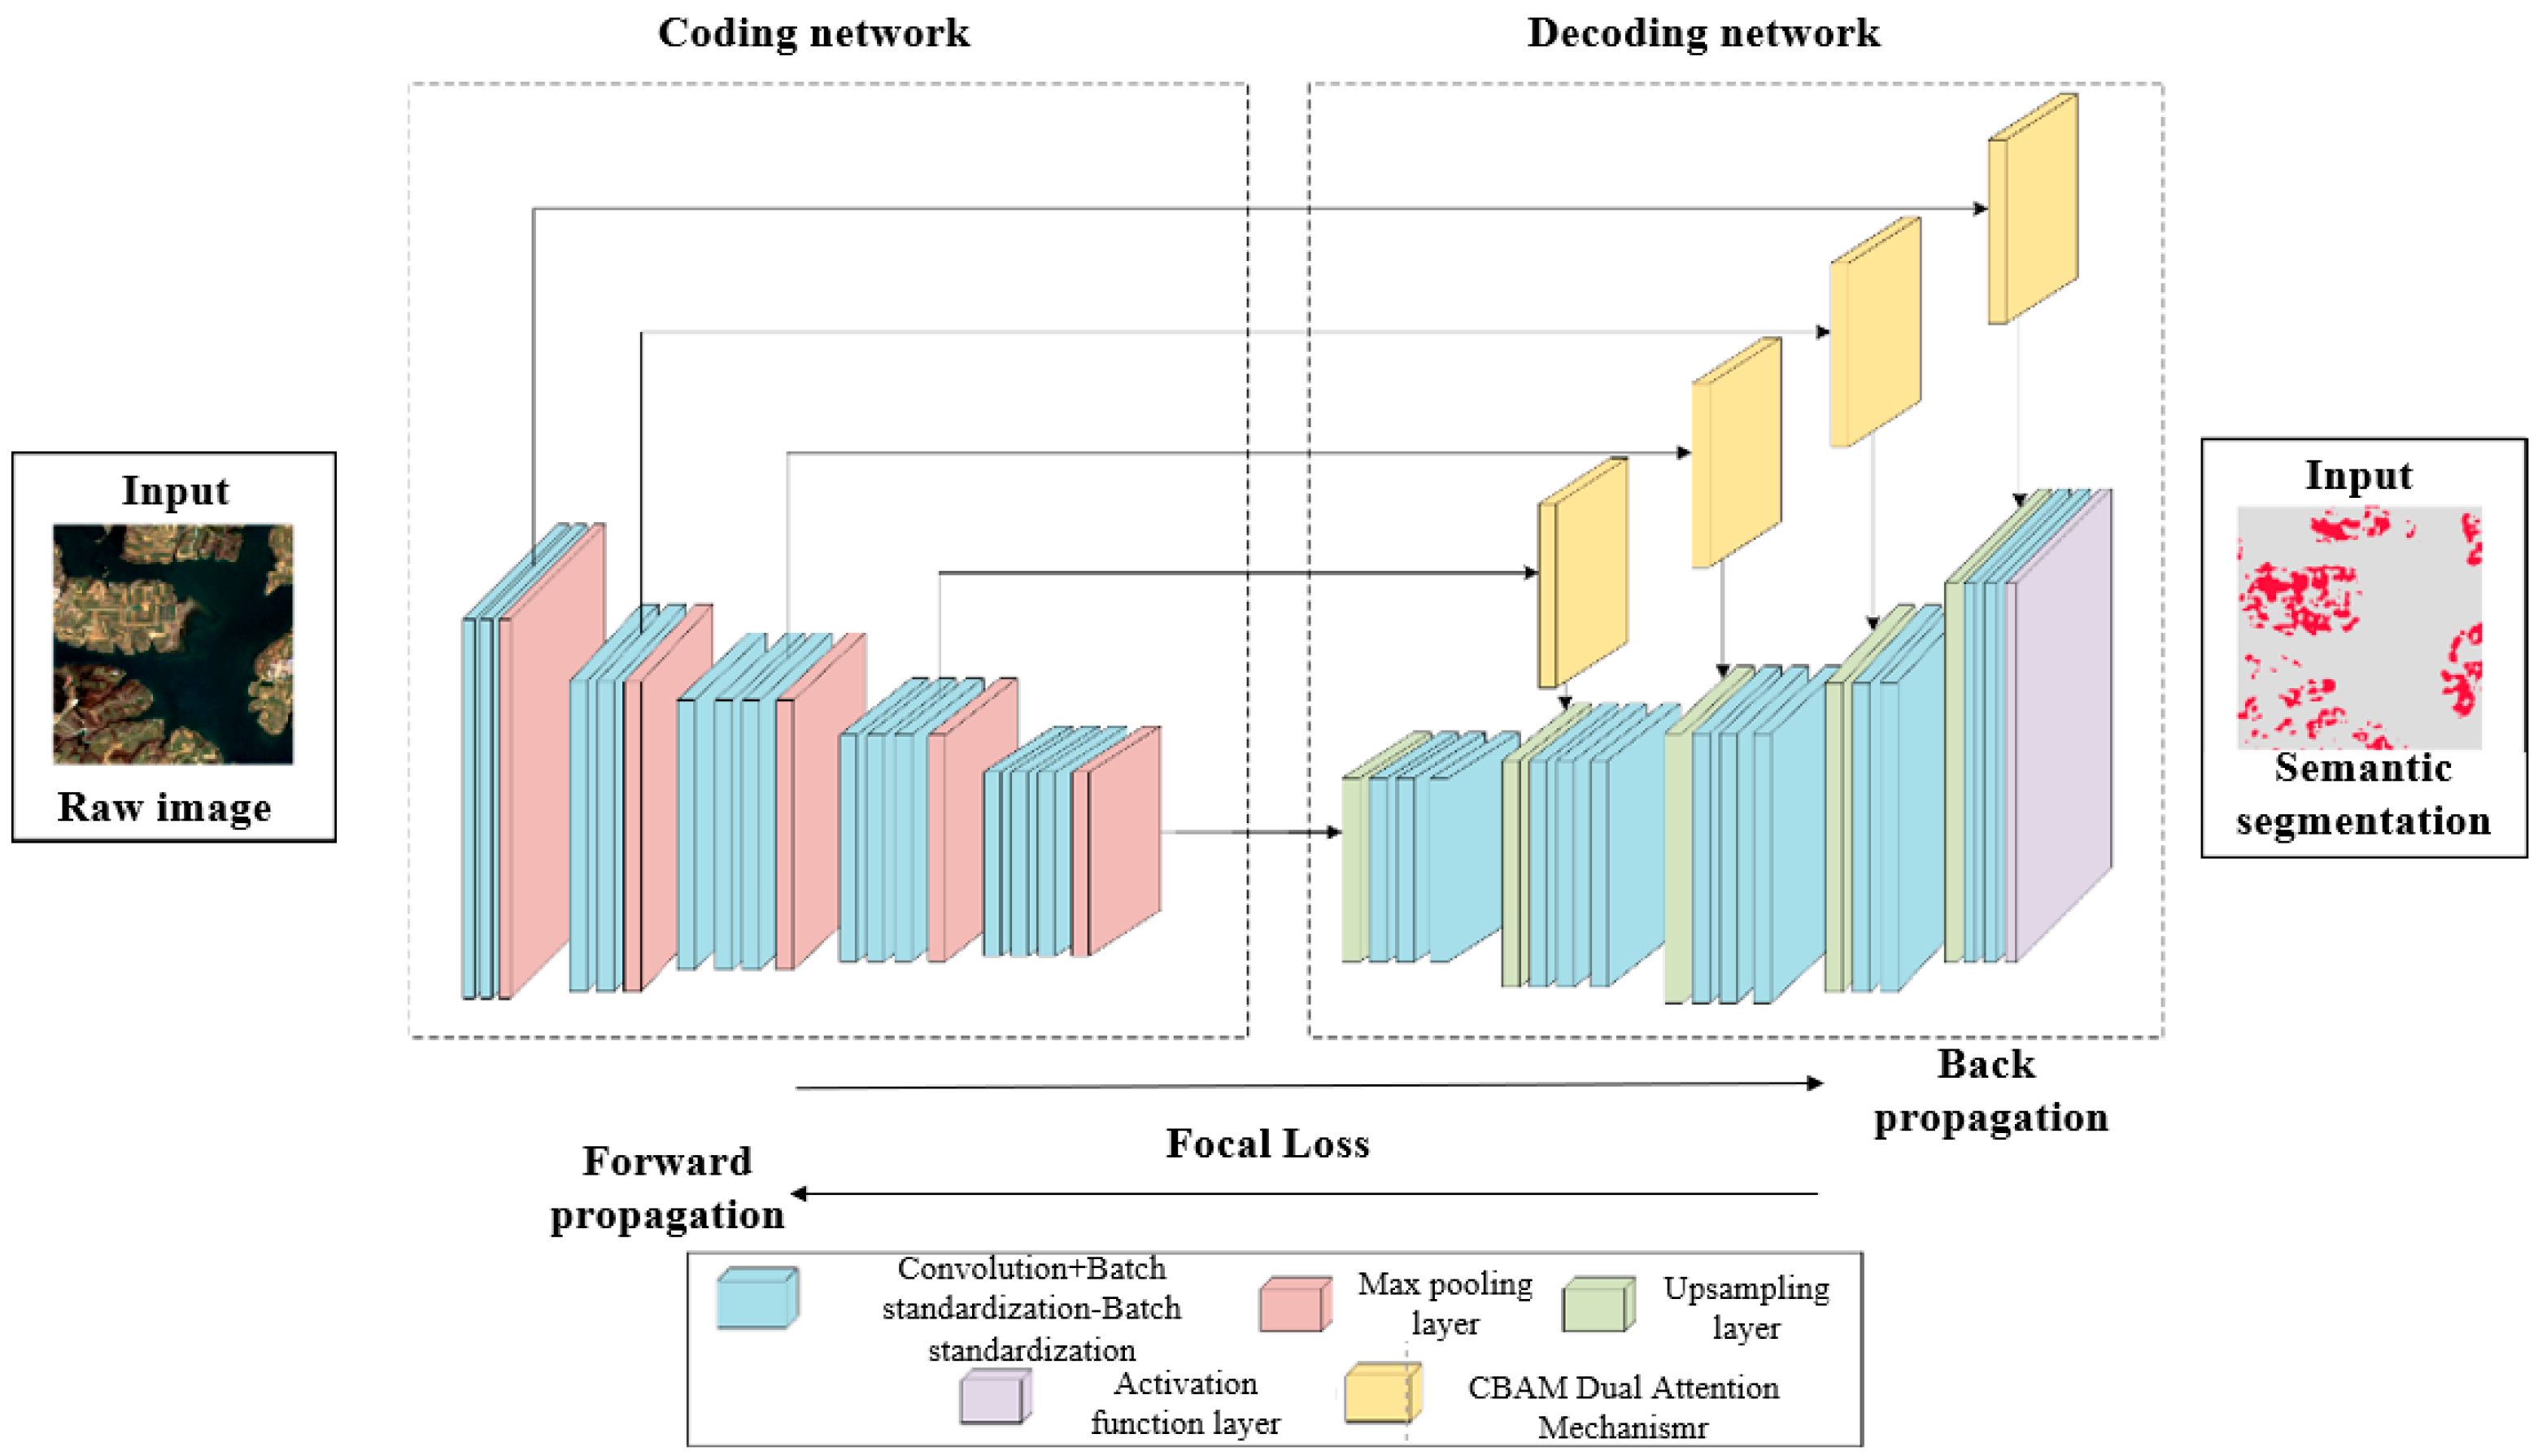
2.3.4. AOCF-SegNet Model Construction

Remote sensing image recognition often faces challenges with small targets that carry limited information, leading to inaccurate positioning in existing semantic segmentation methods, which impacts performance. In this study, apple orchards are small targets with few pixels and limited feature information, making network training more difficult and distinguishing them from similar objects challenging [44]. Therefore, a classification model tailored for apple orchards is needed, using classical semantic segmentation models.
This study compared apple recognition results using three classical semantic segmentation models: FCN-8s [45], U-Net [46], and SegNet [47]. FCN-8s is a semantic segmentation method based on a fully convolutional network (FCN). It integrates features from different depth layers through skip connections, preserving the high-level semantic information of deep networks while leveraging the detailed features from shallow networks, thereby enhancing segmentation accuracy. U-Net, another fully convolutional network, adopts an encoder–decoder architecture. By combining low-resolution deep features from the encoder with high-resolution shallow features directly transmitted to the decoder, U-Net fully utilizes both advantages. This design not only enables precise semantic recognition but also achieves fine-grained pixel-level segmentation. SegNet shares structural similarity with the FCN but differs in feature extraction and upsampling processes. Unlike other models, SegNet records only the maximum indices during pooling instead of storing the entire feature map. This significantly reduces computational resource consumption, particularly improving memory efficiency and processing speed. During the decoding stage, SegNet performs precise upsampling using max-pooling indices, effectively restoring the spatial resolution of the feature maps. Additionally, SegNet captures relationships between individual pixels and their surrounding context, making it particularly suitable for scene analysis tasks. As a result, it exhibits higher sensitivity in small object recognition. However, in apple orchard identification, the SegNet model is prone to false positives and false negatives (see Section 3.3). Although the use of multi-temporal imagery improves the results to some extent, noticeable misclassification and omission errors still persist, necessitating model improvements. Based on the evaluation of model characteristics and classification performance, SegNet, which demonstrated the best performance, was selected as the foundational model for further improvement.
The improved SegNet model (AOCF-SegNet model) structure, as shown in Figure 5, mainly consists of three parts. The first part is the encoder part. Image features are extracted in the form of 2D convolution with a convolution kernel size of 3 × 3, and the number of filters is gradually increased with the deepening of the network, a total of four layers of downsampling structure are passed, and Linear rectification function ReLU is used as the activation function. The second part is the decoder. Each convolutional block within the decoder is composed of four functional layers. The encoder performs downsampling through pooling operations while retaining sampling indices for use during the decoding process. The final convolutional layer applies a sigmoid activation function to introduce nonlinearity. A dual-attention mechanism based on the Convolutional Block Attention Module (CBAM) is integrated between the encoder and decoder, specifically embedded between the downsampling and upsampling modules [48]. The attention module takes the output of the encoder as input and utilizes low-level features to assist high-level features in restoring spatial information, thereby enhancing attention to critical features and reducing the loss of important information. The third part is the calculation of the loss function. When the model is propagated forward and backward to calculate the loss function, the original cross entropy loss function is improved to the Focal Loss function with a weight factor and a modulation factor in order to alleviate the problem of unbalanced samples of apple orchards and background objects. The CBAM dual-attention mechanism in the AOCF-SegNet model proposed in this study plays the role of enhancing the low-level feature information useful for classification, does not overuse low-level features, has the effect of eliminating noise, and strengthens the attention to small target features. The Focal Loss function effectively addresses the issue of sample imbalance by balancing the quantity of positive and negative samples. The formula of Focal Loss is shown in (1).
F o c a l   L o s s = ( 1 p t ) γ l o g ( p t )
where γ is the focusing parameter that controls the strength of modulation applied to well-classified examples. p t denotes the predicted probability for the ground-truth class. Specifically, p t = p if the true class label is 1, and p t = 1 − p if the true class label is 0. Here, p represents the predicted probability that the sample belongs to the positive class [49].

Attention Mechanism

The attention mechanism enables neural networks to adaptively focus on salient regions or features in the input data, typically through channel attention, spatial attention, or a combination of both [50]. Channel attention aims to identify the most informative feature channels and assign higher weights to those carrying significant semantic information, allowing the network to prioritize them in subsequent computations. Spatial attention operates by evaluating spatial locations in the feature map to determine which regions are more informative, assigning higher weights to those areas to guide the network’s focus [51]. As the network depth increases, the semantic representation of small targets tends to become attenuated. Although shallow layers contain less abstract semantic information than deeper layers, they often preserve important semantic features of small targets. Therefore, introducing attention mechanisms into shallow layers can help improve the recognition accuracy of small objects.
The CBAM integrates both channel and spatial attention mechanisms, which are applied sequentially to the input feature map. This dual-attention strategy enables the model to adaptively identify informative features and localize target-relevant regions. Incorporating the CBAM into the original network structure enhances the model’s ability to focus on objects of interest, strengthens useful low-level features for classification, and avoids excessive reliance on irrelevant ones [52]. Moreover, it helps suppress noise and reinforces the representation of small target features, thereby improving the learning efficiency and overall classification performance.
The CBAM dual-attention mechanism features a parameter called Ratio, which serves as a scaling factor for the number of parameters when calculating weights within the network, potentially reducing the model’s complexity. In this study, while keeping other parameters constant, we conducted comparative research by setting the Ratio to 4, 8, and 16, with all other parameters initialized to default values. The optimal Ratio ultimately selected was 4.

Loss Function

The loss function is the function that calculates the difference between the predicted value and the true value. The samples are propagated forward through the model to obtain the predicted value, and the model will update the model parameters according to the loss value back propagation to reduce the loss value. Focal Loss is designed to address class imbalance by assigning lower weights to easily classified examples. This is particularly beneficial for small target segmentation tasks, which are more sensitive to class imbalance. In such scenarios, it is often difficult to balance the contributions of positive and negative samples or to prevent the model from being dominated by easily classified examples. Focal Loss mitigates these issues by adaptively down-weighting the loss from well-classified samples and emphasizing hard examples during training.
The loss function used in this study is Focal Loss, which includes a weighting factor alpha and a modulation factor gamma. Alpha adjusts the impact of different sample quantities on the loss, while gamma controls the effect of samples with varying learning difficulties. In this study, the weight factor was set to 0.1 by calculating the proportion of apple orchards in the sample set. The modulation factor was set to 0.5, 1, 2 and 5, respectively, for comparative study when other parameters were unchanged, and the final modulation factor parameter was 1.

Hyperparameter Optimization

Hyperparameters are parameters that can be manually tuned to optimize the model, rather than learned by the deep learning algorithm itself. The commonly used hyperparameters are optimizer, learning rate, batch size, training iterations, input size, etc. This study mainly optimized three hyperparameters: optimizer, learning rate, and batch size. The number of training iterations and the input size were uniformly set to 100 times and 256 × 256, respectively. When the dual-attention mechanism was added to the improved model, the scaling Ratio of the number of parameters was also optimized, and the weight factor alpha and modulation factor gamma were also optimized when Focal Loss was added. During hyperparameter tuning, model training was performed on the training set, and performance was evaluated on the validation set to determine the optimal hyperparameter configuration.
In this study, the Stochastic Gradient Descent algorithm (SGD) and Adaptive Momentum estimation algorithm (Adam) were selected as two optimizers in the experiment. SGD has the advantage of fast training speed, but it is easy to fall into the local minimum. And the Adam optimizer has less demand for memory and can set the adaptive vector in the training process. The other parameters in the optimizer except the learning rate were kept at their default values, and the performance of the models using the two optimizers were compared under the same parameters. The optimal optimizers for single-temporal original band imagery and multi-temporal optimized feature imagery were obtained as SGD and Adam, respectively.
Learning rate is an important parameter of the deep learning algorithm that can evaluate the loss function of the gradient and adjust the network weights to guide the model. For other parameters that had the same initial vector values, they were set to 0.01, 0.001, 0.0001, 0.00001, and 0.000001 during model training to assess the performance of the model under different initial vectors. The optimal learning rates of single-temporal original band imagery and multi-temporal optimized feature imagery were 1 × 10⁻⁵ and 1 × 10⁻⁴, respectively.
The batch size and depth of the learning algorithm is an important parameter that represents the input sample size of the model. An appropriate batch size contributes to the stable convergence of the model. In this study, the initial batch size was set to 10, 20, and 30 for a comparative study with the same parameters, and the optimal batch size was obtained to be 10.

2.3.5. Accuracy Assessment

To comprehensively evaluate the model’s performance, this study employs four commonly used evaluation metrics: overall accuracy (OA), F1-Score, Mean Intersection over Union (MIoU), and Frequency Weighted Intersection over Union (FWIoU). The formulas are shown in (2) to (5).
OA = i = 1 n T i i N
F 1 i = 2 × T i i j = 1 n T j i × T i i j = 1 n T i j T i i j = 1 n T j i + T i i j = 1 n T i j
MIoU = 1 n × i 1 n T i i T i i + j i T i j + j i T j i
FWIoU = i = 1 n i = 1 n T i j N T i i T i i + j i T i j + j i T j i
Note: n is the dimension of the confusion matrix, representing the total number of classes in the classification task. N is the total number of pixels or samples involved in the accuracy assessment. T i j is the number of pixels in the confusion matrix whose true class is i and predicted class is j. T i i is the number of correctly predicted pixels in class i.
Overall accuracy (OA) represents the proportion of correctly classified pixels to the total pixels, providing an intuitive measure of the model’s overall classification accuracy. The F1-Score is the harmonic mean of Precision and Recall, used to comprehensively assess the balance of the model’s classification performance. Unlike User Accuracy (UA), the F1-Score focuses more on whether the model can accurately and comprehensively identify target classes. This makes it particularly suitable for evaluating the model’s overall performance in object recognition, avoiding assessment bias caused by imbalanced class distributions. Mean Intersection over Union (MIoU) is calculated as the average IoU (Intersection over Union) between the predicted results and ground truth labels, serving as an indicator of the segmentation accuracy for each class. Frequency Weighted Intersection over Union (FWIoU) extends MIoU by incorporating class frequency weights, further considering the impact of class distribution on model performance. This metric provides a more comprehensive reflection of the model’s effectiveness in classification tasks.

3. Results

3.1. Multi-Temporal Feature Variable Selection

The analysis based on field samples utilized the spectral characteristics of different phenological stages from Sentinel-2 (T1–T6) to determine the most suitable phenological period for crop classification. This study focused on eight representative land cover types in the study area, including grass, woodland, corn, peanut, cherry, peach, pear, and apple. As shown in Figure 6a–c, the eight land cover types exhibit distinct seasonal spectral patterns. The reflectance trends of apples in the three visible light bands are almost identical across the T1–T6 stages. By calculating the reflectance differences between apples at each stage and other crops, combined with the analysis of Figure 6a–c, it is evident that the T6 stage exhibits the most significant difference. This is attributed to the fact that during the apple maturation stage, most other crops have already been harvested, with some grain crops entirely removed. Therefore, T6 is considered the optimal period for identifying apple orchards using Sentinel-2 imagery. Through the optimized features (see Section 2.3.3), this study used the time phase and nine spectral indices of Sentinel-2 imagery to extract different features of different phases, as shown in Figure 6d–l.
MTCI can reflect changes in the chlorophyll content of vegetation, and a higher chlorophyll concentration generally indicates better index performance. The TVI has a higher resistance to saturation than the NDVI and can effectively reflect chlorophyll content. As shown in Figure 6h,l, cherry and pear trees are in the flowering stage at T1, while peanuts and other ground crops that are easily confused with apples are usually not yet sown. Obvious differences in the MTCI and TVI can be observed between apples and other ground crops.
The EVI can reflect the changes in vegetation canopy structure while suppressing the effects of soil and atmosphere. The RVI reflects the difference in reflectance between vegetation in near-infrared and red light bands and enhances the radiation difference between vegetation and soil. The MCARI can reflect the changes in vegetation chlorophyll content and suppress the effects of canopy non-photosynthetic substances and soil reflectance. The NIRv can mitigate the influence of soil in high biomass regions. Figure 6f–i show significant differences in the EVI, RVI, MCARI, and NIRv among apples, cherries, and woodland. Compared to other land cover types with similar spectral values, apples can be better distinguished during the T2 period, effectively separating them from other crops.
NDre3 can reflect the canopy cover degree, which is suitable for high-density vegetation areas and is commonly used to monitor crops in the mature stage. As shown in Figure 6j, at T3, cherry trees have already reached the mature harvesting stage, and there are clear differences between apples and other vegetation types.
The MRESR reflects chlorophyll content and is commonly used for monitoring vegetation chlorophyll levels. Figure 6k shows that vegetation such as peanut and pear trees, which are easily confused with apples at T5, are already in the harvesting period, and their MRESR values differ significantly to those of apple trees.
NDVIre32 can reflect the health status of vegetation, especially suitable for mature stage crops with high chlorophyll concentration. It can be found from Figure 6l that apples have obvious differences compared to other ground crops in young fruit in stage T3 and mature stage T6.
In summary, based on the single-temporal original band images B2 (T6), B3 (T6), and B4 (T6) and the multi-temporal optimized feature imagery, the spectral index features the MTCI (T1), TVI (T1), EVI (T2), RVI (T2), MCARI (T2), NIRv (T2), NDre3 (T3), MRESR (T5), and NDVIre32 (T3)(T6) of the 10 different phases selected above were added.

3.2. Models and Phases for Apple Mapping

This study compared classification results between the single-temporal original band image of Sentinel-2 at T6 and the multi-temporal feature-optimized imagery. As the results show in Table 3 and Table 4, the data with multi-temporal optimized features have good segmentation results when using different semantic segmentation models, and the accuracy of each index is obviously higher than that of the single-temporal image. Among the three models for multi-temporal images, SegNet has the best performance: its OA, F1-Score, MIoU, and FWIoU are 6.60%, 1.78%, 3.45%, and 6.36% higher than those of FCN-8s, respectively. Compared to the U-Net model, the performance metric values are 3.61%, 3.93%, 3.72% and 3.65% higher, respectively.

3.3. Apple Orchard Mapping with AOCF-SegNet Model

Apple orchard identification was conducted using the AOCF-SegNet model based on multi-temporal feature-optimized images, and the results were qualitatively compared to those of SegNet at different temporal stages (Figure 7). Under the condition of single-temporal original band images, SegNet resulted in the severe misclassification of apple orchards (Figure 7c). After applying multi-temporal feature-optimized images (Figure 7d), misclassification was significantly reduced, although there were still noticeable omissions in some areas. However, the AOCF-SegNet model (Figure 7e) produced more complete extraction results, effectively capturing detailed information within the apple orchards.
The AOCF-SegNet model was employed to extract apple orchards from the test set of multi-temporal feature-optimized images, and its segmentation performance was compared to that of the SegNet model (Table 4). Under the use of multi-temporal feature-optimized images, AOCF-SegNet has demonstrated a significant improvement in recognition accuracy compared to SegNet. The OA, F1-Score, MIoU, and FWIoU evaluation indices have increased by 3.00%, 4.74%, 3.86%, and 3.15%, respectively. Therefore, AOCF-SegNet shows better performance in apple orchard identification, proving that the addition of the CBAM dual-attention mechanism and the Focal Loss function is significantly effective.
This study evaluated the impact of two modules on the improved model by controlling module variables. It used a test set of multi-temporal optimal feature images with better segmentation effects to evaluate the accuracy of the original SegNet model, the model with the CBAM dual-attention mechanism added alone (SegNet + CBAM), the model with the custom loss function Focal Loss added alone (SegNet + Focal Loss), and the model with both the CBAM dual-attention mechanism and Focal Loss custom loss function added (AOCF-SegNet). The SegNet model with either the CBAM dual-attention mechanism module or the Focal Loss custom loss function added achieves a certain amount of improvement in classification accuracy (Table 4). The evaluation metrics of using both the CBAM and Focal Loss together show improvement over models using a single module alone. Therefore, it is necessary to use the CBAM and Focal Loss simultaneously on the basis of SegNet.

3.4. Apple Orchard Extraction Maps in Yantai

Based on Sentinel-2 multi-temporal optimized feature images of Yantai City, Shandong Province, this study used the AOCF-SegNet semantic segmentation model to predict the distribution of apple orchards in Yantai City, and the results are shown in Figure 8. It can be seen from Figure 8 that apple orchards are mainly distributed in Qixia City, Zhaoyuan City, Mouping City and Penglai City. There are also some apple orchards in Fushan District, Laiyang City, Haiyang City and other districts and counties, while those in Laizhou City and Longkou City are less distributed.
As shown in Figure 9, except for the large differences between the predicted results of Fushan District and Laizhou City and the yearbook data, the apple orchard area of other districts and cities tends to be consistent with the yearbook data. According to the Statistical Yearbook of Shandong Province, the area of apple orchards in Yantai is about 103,800 ha, while the predicted area is 132,900 ha. The relative error between the predicted and actual area is about 28.03%, corresponding to an area consistency of approximately 71.97%. The proposed method demonstrates sufficient generalization capability, which can meet the demand for large-scale apple orchard mapping using multi-temporal remote sensing images.

4. Discussion

4.1. AOCF-SegNet Semantic Segmentation Network

Considering the phenomenon of “same spectrum, different objects” among orchards, existing studies often leverage the phenological information of different crops to improve mapping accuracy [21]. However, their limitation lies in focusing solely on the phenological analysis of orchards while neglecting the integration of phenology with broader temporal information. Although existing research on orchard identification has made some progress, most studies remain at the level of overall orchard recognition, making it difficult to achieve the fine-grained identification of individual crops [3]. Moreover, targeted studies on individual orchards, which occupy a relatively small proportion in imagery, are limited, thereby constraining the potential for large-scale mapping. This method represents a novel approach by fully incorporating phenological information and integrating temporal and spectral features to obtain multi-temporal imagery. Additionally, to address the issue of apple orchards occupying a relatively small proportion in the images, CBAM and Focal Loss modules were introduced into the SegNet model. The AOCF-SegNet model demonstrates superior performance compared to both the original model and models with only a single module introduced, providing a new perspective for the semantic segmentation and extraction of small target crops.

4.2. Automatic Construction of Apple Orchard Dataset

In semantic segmentation tasks, the construction of datasets directly impacts the model’s learning and generalization abilities. However, labeling datasets is time-consuming and labor-intensive, posing great challenges in ensuring sample diversity and balance. Thus, constructing high-quality datasets is a crucial step and a major difficulty in achieving efficient semantic segmentation. The method proposed in this study for constructing semantic segmentation datasets involves fusing multi-source remote sensing imagery with a combination of machine learning pre-classification and manual correction. High-resolution imagery holds significant potential for precision agriculture applications. However, the large-scale identification of apple orchard information frequently encounters challenges due to limitations in spatial resolution. Additionally, the availability of high-resolution imagery is constrained by cost, making widespread use difficult. Compared to remote sensing imagery such as MODIS and the Landsat series, Sentinel-2, with its 10 m resolution, currently offers the highest publicly available spatial resolution. Additionally, high-resolution remote sensing imagery, such as GF, QuickBird, and SPOT, incurs high costs for acquiring data over large areas, which limits its widespread application. Therefore, integrating Sentinel-2 imagery covering the entire study area with Google ultra-high-resolution imagery for selected subregions represents an innovative strategy for remote sensing image fusion and application. Random Forest is effective in handling and integrating features that may exhibit complex nonlinear relationships. It also enables the targeted selection of important features through feature importance evaluation. Moreover, by constructing multiple decision trees for classification, RF significantly improves recognition accuracy. However, its dependency on the initial cluster centers makes it prone to getting trapped in local optima. The K-means algorithm, on the other hand, is simple and does not require labeled samples, greatly enhancing operational efficiency. However, due to its sensitivity to the initialization of cluster centers, the K-means algorithm is prone to being trapped in local optima when the initial centers are poorly selected. The proposed sample generation method integrates the advantages and disadvantages of both approaches through result fusion, achieving a complementary effect [53]. Compared to traditional sample set construction methods, this approach not only reduces the workload of sample selection but also enhances operational efficiency through the mutual validation of results. It also provides a viable solution under conditions of limited training samples.

4.3. Potential Limitations

The accuracy of the method proposed in this study may be limited for several reasons. Firstly, Sentinel-2 experiences considerable cloud and rain coverage in some areas, leading to significant image loss after cloud removal [54]. To address this, we employed image completion methods using imagery from adjacent years. However, more advanced image completion methods, such as the use of contemporaneous high-resolution remote sensing imagery, are worth further exploration. Furthermore, collecting a large number of field samples for large-scale apple orchard information extraction to further validate the method remains a challenge due to the difficulty of acquiring extensive field samples over large areas. Lastly, constructing datasets for large study areas is challenging. The issue of dataset construction was addressed by validating machine learning and multi-source data fusion against each other. In this study, traditional models were used for dataset construction with machine learning models, and improvements upon the existing machine learning models could potentially yield better results. This study improves the model from the perspective of small sample learning. However, further exploration is warranted in enhancing the model from other perspectives, such as texture features and more models. Additionally, this study employs multi-temporal feature-optimized imagery for classification, incorporating different phenological characteristics selected through feature optimization. The contribution of each feature to the classification accuracy of the improved model deserves further study.

5. Conclusions

As a major economic crop, apples are vital for ensuring rural income stability and maintaining ecological balance. Accurately mapping large-scale apple orchards aids local management decision-making. This study conducted the mapping of apple orchards in Yantai City using multi-temporal Sentinel-2 imagery. The results demonstrate that datasets obtained through the pre-extraction of target features using multi-source data, combined with multi-temporal remote sensing imagery and improvements to the semantic segmentation model, can accomplish large-scale apple orchard information extraction. The main conclusions are as follows:
  • By classifying apple orchards using two machine learning methods and integrating the classification results, the data can be mutually validated, thereby enhancing the reliability of the sample set. This approach can address the challenges associated with constructing sample sets for apple orchard extraction from satellite imagery to some extent.
  • The SegNet model is more suitable for extracting apple orchard information compared to FCN-8s and U-Net. From the perspective of multi-temporal classification results, SegNet achieves the highest accuracy. The results of the SegNet model can delineate more regular boundaries between apple and non-apple areas, suppressing internal fragmentation and misclassification to a certain extent.
  • The AOCF-SegNet model can better extract information from apple orchards, effectively reducing the incidence of omissions and misclassifications. Compared to the original SegNet model, OA, F1-Score, MIoU, and FWIoU improved by 3.00%, 4.74%, 3.86%, and 3.15%, respectively. In addition, the extracted area of the apple orchard showed high consistency with the statistical data, achieving an accuracy of 71.97%.
This study constructed multi-temporal feature-optimized imagery based on phenology and spectral characteristics and conducted an apple orchard identification experiment in Yantai City by improving classical semantic segmentation models. As a result, the proposed method is applicable to apple-growing regions with similar natural conditions but may have limited effectiveness in areas with significant phenological differences, indicating certain constraints in its generalizability. However, this research framework introduces an innovative approach and remains applicable for broader implementation. Accordingly, it can be further optimized in terms of phenological characteristics and other relevant factors based on specific research needs, enabling its application to the identification of other regions or different crops.

6. Patents

The related work generated from this study, “A method and device for recognizing spatial information of apple orchard (patent number: CN202410151838.4)”, has entered the substantive examination stage for an invention patent.

Author Contributions

Conceptualization, C.W. and J.Y.; Methodology, Y.L.; Project Administration, C.W., J.Y. and A.D.; Software, Y.L.; Supervision, J.Y., Y.Z. and Y.W.; Validation, Y.L., A.D. and K.T.; Visualization, Y.L., H.Z. and R.W.; Writing—Original Draft, C.W. and Y.L.; Writing—Review and Editing, C.W., J.Y., Y.Z., K.T. and B.W. All authors have read and agreed to the published version of the manuscript.

Funding

This research was funded by the National Key R&D Program of China, “study on farmland utilization dynamic monitoring and grain Productivity Evaluation Technology”, grant number 2022YFB3900025-4. The funding unit is the Ministry of Science and Technology of the People’s Republic of China.

Data Availability Statement

The raw data supporting the conclusions of this article will be made available by the authors on request.

Conflicts of Interest

The authors declare no conflicts of interest.

References

  1. Zhu, Y.; Yang, G.; Yang, H.; Wu, J.; Lei, L.; Zhao, F.; Fan, L.; Zhao, C. Identification of Apple Orchard Planting Year Based on Spatiotemporally Fused Satellite Images and Clustering Analysis of Foliage Phenophase. Remote Sens. 2020, 12, 1199. [Google Scholar] [CrossRef]
  2. Wang, J.; Liu, T. Spatiotemporal evolution and suitability of apple production in China from climate change and land use transfer perspectives. Food Energy Secur. 2022, 11, e386. [Google Scholar] [CrossRef]
  3. Li, J.; Yang, G.; Yang, H.; Xu, W.; Feng, H.; Xu, B.; Chen, R.; Zhang, C.; Wang, H. Orchard classification based on super-pixels and deep learning with sparse optical images. Comput. Electron. Agric. 2023, 215, 108379. [Google Scholar] [CrossRef]
  4. Ou, C.; Yang, J.; Du, Z.; Zhang, T.; Niu, B.; Feng, Q.; Liu, Y.; Zhu, D. Landsat-Derived Annual Maps of Agricultural Greenhouse in Shandong Province, China from 1989 to 2018. Remote Sens. 2021, 13, 4830. [Google Scholar] [CrossRef]
  5. Peña, M.A.; Brenning, A. Assessing fruit-tree crop classification from Landsat-8 time series for the Maipo Valley, Chile. Remote Sens. Environ. 2021, 171, 234–244. [Google Scholar] [CrossRef]
  6. Morell-Monzó, S.; Sebastiá-Frasquet, M.-T.; Estornell, J.; Moltó, E. Detecting abandoned citrus crops using Sentinel-2 time series. A case study in the Comunitat Valenciana region (Spain). ISPRS J. Photogramm. Remote Sens. 2023, 201, 54–66. [Google Scholar] [CrossRef]
  7. Xu, W.; Li, Z.; Lin, H.; Shao, G.; Zhao, F.; Wang, H.; Cheng, J.; Lei, L.; Chen, R.; Han, S.; et al. Mapping Fruit-Tree Plantation Using Sentinel-1/2 Time Series Images with Multi-Index Entropy Weighting Dynamic Time Warping Method. Remote Sens. 2024, 16, 3390. [Google Scholar] [CrossRef]
  8. Peng, Y.; Qiu, B.; Tang, Z.; Xu, W.; Yang, P.; Wu, W.; Chen, X.; Zhu, X.; Zhu, P.; Zhang, X.; et al. Where is tea grown in the world: A robust mapping framework for agroforestry crop with knowledge graph and sentinels images. Remote Sens. Environ. 2024, 303, 114016. [Google Scholar] [CrossRef]
  9. Chen, H.; Li, H.; Liu, Z.; Zhang, C.; Zhang, S.; Atkinson, P.M. A novel Greenness and Water Content Composite Index (GWCCI) for soybean mapping from single remotely sensed multispectral images. Remote Sens. Environ. 2023, 295, 113679. [Google Scholar] [CrossRef]
  10. Kussul, N.; Lavreniuk, M.; Skakun, S.; Shelestov, A. Deep Learning Classification of Land Cover and Crop Types Using Remote Sensing Data. IEEE Geosci. Remote Sens. Lett. 2017, 14, 778–782. [Google Scholar] [CrossRef]
  11. Xu, Y.; Zhou, J.; Zhang, Z. A new Bayesian semi-supervised active learning framework for large-scale crop mapping using Sentinel-2 imagery. ISPRS J. Photogramm. Remote Sens. 2024, 209, 17–34. [Google Scholar] [CrossRef]
  12. Amorós-López, J.; Gómez-Chova, L.; Alonso, L.; Guanter, L.; Zurita-Milla, R.; Moreno, J.; Camps-Valls, G. Multitemporal fusion of Landsat/TM and ENVISAT/MERIS for crop monitoring. Int. J. Appl. Earth Obs. Geoinf. 2013, 23, 132–141. [Google Scholar] [CrossRef]
  13. Zhang, T.; Hu, D.; Wu, C.; Liu, Y.; Yang, J.; Tang, K. Large-scale apple orchard mapping from multi-source data using the semantic segmentation model with image-to-image translation and transfer learning. Comput. Electron. Agric. 2023, 213, 108204. [Google Scholar] [CrossRef]
  14. Yan, C.; Li, Z.; Zhang, Z.; Sun, Y.; Wang, Y.; Xin, Q. High-resolution mapping of paddy rice fields from unmanned airborne vehicle images using enhanced-TransUnet. Comput. Electron. Agric. 2023, 210, 107867. [Google Scholar] [CrossRef]
  15. Liu, J.; Feng, Q.; Gong, J.; Zhou, J.; Liang, J.; Li, Y. Winter wheat mapping using a random forest classifier combined with multitemporal and multi-sensor data. Int. J. Digit. Earth 2018, 11, 783–802. [Google Scholar] [CrossRef]
  16. Zhou, X.-X.; Li, Y.-Y.; Luo, Y.-K.; Sun, Y.-W.; Su, Y.-J.; Tan, C.-W.; Liu, Y.-J. Research on remote sensing classification of fruit trees based on Sentinel-2 multi-temporal imageries. Sci. Rep. 2022, 12, 11549. [Google Scholar] [CrossRef]
  17. Chen, R.; Li, X.; Zhang, Y.; Zhou, P.; Wang, Y.; Shi, L.; Jiang, L.; Ling, F.; Du, Y. Spatiotemporal Continuous Impervious Surface Mapping by Fusion of Landsat Time Series Data and Google Earth Imagery. Remote Sens. 2021, 13, 2409. [Google Scholar] [CrossRef]
  18. Phalke, A.R.; Özdoğan, M.; Thenkabail, P.S.; Erickson, T.; Gorelick, N.; Yadav, K.; Congalton, R.G. Mapping croplands of Europe, Middle East, Russia, and Central Asia using Landsat, Random Forest, and Google Earth Engine. ISPRS J. Photogramm. Remote Sens. 2020, 167, 104–122. [Google Scholar] [CrossRef]
  19. Cai, Y.; Xu, X.; Zhu, P.; Nie, S.; Wang, C.; Xiong, Y.; Liu, X. Unveiling spatiotemporal tree cover patterns in China: The first 30 m annual tree cover mapping from 1985 to 2023. ISPRS J. Photogramm. Remote Sens. 2024, 216, 240–258. [Google Scholar] [CrossRef]
  20. Tian, J.; Wang, L.; Diao, C.; Zhang, Y.; Jia, M.; Zhu, L.; Xu, M.; Li, X.; Gong, H. National scale sub-meter mangrove mapping using an augmented border training sample method. ISPRS J. Photogramm. Remote Sens. 2025, 220, 156–171. [Google Scholar] [CrossRef]
  21. Chen, R.; Xiong, S.; Zhang, N.; Fan, Z.; Qi, N.; Fan, Y.; Feng, H.; Ma, X.; Yang, H.; Yang, G.; et al. Fine-scale classification of horticultural crops using Sentinel-2 time-series images in Linyi country, China. Comput. Electron. Agric. 2025, 236, 110425. [Google Scholar] [CrossRef]
  22. Turkoglu, M.O.; D’Aronco, S.; Perich, G.; Liebisch, F.; Streit, C.; Schindler, K.; Wegner, J.D. Crop mapping from image time series: Deep learning with multi-scale label hierarchies. Remote Sens. Environ. 2021, 264, 112603. [Google Scholar] [CrossRef]
  23. Wang, B.; Zhao, H.; Wang, X.; Lyu, G.; Chen, K.; Xu, J.; Cui, G.; Zhong, L.; Yu, L.; Huang, H.; et al. Bamboo classification based on GEDI, time-series Sentinel-2 images and whale-optimized, dual-channel DenseNet: A case study in Zhejiang province, China. ISPRS J. Photogramm. Remote Sens. 2024, 209, 312–323. [Google Scholar] [CrossRef]
  24. Zhang, C.; Valente, J.; Wang, W.; Guo, L.; Tubau Comas, A.; Van Dalfsen, P.; Rijk, B.; Kooistra, L. Feasibility assessment of tree-level flower intensity quantification from UAV RGB imagery: A triennial study in an apple orchard. ISPRS J. Photogramm. Remote Sens. 2023, 197, 256–273. [Google Scholar] [CrossRef]
  25. Li, W.; Dong, R.; Fu, H.; Wang, J.; Yu, L.; Gong, P. Integrating Google Earth imagery with Landsat data to improve 30-m resolution land cover mapping. Remote Sens. Environ. 2020, 237, 111563. [Google Scholar] [CrossRef]
  26. Fu, Y.; Li, J.; Weng, Q.; Zheng, Q.; Li, L.; Dai, S.; Guo, B. Characterizing the spatial pattern of annual urban growth by using time series Landsat imagery. Sci. Total Environ. 2019, 666, 274–284. [Google Scholar] [CrossRef] [PubMed]
  27. Li, Z.; Xuan, F.; Dong, Y.; Huang, X.; Liu, H.; Zeng, Y.; Su, W.; Huang, J.; Li, X. Performance of GEDI data combined with Sentinel-2 images for automatic labelling of wall-to-wall corn mapping. Int. J. Appl. Earth Obs. Geoinf. 2024, 127, 103643. [Google Scholar] [CrossRef]
  28. Sun, Y.; Qin, Q.; Ren, H.; Zhang, Y. Decameter Cropland LAI/FPAR Estimation From Sentinel-2 Imagery Using Google Earth Engine. IEEE Trans. Geosci. Remote Sens. 2022, 60, 1–14. [Google Scholar] [CrossRef]
  29. Zhao, D.; Huang, J.; Li, Z.; Yu, G.; Shen, H. Dynamic monitoring and analysis of chlorophyll-a concentrations in global lakes using Sentinel-2 images in Google Earth Engine. Sci. Total Environ. 2024, 912, 169152. [Google Scholar] [CrossRef]
  30. Breiman, L. Random Forests. Mach. Learn. 2001, 45, 5–32. [Google Scholar] [CrossRef]
  31. Rodriguez-Galiano, V.F.; Ghimire, B.; Rogan, J.; Chica-Olmo, M.; Rigol-Sanchez, J.P. An assessment of the effectiveness of a random forest classifier for land-cover classification. ISPRS J. Photogramm. Remote Sens. 2012, 67, 93–104. [Google Scholar] [CrossRef]
  32. Kumar, M.; Bhattacharya, B.K.; Pandya, M.R.; Handique, B.K. Machine learning based plot level rice lodging assessment using multi-spectral UAV remote sensing. Comput. Electron. Agric. 2024, 219, 108754. [Google Scholar] [CrossRef]
  33. Li, Z.; Deng, X.; Lan, Y.; Liu, C.; Qing, J. Fruit tree canopy segmentation from UAV orthophoto maps based on a lightweight improved U-Net. Comput. Electron. Agric. 2024, 217, 108538. [Google Scholar] [CrossRef]
  34. Duan, M.; Song, X.; Liu, X.; Cui, D.; Zhang, X. Mapping the soil types combining multi-temporal remote sensing data with texture features. Comput. Electron. Agric. 2022, 200, 107230. [Google Scholar] [CrossRef]
  35. Cai, X.; Wu, L.; Li, Y.; Lei, S.; Xu, J.; Lyu, H.; Li, J.; Wang, H.; Dong, X.; Zhu, Y.; et al. Remote sensing identification of urban water pollution source types using hyperspectral data. J. Hazard. Mater. 2023, 459, 132080. [Google Scholar] [CrossRef]
  36. Dash, J.; Curran, P.J. Evaluation of the MERIS terrestrial chlorophyll index (MTCI). Adv. Space Res. 2007, 39, 100–104. [Google Scholar] [CrossRef]
  37. Perry, C.R.; Lautenschlager, L.F. Functional equivalence of spectral vegetation indices. Remote Sens. Environ. 1984, 14, 169–182. [Google Scholar] [CrossRef]
  38. Gitelson, A.A.; Merzlyak, M.N. Remote sensing of chlorophyll concentration in higher plant leaves. Adv. Space Res. 1998, 22, 689–692. [Google Scholar] [CrossRef]
  39. Jordan, C.F. Derivation of Leaf-Area Index from Quality of Light on the Forest Floor. Ecology 1969, 50, 663–666. [Google Scholar] [CrossRef]
  40. Daughtry, C. Estimating Corn Leaf Chlorophyll Concentration from Leaf and Canopy Reflectance. Remote Sens. Environ. 2000, 74, 229–239. [Google Scholar] [CrossRef]
  41. Grayson, B.; Christopher, B.; Joseph, A. Canopy near-infrared reflectance and terrestrial photosynthesis. Sci. Adv. 2017, 3, e1602244. [Google Scholar] [CrossRef]
  42. Evangelides, C.; Nobajas, A. Red-Edge Normalised Difference Vegetation Index (NDVI705) from Sentinel-2 imagery to assess post-fire regeneration. Remote Sens. Appl. Soc. Environ. 2020, 17, 100283. [Google Scholar] [CrossRef]
  43. Sims, D.A.; Gamon, J.A. Relationships between leaf pigment content and spectral reflectance across a wide range of species, leaf structures and developmental stages. Remote Sens. Environ. 2002, 81, 337–354. [Google Scholar] [CrossRef]
  44. Wu, C.; Jia, W.; Yang, J.; Zhang, T.; Dai, A.; Zhou, H. Economic Fruit Forest Classification Based on Improved U-Net Model in UAV Multispectral Imagery. Remote Sens. 2023, 15, 2500. [Google Scholar] [CrossRef]
  45. Shelhamer, E.; Long, J.; Darrell, T. Fully Convolutional Networks for Semantic Segmentation. IEEE Trans. Pattern Anal. Mach. Intell. 2017, 39, 640–651. [Google Scholar] [CrossRef]
  46. Ronneberger, O.; Fischer, P.; Brox, T. U-Net: Convolutional Networks for Biomedical Image Segmentation. arXiv 2015. [Google Scholar] [CrossRef]
  47. Badrinarayanan, V.; Kendall, A.; Cipolla, R. SegNet: A Deep Convolutional Encoder-Decoder Architecture for Image Segmentation. arXiv 2016. [Google Scholar] [CrossRef]
  48. Woo, S.; Park, J.; Lee, J.-Y.; Kweon, I.S. CBAM: Convolutional Block Attention Module. arXiv 2018. [Google Scholar] [CrossRef]
  49. Lin, T.-Y.; Goyal, P.; Girshick, R.; He, K.; Dollár, P. Focal Loss for Dense Object Detection. In Proceedings of the 2017 IEEE International Conference on Computer Vision (ICCV), Venice, Italy, 22–29 October 2017; pp. 2999–3007. [Google Scholar] [CrossRef]
  50. Vaswani, A.; Shazeer, N.; Parmar, N.; Uszkoreit, J.; Jones, L.; Gomez, A.; Kaiser, L.; Polosukhin, I. Attention is all you need. Neural Inf. Process. Syst. 2017, 30, 5998–6008. [Google Scholar] [CrossRef]
  51. Ghaffarian, S.; Valente, J.; Van Der Voort, M.; Tekinerdogan, B. Effect of Attention Mechanism in Deep Learning-Based Remote Sensing Image Processing: A Systematic Literature Review. Remote Sens. 2021, 13, 2965. [Google Scholar] [CrossRef]
  52. Du, L.; Lu, Z.; Li, D. Broodstock breeding behaviour recognition based on Resnet50-LSTM with CBAM attention mechanism. Comput. Electron. Agric. 2022, 202, 107404. [Google Scholar] [CrossRef]
  53. Zhang, C.; Zhang, H.; Tian, S. Phenology-assisted supervised paddy rice mapping with the Landsat imagery on Google Earth Engine: Experiments in Heilongjiang Province of China from 1990 to 2020. Comput. Electron. Agric. 2023, 212, 108105. [Google Scholar] [CrossRef]
  54. Li, Z.; Shen, H.; Weng, Q.; Zhang, Y.; Dou, P.; Zhang, L. Cloud and cloud shadow detection for optical satellite imagery: Features, algorithms, validation, and prospects. ISPRS J. Photogramm. Remote Sens. 2022, 188, 89–108. [Google Scholar] [CrossRef]
Figure 1. The specific location of the research area. (a). The location of the study area. (b). Topographic characteristics of the study area. Topographic data from the Digital Elevation Model (DEM).
Agronomy 15 01487 g001
Figure 2. Phenological calendar of apple.
Agronomy 15 01487 g002
Figure 3. The flowchart of apple mapping.
Agronomy 15 01487 g003
Figure 4. Dataset enhancement processing schematic drawing. (a) Raw image. (b) Horizontal flip. (c) Vertical flip. (d) Mirror enhancement.
Agronomy 15 01487 g004
Figure 5. The AOCF-SegNet model structure.
Agronomy 15 01487 g005
Figure 6. A comparison of spectral curves for the eight main land cover types in the study area: (ac) visible light (blue, green, red) spectral reflectance curves for each land cover type from Sentinel-2 imagery, (dl) spectral index reflectance curves for each land cover type from Sentinel-2 imagery. Note: The spectral indices are the EVI, RVI, MCARI, MRESR, MTCI, NDre3, NDVIre32, NIRv, and TVI. The legends in Figure 6a–l are identical, so the legend is displayed only in Figure 6a to avoid repetition.
Agronomy 15 01487 g006aAgronomy 15 01487 g006b
Figure 7. A comparison of the effects of different SegNet models for different images. The blue dashed box indicates the comparison of classification results from different methods at the same location. Red represents the apple region, and gray is the non-apple region. (a) Raw image. (b) Original label. (c) Single-temporal + SegNet. (d) Multi-temporal +SegNet. (e) Multi-temporal +AOCF-SegNet. Note: The blue boxes in Figure 7c–e show the classification results of the same location under different conditions.
Agronomy 15 01487 g007
Figure 8. Extraction results of apple orchard in Yantai City.
Agronomy 15 01487 g008
Figure 9. The extracted area results of apple orchards in Yantai City. Note: The horizontal axis represents the various counties and districts under the jurisdiction of the study area.
Agronomy 15 01487 g009
Table 1. Measured sample point data.
Feature TypeAppleWoodlandOther OrchardArable LandGrass
Quantity81297515935
Table 2. Preferred feature variables.
Characteristic IndexCalculation Formula
Modified Terrestrial Chlorophyll Index (MTCI) [36] B 6 B 5 B 5 B 4
Triangular Vegetation Index (TVI) [37] 60 × B 6 B 3 100 × B 4 B 3
Enhanced Vegetation Index (EVI) [38] 2.5 × B 8 B 4 B 8 + 6 × B 4 + 7.5 × B 2 + 1
Ratio Vegetation Index (RVI) [39] B 8 B 4
Modified Chlorophyll Absorption Ratio Index (MCARI) [40] B 5 B 4 0.2 × B 5 B 3 × B 5 B 4
Near-Infrared Reflectance of vegetation (NIRv) [41] B 8 B 4 B 8 + B 4 × B 8
Normalized Difference Red Edge Index (NDre3) [42] B 8 B 7 B 8 + B 7
Modified Red Edge Simple Ratio Index (MRESR) [43] B 6 B 2 B 5 B 2
Red Edge Normalized Difference Vegetation Index (NDVIre32) [42] B 7 B 6 B 7 + B 6
Note: In Table 2, B2, B3, B4, B5, B6, B7 and B8 represent the reflectance of the corresponding band of Sentinel-2 data, respectively. If the central wavelength of Sentinel-2 data does not meet the wavelength used in the feature calculation formula, the reflectance of the band at the wavelength closest to that wavelength is used instead.
Table 3. Accuracy evaluation results of different models on single-temporal images.
ModelOAF1-ScoreMIoUFWIoU
FCN-8s71.58%47.34%38.60%65.69%
U-Net76.88%52.54%43.24%70.80%
SegNet73.28%52.06%41.78%67.30%
Table 4. Accuracy evaluation results of different models on multi-temporal images.
ModelOAF1-ScoreMIoUFWIoU
FCN-8s79.74%54.92%45.60%73.62%
U-Net82.73%52.77%45.33%76.33%
SegNet86.34%56.70%49.05%79.98%
SegNet + CBAM88.28%56.84%49.60%81.72%
SegNet + Focal Loss88.56%56.91%49.75%82.02%
AOCF-SegNet89.34%61.44%52.91%83.13%
Disclaimer/Publisher’s Note: The statements, opinions and data contained in all publications are solely those of the individual author(s) and contributor(s) and not of MDPI and/or the editor(s). MDPI and/or the editor(s) disclaim responsibility for any injury to people or property resulting from any ideas, methods, instructions or products referred to in the content.

