Article

Identification of Vitis riparia as Donor of Black Rot Resistance in the Mapping Population V3125 x ‘Börner’ and Additive Effect of Rgb1 and Rgb2

1
Institute for Grapevine Breeding Geilweilerhof, Julius Kühn Institute (JKI), Federal Research Centre on Cultivated Plants, 76833 Siebeldingen, Germany
2
State Education and Research Center of Viticulture, Horticulture and Rural Development, 67435 Neustadt, Germany
*
Author to whom correspondence should be addressed.
Agronomy 2025, 15(6), 1484; https://doi.org/10.3390/agronomy15061484
Submission received: 14 May 2025 / Revised: 12 June 2025 / Accepted: 16 June 2025 / Published: 19 June 2025

Abstract

:
Viticulture is facing challenges, like the impact of climate change and various pests and pathogens. Alongside powdery and downy mildew, black rot is one of the most prevalent fungal diseases in European wine-growing regions. The focus of grapevine breeding research has so far been mainly on resistance to mildew diseases, and marker-assisted selection (MAS) in breeding material is possible for the most important resistance loci. However, only a few loci have been described for black rot resistance and these cannot yet be used for MAS. Thus, the characterization of genetic resistance to black rot and the establishment of closely linked genetic markers is important for the breeding of cultivars with multifungal resistances. In this study, an improved SSR marker-based genetic map of the biparental mapping population V3125 (‘Schiava Grossa’ x ‘Riesling’) x ‘Börner‘ (Vitis riparia x Vitis cinerea) was used to perform QTL analysis for black rot resistance. A total of 195 F1 individuals were analyzed at 347 SSR marker positions distributed on all 19 chromosomes. QTL analysis detected two QTLs conferring resistance to black rot on linkage groups 14 (Rgb1) and 16 (Rgb2). Our results revealed for the first time that Rgb1 and Rgb2 are derived from the wild species V. riparia. The presence of both loci in F1 individuals showed a clear additive effect for black rot resistance, supporting the breeding strategy of pyramiding two or more resistance factors to achieve a stronger overall resistance.

1. Introduction

Black rot of grapevine is a disease caused by the hemibiotrophic ascomycete Guignardia bidwellii (Ellis) Viala and Ravaz [1] (asexual morph: Phyllosticta ampelicida (Enkman) Van der Aa [2]) and was reported in Europe for the first time in 1885 [3].
Like powdery and downy mildew of grapevine, black rot is endemic to North America, where it was first described in 1804 [4]. The three pathogens were introduced to Europe through contaminated grapevine material. Black rot was first observed in France, before it spread to Germany and Italy [5,6]. Since the end of the 20th century, the disease has spread again and the incidence of grapevine black rot has been reported from regions in Switzerland, Germany, Italy and Portugal [7,8,9,10]. Black rot has also been described in Central and South America, Asia, Africa, Australia and Oceania, showing the global relevance of the disease [11].
Black rot can infect all green parts of the vine. Typical symptoms on leaves are brown necrotic lesions with ring-shaped arranged pycnidia, structures similar to fruiting bodies in which asexual spores (conidia) are formed. Berries shrivel upon infection with black rot and pycnidia form on their berry surface [12]. The infected berries lose quality and are no longer suitable for wine production. In the worst case, there is a risk of total yield loss in the vineyard [13]. During the growing season, several cycles of asexual reproduction are possible.
Black rot, the mildew diseases and Botrytis bunch rot, are the major threats for the growing of traditional European grapevine cultivars, and they need to be controlled by several fungicide applications per year. With rising awareness of environmental protection and, in particular, sustainable agriculture, the reduction in pesticide use is gaining importance. One chance to achieve this goal is the cultivation of new grapevine cultivars with resistances to fungal diseases, which require up to 80% less fungicide treatments [14]. To date, breeding programmes developing these disease-resistant cultivars have mainly focused on resistances to the mildew diseases, as numerous resistance loci are known and available for marker-assisted selection (MAS) [15]. However, the increasing cultivation of new fungus-resistant varieties in conjunction with the reduction in fungicide use bears the risk that diseases such as black rot, which were previously co-regulated by fungicide applications against mildew diseases, will re-establish themselves in vineyards [16].
In the mapping population of the susceptible V3125 (‘Schiava Grossa’ x ‘Riesling Weiß’) and the black rot resistant ‘Börner‘ (Vitis riparia GM 183 x Vitis cinerea Arnold), two resistance loci were revealed in the quantitative trait locus (QTL) analysis conducted by Rex et al. [17]. One is located on chromosome 14 (Rgb1, “Resistance Guignardia bidwellii 1”) and the other one on chromosome 16 (Rgb2). However, the authors could not determine which parental genotype of ‘Börner’ is the source of these black rot resistance loci.
In further studies, a QTL for leaf resistance to black rot was detected in three other genetically distinct F1 populations [18,19,20] on chromosome 14, at a comparable genetic position, as Rgb1. A QTL associated with berry resistance (Rgb3) was identified upstream of Rgb1 on chromosome 14 in a ‘Merzling’ x ‘Teroldego’ cross population [20].
An improvement and revision of the genetic map used in the studies of Rex et al. [17] and Fechter et al. [21] and subsequent QTL analysis was performed to identify the resistance donor of the cross population V3125 x ‘Börner’. Possible additive effects of the resistance conferred by Rgb1 and Rgb2 were examined in the F1 individuals to determine if the combination of both loci would be advantageous in breeding programmes.

2. Materials and Methods

2.1. Phenotyping of Leaf Resistance to Black Rot
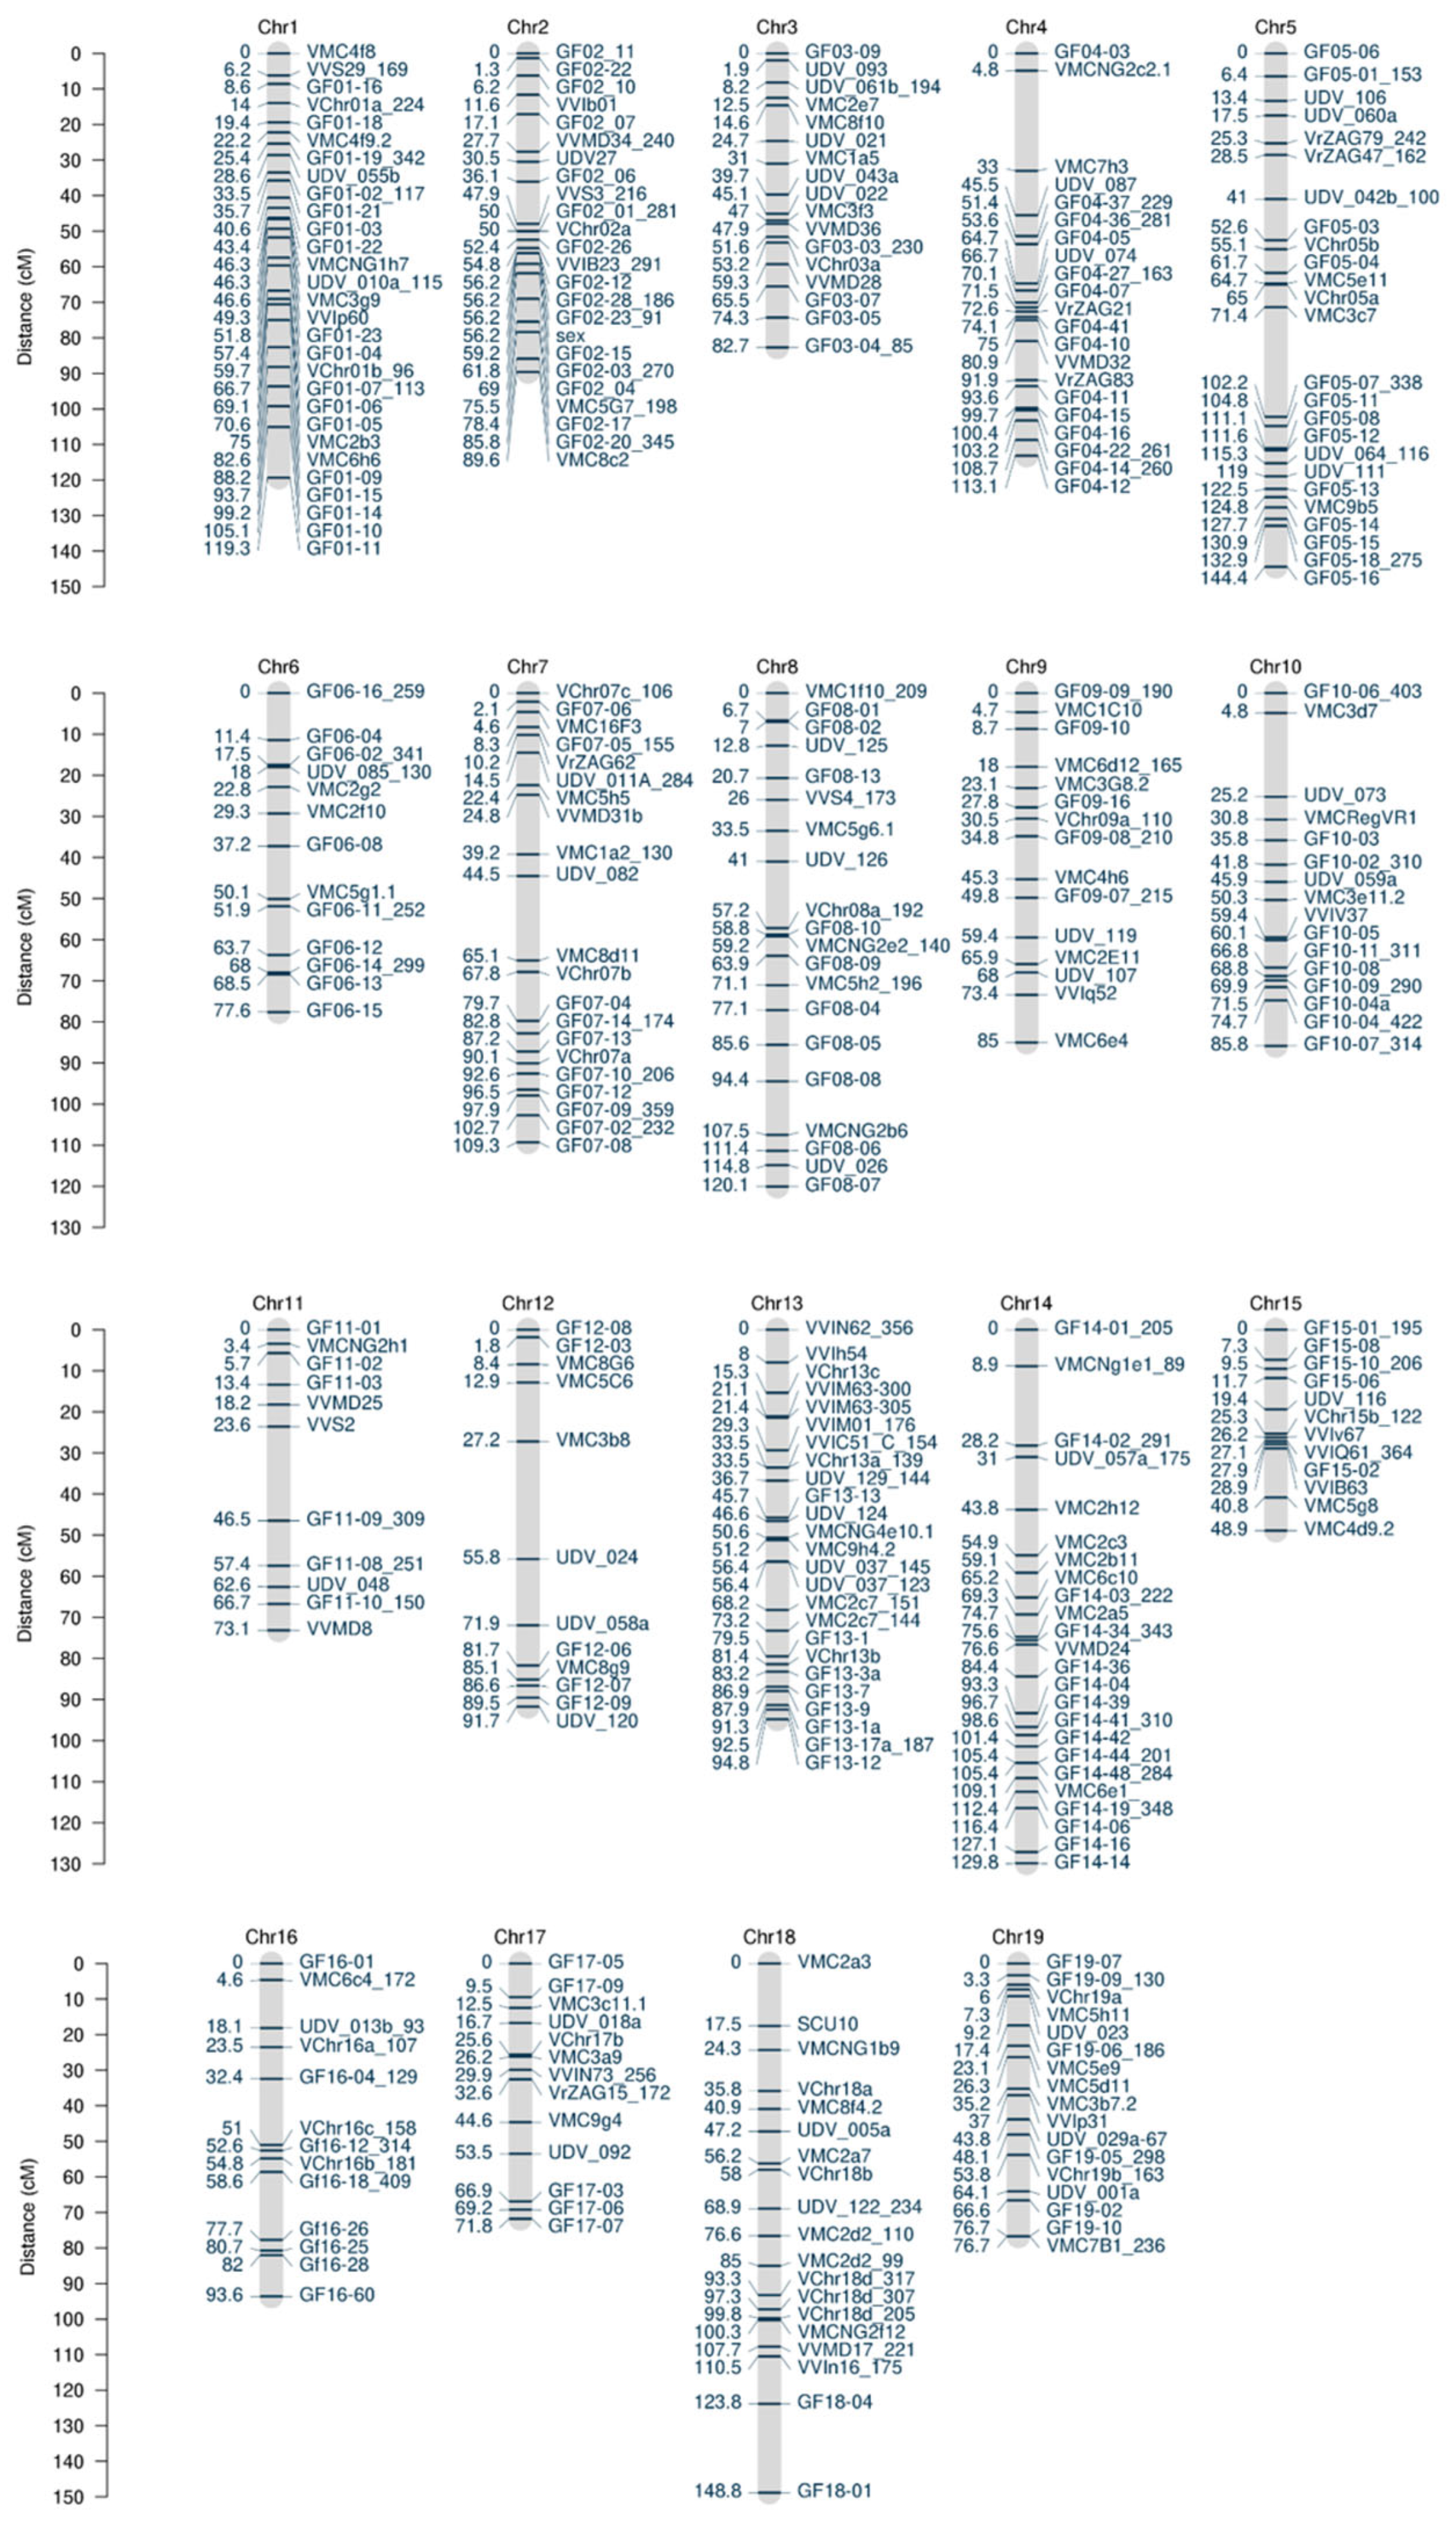
For the cross-population V3125 (VIVC variety number 4605) x ‘Börner’ (VIVC variety number 1499), phenotypic black rot resistance data from four independent infection experiments in the years 2010 (2010_1) and 2011 (2011_1, 2011_2, 2011_3) were available and were used for this study. The G. bidwellii infection experiments were conducted under controlled conditions in a climate chamber by Rex et al. [17], with three replicates (potted wood cuttings) per each F1 individual in each of the four phenotypic tests. The phenotypic datasets recorded 21 days after infection were used, which were rated with the five-class phenotyping system developed by Rex et al. [17]: 1 = very highly susceptible, 3 = highly susceptible, 5 = medium resistat, 7 = highly resistant, 9 = very highly resistant (plants that died during the experiment were not scored). For each independent infection experiment, the mean phenotypic value of the three replicates per genotype was calculated. The phenotypic values per genotype of all independent infection experiments were combined in a best linear unbiased prediction (BLUP) [22] with the R package phenotype [23].

2.2. Genetic Map

The constructed genetic map of the cross-population V3125 x ‘Börner’ represents a combined and revised version of the previously published maps that were based on simple sequence repeat (SSR) markers [17,21]. The genetic datasets of both maps were merged and single SSR markers with uncertain phasing of the grandparental alleles were identified and corrected. The following recalculation of the genetic consensus map was conducted with the R package onemap [24], following the steps described by Frenzke et al. [25]. The threshold for markers with distorted Mendelian distribution was Chi2 < 20. The reference genome PN40024 12x.v2 [26] was used for the determination of all physical positions of the SSR markers.

2.3. QTL Analysis

Prior to QTL analysis, the phenotypic data were Box–Cox transformed with the R-package AID [27]. For interval mapping (IM) the R package R/qtl [28] was used and composite interval mapping (CIM) was conducted with the R package fullsibQTL [29]. The CIM step size was 0.5 cM and cofactors were selected with an effect size threshold of 0.001. Genome (CIM, IM) and chromosome-wide (IM) significance thresholds were calculated with 1000 permutations. Both analyses were performed following the protocol of Frenzke et al. [25]. Effect plots were created with the R package R/qtl [28]. The function effectplot uses the multiple-imputation method to estimate the genotype-specific average values of the phenotypes at the LODmax position of a QTL.

2.4. Statistics

The additive effect of the two resistance loci Rgb1 and Rgb2 in the F1 individuals of the population V3125 x ‘Börner’ was statistically analyzed.
F1 individuals were sorted into four genetic groups (Rgb1+/Rgb2+, Rgb1−/Rgb2−, Rgb1+/Rgb2−, Rgb1−/Rgb2+) based on the presence or absence of the resistance-conferring allele at the SSR marker positions of each locus in the IM LODmax-2 confidence intervals of the QTL analysis. Individuals with a recombination event within these IM intervals were excluded from the analysis. For the remaining F1 individuals, the BLUP-adjusted mean value was extracted from the dataset used for QTL analysis. Due to the non-normally distributed data, a generalized linear model (family = Gamma(link = “log”)) of the extracted BLUP adjusted mean dataset was generated. The model was chosen, as it respects the continuous, positive and right-skewed data as well as the heteroscedasticity. Subsequently, the phenotypes within the four genetic groups were compared using ANOVA and Tukey post hoc analysis (p < 0.05) to reveal statistically significant differences. All statistical analyses were performed using R 4.2.1. and RStudio 2022.07.1.

3. Results

3.1. Improvement of the Genetic Map
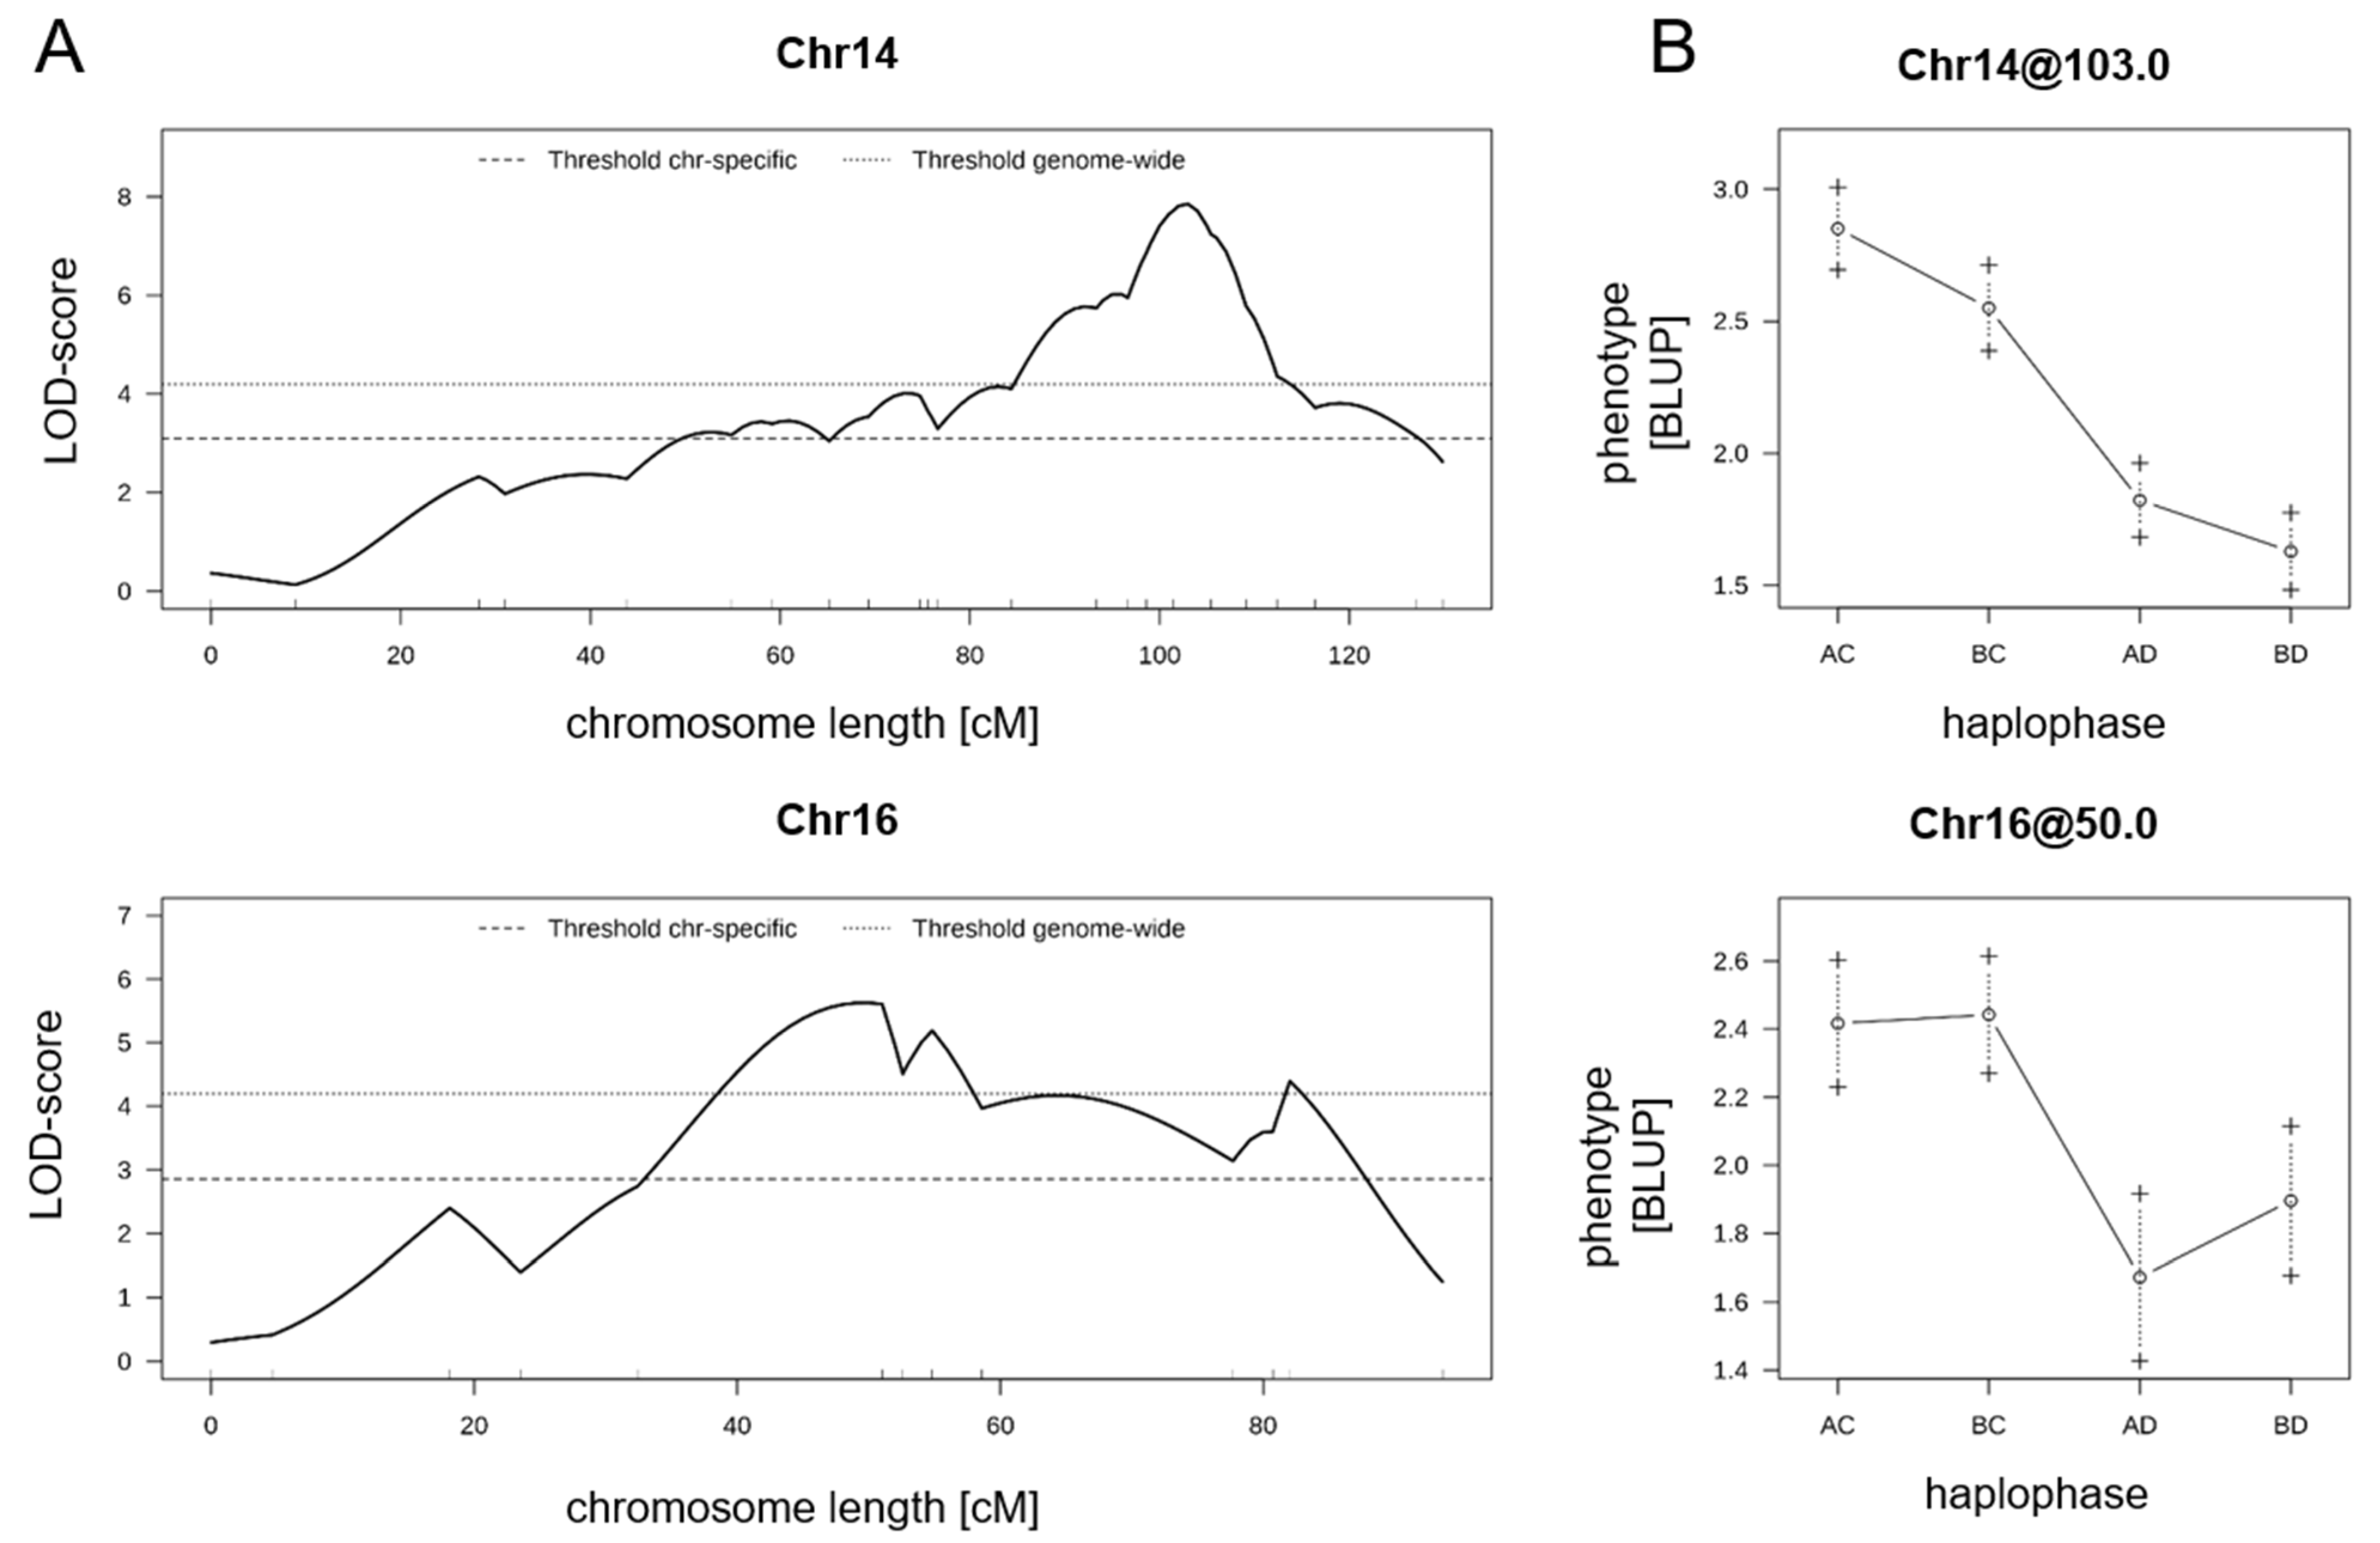
In two previous studies, SSR marker data were obtained from F1 individuals of the mapping population V3125 x ‘Börner’ [17,21]. In these datasets, the phasing of the grandparental alleles was not correctly recorded for all of the 347 SSR markers. For this reason, the resistance-mediating haplophase of the two identified QTLs could not be determined by Rex et al. [17]. To overcome this issue, the compiled marker data of the 195 F1 individuals was revised and combined to create an improved map version. As a first step, SSR markers with known correct phasing of the grandparental alleles were identified on all 19 chromosomes. These “anchor” markers were then used to adjust the phasing of the remaining markers with unknown grandparental allele sizes on each chromosome. The revised marker set was then used for the recalculation of the genetic map, which now correctly reflects the grandparental haplophases (Figure 1).
This revised map allows one to gain maximum information from a subsequent QTL analysis and therefore to determine the identity of the resistance donor. The improved genetic map has a total length of 1856 centiMorgan (cM) and an average inter-marker distance of 5.3 cM on the 19 linkage groups. In total 347 SSR markers were analyzed: 57% of them were fully informative (ab × cd = 165, ef × eg = 33) and 43% were partially informative (lm × ll = 62, nn × np = 87). The co-linearity of the SSR marker position in the genetic map compared to the physical position on the PN40024 12X.v2 reference genome [26] has an average R2 of 0.9, and the map covers 90.5% of the PN40024 12X.v2 reference genome assembly (Supplementary Figure S1).

3.2. QTL Analysis

For QTL analysis, the improved genetic map of the cross-population V3125 x ‘Börner’ was used together with the phenotypic data of Rex et al. [17]. The four individual phenotypic datasets (2010_1, 2011_1, 2011_2, 2011_3) as well as the BLUP values of each F1 individual were used to perform an IM analysis (Figure 2).
QTL analysis with the BLUP dataset led to two prominent QTLs on chromosome 14 and 16 (Figure 2A, Table 1). The QTL on chromosome 14 (Rgb1) was identified in three phenotypic datasets (2010_1, 2011_1, 2011_2) and the QTL on chromosome 16 (Rgb2) was shown in two phenotypic datasets (2010_1, 2011_2) (Figure 2B). In the dataset 2011_3 none of the two aforementioned QTLs were identified. Both QTLs exceeded the genome- and chromosome-wide thresholds with the BLUP dataset (Figure 2A). An additional QTL on chromosome 6 did not exceed the genome-wide threshold with the BLUP dataset and was only validated in one phenotypic dataset (2011_1) (Supplementary Table S1). Further QTLs on chromosomes 8, 15 and 17 could only be shown in one dataset and were not supported by BLUP analysis. The QTL on chromosome 5 is present in two phenotypic datasets (2011_1, 2011_2), but not supported by the BLUP dataset (Supplementary Table S1).
In addition to IM, a CIM was performed, as it is an advanced mapping approach for multiple QTLs. CIM validated the QTL on chromosome 14 in the BLUP dataset (Table 1). This QTL was also shown in two single phenotypic datasets (2011_1, 2011_2). The QTL on chromosome 16 was not significant during CIM analysis with the BLUP dataset, but was significant in one single phenotypic dataset (2011_3) (Supplementary Table S2).
Through CIM, the genetic region of the QTL on chromosome 14 could be refined to a region of 1.6 megabase pairs (Mb) on the PN40024 12X.v2 reference genome between the SSR markers GF14-39 and VMC6e1.

3.3. Vitis riparia Is the Donor of Black Rot Resistance

The two major resistance loci identified in the mapping population could only be derived from the black rot resistant parent ‘Börner’, since the other parent V3125, a V. vinifera breeding line, is susceptible to black rot [17]. As the SSR marker data and the revised genetic map now reflect the grandparental alleles, it is possible to trace the haplophases of the two parents of the mapping population back to the grandparents. The breeding line V3125 harbours the haplophase A derived from ‘Schiava Grossa’ and haplophase B from ‘Riesling Weiß’. The rootstock ‘Börner’ possesses haplophase C inherited from V. riparia GM 183 and haplophase D from V. cinerea Arnold. The four possible haplophase combinations (AC, AD, BC, BD) within the F1 population at the LODmax positions of Rgb1 and Rgb2 when using the BLUP dataset were evaluated for their phenotypic effect on the QTL (Figure 3). The effect plots clearly revealed that both QTLs were transmitted by the V. riparia GM 183 haplophase of ‘Börner’.

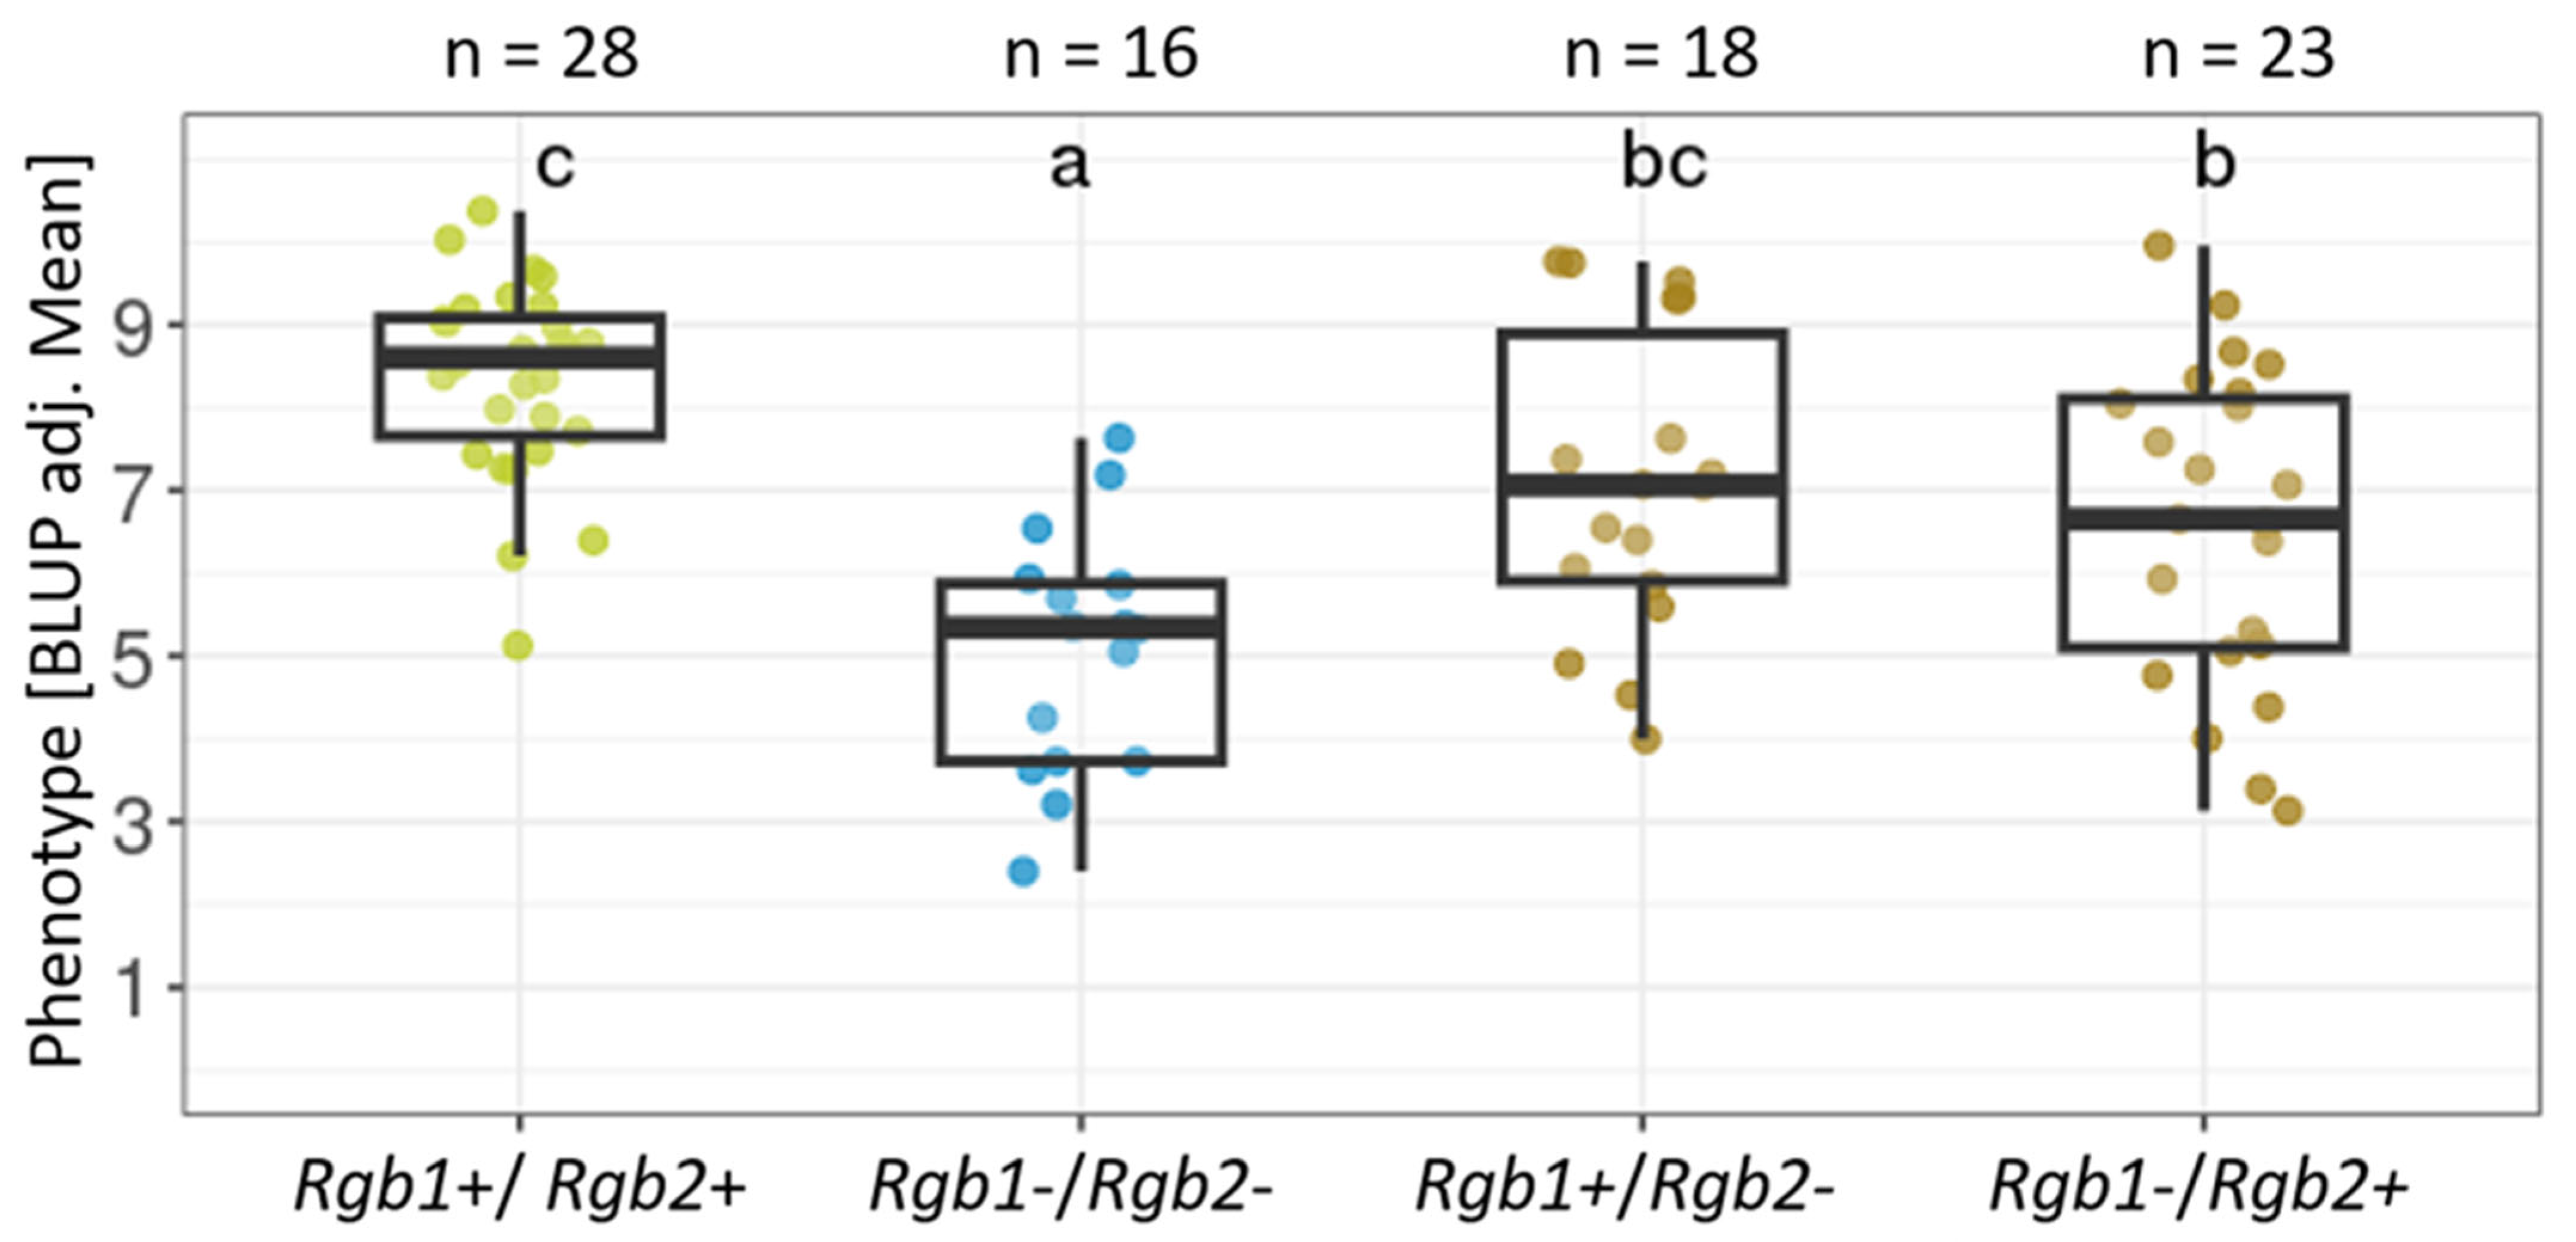
3.4. Additive Effect of Rgb1 and Rgb2

The F1 individuals of the cross-population V3125 x ‘Börner’ were investigated for possible additive effects of the two stable resistance loci Rgb1 and Rgb2. Therefore, the F1 individuals were grouped by the presence or absence of the resistance-conferring V. riparia haplophase of ‘Börner’ for each locus (IM LODmax-2 confidence intervals (Table 1)). Individuals with recombination events in the confidence intervals were excluded from the analysis. The resulting four genetic groups were compared with one-way ANOVA and Tukey post hoc analysis (p < 0.05) to determine significant differences between their phenotypic scores using the BLUP dataset (Figure 4).
It is evident that F1 individuals carrying both resistance loci (Rgb1 and Rgb2) or a single one show a significantly higher phenotypic resistance than F1 individuals without any resistance loci. Furthermore, the presence of both resistance loci confers a higher resistance than Rgb2 alone, but a comparable level to Rgb1 alone. There seems to be a slight tendency, albeit not significant, that Rgb1 mediates a higher degree of resistance than Rgb2.

4. Discussion

Black rot is, in addition to powdery and downy mildew, one of the economically and globally most important grapevine diseases. Guignardia bidwellii (syn. Phyllosticta ampelicida), the pathogen causing black rot, is endemic to North America. However, since the end of the 20th century, increasing evidence of the pathogen has been reported from wine-growing regions all over Europe and beyond.
Breeding of fungus-resistant grapevine cultivars with genetic resistance to several fungal diseases is the key to sustainable and environment-friendly viticulture. To date, breeding programmes have mainly focussed on the two prominent mildew diseases. A prerequisite for the integration of black rot resistance into breeding programmes are tightly linked genetic markers to monitor the black rot resistance loci in the MAS. In order to develop these genetic markers, it is necessary to know precisely mapped genetic positions of the resistances and the resistance-conferring parental haplophase of the resistance donors of the identified QTL.
In a recent study to map black rot resistance in the biparental F1 population V3125 (‘Schiava Grossa’ x ‘Riesling Weiß’) x ‘Börner‘ (V. riparia GM 183 x V. cinerea Arnold), two resistance loci were identified on chromosome 14 (Rgb1) and 16 (Rgb2). However, due to limitations of the genetic map, the identification of the grandparental resistance donor for black rot resistance on leaves was not possible [17].
To overcome this difficulty, SSR marker data from the two existing genetic maps of the cross population V3125 x ‘Börner’ [17,21] were combined. Markers with correct phasing of the grandparental alleles were identified on all 19 chromosomes and were used to align the phasing of the adjacent markers. The resulting dataset was used for a recalculation of the genetic map.
In the improved genetic map of the V3125 x ‘Börner’ cross-population, the stable major QTLs described by Rex et al. [17] on chromosome 14 (Rgb1) and chromosome 16 (Rgb2) were confirmed by extensive QTL analyses. The fact that Rgb2 was not detected by CIM in the BLUP dataset may have to do with the lower strength of this QTL and the larger confidence interval (Table 1, Figure 2). A third QTL was identified on chromosome 6 in the BLUP dataset. As this QTL only exceeded the chromosome and not the genome-wide threshold and was only detected in one phenotypic dataset, it was defined as a minor QTL. However, the additional minor QTLs found on chromosome 5, 8, 15 and 17 were only observed in single phenotypic datasets and were not supported with the BLUP. They differed from the minor QTL described in the previous study (chromosome 3, 4, 8, 10, 12, 13, 15, 19). Thus, correction of marker phasing reduced the number of minor QTLs in comparison to the previous study [17]. The presence of multiple resistances complicates QTL analysis, as the mapping algorithms used must take into account the presence of multiple QTLs. This can lead to bias in the QTL analysis and also to the detection of false-positive QTLs [30,31,32]. Therefore, the minor QTLs detected in the V3125 x ‘Börner’ population are rather less reliable and were not considered further for a more detailed analysis or usage in breeding.
QTL analysis with the improved genetic map of V3125 x ‘Börner’ allowed, for the first time, the identification of V. riparia GM 183 as the resistance-mediating grandparent from which the main resistance loci on linkage group 14 (Rgb1) and 16 (Rgb2) were derived. Therefore, the resistance originates from the wild Vitis species Vitis riparia Michaux. This information now offers the possibility to develop closely linked and allele-specific SSR markers for MAS of black-rot-resistant breeding lines in breeding programmes.
CIM analysis only revealed the QTL on linkage group 14 (Rgb1) as significant. A QTL for black rot resistance in this genomic region has so far been described in four different cross populations, including the population used in this study [17,18,19,20]. In the year 2000, Dalbó et al. [18] identified a genomic region as associated with black rot resistance and stated the RAPD marker CS25b (Chr 14) as linked to the resistance locus. The authors indicated V. cinerea B9 as the possible origin of the resistance. Later, Rex et al. [17] mapped the Rgb1 locus to the same genetic region in the V3125 x ‘Börner’ population, which is unrelated to the population ‘Horizon’ x Illinois 547-1 used by Dalbó et al. [18]. The current study has now demonstrated that V. riparia is the resistance donor for both Rgb1 and Rgb2. At the same genomic position of Rgb1, a resistance locus for black rot was also identified in the two related cross populations, ‘Merzling’ (‘Seyval Blanc’ x Freiburg 379-52) x ‘Teroldego’ [20] and ‘Calardis Musqué’ (‘Bacchus Weiß’ x ‘Seyval Blanc’) x ‘Villard Blanc’ [20]. However, none of the two populations has V. riparia in its genetic background according to the VIVC database (www.vivc.de), indicating that the resistance locus in these two populations originates from another wild Vitis species. Therefore, we assume several distinct genetic origins for Rgb1. This conclusion is also supported by Bettinelli et al. [33], who identified various wild Vitis species with potential resistance to black rot when evaluating historical data on black rot resistance.
Rgb1 is the strongest resistance locus in the cross population V3125 x ‘Börner’ as it has the highest LODmax and explains up to 18.2% of the phenotypic variance (Table 1). Moreover, the presence of only Rgb1 in the F1 individuals confers a slightly higher resistance than Rgb2 alone. However, the combination of Rgb1 and Rgb2 leads to an additive effect and an increased overall phenotypic resistance, which also confirms the biological relevance of Rgb2 (Figure 4). The aim is, therefore, to maintain Rgb1 and Rgb2 in a new cultivar to increase the degree of resistance to black rot and to extend the durability of the resistance in the vineyard. Furthermore, the reported results facilitate the introgression of Rgb1 and Rgb2 in a new breeding line and reduce the breeding effort by enabling MAS.

5. Conclusions

Black rot of grapevine is an emerging fungal disease in European viticulture, especially as the environmental conditions are becoming more favourable for the pathogen. On the other hand, plant protection reduction is a major goal for more environmentally friendly viticulture. The cultivation of new grapevine varieties with resistance to black rot in addition to the mildew diseases is a sustainable strategy to address this problem, but this requires well-characterized genetic resistances for breeding programmes. In this study, we analyzed the two resistance loci Rgb1 and Rgb2 from the interspecific rootstock variety ‘Börner’. We were able to prove that both loci originate from the wild species V. riparia. In combination, the two loci displayed an additive increase in quantitative resistance. This observation is highly valuable for breeding purposes and shows that pyramiding the Rgb loci leads to an increased overall resistance to black rot.

Supplementary Materials

The following supporting information can be downloaded at https://www.mdpi.com/article/10.3390/agronomy15061484/s1, Figure S1: Collinearity of the V3125 x ‘Börner’ genetic map in comparison to the PN40024 12X.v2 reference genome assembly. Fully informative markers are indicated in black circles (ab x cd, ef x eg) and partially informative markers in blue (lm x ll, nn x np). The horizontal axis indicates the SSR marker position in the genetic map in centiMorgan (cM); the vertical axis shows the SSR marker position on the reference genome PN40024 12X.v2 in megabasepairs (Mb). R2 values indicate the collinearity between the physical and genetic distance of the marker positions. Table S1: Interval mapping (IM) results of all experiments of the cross population V3125 x ‘Börner’. Chr = chromosome; Position = LODmax-position in centiMorgan (cM); LOD = maximum LOD value; LOD threshold chromosome = chromosome-wide significance threshold (number of permutations = 1000); LOD threshold genome = genome-wide significance threshold (number of permutations = 1000). Table S2: Composite interval mapping (CIM) results of all experiments of the cross population V3125 x ‘Börner’. Chr = chromosome; Position cM = LODmax-position in centiMorgan (cM); LOD = maximum LOD value, LOD threshold genome = genome-wide significance threshold (number of permutations = 1000).

Author Contributions

Conceptualization and funding, L.H. and R.T.; formulation of overarching research goals and aims, O.T., R.T. and L.H.; investigation, P.W. and F.R. (Friederike Rex); data curation, P.W. and F.R. (Friederike Rex); QTL analysis, P.W., F.R. (Franco Röckel) and A.W.; writing—original draft preparation, P.W.; writing—thorough review and editing of different versions of the manuscript, A.W., F.R. (Friederike Rex), F.R. (Franco Röckel), O.T., R.T. and L.H.; project administration and supervision, L.H. All authors have read and agreed to the published version of the manuscript.

Funding

This research was funded by the Forschungsring des Deutschen Weinbaus (FDW), grant number 6005-0023#2021/0004-0801 8503.0031.

Data Availability Statement

The data presented in this study are available upon request from the corresponding author.

Acknowledgments

We would like to gratefully acknowledge Barbara Brechter, Carina Moock and Claudia Welsch for excellent technical assistance. This publication is part of the dissertation of Patricia Weber submitted at the University Mainz, and therefore special thanks go to Thomas Hankeln (Institute of Organismic and Molecular Evolution, Faculty of Biology at the Johannes Gutenberg University, Mainz (Germany)).

Conflicts of Interest

The authors declare no conflicts of interest.

Abbreviations

The following abbreviations are used in this manuscript:
CIMComposite interval mapping
cMcentiMorgan
LODLogarithm of the odds
IMInterval mapping
MASMarker-assisted selection
QTLQuantitative trait loic
RgbResistance Guignardia bidwellii

References

  1. Viala, M.P.; Ravaz, L. Sur De Nouvelles Espèces Du Genre Phoma Se Développant Sur Les Fruits De La Vigne. Bull. De La Société Bot. De Fr. 1886, 33, LXI–LXX. [Google Scholar] [CrossRef]
  2. van der Aa, H.A.; Vanev, S. A Revision of the Species Described in Phyllosticta; Centraalbureau voor Schimmelcultures (CBS): Utrecht, The Netherlands, 2002. [Google Scholar]
  3. Pezet, R.; Jermini, M. Black rot of grapevine: Symptoms, epidemiology and control. Rev. Suisse De Vitic. D’arboricult. D’horticult. 1989, 21, 27–34. [Google Scholar]
  4. Ramsdell, D.C.; Milholland, R.D. Black Rot. Compend. Grape Dis. 1988, 15–17. [Google Scholar]
  5. Reddick, D. The black-rot disease of grapes. Riv. Di Patol. Veg. 1911, 5, 116–119. [Google Scholar]
  6. Lüstner, B. Auftreten der Schwarzfäule (Black Rot) der Rebe in Deutschland. Nachrbl. Dtsch. Pflanzenschutzd. 1935, 15, 27. [Google Scholar]
  7. Jermini, M.; Gessler, C. Epidemiology and control of grape black rot in southern Switzerland. Plant Dis. 1996, 80, 322–325. [Google Scholar] [CrossRef]
  8. Harms, M.; Holz, B.; Hoffmann, C.; Lipps, H.-P.; Silvanus, W. Occurrence of Guignardia bidwellii, the causal fungus of black rot on grapevine, in the vine-growing areas of Rhineland-Palatinate, Germany. In Proceedings of the Plant Protection and Plant Health in Europe: Introduction and Spread of Invasive Species, Humboldt University, Berlin, Germany, 9–11 June 2005; pp. 127–132. [Google Scholar]
  9. Rinaldi, P.A.; Broggini, G.A.L.; Gessler, C.; Molitor, D.; Sofia, J.; Mugnai, L. Guignardia bidwellii, the agent of black rot of grapevine, is spreading in European vineyards. In Proceedings of the 10th Congress of Plant Pathology (ICPP), Beijing, China, 25–30 August 2013. [Google Scholar]
  10. Pirrello, C.; Mizzotti, C.; Tomazetti, T.C.; Colombo, M.; Bettinelli, P.; Prodorutti, D.; Peressotti, E.; Zulini, L.; Stefanini, M.; Angeli, G.; et al. Emergent Ascomycetes in Viticulture: An Interdisciplinary Overview. Front. Plant Sci. 2019, 10, 1394. [Google Scholar] [CrossRef]
  11. Szabó, M.; Csikász-Krizsics, A.; Dula, T.; Farkas, E.; Roznik, D.; Kozma, P.; Deák, T. Black Rot of Grapes (Guignardia bidwellii)—A Comprehensive Overview. Horticulturae 2023, 9, 130. [Google Scholar] [CrossRef]
  12. Wilcox, W.; Hoffman, L.E. Black Rot. In Compendium of Grape Diseases, Disorders and Pests, 2nd ed.; Wilcox, W., Gubler, W.D., Uyemoto, J.K., Eds.; American Phytopathological Society: Saint Paul, MN, USA, 2015; pp. 28–33. [Google Scholar]
  13. Lipps, H.; Harms, M. Schwarzfäule—Ein neues Problem. Das Dtsch. Weinmagazin 2004, 11, 10–13. [Google Scholar]
  14. Eisenmann, B.; Wingerter, C.; Dressler, M.; Freund, C.; Kortekamp, A.; Bogs, J. Fungicide-Saving Potential and Economic Advantages of Fungus-Resistant Grapevine Cultivars. Plants 2023, 12, 3120. [Google Scholar] [CrossRef]
  15. Vitis International Variety Catalogue. Available online: www.vivc.de (accessed on 25 March 2025).
  16. Pertot, I.; Caffi, T.; Rossi, V.; Mugnai, L.; Hoffmann, C.; Grando, M.S.; Gary, C.; Lafond, D.; Duso, C.; Thiery, D.; et al. A critical review of plant protection tools for reducing pesticide use on grapevine and new perspectives for the implementation of IPM in viticulture. Crop. Prot. 2017, 97, 70–84. [Google Scholar] [CrossRef]
  17. Rex, F.; Fechter, I.; Hausmann, L.; Töpfer, R. QTL mapping of black rot (Guignardia bidwellii) resistance in the grapevine rootstock ‘Börner’ (V. riparia Gm183 × V. cinerea Arnold). Theor. Appl. Genet. 2014, 127, 1667–1677. [Google Scholar] [CrossRef] [PubMed]
  18. Dalbò, M.A.; Weeden, N.F.; Reisch, B.I. QTL analysis of disease resistance in interspecific hybrid grapes. Acta Hortic. 2000, 528, 217–222. [Google Scholar] [CrossRef]
  19. Hausmann, L.; Rex, F.; Töpfer, R. Evaluation and genetic analysis of grapevine black rot resistances. Acta Hortic. 2017, 1188, 285–290. [Google Scholar] [CrossRef]
  20. Bettinelli, P.; Nicolini, D.; Constantini, L.; Stefanini, M.; Hausmann, L.; Vezzulli, S. Towards marker-assisted breeding for black rot bunch resistance: Identification of a major QTL in the grapevine cultivar ‘Merzling’. Int. J. Mol. Sci. 2023, 24, 3568. [Google Scholar] [CrossRef]
  21. Fechter, I.; Hausmann, L.; Zyprian, E.; Daum, M.; Holtgrawe, D.; Weisshaar, B.; Topfer, R. QTL analysis of flowering time and ripening traits suggests an impact of a genomic region on linkage group 1 in Vitis. Theor. Appl. Genet. 2014, 127, 1857–1872. [Google Scholar] [CrossRef]
  22. Piepho, H.P.; Möhring, J.; Melchinger, A.E.; Büchse, A. BLUP for phenotypic selection in plant breeding and variety testing. Euphytica 2007, 161, 209–228. [Google Scholar] [CrossRef]
  23. Zhao, P. Phenotype: A Tool for Phenotypic Data Processing. Version 0.1.0. 2020. Available online: https://CRAN.R-project.org/package=Phenotype (accessed on 9 November 2024).
  24. Margarido, G.R.; Souza, A.P.; Garcia, A.A. OneMap: Software for genetic mapping in outcrossing species. Hereditas 2007, 144, 78–79. [Google Scholar] [CrossRef]
  25. Frenzke, L.; Röckel, F.; Wenke, T.; Schwander, F.; Grutzmann, K.; Naumann, J.; Zakrzewski, F.; Heinekamp, T.; Maglione, M.; Wenke, A.; et al. Genotyping-by-sequencing-based high-resolution mapping reveals a single candidate gene for the grapevine veraison locus Ver1. Plant Physiol. 2024, 196, 244–260. [Google Scholar] [CrossRef]
  26. Canaguier, A.; Grimplet, J.; Di Gaspero, G.; Scalabrin, S.; Duchene, E.; Choisne, N.; Mohellibi, N.; Guichard, C.; Rombauts, S.; Le Clainche, I.; et al. A new version of the grapevine reference genome assembly (12X.v2) and of its annotation (VCost.v3). Genom. Data 2017, 14, 56–62. [Google Scholar] [CrossRef]
  27. Dag, O.; Ilk, O. An algorithm for estimating Box–Cox transformation parameter in ANOVA. Commun. Stat.-Simul. Comput. 2017, 46, 6424–6435. [Google Scholar] [CrossRef]
  28. Broman, K.W.; Wu, H.; Sen, S.; Churchill, G.A. R/qtl: QTL mapping in experimental crosses. Bioinformatics 2003, 19, 889–890. [Google Scholar] [CrossRef]
  29. Gazaffi, R.; Amadeu, R.R.; Mollinari, M.; Rosa, J.R.B.F.; Taniguti, C.H.; Margarido, G.R.A.; Garcia, A.A.F. fullsibQTL: An R package for QTL mapping in biparental populations of outcrossing species. BioRxiv 2020. [Google Scholar] [CrossRef]
  30. Lander, E.S.; Botstein, D. Mapping Mendelian Factors Underlying Quantitative Traits Using RFLP Linkage Maps. Gentics Soc. Am. 1989, 121, 185–199. [Google Scholar] [CrossRef] [PubMed]
  31. Martínez, O.; Curnow, R.N. Estimating the locations and the sizes of the effects of quantitative trait loci using flanking markers. Theor. Appl. Genet. 1992, 85, 480–488. [Google Scholar] [CrossRef]
  32. Akond, Z.; Alam, J.; Hasan, M.N.; Uddin, S.; Alam, M.; Mollah, N.H. A comparison on some interval mapping approaches for QTL detection. Bioinformation 2019, 15, 90–94. [Google Scholar] [CrossRef]
  33. Bettinelli, P.; Nicolini, D.; Giovannini, O.; Stefanini, M.; Hausmann, L.; Vezzulli, S. Breeding for black rot resistance in grapevine: Advanced approaches for germplasm screening. Euphytica 2023, 219, 113. [Google Scholar] [CrossRef]
Figure 1. Revised SSR marker-based consensus map of the F1 population V3125 x ‘Börner’. Linkage groups were named after the respective chromosome in the PN40024 reference genome. Genetic positions of the SSR markers are given in centiMorgan (cM).
Agronomy 15 01484 g001
Figure 2. Results of IM QTL analysis for black rot leaf resistance in the cross population V3125 x ‘Börner’ for (A) BLUP values of the four phenotypic tests (only QTLs are shown that are above the genome-wide threshold of LOD > 4.2) and (B) single phenotypic experiments (only QTLs above the individual chromosome-wide threshold, see Supplementary Table S1). Coloured bars refer to the different experimental datasets (2010_1, 2011_1, 2011_2, BLUP); lengths of the bars indicate the IM logarithm-of-odds (LODmax-2) confidence intervals. Line thickness corresponds to minimum, mean and maximum LOD values; dots represent LOD-peak position as depicted in the legend. For the phenotypic dataset 2011_3, no significant QTLs were identified.
Agronomy 15 01484 g002
Figure 3. LOD profiles and effect plots of IM QTL analysis for black rot resistance of the V3125 x ‘Börner’ F1 population. Only QTLs exceeding the chromosome and genome-wide threshold are shown. (A) LOD profile using the phenotypic BLUP dataset for the respective chromosomes. Dotted line = genome-wide threshold; dashed line = chromosome-wide threshold. (B) Effect plots revealing the resistance-mediating haplophase of Rgb1 (14@103.0) and Rgb2 (16@50.0). A = ‘Schiava Grossa’ haplophase of V3125; B = ‘Riesling Weiß’ haplophase of V3125; C = V. riparia GM 183 haplophase of ‘Börner’; D = V. cinerea Arnold haplophase of ‘Börner’. Effect plots were created for each QTL for chromosomes @ LODmax position in cM. Circle: average phenotype for each genotype, dotted line and plus sign indicate ± 1 standard error.
Agronomy 15 01484 g003
Figure 4. Additive effects of the Rgb1 (chromosome 14) and Rgb2 (chromosome 16) loci regarding the degree of black rot resistance in the cross-population V3125 x ‘Börner’. F1 individuals were grouped in accordance with their genetic profile in the (LODmax-2) IM confidence intervals. The X-axis depicts the genotypic group; the y-axis indicates the BLUP adjusted mean (1 = susceptible, 9 = resistant). Data was analyzed with one-way ANOVA and Tukey post hoc analysis (p < 0.05). Different lowercase letters indicate statistically significant differences between the groups. n denotes the number of F1 individuals in each genetic group. Green dots = two loci present, blue = no locus present, brown = one locus present.
Agronomy 15 01484 g004
Table 1. IM and CIM results for black rot resistance of the cross population V3125 x ‘Börner’ using the BLUP dataset. The LODmax values refer to the strength of the QTL. The start and end of the confidence intervals of the QTL are indicated by SSR markers. Only QTLs above the genome-wide threshold are shown.
ChrLODmaxLODmax
Marker
LODmax-2
Lower Boundary
LODmax-2
Upper Boundary
% Phenotypic Variance ExplainedLOD Threshold GenomeLOD Threshold Chromosome
IM147.8GF14-42GF14-04VMC6e118.24.23.1
165.6VChr16c_158GF16-04_129GF16-6013.44.22.9
CIM148.5loc103GF14-39VMC6e120.34.6NA
Disclaimer/Publisher’s Note: The statements, opinions and data contained in all publications are solely those of the individual author(s) and contributor(s) and not of MDPI and/or the editor(s). MDPI and/or the editor(s) disclaim responsibility for any injury to people or property resulting from any ideas, methods, instructions or products referred to in the content.

