Article

Transforming Land Use Patterns to Improve Soil Fertility in the Horqin Sandy Land

College of Grassland, Inner Mongolia Minzu University, Tongliao 028000, China
*
Author to whom correspondence should be addressed.
Agronomy 2025, 15(6), 1486; https://doi.org/10.3390/agronomy15061486
Submission received: 12 May 2025 / Revised: 11 June 2025 / Accepted: 18 June 2025 / Published: 19 June 2025
(This article belongs to the Section Grassland and Pasture Science)

Abstract

:
Transforming land use patterns prevents and controls desertification. In the Horqin Sandy Land, we evaluated the soil restoration effects of planting corn (from 2014 to 2018) on previously uncultivated land (in 2013), followed by the transition to alfalfa cultivation under five nitrogen application levels (from 2019 to 2023). After corn cultivation, the soil available nitrogen (AN), C/N ratio, C/P ratio, and N/P ratio decreased by 39.02%, 7.14%, 21.35%, and 12.83%, respectively, compared to those of uncultivated land. However, following the planting of alfalfa, especially in 2023, the bulk density values were the lowest, while the AN, soil organic carbon, total nitrogen, and total phosphorus values were the highest. An AHP-fuzzy comprehensive evaluation showed that the available phosphorus (AP), SOC, C/N, C/P, and N/P had significant weights of 0.12, 0.128, 0.133, and 0.128, respectively, and thus were key soil quality determinants. The soil quality assessment values for the N1 and N2 treatments were the highest at 0.208 and 0.202, respectively. Conclusively, the intensive cultivation of alfalfa under 51.75 and 103.5 kg/ha N improves soil fertility. This study provides theoretical support for the restoration of desertified soils in the Horqin Sandy Land.

1. Introduction

Soil is a vital component of dryland agriculture because it provides essential nutrients for plant growth. Soil carbon (C), nitrogen (N), and phosphorus (P) facilitate the cycling and transformation of soil nutrients and regulate and drive the progressive succession of soil ecosystems [1]. Additionally, they determine crop yield and quality, and economic benefits for farmers and herders [2]. Soil organic carbon (SOC), total nitrogen (TN), and total phosphorus (TP) can be used to evaluate soil fertility [3]. Soil alkali-hydrolyzable nitrogen (AN), available phosphorus (AP), and available potassium (AK) represent the availability of soil nutrients, serving as the direct source of nutrients for crops. Overall, these indicators are critical for evaluating soil fertility and have a strong correlation with soil pH and organic matter [4]. Ecological stoichiometric characteristics typically refer to the elemental composition of organisms and serve as an effective indicator for plant growth and land use [5]. Notably, these characteristics measure the accessibility of nutrients within the soil and elucidate the interactions, balance, and regulatory mechanisms among carbon, nitrogen, and phosphorus [6,7,8]. Soil SOC:TN (C:N) and SOC:TP (C:P) ratios reflect organic matter quality and decomposition rates [9], while soil TN:TP (N:P) indicates nutrient limitations during plant growth [10,11]. Assuming that a change in land use improves soil quality, we assessed the soil nutrient status through the nutrient composition and ecological stoichiometric characteristics of soil C, N, and P.
Land use practices and management models affect the soil C, N, and P content, thereby shaping the stoichiometric ratio characteristics of nutrients. Converting land use from arable land to grassland can mitigate human disturbance to the land, thereby reducing issues such as land degradation, soil erosion, and ecological disruption. This shift facilitates the self-restoration of ecosystems and enhances the ecological environment. Additionally, it promotes the development of industries such as grassland animal husbandry and ecotourism, thereby increasing farmers’ incomes and achieving sustainable economic development. This conversion serves as a cornerstone for fostering a healthier and more prosperous landscape in the context of scientific research and policy-making. Additionally, the cultivation of different crops may have varying impacts on soil physicochemical characteristics and plant nutrient absorption and return [12]. Gao et al. reported that grassland had higher SOC and TN contents and C/N, C/P, and N/P ratios, and lower TP contents than cropland [13]. Malhi et al. reported a 15–43% decrease in SOC and TN content in cropland compared with those in grassland [14]. Additionally, converting cropland to pasture or forage field enhances soil carbon and nitrogen sequestration [15,16]. Zhou et al. found that returning farmland to grassland increased SOC and TN content by 24.4 and 100%, respectively [17]. He et al. observed a 19.8% increase in SOC following grassland restoration projects [18]. The vertical distribution of roots from different crops across soil layers influences the stratification of soil carbon, nitrogen, and phosphorus. Deeper soil layers store over half of all soil carbon and exhibit higher carbon sequestration capacity, with the available nitrogen positively correlated with the SOC content [19,20]. As the conversion from cropland to forage land leads to changes in soil carbon and nitrogen, and the effects of planting different crops differ, the specific changes in soil nutrients that occur when the land use changes from corn cultivation to alfalfa cultivation must be determined.
The Horqin Sandy Land, a representative area of China’s semi-arid agro-pastoral ecotone in the north, serves as a region with dual ecological and productive functions. Recently, sand desertification has increased due to the arid climate, water scarcity, and human disturbances such as unsustainable practices, including overgrazing, reclamation, and traditional unprotected farming [21]. Additionally, the pursuit of high yields and profits has driven an annual increase in nitrogen fertilizer application. Coupled with continuous monocropping, this has reduced nitrogen use efficiency, resulting in severe fertilizer waste and posing potential threats to agricultural ecological balance and sustainability. Collectively, these practices have caused soil degradation and a significant decline in productivity [22], which have directly or indirectly altered soil C, N, and P stoichiometric characteristics. Therefore, restoring ecosystem health is an urgent priority for this region. Alfalfa (Medicago sativa) is a superior perennial legume forage widely cultivated in the Horqin Sandy Land. Alfalfa has a robust root system and thus can penetrate deep into the soil to absorb water and nutrients. Its roots can improve the soil structure by increasing soil porosity and enhancing the soil water-holding capacity. Additionally, alfalfa roots stabilize the soil by mitigating wind and water erosion and protecting the surface from degradation. Furthermore, alfalfa has a unique biological nitrogen fixation capacity. Alfalfa contributes more to belowground biomass carbon input than annual gramineous crops, thereby enhancing soil carbon and nitrogen storage [23,24]. Although nitrogen fertilizer application can effectively boost yield, it may also suppress rhizobial nitrogen fixation in leguminous crops. Assuming that appropriate fertilization can enhance soil nutrients and alfalfa yields while excessive fertilization can damage soil structure, the optimal application amount of nitrogen remains to be determined.
Therefore, we investigated how land use conversion affects soil restoration in the Horqin Sandy Land, with a focus on soil nutrient dynamics. Specifically, the objectives of this research were to investigate quantitative and qualitative variations in soil physicochemical properties and C, N, and P characteristics following land use conversion, determine the optimal nitrogen application levels for improving soil physicochemical properties and C, N, and P characteristics during the conversion from corn (Zea mays) to alfalfa (M. sativa) cultivation, and analyze the relationships between soil C, N, and P, ecological stoichiometry, and soil physicochemical attributes. Overall, this study provides a scientific foundation for realizing rational land use, ecological security maintenance, and sustainable development in the Horqin Sandy Land.

2. Materials and Methods

2.1. Study Site

As shown in Figure 1, this study was conducted in the Horqin District of Tongliao City (43°36′ N and 122°2′ E), Inner Mongolia, on the West Liaohe Plain, at an elevation of 178 m. The region features a typical temperate continental monsoon climate, with an average annual temperature of 6.4 °C, a frost-free period lasting 150 days, and an average annual precipitation of approximately 400 mm. Approximately 90% of the yearly rainfall occurs during the growing season (April–September). Additionally, the soil in the experimental field was sandy textured soil [25] and it was classified as an arid soil [26]. Notably, the experimental area was equipped with irrigation systems to guarantee water availability during drought periods.

2.2. Experimental Design

Following a fallow period, maize cultivation of the experimental field commenced in 2014. Maize was monocropped continuously for 5 years (2014–2018), with annual planting conducted in early May (planting density, 52,500 plants/ha). Before planting, a single application of basal fertilizer was performed, including 240 kg/ha N, 105 kg/ha P2O5, and 120 kg/ha K2O for N, P, and K, respectively. The specific fertilizers were urea [CO(NH2)2, containing ≥ 46% N], calcium superphosphate [Ca(H2PO5)2, containing ≥ 12% P2O5], and potassium sulfate (containing ≥ 52% K2O). The control was uncultivated land.
After the harvest of maize in 2018, alfalfa was monocultured in May 2019 using row-seeding, with a row spacing of 20 cm, a seeding rate of 15 kg/ha, and sowing depths of 2–3 cm. This study was organized in a randomized block design consisting of five N levels: 0 (N0), 50 (N1), 105 (N2), 210 (N3), and 315 (N4) kg/ha of pure nitrogen. Additionally, each treatment group contained 3 replicates for a total of 15 plots. The control was corn fields (2018). Each plot measured 20 m2 (4 × 5 m), and the plots were separated by 50 cm-wide isolation strips. No harvest occurred in the sowing year. Three annual harvests were conducted at the initial flowering stage starting from the second year. Nitrogen fertilizer was applied as follows: 40% of the total amount was applied in furrows during the regreening stage and then covered with soil, and 30% was broadcast-applied after the first and second harvests and followed by thorough irrigation. P and K fertilizers were applied once during the regreening stage at rates of 100 kg/ha P2O5 and 120 kg/ha K2O, followed by thorough irrigation. All field management practices, excluding nitrogen treatments, were uniform across the plots.

2.3. Sampling and Measurement

After crop harvest (October 2013, October 2018, and October 2023), soil samples were collected (using a 5 cm-diameter auger) from three soil horizons (0–20, 20–40, and 40–60 cm depths) in three randomly selected locations in each plot. Additionally, undisturbed soil cores from each layer were collected using a ring knife to measure the soil bulk density. Soil samples from the three sampling points were mixed, and roots, stones, and debris were removed. Thereafter, the soil samples were passed through a sieve with a 2 mm mesh and air-dried at 20 °C for subsequent soil nutrient analysis.
The SOC content was determined using the potassium dichromate external heating method, where soil samples were poured into test tubes, mixed with potassium dichromate solution and concentrated sulfuric acid, thoroughly shaken, and heated to 185–190 °C. After cooling, the remaining potassium dichromate was titrated with ferrous sulfate solution [27]. The TN content was measured using the Kjeldahl method, which involved heating the soil samples with concentrated sulfuric acid and a catalyst for digestion, transferring the digestate into the reaction chamber of a Kjeldahl nitrogen analyzer, adding excess sodium hydroxide, and titrating the boric acid solution with standardized hydrochloric acid [27]. The TP content was assayed using the ammonium molybdate spectrophotometric method, where soil samples were digested with sulfuric acid and perchloric acid, and then ammonium molybdate and ascorbic acid were added to the digestate, followed by spectrophotometric determination of the absorbance [27]. The AN content was determined using the alkaline hydrolysis diffusion method, where soil samples and a reductant were placed in the outer chamber of a diffusion dish, a NaOH solution was added, and the mixture was sealed and reacted in a 40 °C incubator for 24 h. A mixed indicator was then added, and titration with standardized acid was performed until the endpoint was reached [27]. The AP content was measured using the molybdenum–antimony–ascorbic acid spectrophotometric method, where soil samples and solid NaOH were placed in a nickel crucible, fused at 450 °C for 15 min, cooled, dissolved in water, and brought to volume with diluted sulfuric acid. A molybdenum–antimony–ascorbic acid color reagent was then added, and the absorbance was measured [27]. The AK content was determined using the flame photometry method, where the solution from the previous step (brought to volume with diluted sulfuric acid) was atomized and sprayed into a flame [27]. The EC and pH were measured using a DDS-11 conductivity meter and an SH-3 precision pH meter, respectively [27,28]. C/N is the ratio of the SOC to TN, C/P is the ratio of the SOC to TP, and N/P is the ratio of the TN to TP.

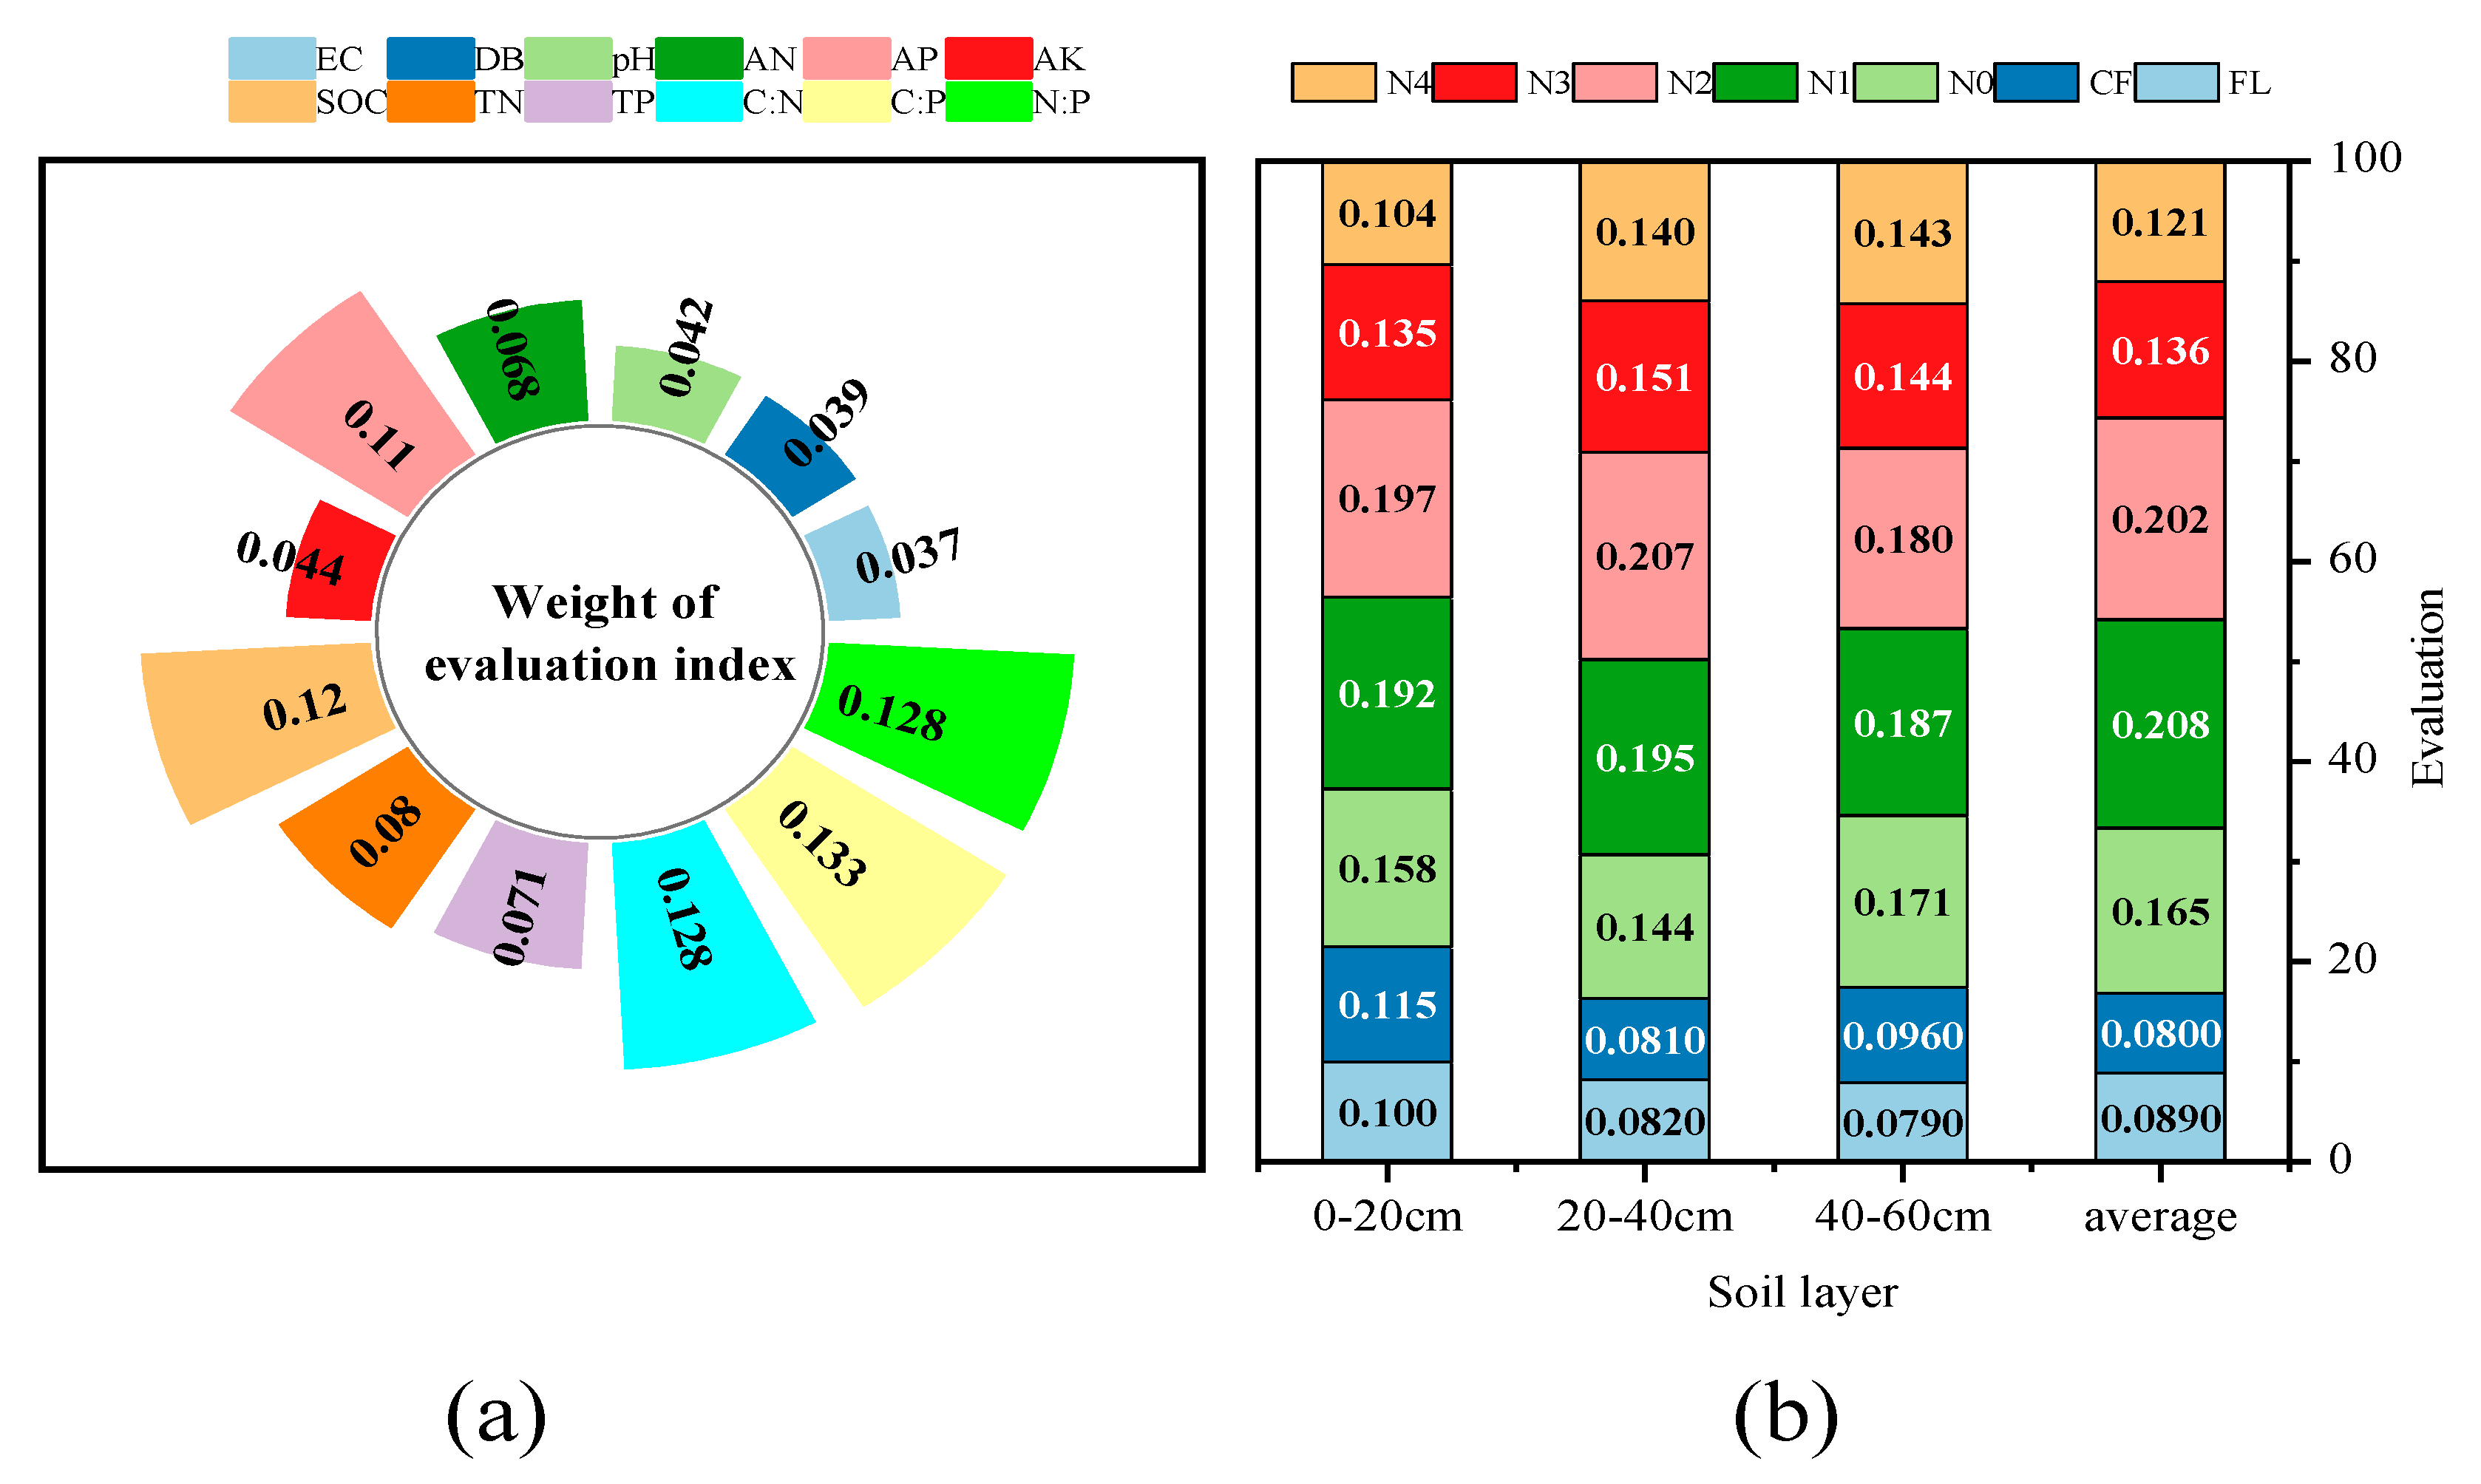
2.4. AHP-Fuzzy Comprehensive Evaluation

The AHP-fuzzy comprehensive evaluation model mainly has two parts. In the first part, the AHP method is used to determine the weight of the index system. In this study, the sum product method was used to find the maximum eigenvalue of the judgment matrix and the corresponding eigenvector. The weight vector set obtained was the index weight value W of the fuzzy evaluation. In the second part, the fuzzy membership function method is used to establish the fuzzy relation matrix R, the fuzzy synthesis operation (fuzzy weighted average operator) is used to calculate the total target evaluation vector Z, and the final evaluation value E is obtained by normalization [29,30]. The details are as follows:
Establish the judgment (paired comparison method) matrix
A = a 11 a 12 a 21 a 22 a 1 n a 2 n a n 1 a n 2 a nn
where aij (i, j = 1, 2, …, n) is the degree of importance of the former rather than the latter when factor ai is compared with factor aj. The larger the aij, the greater the importance of ai relative to aj (Table 1).
Normalize the judgment matrix A
A ij ¯ = A ij i = 1 n A ij     i , j = 1 , 2 , 3 n
Calculate A -
W   ¯ = W 1 ¯ , W 2 ¯ , W 3 ¯ , , W n ¯ T W i ¯ = j = 1 n A ij ¯
Normalize W
W = W 1 , W 2 , W 3 , , W n T W i = W i ¯ i = 1 n W i ¯
Determine the index weight value W
W = W 1 , W 2 , W 3 , , W n i = 1 n W i = 1
Perform a consistency test of the judgment matrix. In this study, the RI value was 1.53 based on the look up table, and the CR value was 0.058 < 0.1, indicating that the obtained index weight was available.
CR = CI RI ;   CI = λ max     n n     1 ,   λ max = 1 n i = 1 n j = 1 n a ij w ij W j
Establish the fuzzy relation matrix R according to the theory of the fuzzy membership degree.
R = r 11 r 1 n r n 1 r nn
Combine the weight vector W and the fuzzy relation matrix R (the fuzzy weighted-average operator) to obtain the overall objective evaluation vector:
Z = W R = W 1 , W 2 , W 3 , , W n r 11 r 1 n r n 1 r nn
Obtain the evaluation result E after normalization.
E = Z i i = 1 n Z i

2.5. Statistical Analysis

Data analyses were performed using the Office 2019 and SPSS 23.0 software (IBM Corporation, Armonk, NY, USA). Significant differences were determined using a one-way analysis of variance, followed by a least significant difference test to analyze the differences (α = 0.05) among various soil variables under different nitrogen application conditions. The Origin 2022 software was used to create relevant graphs.

3. Results

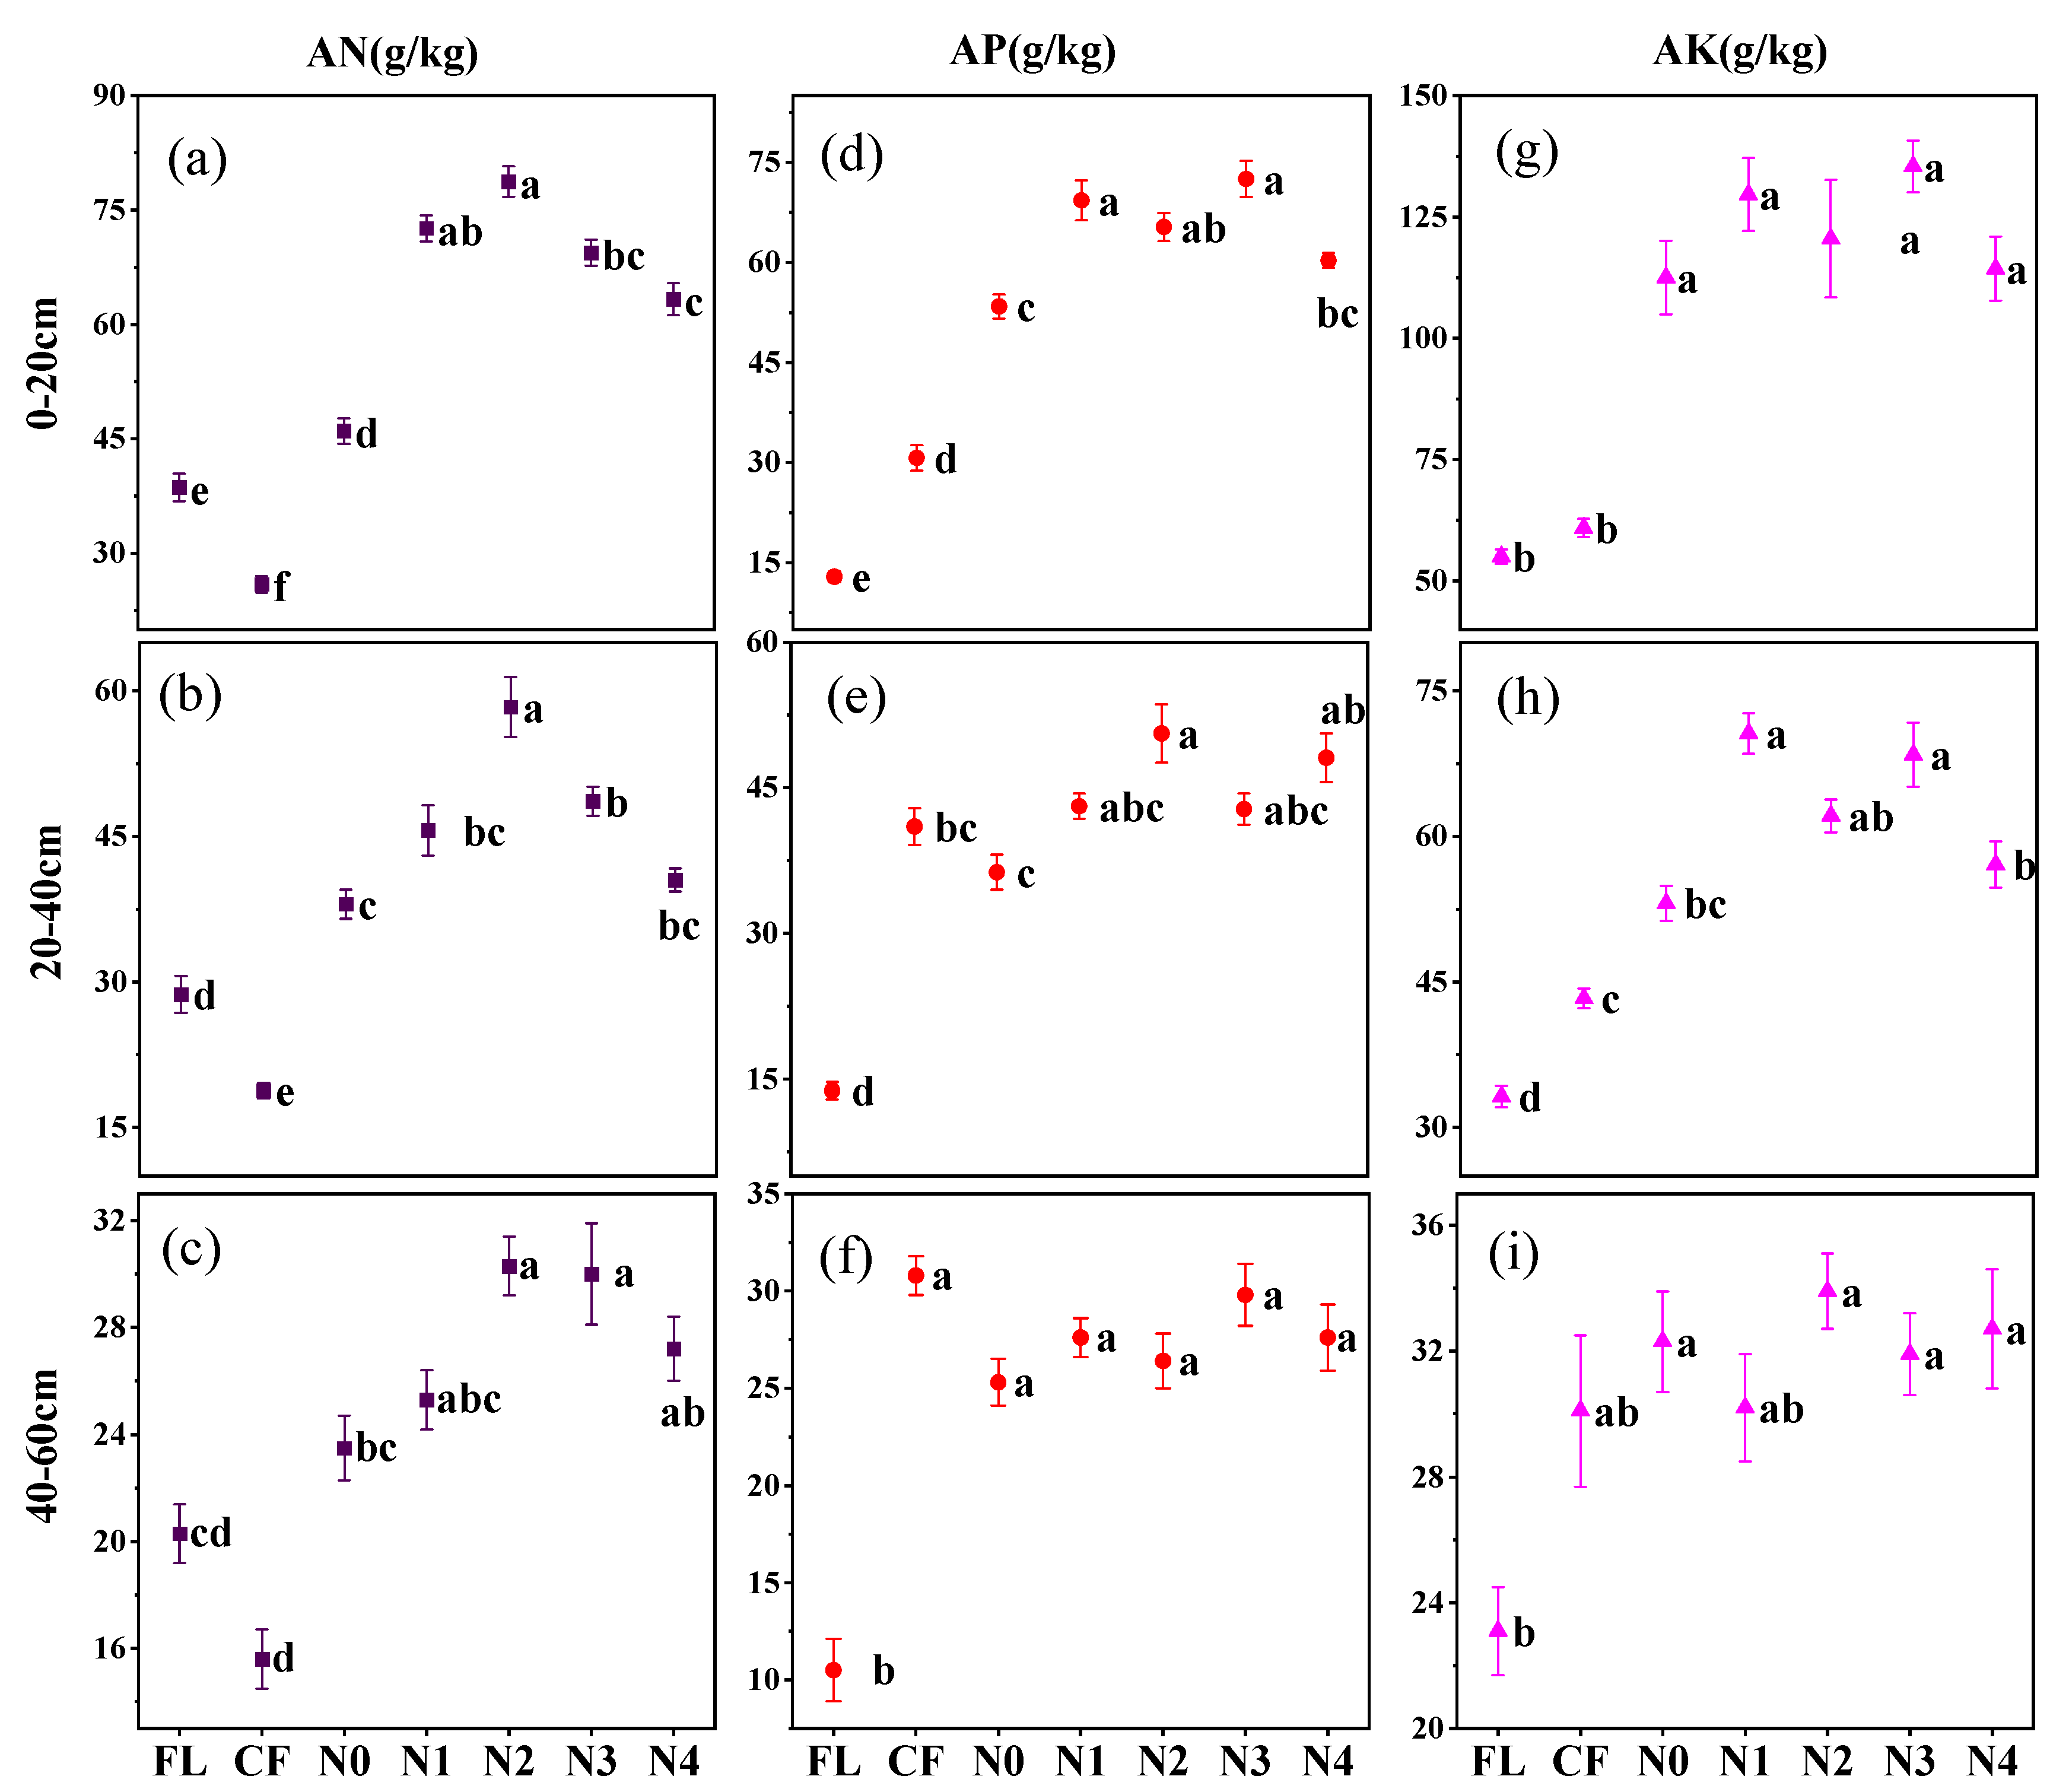
3.1. Changes in Soil Physicochemical Properties

Conversions in land use patterns caused an initial increase in EC values, followed by an overall decrease (Figure 2a–c). Compared with the EC values in the fallow land in 2013, those in the 0–20, 20–40, and 40–60 cm soil layers under consistent maize cultivation for 5 years (2014–2018) increased by 53.81, 60.1, and 59.67%, respectively. In contrast, the EC values in the 0–20, 20–40, and 40–60 cm layers after the subsequent conversion from maize to alfalfa cultivation (2019–2023, N0 level) decreased by 55.23, 42.79, and 34.95%, respectively. Notably, the maximum EC value in 2018 was in the 0–20 cm layer, whereas the maximum value in 2023 shifted to the 20–40 cm layer under alfalfa cultivation (N0 level). The decline in EC values gradually diminished within the same soil layer and year with increasing nitrogen application levels in alfalfa fields. The EC value in the 0–20 cm layer was significantly lower (p < 0.05) in the alfalfa field than in the maize and uncultivated land. Furthermore, the EC value in the 20–60 cm layer was significantly higher (p < 0.05) in the maize field than in the other groups.
Compared with those in uncultivated land, the soil BD in the three layers significantly increased (p < 0.05) in consistent maize cultivation for 5 years (Figure 2d–f). Excluding the 0–20 cm layer in the N4 treatment, the BD values of the 0–20, 20–40, and 40–60 cm soil layers were significantly lower in the alfalfa field (2023) under all treatments than in the maize field in 2018. Although no clear trend was observed in the 40–60 cm layer, the BD value increased with the increasing nitrogen fertilization rate in the 20–40 cm layer.
Furthermore, in the 0–20 cm layer, the soil pH showed an initial increase and then decreased with the conversion in the land use pattern (Figure 2g–i), whereas in the 20–60 cm layer, the soil pH showed a consistent declining trend with the conversion in the land use pattern. After conversion from maize to alfalfa cultivation, the soil pH decreased gradually with the increasing nitrogen application rate.
As shown in Figure 3, the soil AN content showed an initial decrease and then increased with the conversion in the land use pattern. Compared with that in the uncultivated land, the soil AN content in the 0–40 cm layer decreased significantly (p < 0.05) after 5 years of consecutive maize farming (2014–2018). Additionally, the conversion from maize to alfalfa cultivation significantly enhanced soil available nutrients. The soil AN, AP, and AK contents in the 0–20 cm layer were significantly higher (p < 0.05) in the alfalfa field than in the uncultivated land. Additionally, the AN content in the 20–40 cm layer remained significantly higher (p < 0.05) in the alfalfa field than in the maize and uncultivated land. Although there were no significant differences (p > 0.05) in the AP and AK contents in the 20–40 cm layer between the alfalfa and maize fields, they were significantly higher (p < 0.05) in the alfalfa field than in the uncultivated land. Nitrogen application initially increased the AN content in the alfalfa field with increasing nitrogen levels, followed by a decline. In contrast, the AP and AK contents did not show any trend with increasing nitrogen application. Moreover, the AN content showed a gradual decrease with increasing soil depth, and the effect of nitrogen application diminished progressively with increasing soil depth.

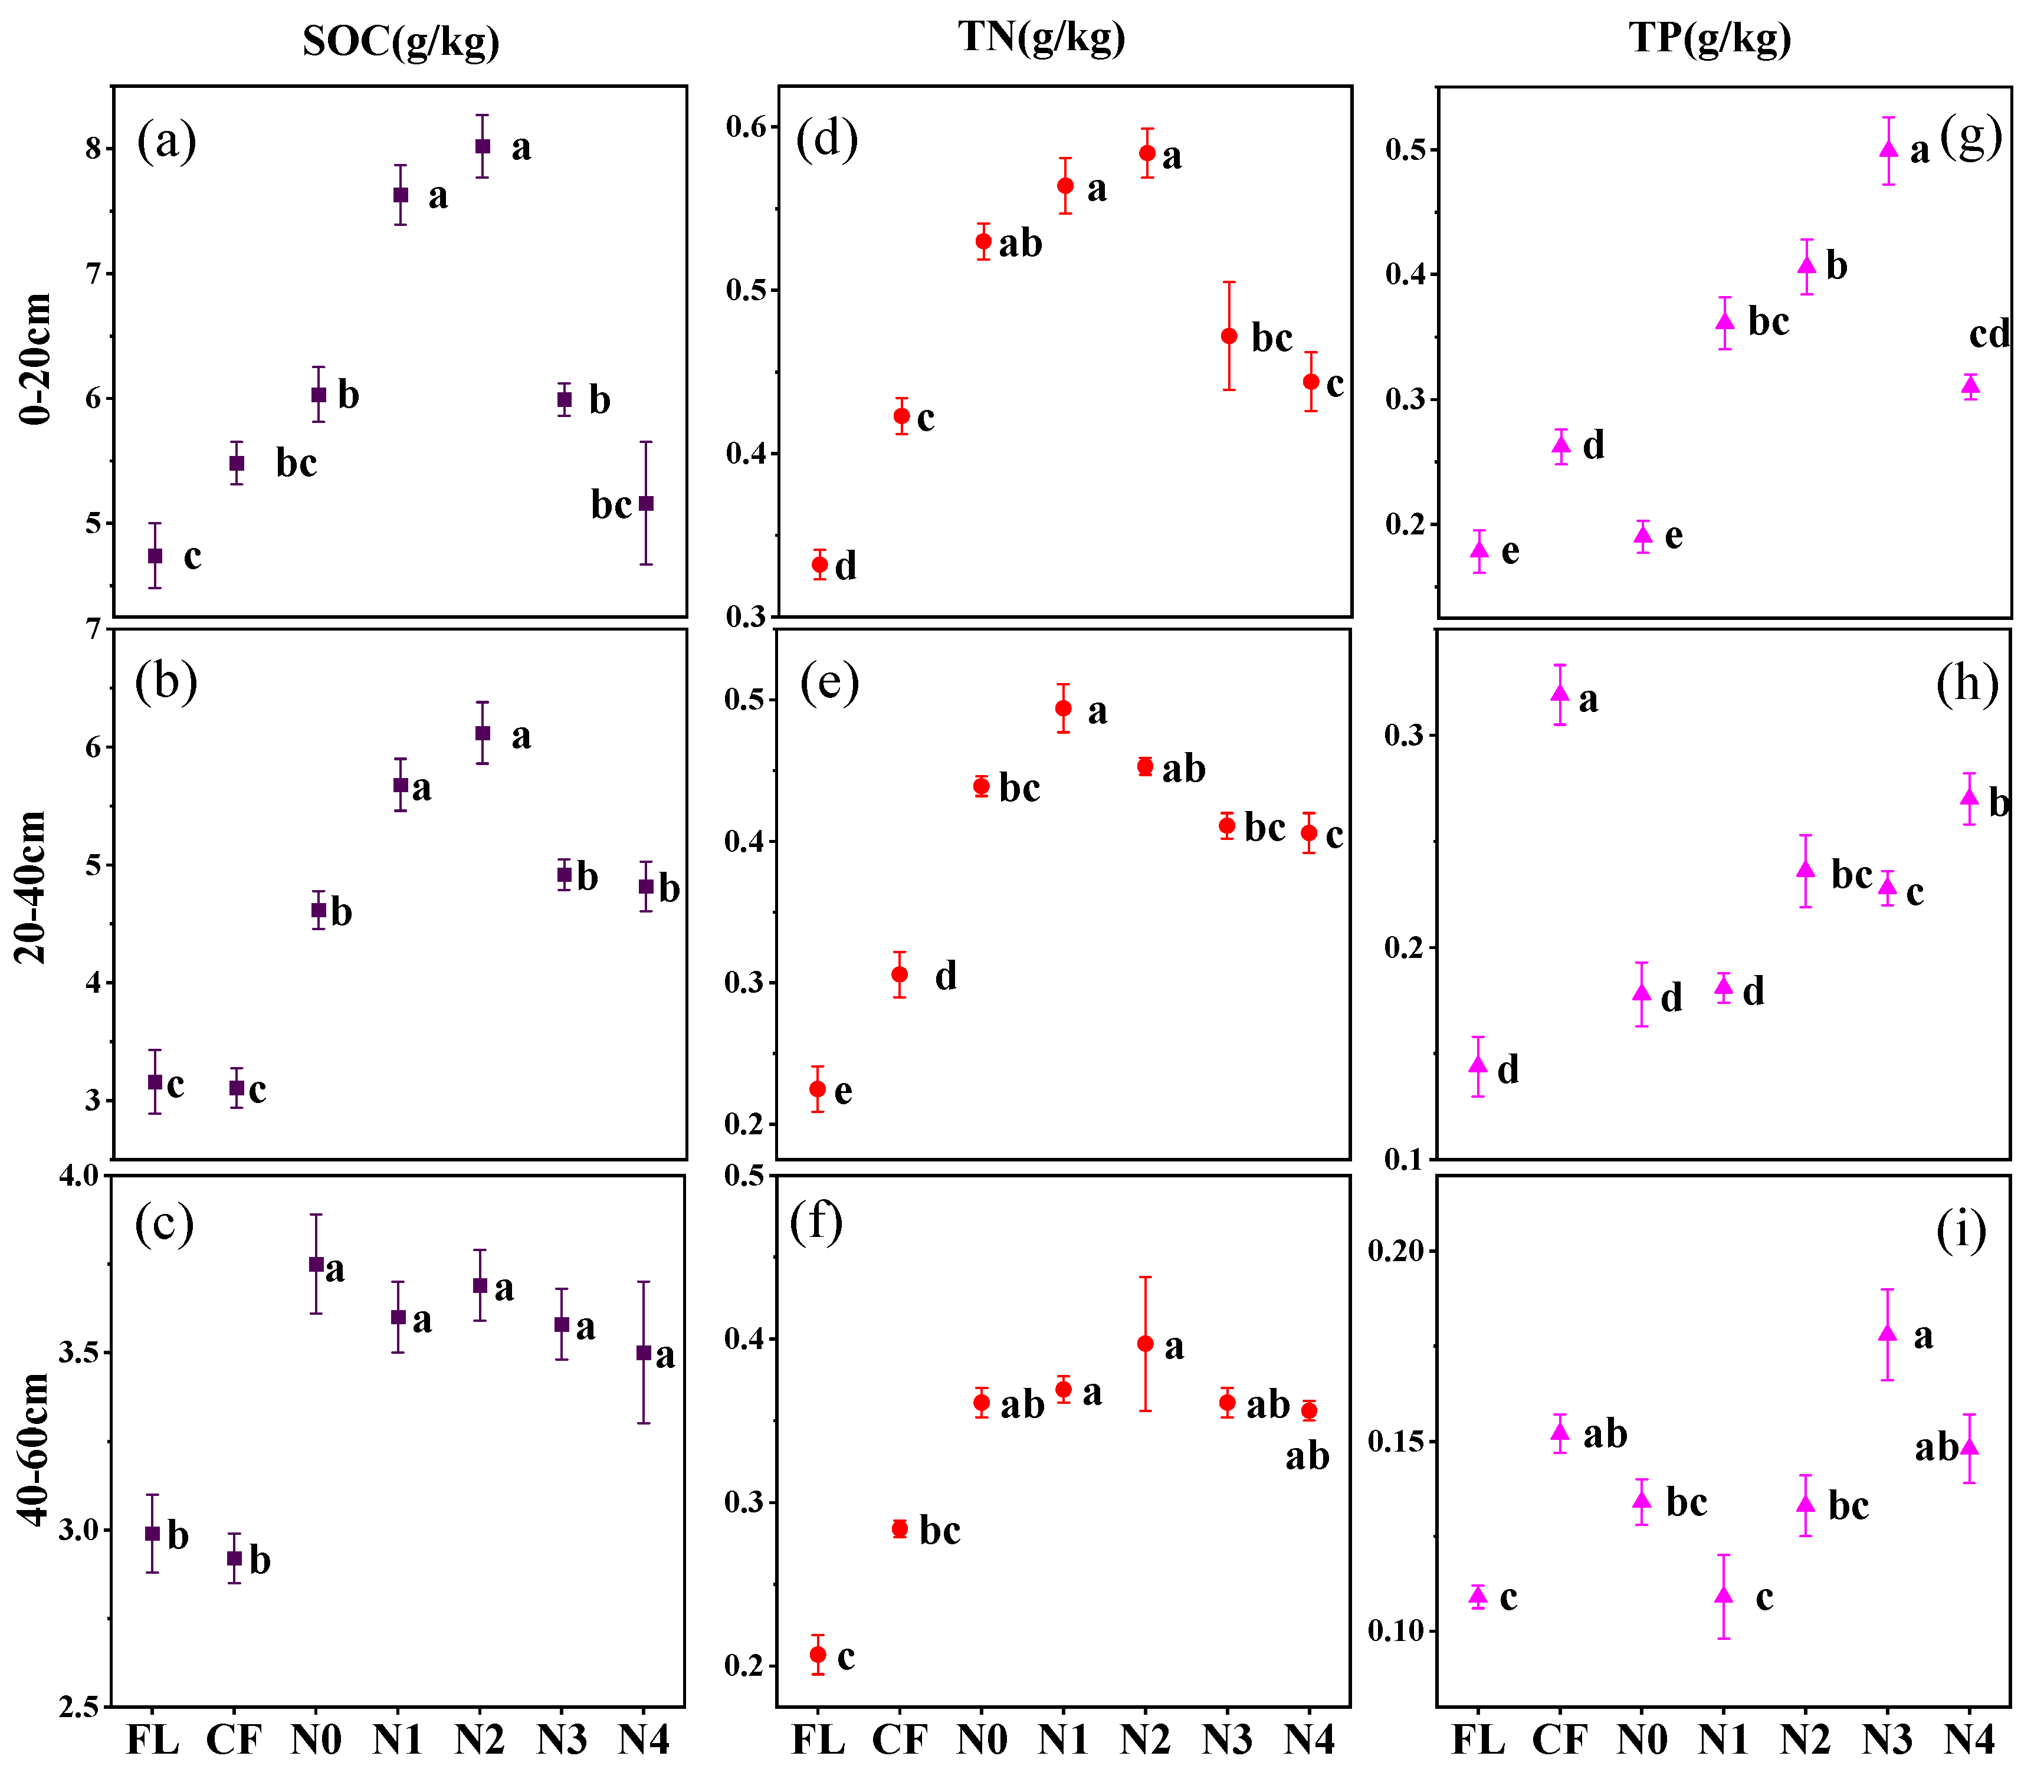
3.2. Changes in SOC, TN, and TP Contents

As shown in Figure 4, maize cultivation for 5 years significantly increased and decreased (p < 0.05) the SOC content in the 0–20 and 20–60 cm soil layers, respectively, compared to those in the uncultivated land before cultivation (Figure 4). The TN and TP contents in all soil layers (0–60 cm) were significantly higher (p < 0.05) in the maize field than in the uncultivated land. Additionally, the conversion from maize to alfalfa cultivation (N0 level) significantly increased the SOC and TN contents and also decreased the TP content. Moreover, the SOC, TN, and TP contents showed a gradual decrease with increasing soil depth. The SOC and TN contents in all soil layers (0–60 cm) were significantly higher (p < 0.05) in the alfalfa field than in the maize field and uncultivated land. Compared with the TP content in the maize and uncultivated land, that in the 0–20 cm soil layer significantly decreased (p < 0.05) in the alfalfa field under N0 treatment but significantly increased under N1, N2, N3, and N4 treatments. Although the TP content in the 20–40 cm soil layer was significantly lower in the alfalfa field than in the maize field, it was higher than that in the uncultivated land. In the alfalfa field, the SOC, TN, and TP contents in the 0–20 cm soil layer exhibited an initial increase followed by a decrease with increasing nitrogen application rates. Additionally, the effect of nitrogen application on the SOC content diminished with soil depth, showing greater impact in the 0–40 cm layer. The SOC content in the N2 treatment group was the highest and was significantly higher than that in the N0, N3, and N4 groups (p < 0.05).

3.3. Changes in Soil Ecological Stoichiometric Characteristics

The shift in land use significantly affected the soil C/N, C/P, and N/P ratios (Table 2). Maize cultivation for 5 years decreased the C/N, C/P, and N/P ratios in the 0–60 cm soil layer, with the C/P ratio showing the largest reduction, followed by the N/P and C/N ratios. Similarly to the C/N ratio, following the conversion from maize to alfalfa cultivation (N0 treatment), both the C/P and N/P ratios significantly increased. Notably, shifts in land use had the most pronounced effects on the C/N, C/P, and N/P ratios in the 20–40 cm soil layer, followed by the 0–20 cm layer. However, changes in the ratios were minimal in the 40–60 cm layer. Additionally, the C/N ratio in the 0–40 cm layer was significantly lower (p < 0.05) in the alfalfa field than in the maize field and uncultivated land. Moreover, the alfalfa field exhibited the highest C/P and N/P ratios, followed by the uncultivated land and maize field, with the maize field exhibiting the lowest C/P ratio. Although the C/N ratio did not significantly differ (p > 0.05) in the 40–60 cm layer between the alfalfa and maize fields, it was significantly lower (p < 0.05) in the alfalfa field than in the uncultivated land.

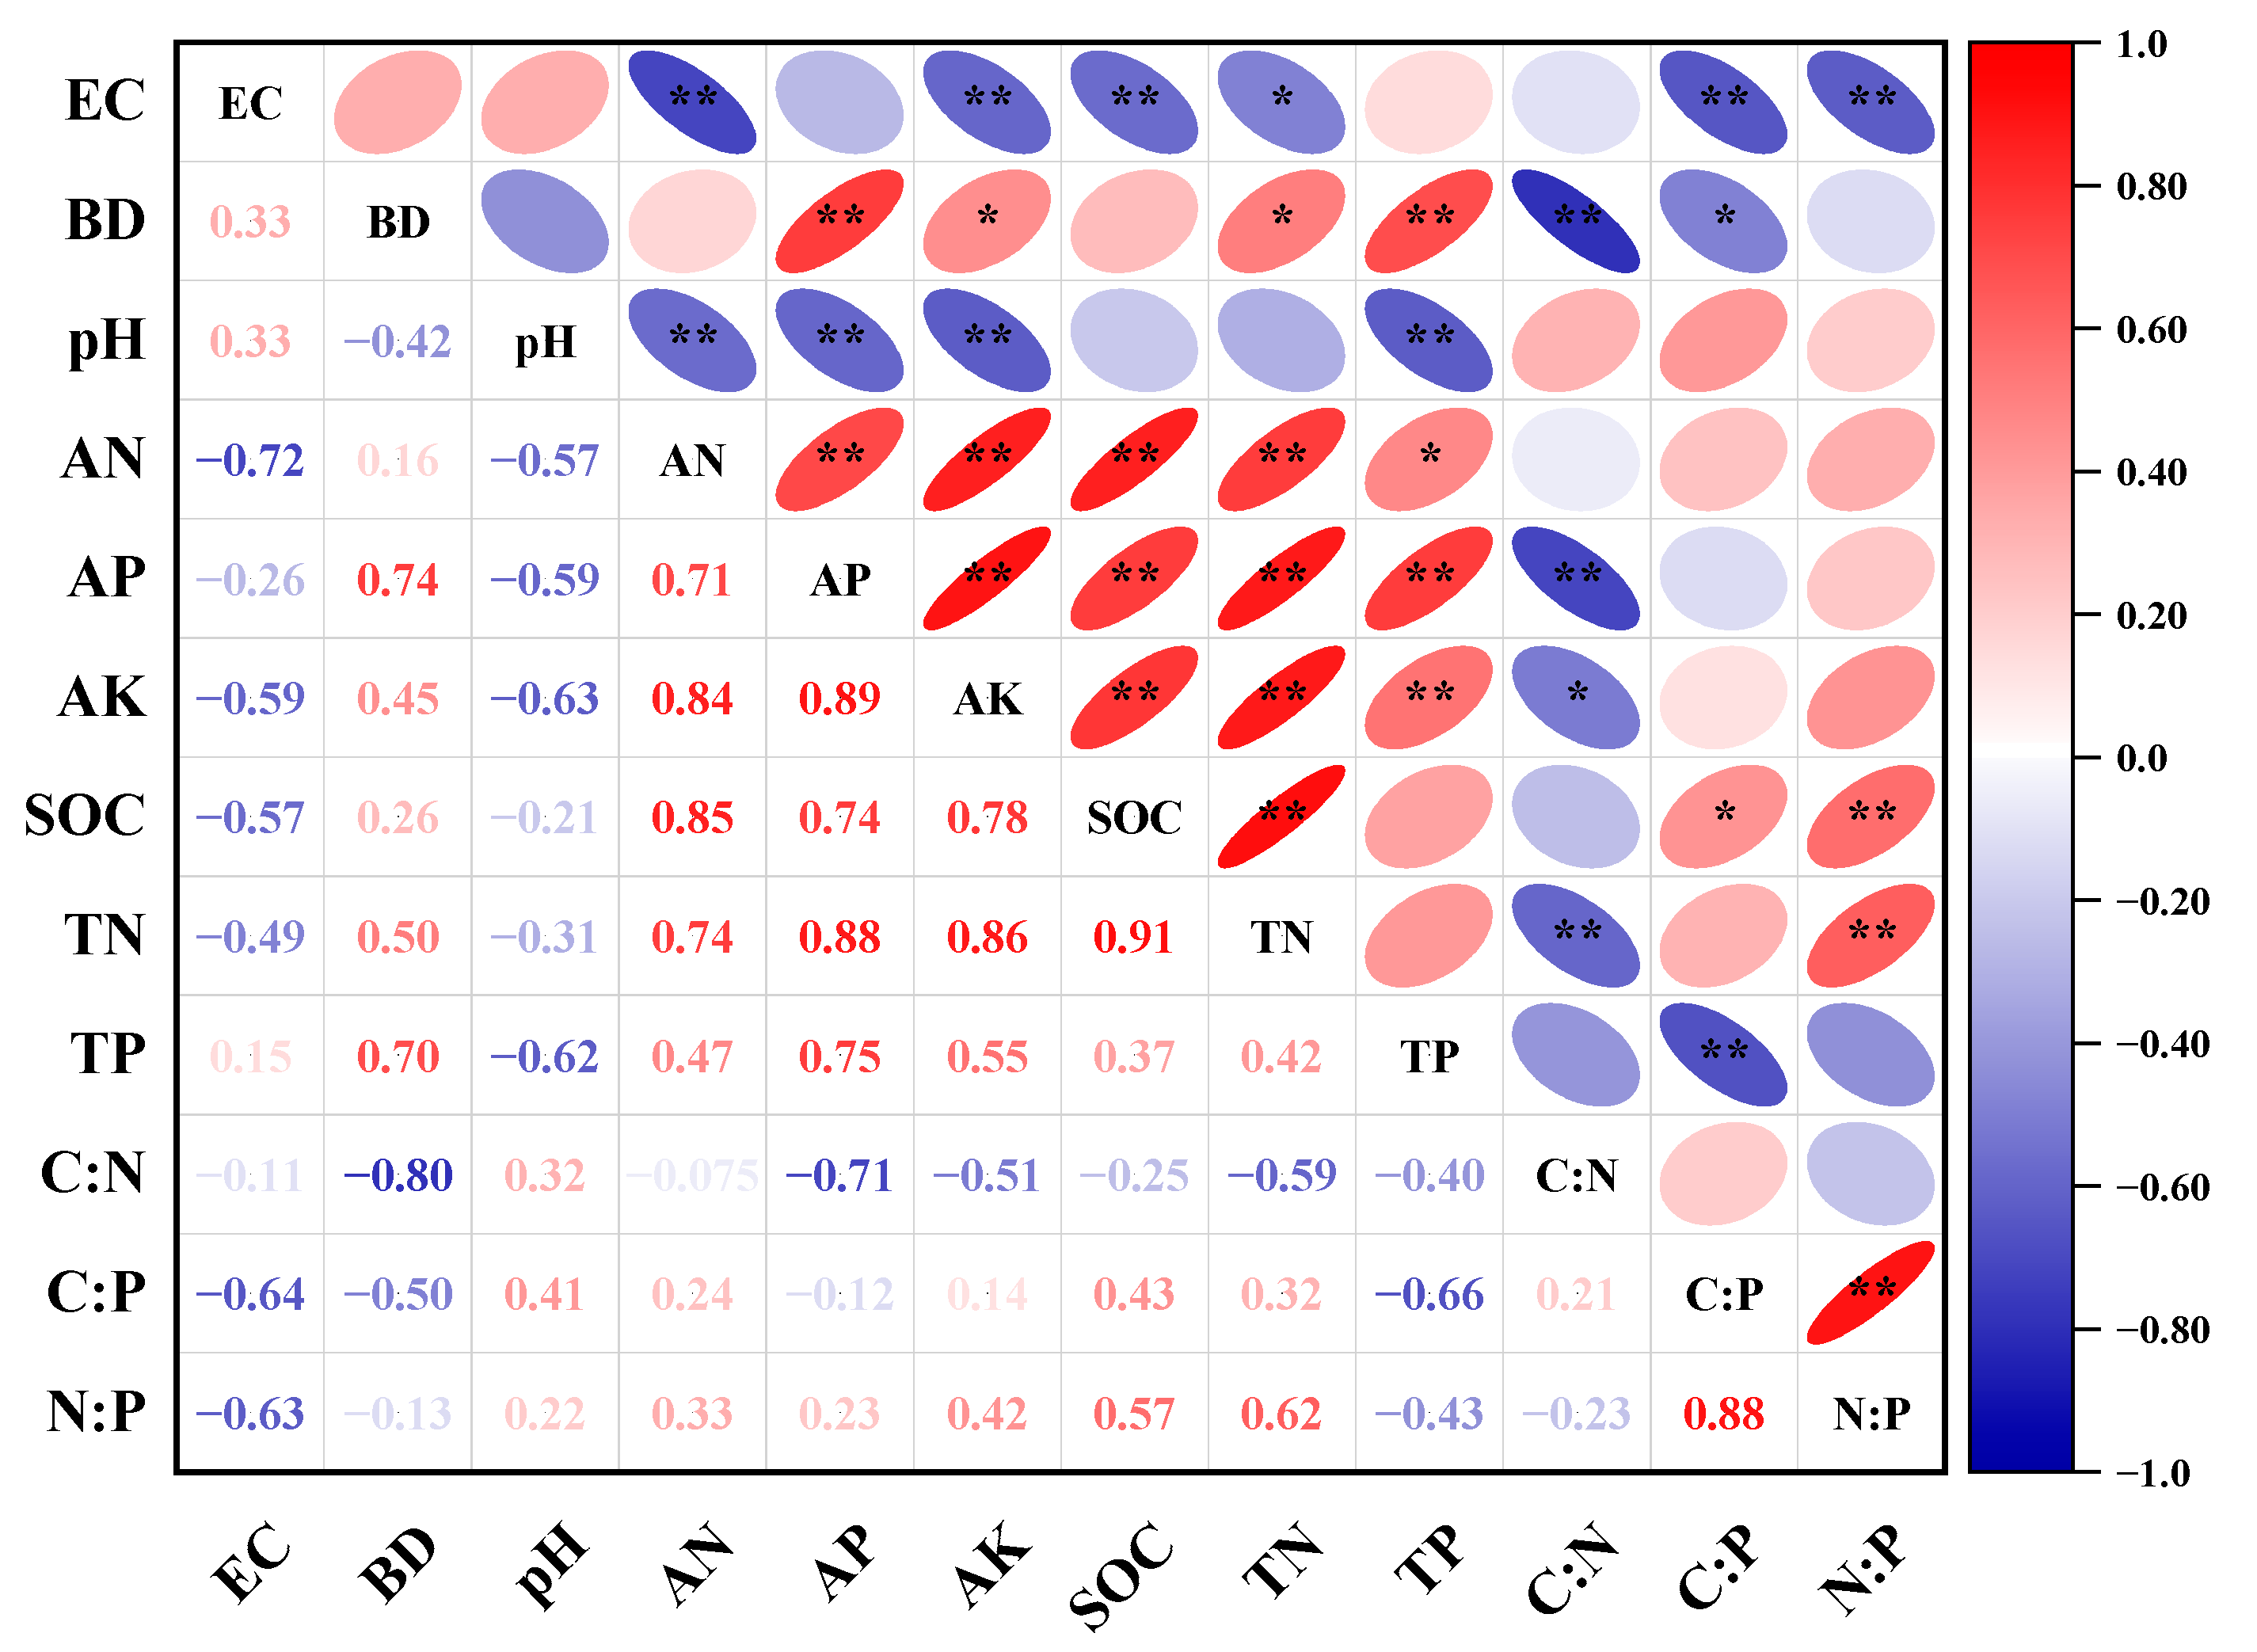
3.4. Correlations Between Soil C, N, and P Contents, Ecological Stoichiometry, and Soil Physical and Chemical Properties

As shown in Figure 5, the SOC was strongly positively correlated (p < 0.01) with the AN, AP, AK, and TN contents and the N/P ratio; positively correlated (p < 0.05) with the BD and the C/P ratio; and strongly negatively correlated (p < 0.01) with EC. The soil TN was strongly positively correlated (p < 0.01) with the SOC, AN, AP, AK contents and the N/P ratio; positively correlated with the BD (p < 0.05); and negatively correlated with the C/N (p < 0.01) and EC (p < 0.05). The soil TP was strongly positively correlated with the BD, AP, and AK (p < 0.01) and strongly negatively correlated with pH and the C/P ratio (p < 0.01). The soil C/N showed strong negative correlations with the TN, AP, and BD (p < 0.01) and a negative correlation with AK (p < 0.05). The soil C/P was strongly positively correlated with the N/P ratio (p < 0.01); positively correlated with the SOC (p < 0.05); strongly negatively correlated with EC and the TP (p < 0.01); and negatively correlated with the BD (p < 0.05). The soil N/P showed strong positive correlations with the SOC, TN, and the C/P ratio (p < 0.01) and a strong negative correlation with EC (p < 0.01).

3.5. Comprehensive Evaluation of Soil Nutrients

The indices of AP, SOC, C/N, C/P, and N/P carry significant weight values (Figure 6a) and thus serve as key factors in the comprehensive evaluation of soil nutrients. The comprehensive soil nutrient values in the uncultivated land and maize fields were similar, indicating that planting maize on uncultivated land does not improve soil nutrient status (Figure 6b). After planting alfalfa, the comprehensive soil nutrient values in the N0 treatment increased by 106.25% compared to those in the maize field. As nitrogen application rates increased, the comprehensive evaluation value of soil nutrients initially increased and then decreased, peaking in the N1 and N2 treatments.

4. Discussion

4.1. Effects of Converting Cropland to Grassland on Soil Physicochemical Properties

Our results showed that after 5 years of continuous maize cultivation, the soil BD showed a marked increase. However, the conversion from maize to alfalfa cultivation for 5 years caused a decrease (p < 0.05) in the BD, particularly in the 0–20 cm soil layer under the N0, N1, and N2 treatments. Although this finding aligns with previous reports by Nyamadzawo et al., who revealed that legume cultivation results in lower soil BD values [31], our study further confirms that planting grasses increases soil BD, while switching to legumes decreases soil BD, particularly when nitrogen application rates are between 0 and 105 kg/ha. This may be attributed to differences in root system types. Maize, with its shallow root system, exacerbates soil compaction in the surface layer, and as an annual crop, its annual mechanical operations disrupt the pore structure [32]. Additionally, 5 years of continuous monoculture can lead to microbial community imbalance, weakening the ability of the microorganisms to secrete pore-forming metabolites [33]. Compared to maize, alfalfa has a different root system type because it is a deep-rooted plant with a taproot capable of penetrating the plow layer. The death of its fine roots forms biological pores, enhancing macroaggregates [34]. Furthermore, alfalfa rhizobia secrete polysaccharides that promote the formation of microaggregates [35,36]. However, the impact of nitrogen application rates and alfalfa cultivation on soil physicochemical properties needs to be assessed across different soil textures. Future work should perform multi-site and regional trials to clarify the influence of soil texture.
Soil EC reflects the content of soluble salts in the soil [37]. Our results showed that maize cultivation for 5 years significantly increased soil EC, with the highest value observed in the 0–20 cm soil layer. In contrast, alfalfa cultivation significantly decreased soil EC, and the highest EC value was observed in the 20–40 cm soil layer. This is consistent with the report by Zhang et al., which states that EC was lower in cropland than in grassland [38]. However, it is not entirely consistent with the report by Wei et al., which states that soil EC showed an increasing trend with soil depth [39]. Usually, salt primarily accumulates in the surface layer under maize cultivation, demonstrating a distinct surface aggregation phenomenon. However, our study further confirms that after planting alfalfa, salt mainly concentrates in the middle soil layer under alfalfa cultivation, which could be attributed to reduced soil evaporation due to the high planting density and surface coverage in alfalfa fields [40]. Additionally, the deep root system of alfalfa plants may improve soil structure and enhance permeability, thereby weakening the surface accumulation of salts [41,42]. Moreover, alfalfa exerts a biological desalination effect by absorbing salts during growth, thereby inhibiting soil salinization [43]. However, soil EC increased in alfalfa fields with the increasing nitrogen application rate, highlighting the need for scientific and rational fertilization practices in soil management.
Soil available nutrient content directly reflects the soil nutrient supply capacity and fertility levels. Our results indicate that the long-term monoculture of maize reduces the soil available nitrogen (AN) content and leads to an increase in soil pH. In contrast, the long-term planting of alfalfa enhances the soil available nutrient levels, lowers the soil pH, and reduces the need for nitrogen fertilizer input. This aligns with the land improvement effects of forage crops reported by Chen et al. [44] and may be related to the nitrogen-intensive nature of maize, which presents slow residue decomposition, resulting in insufficient mineralized nitrogen [45]. The root uptake of NH4+ releases H+, and accelerated nitrate leaching leads to the loss of Ca2+ and Mg2+, thereby decreasing soil buffering capacity and increasing pH [46]. Alfalfa, with its nitrogen-fixing ability, can increase the soil AN content. The chelating effects of citrate, malate, and other compounds secreted by alfalfa roots on Al3+ can mitigate acidification, while the humus produced during decomposition enhances the pH buffering capacity [47]. Furthermore, our results show that only moderate nitrogen application improves soil available nutrient levels in alfalfa fields, while excessive nitrogen fertilizer has an inhibitory effect. This trend is consistent with the impact of nitrogen application rates on soil available nutrients reported by Chen et al. [48]. However, our study further confirms that nitrogen application rates of 0–105 kg/ha in alfalfa fields are beneficial for soil fertility improvement. This may be because nitrogen application rates below 105 kg/ha favor the activation of rhizobium symbiosis, balance carbon and nitrogen metabolism, and regulate microbial communities. Excessive nitrogen inputs, however, lead to the shutdown of the nitrogen-fixing system, and ion antagonism inhibits nitrogen transformation in the soil [49], causing microbial dysfunction. Of note, this study was conducted specifically in the Horqin Sandy Land and involved a wide range of nitrogen application rates for alfalfa. Future work should delve deeper into the relationship between nitrogen application rates and nitrogen fixation in alfalfa.

4.2. Effects of Converting Cropland to Grassland on Soil SOC, TN, and TP Contents

Our results indicate that switching from maize cultivation to alfalfa cultivation and applying appropriate nitrogen application rates can enhance the soil organic carbon (SOC), total nitrogen (TN), and total phosphorus (TP) contents. This promotes nutrient accumulation in the surface soil of alfalfa fields, improves the soil quality in the Horqin Sandy Land, and thus enhances soil productivity. This is consistent with the report by Mensah et al., which states that converting cropland to grassland for 5–12 years increased soil carbon in the 0–5 cm layer by 52.7% [50]. However, our study further reveals that nitrogen application has the most significant effect on increasing the soil total phosphorus (TP) content in the 0–20 cm soil layer. This may be because appropriate nitrogen application enhances the abundance of nitrogen-fixing bacteria and phosphorus-solubilizing bacteria, which activate insoluble phosphorus through the secretion of enzymes such as acid phosphatase [51]. This study was conducted under irrigation conditions, where adequate water availability also leads to the high solubility of nitrogen fertilizers and the limited vertical migration of phosphorus, resulting in the concentration of TP in the surface layer. As the experimental site in this study was equipped with irrigation facilities, the impact of water on the soil was not considered; thus, the findings are only applicable to planting areas with irrigation conditions. Future work should further clarify the soil remediation effects from the perspective of water–fertilizer coupling.

4.3. Effects of Converting Cropland to Grassland on Ecological Stoichiometric Characteristics

The stoichiometric ratios of agricultural soils in China are as follows: C/N, 14.6; C/P, 66.6; and N/P, 4.5 [52]. Our results showed that the soil C/N, C/P, and N/P ratios in the Horqin Sandy Land were lower than the national averages. Maize cultivation on uncultivated land for 5 years decreased the C/N, C/P, and N/P ratios. Although the conversion from maize to alfalfa cultivation significantly increased the C/P and N/P ratios. This differs from the C, N, and P ratios reported by Wang et al. for alfalfa fields cultivated on mine spoil dumps [53]. This may be due to differences in the hydrothermal conditions and soil conditions between the two ecosystems. In addition, maize is a gramineous crop with high nitrogen demand; thus, the low return of phosphorus from residues leads to a decrease in the N/P ratio. However, alfalfa relies predominantly on biological nitrogen fixation, and its roots secrete citric acid to dissolve Fe/Al-P and present increased phosphatase activity, resulting in an elevated C/P ratio [50]. The soil N/P ratio reflects the relative equilibrium of soil nutrients and serves as an effective predictor of nutrient limitation types [53]. For instance, N/P ratios < 10 indicate that nitrogen is the primary limiting nutrient in the ecosystem, whereas N/P ratios > 20 indicate that phosphorus is the key limiting soil nutrient. Additionally, a range of 10 < N/P < 20 indicates that both N and P limitations coexist [54]. Our results showed that the soil N/P ratio was <10 in the Horqin Sandy Land, indicating that nitrogen is the primary limiting factor for vegetation growth in the region, and that the soil organic matter decomposition rate is relatively higher in the region. While this study primarily focused on changes in soil nutrients, it only clearly established the direct impacts of the conversion from the monoculture of one crop to another (corn to alfalfa) and applying different nitrogen levels on soil nutrient variations. Future work will further explore the interactions among factors such as soil depth and years, crop planting, and fertilizer application rates to gain a more comprehensive understanding of soil nutrient dynamics and soil quality changes.

4.4. Correlations Among Soil C, N, and P Contents, Ecological Stoichiometry, and Soil Physicochemical Properties

Soil C, N, and P contents are closely related. Our results indicate a highly significant positive correlation between the SOC and TN in the Horqin Sandy Land (p < 0.01); however, the TP is not significantly correlated with either the SOC or TN, suggesting that the soil TP in this area is not affected by other nutrients and is mainly dependent on the soil parent material weathering and mineral weathering. We used the AHP-fuzzy comprehensive evaluation model to further reveal that the AP, SOC, C/N, C/P, and N/P were key contributors to soil quality in the Horqin Sandy Land. Our findings suggest that cultivating alfalfa with moderate nitrogen application (50–105 kg/ha) is more beneficial for improving soil fertility in the Horqin Sandy Land than in traditional cropland practices. Yu et al. employed the Technique for Order Preference by Similarity to Ideal Solution (TOPSIS) method to rank the productivity of mixed grassland under different treatments [55]. This study integrates weights through hierarchical assignment using the AHP, which can combine multi-level indicators and overcome the limitation of single models that only focus on a few variables. The output results can characterize the restoration status of soil quality, thereby providing more information than the single ranking value obtained from the TOPSIS method. It is also suitable for diagnosing soil restoration processes with small sample sizes and multiple criteria. However, the AHP-fuzzy comprehensive evaluation model has high computational complexity. When the number of indicators is excessive, it may fail to perform consistency checks or cause imbalances in weight allocation. The optimal calculation method for this type of research remains to be explored.

5. Conclusions

Changes in land use patterns significantly affect soil nutrient and physicochemical properties. Our research results support this theory. Through the intensive cultivation of alfalfa, soil carbon and nitrogen losses can be partially reversed. Especially, when alfalfa is treated with nitrogen at application rates ranging from 50 to 105 kg/ha, it favors organic matter mineralization and enhances the availability of nitrogen and phosphorus. However, excessively high nitrogen application rates (210 and 315 kg/ha) accelerate soil nutrient loss and acidification. Therefore, the relationship between the nitrogen application rate and soil nutrients can provide a theoretical basis for formulating nitrogen application regimes for alfalfa. These conclusions can optimize quality and yield while improving soil fertility and maintaining sustainable soil health, especially in soil-poor sandy areas where fertilizer inputs must be carefully managed to meet the restoration needs of desertified soils. In practice, a maize–alfalfa rotation with appropriate nitrogen fertilizer supplementation to promote soil recovery can be adopted.
Our study provides valuable insights for the scientific management of planting systems in this region. However, a limitation of this study is that it only analyzed the effects of nitrogen fertilizer management from the perspective of soil nutrients and was conducted under irrigation conditions; thus, it did not consider the impact of water on soil improvement. The positive effects on soil recovery of land restoration practices, such as afforestation and grassland conversion, are influenced by multiple factors, including the restoration duration, local climatic conditions, the soil nutrient status, and plant functional groups. Therefore, future research should focus on the long-term monitoring of alfalfa cultivation under low nitrogen application levels and explore the integrated mechanisms of multi-factor interactions.

Author Contributions

F.H.: Writing—original draft, Writing—review and editing, Methodology, Investigation, Formal Analysis, Conceptualization. C.L.: Data curation, Conceptualization, Methodology. T.Y.: Writing—review and editing, Resources, Methodology, Data curation, Project administration, Funding acquisition. H.A.: Writing—review and editing, Investigation. M.X.: Writing—review and editing, Methodology. K.G.: Supervision. J.Y.: Methodology. All authors have read and agreed to the published version of the manuscript.

Funding

This research was funded by the Inner Mongolia Autonomous Region Natural Science Foundation of China (2023QN03036), the Special Research Project of universities in the Inner Mongolia Autonomous Region to strengthen the construction of the important ecological security barrier in northern China (STAQZX202315), the Inner Mongolia Autonomous Region Natural Science Foundation of China (2025LHMS03049), and the Basic Scientific Research Business Fee Project for directly affiliated universities in the Inner Mongolia Autonomous Region (GXKY23Z021).

Data Availability Statement

Data are contained within the article.

Acknowledgments

We would like to thank Editage for English language editing. https://www.editage.cn (accessed on 18 June 2025).

Conflicts of Interest

The authors declare no conflicts of interest.

Abbreviations

The following abbreviations are used in this manuscript:
BDBulk Density
ECElectrical Conductivity
TNTotal Nitrogen
TPTotal Phosphorus
ANAvailable Nitrogen
APAvailable Phosphorus
AKAvailable Potassium
SOCSoil Organic Carbon

References

  1. Xu, H.; Qu, Q.; Li, P.; Guo, Z.; Wulan, E.; Xue, S. Stocks and stoichiometry of soil organic carbon, total nitrogen, and total phosphorus after vegetation restoration in the loess hilly region, China. Forests 2019, 10, 27. [Google Scholar] [CrossRef]
  2. Piaszczyk, W.; Błońska, E.; Lasota, J.; Lukac, M. A comparison of C:N:P stoichiometry in soil and deadwood at an advanced decomposition stage. Catena 2019, 179, 1–5. [Google Scholar] [CrossRef]
  3. Wang, S.; Li, T.; Yuan, X.; Yu, J.; Luan, Z.; Guo, Z.; Yu, Y.; Liu, C.; Duan, C. Biotic and abiotic drivers of soil carbon, nitrogen, and phosphorus and metal dynamic changes during spontaneous restoration of Pb–Zn mining wastelands. J. Hazard. Mater. 2025, 490, 137818. [Google Scholar] [CrossRef] [PubMed]
  4. Chen, X.; Opoku-Kwanowaa, Y.; Li, J.; Wu, J. Application of organic wastes to primary saline-alkali soil in Northeast China: Effects on soil available nutrients and salt ions. Commun. Soil Sci. Plant Anal. 2020, 51, 1238–1252. [Google Scholar] [CrossRef]
  5. Elser, J.J.; Fagan, W.F.; Kerkhoff, A.J.; Swenson, N.G.; Enquist, B.J. Biological stoichiometry of plant production: Metabolism, scaling, and ecological response to global change. New Phytol. 2010, 186, 593–608. [Google Scholar] [CrossRef]
  6. Hayatu, N.G.; Liu, Y.R.; Han, T.F.; Daba, N.A.; Zhang, L.; Shen, Z.; Li, J.W.; Muazu, H.; Lamlom, S.F.; Zhang, H.M. Carbon sequestration rate, nitrogen use efficiency and rice yield responses to long-term substitution of chemical fertilizer by organic manure in a rice–rice cropping system. J. Integr. Agric. 2023, 22, 2848–2864. [Google Scholar] [CrossRef]
  7. Borer, E.T.; Seabloom, E.W.; Gruner, D.S.; Harpole, W.S.; Hillebrand, H.; Lind, E.M.; Adler, P.B.; Alberti, J.; Anderson, T.M.; Bakker, J.D.; et al. Herbivores and nutrients control grassland plant diversity via light limitation. Nature 2014, 508, 517–520. [Google Scholar] [CrossRef]
  8. Li, X.; Zhang, W.J.; Wu, L.; Ren, Y.; Zhang, J.D.; Xu, M.G. Advance in indicator screening and methodologies of soil quality evaluation. Sci. Agric. Sin. 2021, 54, 3043–3056. [Google Scholar]
  9. Cook, K. Soil microbiology, ecology, and biochemistry, fourth edition. Soil Sci. Soc. Am. J. 2015, 79, 1821. [Google Scholar] [CrossRef]
  10. Peng, Z.; Wu, Y.; Guo, L.; Yang, L.; Wang, B.; Wang, X.; Liu, W.; Su, Y.; Wu, J.; Liu, L. Foliar nutrient resorption stoichiometry and microbial phosphatase catalytic efficiency together alleviate the relative phosphorus limitation in forest ecosystems. New Phytol. 2023, 238, 1033–1044. [Google Scholar] [CrossRef]
  11. Hai, X.Y.; Dong, L.B.; Wang, X.Z.; Deng, L.; Li, J.W.; Liu, Y.L.; Li, M.Y.; Pan, Y.J.; Lv, W.W.; Shangguan, Z.P. Effects of carbon, nitrogen, and phosphorus ecological stoichiometry characteristics on plant diversity since returning farmland to grassland on the Loess Plateau. Acta Ecol. Sin. 2020, 40, 8570–8581. [Google Scholar]
  12. Lin, Z.; Deng, J.; Gao, K.; Zhang, Z. Oat nutrition, traits, and yield as affected by the interaction of nitrogen rates and plant density in sandy soil. Agronomy 2025, 15, 150. [Google Scholar] [CrossRef]
  13. Gao, J.L.; Luo, F.M.; Gao, Y.; Dang, X.H.; Meng, Z.J.; Chen, X.N.; Duan, N. Ecological soil C, N, and P stoichiometry of different land use patterns in the agriculture-pasture ecotone of Northern China. Acta Ecol. Sin. 2019, 39, 5594–5602. [Google Scholar]
  14. Malhi, S.S.; Brandt, S.; Gill, K.S. Cultivation and grassland type effects on light fraction and total organic C and N in a dark brown chernozemic soil. Can. J. Soil Sci. 2003, 83, 145–153. [Google Scholar] [CrossRef]
  15. Yu, T.; Lin, F.; Liu, X.; Wang, X. Recovery role in soil structural, carbon and nitrogen properties of the conversion of vegetable land to alfalfa land in northwest China. J. Soil Sci. Plant Nutr. 2020, 20, 1366–1377. [Google Scholar] [CrossRef]
  16. Su, Y.Z.; Liu, W.J.; Yang, R.; Chang, X.X. Changes in soil aggregate, carbon, and nitrogen storages following the conversion of cropland to alfalfa forage land in the marginal oasis of northwest China. Environ. Manag. 2009, 43, 1061–1070. [Google Scholar] [CrossRef]
  17. Zhou, Z.C.; Zhang, X.Y.; Gan, Z.T. Changes in soil organic carbon and nitrogen after 26 years of farmland management on the Loess Plateau of China. J. Arid Land 2015, 7, 806–813. [Google Scholar] [CrossRef]
  18. He, Y.C.; Hu, Z.H.; Xiang, Y.Z.; Zhang, J.X.; Qian, Y.Q.; Wang, Y.X.; Xu, F.W. Effects of grassland restoration from cropland on soil carbon sequestration and the controlling factors across China. Pratacult. Sci. 2024, 41, 262–270. [Google Scholar]
  19. Gai, X.P.; Liu, H.B.; Liu, J.; Zhai, L.M.; Wang, H.Y.; Yang, B.; Ren, T.Z.; Wu, S.X.; Lei, Q.L. Contrasting impacts of long-term application of manure and crop straw on residual nitrate-N along the soil profile in the North China Plain. Sci. Total Environ. 2019, 650, 2251–2259. [Google Scholar] [CrossRef]
  20. Wang, G.Y.; Hu, Y.X.; Liu, Y.X.; Ahmad, S.; Zhou, X.B. Effects of supplement irrigation and nitrogen application levels on soil carbon–nitrogen content and yield of one-year double cropping maize in subtropical region. Water 2021, 13, 1180. [Google Scholar] [CrossRef]
  21. Zhang, T.H.; Cong, A.Q.; Lian, J.; Xu, Y.Z.; Wang, N. Thinking from Horqin Grassland to Horqin Sandy Land. Chin. J. Appl. Ecol. 2024, 35, 25–30. [Google Scholar]
  22. Qiu, L.P.; Wei, X.R.; Zhang, X.C.; Cheng, J.M.; Gale, W.; Guo, C.; Long, T. Soil organic carbon losses due to land use change in a semiarid grassland. Plant Soil 2012, 355, 299–309. [Google Scholar] [CrossRef]
  23. Di Lascio, A.; Madeira, F.; Costantini, M.L.; Rossi, L.; Pons, X. Movement of three aphidophagous ladybird species between alfalfa and maize revealed by carbon and nitrogen stable isotope analysis. BioControl 2016, 61, 35–46. [Google Scholar] [CrossRef]
  24. Dong, W.H.; Zhang, S.; Rao, X.; Liu, C.A. Newly-reclaimed alfalfa forage land improved soil properties comparison to farmland in wheat-maize cropping systems at the margins of oases. Ecol. Eng. 2016, 94, 57–64. [Google Scholar] [CrossRef]
  25. Research Group on Soil Taxonomy, Nanjing Institute of Soil Science, Chinese Academy of Sciences; Collaborative Research Group on Soil Taxonomy in China. Keys to Chinese Soil Taxonomy, 3rd ed.; University of Science and Technology of China Press: Hefei, China, 2001; pp. 182–184. [Google Scholar]
  26. Li, T.J.; Zhao, Y.; Zhang, K.L.; Zheng, Y.S.; Wang, Y. Soil Geography, 3rd ed.; Higher Education Press: Beijing, China, 2004; pp. 282–285. [Google Scholar]
  27. Bao, S.D. Soil and Agricultural Chemistry Analysis, 3rd ed.; China Agricultural Press: Beijing, China, 2011; pp. 30–120. [Google Scholar]
  28. Pylak, M.; Oszust, K.; Frąc, M. Optimization of growing medium and preservation methods for plant beneficial bacteria, and formulating a microbial biopreparation for raspberry naturalization. Agronomy 2021, 11, 2521. [Google Scholar] [CrossRef]
  29. Wang, H.J.; Bi, F.F.; Dong, Z.F. Evaluation of ecological compensation policy for Xin’ an River Basin based on AHP-Fuzzy comprehensive method. Acta Ecol. Sin. 2020, 40, 7493–7506. [Google Scholar]
  30. Zhang, Z.; Yan, H.; Wang, X.; Gao, L.; Li, J. Comprehensive evaluation of fault sealing based on improved fuzzy comprehensive evaluation method. Earth Sci. 2024, 49, 1144–1153. [Google Scholar]
  31. Nyamadzawo, G.; Chikowo, R.; Nyamugafata, P.; Nyamangara, J.; Giller, K.E. Soil organic carbon dynamics of improved fallow–maize rotation systems under conventional and no-tillage in Central Zimbabwe. Nutr. Cycl. Agroecosyst. 2008, 81, 85–93. [Google Scholar] [CrossRef]
  32. Frene, J.P.; Pandey, B.K.; Castrillo, G. Under pressure: Elucidating soil compaction and its effect on soil functions. Plant Soil 2024, 502, 267–278. [Google Scholar] [CrossRef]
  33. Gu, J.C.; Wang, W.M.; Wang, Z.; Li, L.H.; Jiang, G.J.; Wang, J.P.; Cheng, Z.B. Effects of maize and soybean intercropping on soil phosphorus bioavailability and microbial community structure in rhizosphere. Chin. J. Appl. Ecol. 2023, 34, 3030–3038. [Google Scholar]
  34. Hudek, C.; Stanchi, S.; D’Amico, M.; Freppaz, M. Quantifying the contribution of the root system of alpine vegetation in the soil aggregate stability of moraine. Int. Soil Water Conserv. Res. 2017, 5, 36–42. [Google Scholar] [CrossRef]
  35. Olagoke, F.K.; Bettermann, A.; Nguyen, P.T.B.; Redmile-Gordon, M.; Babin, D.; Smalla, K.; Nesme, J.; Sørensen, S.J.; Kalbitz, K.; Vogel, C. Importance of substrate quality and clay content on microbial extracellular polymeric substances production and aggregate stability in soils. Biol. Fertil. Soils 2022, 58, 435–457. [Google Scholar] [CrossRef]
  36. Redmile-Gordon, M.; Gregory, A.S.; White, R.P.; Watts, C.W. Soil organic carbon, extracellular polymeric substances (EPS), and soil structural stability as affected by previous and current land-use. Geoderma 2020, 363, 114143. [Google Scholar] [CrossRef] [PubMed]
  37. Zhang, Y.Q.; Wang, W.; Hu, M.Y.; Ling, G.; Hu, X.T.; Peng, X.B. Influence of bulk density and water content on soil electrical conductivity. Arid Land Agric. Res. 2022, 40, 162–169. [Google Scholar]
  38. Zhang, X.L.; Feng, M.D.; He, B.H.; Ceng, C.; Shang, Y.J.; Li, T.Y. Soil infiltration characteristics and suitable models under different land use types in Karst Trough-valley region. Res. Soil Water Conserv. 2024, 31, 34–41. [Google Scholar]
  39. Wei, Y.Z.; Li, J.H.; Sun, X.T.; Liu, J.L.; Xiao, H.C.; Li, H.T.; Fu, C.H.; Song, X.; Zhang, Q.; Qin, L.G. Analysis of soil physical and chemical properties and ion variation rule of saline-alkali degraded grassland in Songnen. Acta Agrestia Sin. 2024, 32, 1702–1709. [Google Scholar]
  40. Wang, Y.Q.; Shao, M.A.; Shao, H.B. A preliminary investigation of the dynamic characteristics of dried soil layers on the Loess Plateau of China. J. Hydrol. 2010, 381, 9–17. [Google Scholar] [CrossRef]
  41. Su, Y.Z. Soil carbon and nitrogen sequestration following the conversion of cropland to alfalfa forage land in north west China. Soil Tillage Res. 2007, 92, 181–189. [Google Scholar] [CrossRef]
  42. Su, Y.Z.; Liu, W.J.; Yang, R.; Fan, G.P. Carbon sequestration effect following retirement of degraded croplands into alfalfa forage land in the middle of Hexi corridor region, northwest China. Acta Ecol. Sin. 2009, 29, 6385–6391. [Google Scholar]
  43. Hu, W.; Zhang, Y.H.; Li, P.; Zhang, P.; Li, M.Y.; You, J.T.; Tian, S.Q. Effects of different levels of nitrogen fertilization on soil respiration rates and soil biochemical properties in an alfalfa grassland. Environ. Sci. 2019, 40, 2858–2868. [Google Scholar]
  44. Chen, Y.; He, B.H.; Lian, C.X.; Liu, Z.P. Root system distribution characteristics of three herbs and their effects on soil composition and nutrients in the ‘Purple Soil’ region. Acta Pratacult. Sin. 2015, 24, 99–107. [Google Scholar]
  45. Xie, N.H.; An, T.T.; Liang, X.L.; Schaeffer, S.; Sun, L.J.; Fu, S.F.; Wang, J.K. Interaction between maize residues and initial soil carbon status on soil labile organic carbon pools. Appl. Soil Ecol. 2024, 202, 105482. [Google Scholar] [CrossRef]
  46. Wang, Y.; Liu, Y.H.; Xia, L.L.; Akiyama, H.; Chen, X.L.; Chen, J.; Fang, Y.Y.; Vancov, T.; Li, Y.F.; Yao, Y.Z.; et al. Accounting for differences between crops and regions reduces estimates of nitrate leaching from nitrogen-fertilized soils. Commun. Earth Environ. 2025, 6, 29. [Google Scholar] [CrossRef]
  47. Lv, A.; Wen, W.W.; Fan, N.N.; Su, L.T.; Zhou, P.; An, Y. Dehydrin MsDHN1 improves aluminum tolerance of alfalfa (Medicago sativa L.) by affecting oxalate exudation from root tips. Plant J. 2021, 108, 441–458. [Google Scholar] [CrossRef]
  48. Chen, L.; Zhang, J.B.; Zhao, B.Z.; Huang, P. Soil fertility and its response to drying-wetting alternation as affected by nitrogen fertilization rate. Acta Pedol. Sin. 2013, 50, 675–683. [Google Scholar]
  49. Phillips, R.P.; Finzi, A.C.; Bernhardt, E.S. Enhanced root exudation induces microbial feedbacks to N cycling in a pine forest under long-term CO2 fumigation. Ecol. Lett. 2011, 14, 187–194. [Google Scholar] [CrossRef]
  50. Mensah, F.; Schoenau, J.J.; Malhi, S.S. Soil carbon changes in cultivated and excavated land converted to grasses in east-central Saskatchewan. Biogeochemistry 2003, 63, 85–92. [Google Scholar] [CrossRef]
  51. Zhang, J.; Zheng, M.H.; Zhang, Y.J.; Wang, J.; Shen, H.; Lin, Y.B.; Tang, X.L.; Hui, D.F.; Lambers, H.; Sardans, J.; et al. Soil phosphorus availability affects diazotroph communities during vegetation succession in lowland subtropical forests. Appl. Soil Ecol. 2021, 166, 104009. [Google Scholar] [CrossRef]
  52. Hu, B.; Xie, M.; Li, H.; Zhao, W.; Hu, J.; Jiang, Y.; Ji, W.; Li, S.; Hong, Y.; Yang, M.; et al. Stoichiometry of soil carbon, nitrogen, and phosphorus in farmland soils in southern China: Spatial pattern and related dominates. Catena 2022, 217, 106468. [Google Scholar] [CrossRef]
  53. Wang, D.L.; Zhang, Z.Q.; Liu, Y.; Zhao, X.L.; Lian, Z.; Yu, B.H.; Wang, D. Soil ecological stoichiometric characteristics of Medicago sativa land of mining area waste dumps. Pratacult. Sci. 2022, 39, 1323–1332. [Google Scholar]
  54. Wang, M.M.; Chen, H.S.; Zhang, W.; Wang, K.L. Soil nutrients and stoichiometric ratios as affected by Land use and lithology at county scale in a Karst area, southwest China. Sci. Total Environ. 2018, 619/620, 1299–1307. [Google Scholar] [CrossRef]
  55. Yu, T.F.; Hao, F.; Gao, K.; Xiong, M.; An, H.B. Productivity, soil fertility and enzyme activity of mixed forage grasslands improved by alfalfa and nitrogen addition in Horqin Sandy Land, China. Sci. Rep. 2025, 15, 10748. [Google Scholar] [CrossRef]
Figure 1. The coordinates of the study site.
Agronomy 15 01486 g001
Figure 2. The effects of different fertilization treatments on electrical conductivity (EC), bulk density (BD), and pH in the soil. (ac) EC values in the 0–20, 20–40, and 40–60 cm soil layers. (df) The soil BD in the 0–20, 20–40, and 40–60 cm soil layers. (gi) pH values in the 0–20, 20–40, and 40–60 cm soil layers. FL indicates the fallow land in 2013, CF denotes the corn field in 2018, and N0, N1, N2, N3, and N4 represent pure nitrogen levels of 0, 105, 210, and 315 kg/ha in the alfalfa fields, respectively. Lowercase letters indicate significant differences between the same columns in different treatments (p < 0.05).
Agronomy 15 01486 g002
Figure 3. The effects of different fertilization rates on available nitrogen (AN), available phosphorus (AP), and available potassium (AK) in the soil. (ac) AN contents in the 0–20, 20–40, and 40–60 cm soil layers. (df) AP contents in the 0–20, 20–40, and 40–60 cm soil layers. (gi) AK contents in the 0–20, 20–40, and 40–60 cm soil layers. Treatment names and lowercase letters are similar to those listed in Figure 2.
Agronomy 15 01486 g003
Figure 4. The effects of different fertilization treatments on the soil organic carbon (SOC), total nitrogen (TN), and total phosphorus (TP) contents. (ac) The SOC content in the 0–20, 20–40, and 40–60 cm soil layers. (df) The TN content in the 0–20, 20–40, and 40–60 cm soil layers. (gi) The TP content in the 0–20, 20–40, and 40–60 cm soil layers. Treatment names and lowercase letters are similar to those summarized in Figure 2.
Agronomy 15 01486 g004
Figure 5. A heatmap showing the correlations between soil physicochemical properties and soil stoichiometry. * and ** indicate significant differences at p < 0.05 and p < 0.01, respectively. Red represents a positive correlation, and blue represents a negative correlation. A deeper and more flattened color indicates a stronger correlation. Numerals in the lower left triangle of the diagram represent pairwise correlation coefficients between indicators.
Agronomy 15 01486 g005
Figure 6. A comprehensive evaluation of soil nutrients. (a) The weight value of each index based on AHP. (b) Soil quality values in the 0–20, 20–40, 40–60, and 0–60 cm soil layers. Treatment names are similar to those presented in Figure 2.
Agronomy 15 01486 g006
Table 1. Comparison matrices in the analytic hierarchy process.
Quantized ValueFactor i Over Factor j
1Equally important
3Slightly important
5Strongly important
7Strongly important
9Extremely important
2, 4, 6, 8The intermediate value of two adjacent judgments
reciprocalIf i factor is compared with j factor, the judgment value aij = 1/aji is obtained
Table 2. Effects of different fertilization treatments on soil ecological stoichiometric.
Ecological StoichiometryTreatmentSoil Layer
0–20 cm20–40 cm40–60 cm
C/NFL14.3 ± 0.3 a14.1 ± 0.4 a14.5 ± 0.1 a
CF13.0 ± 0.2 ab10.2 ± 0.3 d10.3 ± 0.1 b
N011.4 ± 0.1 b10.5 ± 0.2 cd10.4 ± 0.4 b
N113.6 ± 0.6 a11.5 ± 0.6 cd9.8 ± 0.3 b
N213.7 ± 0.3 a13.5 ± 0.2 ab9.4 ± 0.2 b
N312.8 ± 0.1 ab12.0 ± 0.1 bc10.0 ± 0.5 b
N411.6 ± 0.7 b11.9 ± 0.3 c9.8 ± 0.1 b
C/PFL26.7 ± 0.8 a21.9 ± 1 bc27.3 ± 0.8 b
CF21.0 ± 0.9 b9.8 ± 0.7 d19.2 ± 0.2 c
N031.8 ± 1.2 a26.1 ± 1.3 ab28.2 ± 1.5 b
N121.1 ± 0.6 b31.6 ± 1.5 a33.4 ± 0.7 a
N219.9 ± 0.7 b26.2 ± 1.7 ab27.9 ± 0.6 b
N312.1 ± 0.7 c21.7 ± 1 bc20.3 ± 1.3 c
N416.7 ± 2 bc17.9 ± 0.4 c23.8 ± 1.2 bc
N/PFL1.87 ± 0.03 b1.56 ± 0.08 c1.89 ± 0.07 c
CF1.63 ± 0.12 bc0.96 ± 0.03 d1.87 ± 0.02 c
N02.79 ± 0.1 a2.48 ± 0.08 a2.71 ± 0.17 abc
N11.56 ± 0.02 bc2.73 ± 0.02 a3.45 ± 0.36 a
N21.45 ± 0.08 c1.94 ± 0.11 b2.98 ± 0.13 ab
N30.95 ± 0.06 d1.81 ± 0.04 bc2.05 ± 0.16 c
N41.44 ± 0.1 c1.51 ± 0.04 c2.43 ± 0.14 bc
C/N: the carbon–nitrogen ratio; C/P the carbon–phosphorus ratio; N/P: the nitrogen–phosphorus ratio. Data are expressed as the mean ± standard deviation (SD). Treatment names and lowercase letters are similar to those summarized in Figure 2.
Disclaimer/Publisher’s Note: The statements, opinions and data contained in all publications are solely those of the individual author(s) and contributor(s) and not of MDPI and/or the editor(s). MDPI and/or the editor(s) disclaim responsibility for any injury to people or property resulting from any ideas, methods, instructions or products referred to in the content.

