Article

Green Soybean’s Survival Mechanisms Under Cold Stress: A Transcriptomic Perspective

1
Hainan Key Laboratory of Crop Genetics and Breeding, Institute of Food Crops, Hainan Academy of Agricultural Sciences, Haikou 571100, China
2
Yazhouwan National Laboratory, Sanya 572024, China
*
Authors to whom correspondence should be addressed.
Agronomy 2025, 15(6), 1456; https://doi.org/10.3390/agronomy15061456 (registering DOI)
Submission received: 8 May 2025 / Revised: 7 June 2025 / Accepted: 12 June 2025 / Published: 15 June 2025

Abstract

:
Green soybean (Glycine max), commonly known as vegetable soybean or edamame, is harvested at reproductive stages 6 to 7 of pod development. At this stage, the seeds are fully grown but still green and not yet mature. Green soybean is a nutritious food high in protein and micronutrients; however, low temperatures negatively impact its production and quality. The mechanisms underlying cold stress in green soybean remain unclear. This study aims to identify differentially expressed genes (DEGs) and key pathways associated with cold tolerance through a comprehensive transcriptomic analysis of cold stress responses in a cold-tolerant green soybean variety at three time points: 3 h, 12 h, and 24 h. We identified 3415 common DEGs across three time points, with significant enrichment in categories such as “rhythmic process”, “response to blue light”, “fatty acid metabolism”, and “fatty acid degradation”. Notably, expression patterns of these pathways were similar after 3 and 24 h of cold exposure. Weighted gene co-expression network analysis (WGCNA) revealed 20 distinct modules, with two principal modules—turquoise and blue—correlating with rhythmic processes and fatty acid pathways. Additionally, we analyzed the genetic regulatory networks within these modules and identified four candidate genes (Glyma.04G015200, Glyma.18G202800, Glyma.02G123700 and Glyma.13G266500) potentially linked to cold tolerance. This study enhances our understanding of the molecular mechanisms of cold stress in green soybean and highlights key cold-responsive genes for further research.

1. Introduction

Soybean (Glycine max (L.) Merrill) is a leguminous crop native to East Asia, ranking among the world’s most economically important agricultural commodities. As a major source of protein and oil, it plays a critical role in global food security and agricultural trade [1]. According to FAOSTAT (http://www.fao.org/faostat/en/#compare, accessed on 17 October 2024), soybeans currently lead all grain crops in terms of cultivated area and are the fourth most important oilseed crop worldwide in terms of yield. This is attributed to their high nutritional value, diverse applications and widespread cultivation. Soybeans can be classified as either grain or green, based on maturity stage, intended use, and agricultural standards [2,3]. Grain soybeans are harvested at full physiological maturity when the seeds are dry and are primarily used for food processing and oil extraction and as a protein source for humans and animals [4]. In contrast, green soybeans are collected before reaching full maturity, typically at reproductive stages R6 to R7, when the pods remain green and the beans have reached physiological maturity [5,6,7]. Green soybeans are rich in essential nutrients for human health, including vitamins, protein, isoflavones, and dietary fiber. These nutrients play an important role in preventing chronic malnutrition [8,9]. Compared to mature grain soybeans, green soybeans have a sweeter taste and lack the characteristic beany flavor [2,10]. They can be used in a variety of culinary applications, such as being consumed as snacks or appetizers, being shelled and stir-fried with vegetables or meat, or being incorporated into soups, curries, and salads [11,12,13]. Green soybeans are also important ingredients in various health products, including soy milk and tofu [14,15,16]. From an agronomic perspective, green soybeans are well-suited to diverse cropping systems due to their short growth cycle, low input requirements, and efficient nitrogen fixation capacity [17,18].
The productivity and sustainability of agricultural systems worldwide are currently under threat from abiotic stressors such as extreme temperatures and soil salinity. These adverse factors can reduce average food yields by over 60% [19,20]. This indicates that enhancing plant resistance to abiotic stresses remains challenging [21,22,23]. Among the various abiotic stresses, cold stress is one of the most common. It is generally divided into two types: freezing stress (below 0 °C) and chilling stress (low, non-freezing temperatures typically ranging from 0 °C to 15 °C) [24,25,26]. Cold stress adversely affects plant yield, as well as reproductive and vegetative growth, triggering complex biochemical, physiological, and cellular responses [27,28]. Low temperatures damage chloroplasts, reduce chlorophyll content, impair photosynthesis, and disrupt nutrient and water uptake, membrane fluidity, macromolecular structure, and cellular metabolism [29,30,31]. Green soybean cultivation in temperate climates, such as China, North America, and Argentina, tends to induce cold sensitivity when exposed to low-temperature stress [32,33]. Compared to unaffected plants, cold stress reduces soybean yields by an average of 24% [34]. The optimal temperature range for green soybean growth is 15–22 °C; growth is significantly suppressed below 15 °C, flowering ceases below 10 °C, and temperatures under 6 °C can cause physiological disorders [35,36,37]. In general, low temperatures can severely inhibit green soybean growth by disrupting metabolic and physiological processes [38,39,40].
As global climate change intensifies, extreme cold events have become more frequent and severe. These events pose serious threats to agricultural production, particularly to cold-sensitive crops like soybean. In recent years, rapid advances in high-throughput omics technologies, especially RNA sequencing (RNA-seq), have greatly advanced research on the molecular mechanisms underlying crop responses to environmental stress [8]. Transcriptomics can systematically analyze transcriptomic changes in crops exposed to cold stress and identify differentially expressed genes (DEGs) linked to cold tolerance, such as MYB, CBF, COR, GmSOD, GmPOD, and GsMCU in grain soybean [41,42,43,44,45,46,47,48,49,50,51,52,53]. These genes are involved in signal transduction, antioxidant defense, and the regulation of cold response pathways. Furthermore, functional gene discovery and molecular breeding have enabled researchers to enhance cold tolerance of soybean by introducing genes such as CBF and GmDREB1 [38,47]. However, the regulatory networks that govern cold tolerance, especially the specific roles of key genes in different soybean types (such as green soybean), remain poorly understood. Most studies have focused on grain soybean, while research on cold tolerance in green soybean is limited.
Given the nutritional and economic importance of green soybean, elucidating its molecular mechanisms of cold tolerance would provide a theoretical foundation and molecular targets for genetic improvement and breeding. This could help to reduce yield losses due to cold damage and promote sustainable agricultural development. Therefore, we performed a comprehensive transcriptomic analysis of a cold-tolerant green soybean variety in order to investigate the molecular mechanisms underlying cold tolerance. The initial characterization of transcriptomic changes in green soybean following cold treatment at multiple time points (3, 12, and 24 h) was conducted. A comparative analysis was conducted, which revealed distinct gene expression patterns in response to cold stress. Furthermore, pathway enrichment and weighted gene co-expression network analysis (WGCNA) were utilized to identify key genes and physiological pathways associated with cold tolerance. The findings of this study provide valuable insights for the breeding of green soybean varieties with enhanced cold resilience, which will contribute to improved yield and crop stability under climate change.

2. Materials and Methods

2.1. Plant Material and Cold Stress Treatment

To understand the survival mechanism of green soybean under cold stress, we selected a cold-tolerant green soybean cultivar (Qiongxiandou15, QXD15) for this study. QXD15 was bred by the Institute of Food Crops, Hainan Academy of Agricultural Sciences (HAAS), Haikou, China, and officially certified in 2016. Its main characteristic is cold tolerance. We grew the QXD15 materials in small pots containing nutrient-rich soil in a growth chamber with a 16 h light and 8 h dark photoperiod. When the seedlings reached the two-leaf-heart stage, they were divided into two groups. One group was exposed to a cold treatment of 10 °C for 24 h, while the other group remained untreated. Samples were collected at 3, 12, and 24 h after cold treatment. The samples at the corresponding time points from untreated group were used as the control group (CK). To ensure accuracy and reproducibility of results, three biological replicates were included in each sample. The samples were rapidly frozen in liquid nitrogen and stored at −80 °C for later use.

2.2. cDNA Libsrary Preparation and Sequencing

RNA-seq experiments were performed on the Illumina NovaSeq 6000 platform in accordance with the standard procedures of MetWare Biological Science and Technology Co., Ltd., as referenced in [54,55,56]. In summary, total RNA was extracted using TRIzol reagent (Invitrogen, Carlsbad, CA, USA) from each sample. RNA quality was then assessed using agarose gel electrophoresis, the RNA Nano 6000 Assay Kit on a Bioanalyzer 2100 system (Agilent Technologies, Santa Clara, CA, USA), and a NanoPhotometer® spectrophotometer (Implen, Munich, Germany). Three biological replicates were performed.

2.3. De Novo Transcriptome Assembly

To ensure the quality of the transcriptome sequence results and bioinformatics analysis, the raw sequences (raw reads) obtained from the sequencing were counted and quality controlled by fastp version 0.19.3 [57]. Paired reads were also removed if the proportion of “N” bases in any sequencing read exceeded 10% of the total bases. Furthermore, paired reads were eliminated if any sequencing read exhibited more than 50% of bases with a quality score of Q ≤ 20. All subsequent analyses were performed utilizing the resultant high-quality reads.
We downloaded the reference genome and its annotation files from the JGI data portal, used HISAT version 2.1.0 [58] to construct the index, and compared clean reads to the reference genome using the default parameters.
StringTie v1.3.4d [59] was used for novel gene prediction. FeatureCounts v1.6.2 [60] was employed to calculate gene alignment and fragments per kilobase of transcript per million mapped reads (FPKM). FPKM adjusts gene expression measurements by accounting for both the sequencing depth and the gene length.
Gene function was annotated based on the following databases: NCBI non-redundant protein sequences (NR), a manually annotated and reviewed protein sequence database (Swiss-Prot), Gene Ontology (GO), Kyoto Encyclopedia of Genes and Genomes (KEGG), eukaryotic orthologous groups (KOG), and protein families (Pfam), with E-value ≤ 1 × 10⁻⁵.

2.4. Transcriptome Data Analysis

Differential expression analysis between the two groups was performed using DESeq2 (v1.22.1) [61]. The p value was corrected using the Benjamini–Hochberg method. The criteria for differentially expressed genes were the absolute value of the log2 fold change (|log2FC|) ≥ 1 and the corrected p-value < 0.05.
The enrichment analysis is performed based on the hypergeometric test. For KEGG, the hypergeometric distribution test is performed with the unit of pathway; for GO, it is performed based on the GO term.
Weighted gene co-expression network analysis was performed with WGCNA version 1.69 [62]. Network construction was conducted utilizing Cytoscape version 3.10.2 [63].

3. Results

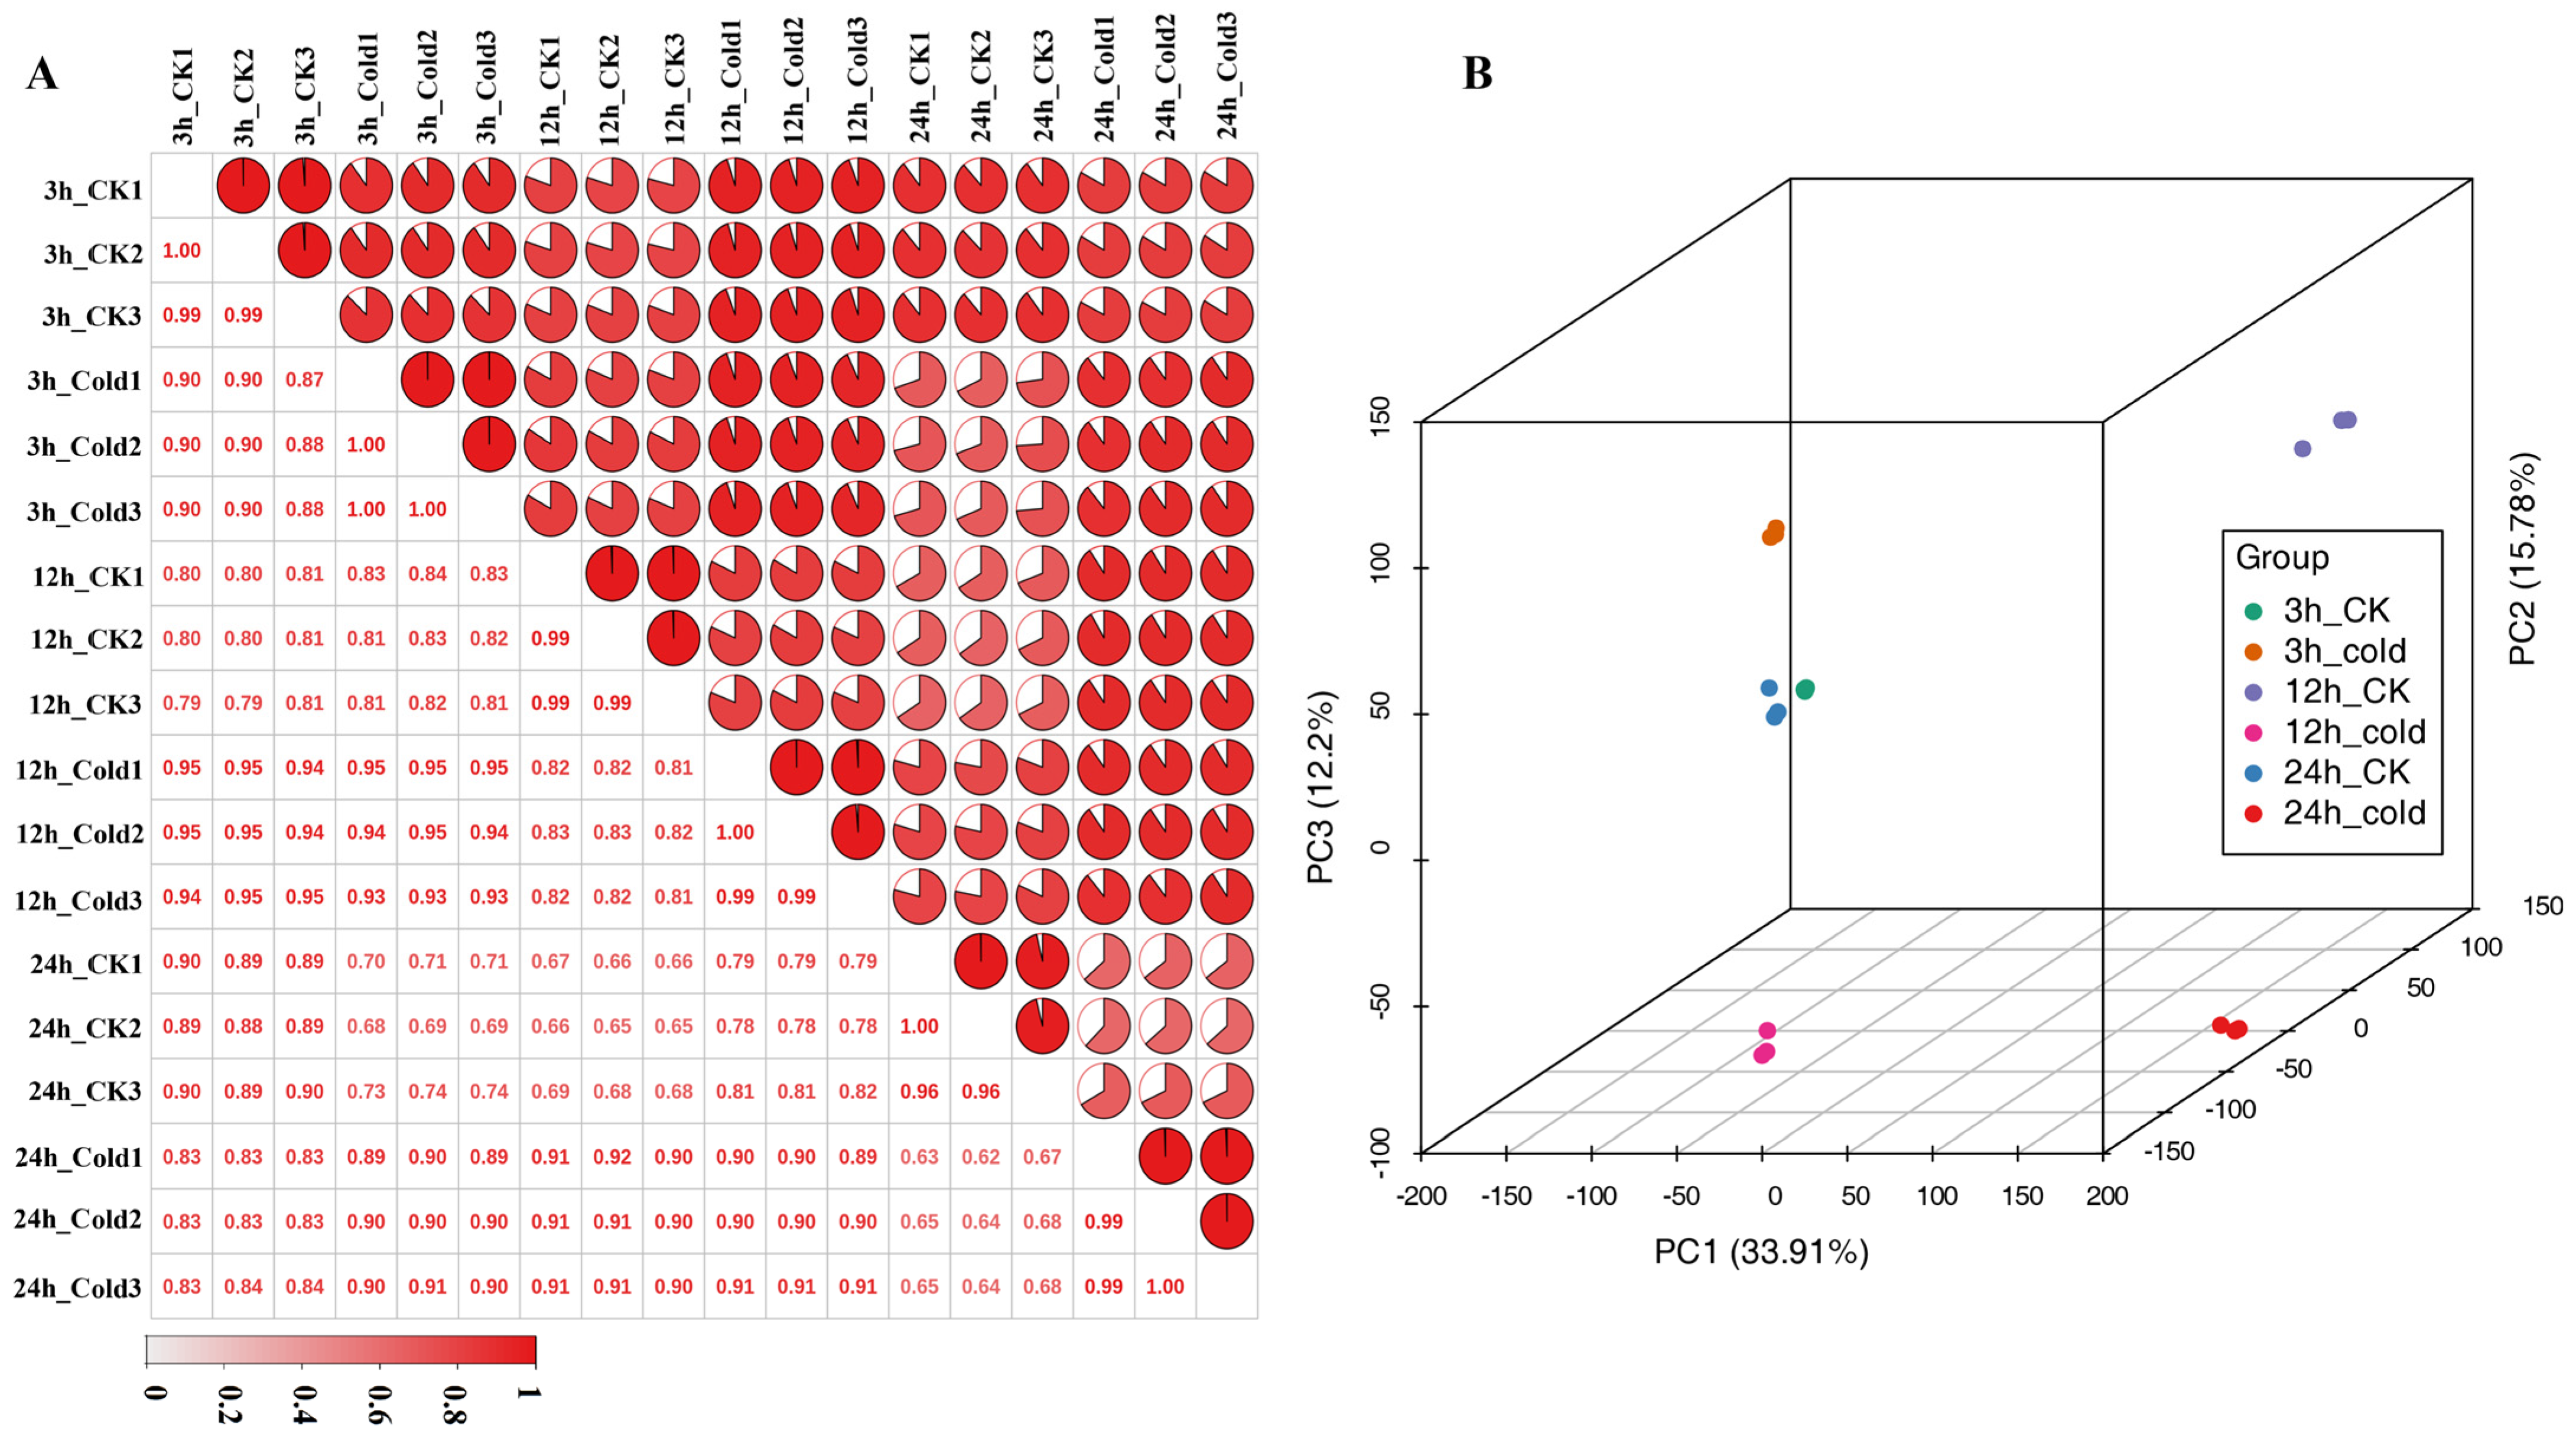
3.1. Transcriptome Sequencing and Annotation of Green Soybean

The cold-resistant green soybean variety Qiongxiandou15 (QXD15), was selected and subjected to cold stress at 10 °C. Leaf samples were collected at 3, 12, and 24 h after treatment to undergo transcriptome sequencing. Untreated samples at the same time points were used as controls. Three biological replicates were included in each group to ensure the accuracy and reproducibility of the results.
The transcriptome sequencing of 18 samples generated a total of 127.18 Gb of clean data (Table 1). The proportion of Q30 (sequences with a sequencing error rate of less than 0.1%) bases exceeded 90% and the GC content ranged from 44.26% to 45.32%. The mapping efficiency of the reads across all samples varied between 94.94% and 96.60%. Subsequently, the clean reads were aligned to the reference genome (namely “Gmax_275_v2.0.fa”, available at https://data.jgi.doe.gov/refine-download/phytozome?organism=Gmax&expanded=275, accessed on 10 May 2024) using HISAT. Pearson’s correlation analysis was performed to further investigate gene expression patterns under cold stress conditions. The results revealed a strong linear correlation (r > 0.96) among the three replicates per group, indicating high consistency and minimal variability. This high correlation validates the suitability of the sequencing data for subsequent RNA-seq analysis (Figure 1A).
To investigate the temporal transcriptomic changes following clod treatment, we performed a principal component analysis (PCA). PC1 and PC2 explained 33.91% and 15.78% of the total variance, respectively. All samples were correctly clustered into six groups, and there were boundaries between six groups. Meanwhile, all treatment groups and control groups can be separated clearly. Additionally, PCA revealed that the expression changes at 3 h and 24 h post-treatment exhibited similar trends in untreated plants, contrasting with the expression changes observed at 12 h (Figure 1B). Furthermore, the distribution of gene expression indicated that 17.06% to 21.01% of the detected genes in QXD15 exhibited FPKM values ranging from 10 to 99. Notably, 777, 784, and 758 genes exhibited expression levels exceeding 100 FPKM at 3 h, 12 h, and 24 h, respectively. Subsequent comparative analysis of the highly expressed genes across all three time points revealed that 3864 of the top 10 highly expressed genes were common to all samples (Table S1). The observed expression trends underwent significant alterations following cold treatment at 3 h, 12 h, and 24 h, indicating that cold stress induces a reprogramming of gene expression.
Subsequently, we annotated the soybean transcriptome by aligning it to multiple databases. Of 49,246 annotated transcripts, we mapped 48,661, 40,771, 39,274, 35,505, 25,298, and 14,877 transcripts mapped to the NR, Gene Ontology (GO), Pfam, SwissProt, eukaryotic orthologous groups (KOG), and Kyoto Encyclopedia of Genes and Genomes (KEGG) pathway databases, respectively. Notably, 9268 transcripts were annotated across all databases. Among the 40,771 GO-annotated transcripts, the most prevalent GO terms were metabolic process (GO:0008152), binding (GO:0005488), cellular anatomical entity (GO:0110165), and cellular process (GO:0009987). Mapping the transcriptome to the KEGG pathway database revealed transcripts in five categories: environmental information processing, organismal systems, cellular processes, metabolism, and genetic information processing.

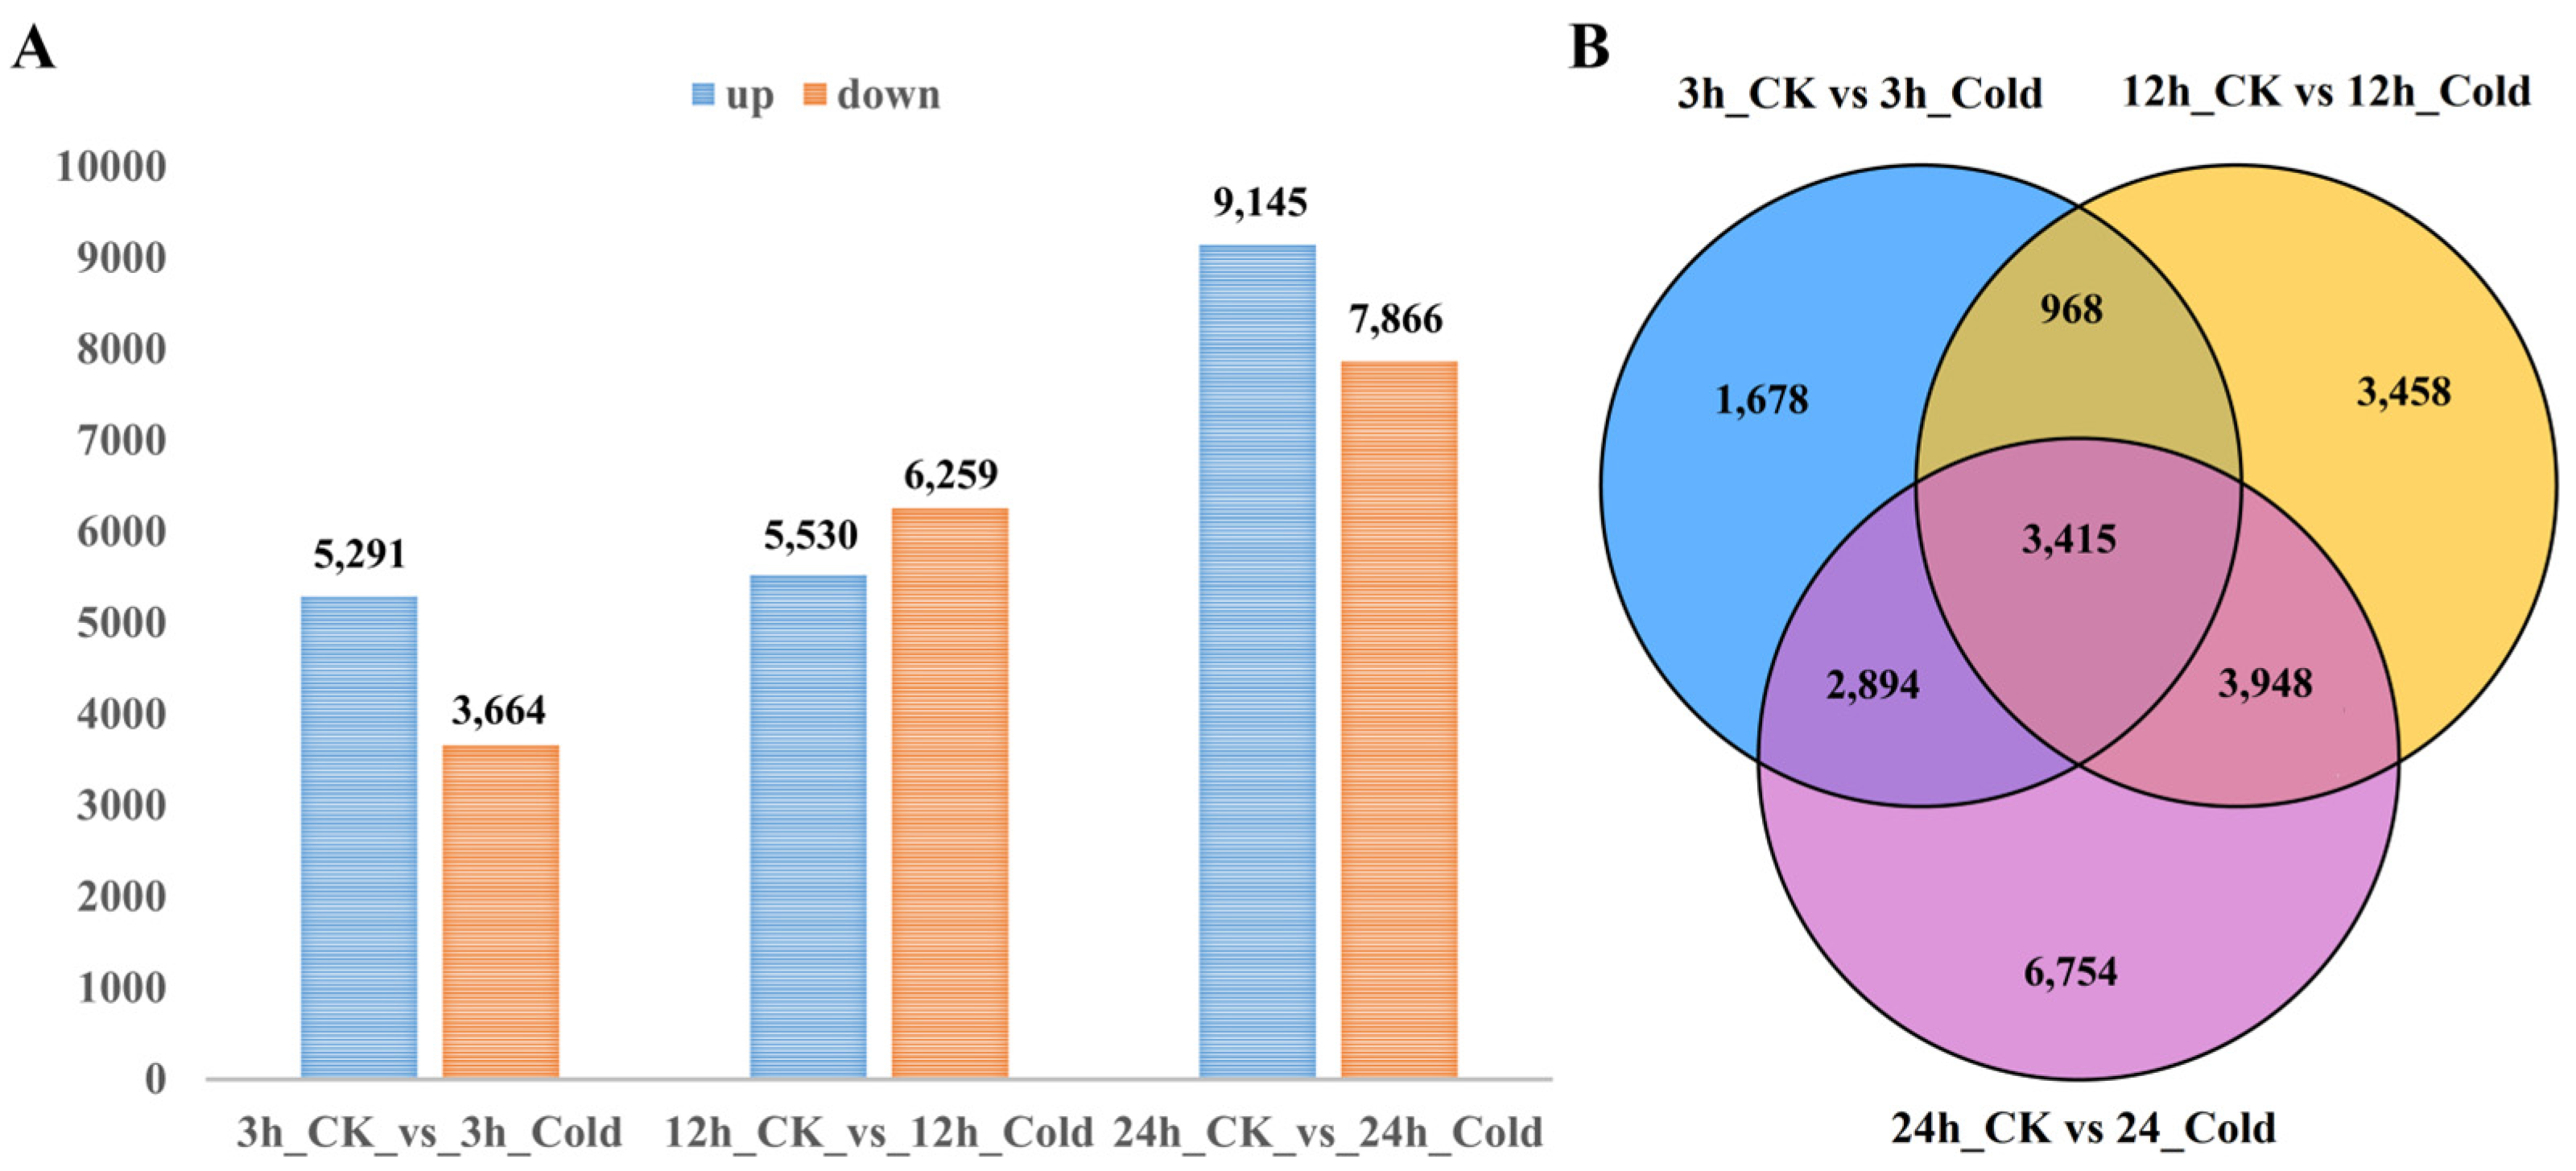
3.2. Differentially Expressed Genes of Soybean Under Cold Stress

To elucidate the response of green soybean to cold stress, we identified differentially expressed genes (DEGs) under cold conditions (Figure S1). Utilizing criteria of a false discovery rate (FDR) < 0.05 and |log2 fold change| > 1, we identified 5291, 5530, and 9145 upregulated DEGs, as well as 3664, 6259, and 7866 downregulated DEGs at 3 h, 12 h, and 24 h post-cold-treatment, respectively, in comparison to the control data (Figure 2A). Venn diagrams showed that 3415 genes were commonly responsive at three time points (Figure 2B). Among these, 232 upregulated and 157 downregulated genes were consistently observed in QXD15 after cold treatment for 3 h, 12 h, and 24 h. Additionally, 14 transcription factors (TFs) were commonly downregulated, and 25 transcription elements (TEs) were commonly upregulated. Furthermore, 1678 DEGs (1121 upregulated and 557 downregulated), 3458 DEGs (1408 upregulated and 2050 downregulated), and 6754 DEGs (3788 upregulated and 2966 downregulated) were specifically regulated after cold treatment for 3 h, 12 h, and 24 h, respectively.
We identified two genes specifically upregulated during the 3 h cold treatment: Glyma.13G181400, which encodes cold-responsive protein kinase 1 isoform A, and Glyma.13G241200, which encodes cold-responsive protein kinase 1. These genes may be involved in the early response to cold stress. Additionally, during the 12 h cold treatment, we identified Glyma.06G230800, which encodes cold-responsive protein kinase 1 isoform X1. During the 24 h cold treatment, we identified two genes: Glyma.09G045700, which encodes a cold-regulated protein, and Glyma.12G030800, which encodes a cold shock protein 2-like. These genes are likely involved in the late stages of the cold response. The expression patterns of these genes indicated that the green soybean response to cold stress is both complex and stage-specific.
Additionally, we quantified the expression levels of several known cold-responsive genes (Figure 3). Our results showed that the expression of GmDREB1G;2 increased after three hours of cold treatment but then returned to low levels after 12 and 24 h. In contrast, GmDREB1D;1 and GmDREB1B;1 were initially downregulated at 3 and 24 h, and then upregulated after 12 h. The expression of GmEIN3A;1, GmEIN3C;1, and GmEIN3B;1 exhibited similar patterns, with downregulation observed at 3 and 24 h, followed by an increase after 12 h of cold exposure. Downstream genes such as AP2-like and GmADH1A also exhibited cold-induced changes in expression. Notably, GmTCF1a, a known positive regulator of cold tolerance in soybean, was consistently upregulated at all time points (3, 12, and 24 h). Taken together, these results are consistent with previous research and confirm that our transcriptome data reliably capture the dynamic transcriptional reprogramming induced by cold stress.

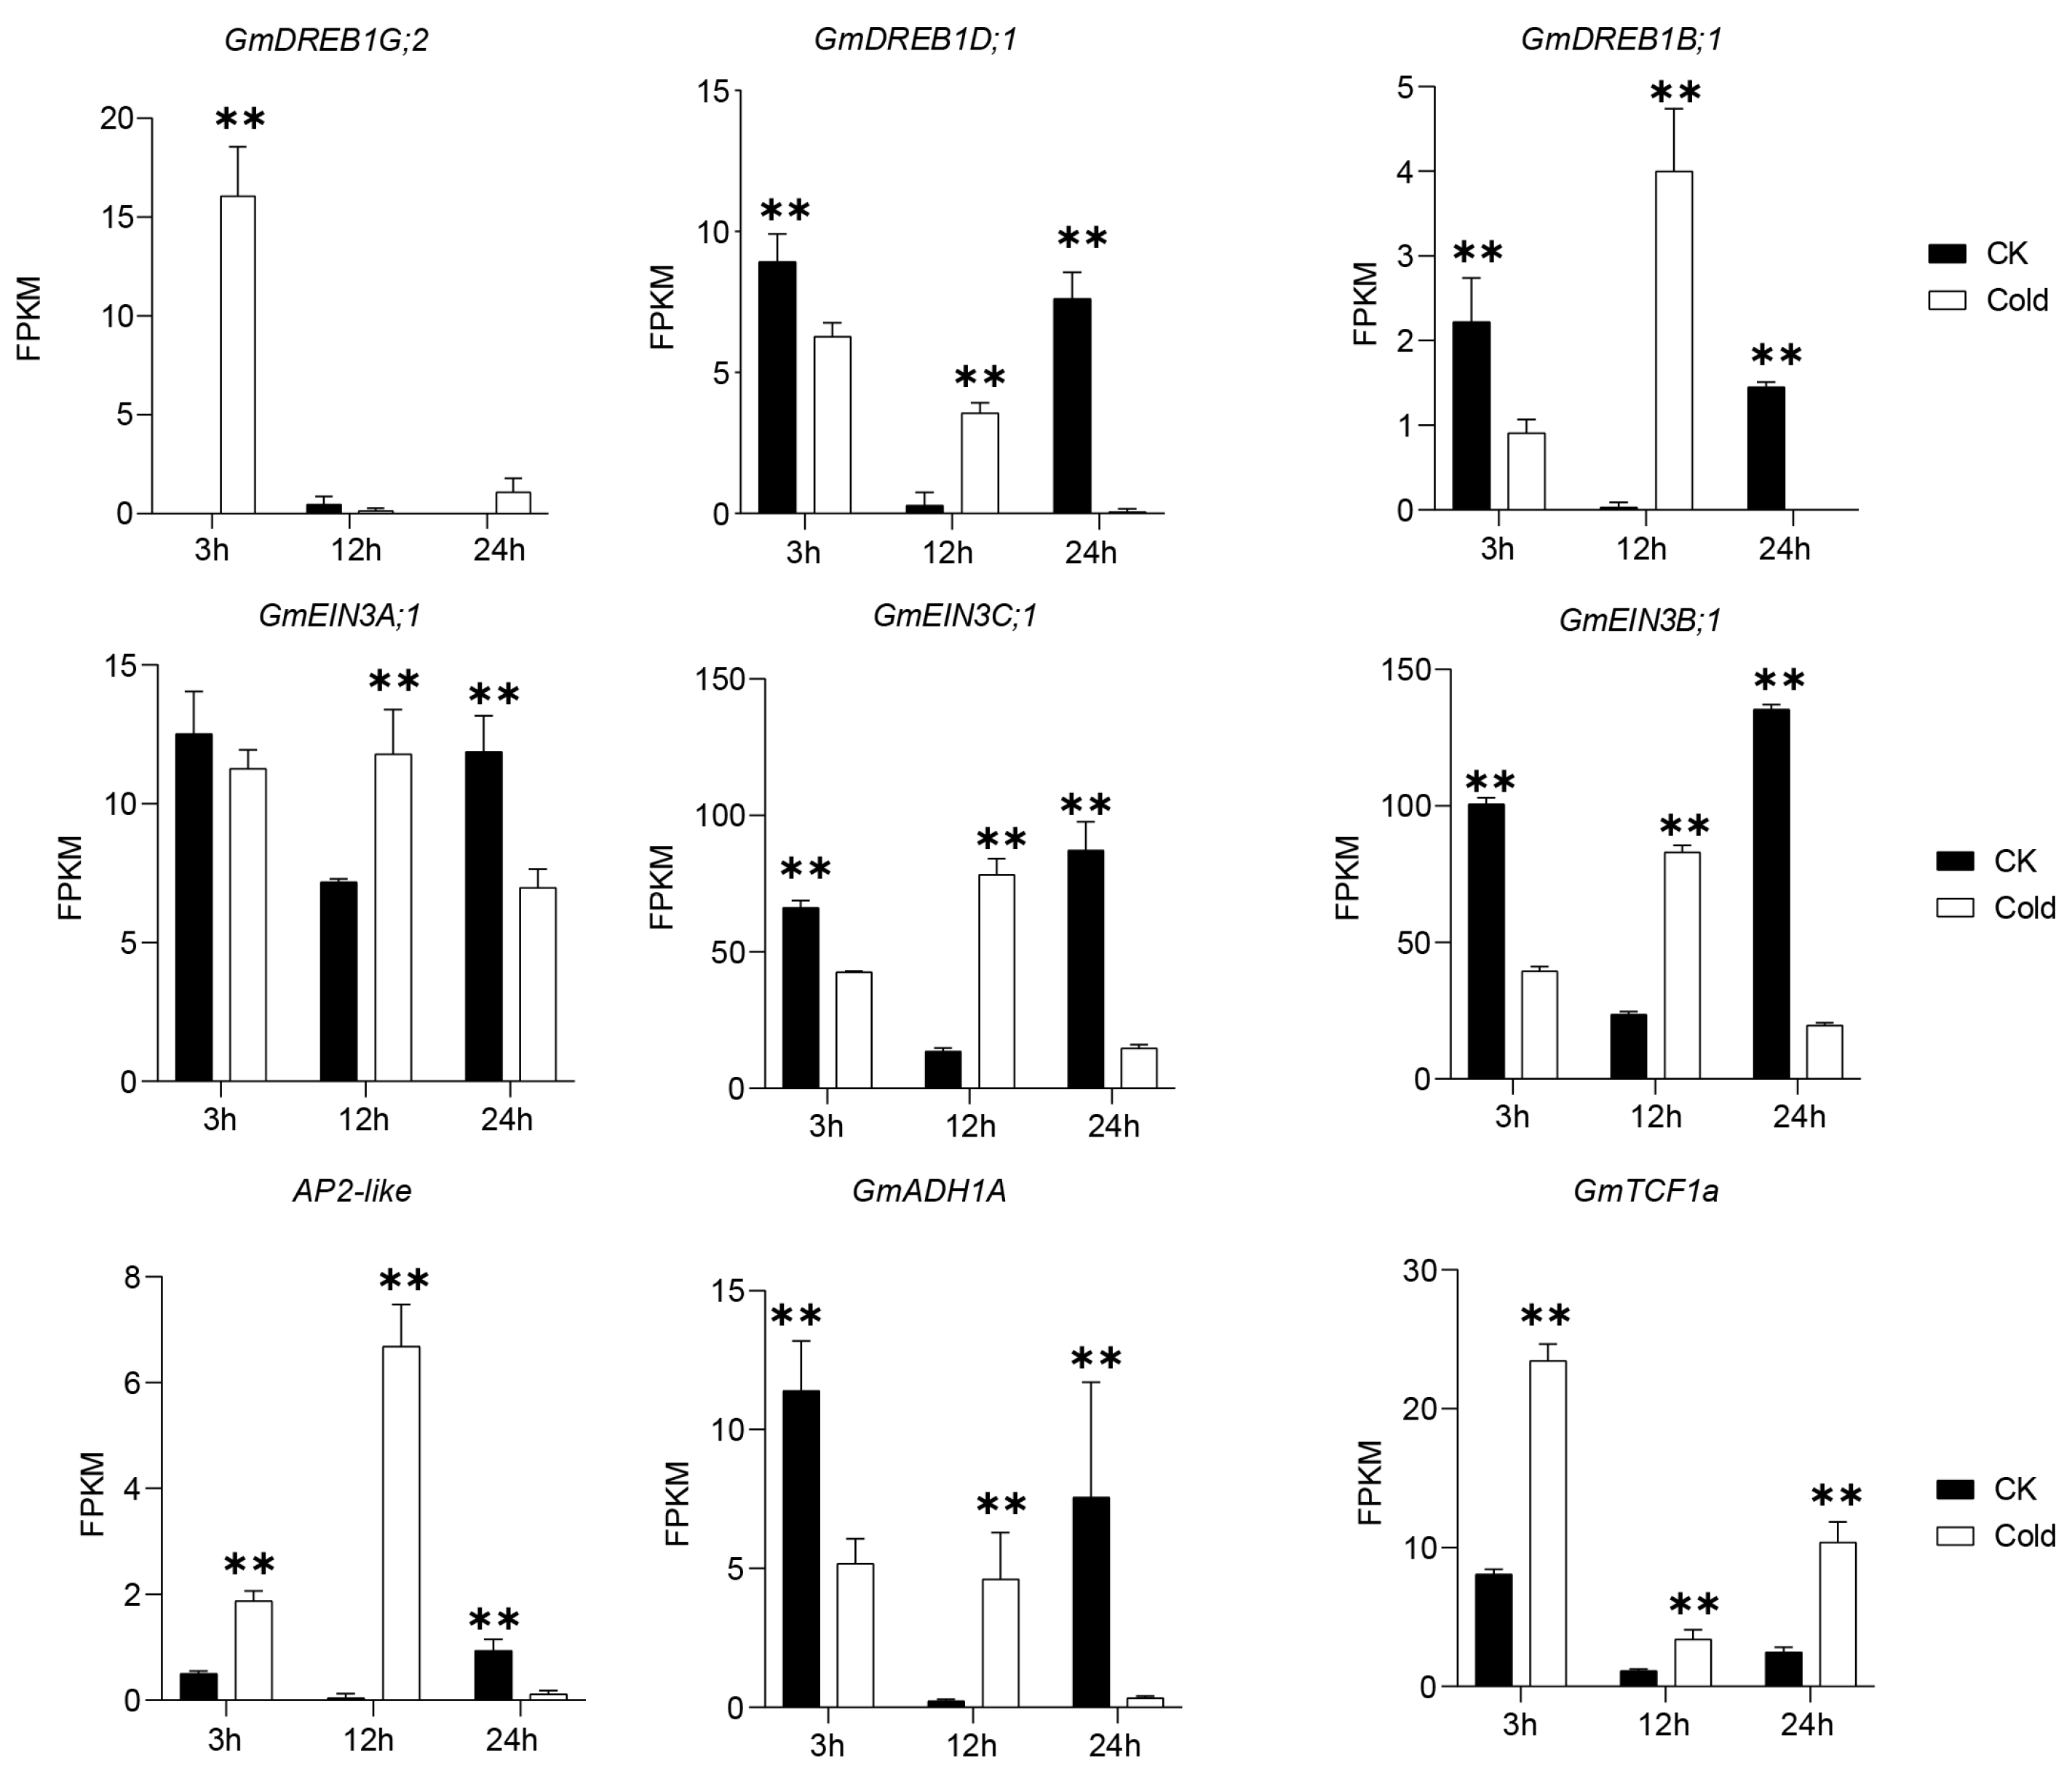
3.3. Transcription Factor Analysis

We subsequently conducted a detailed analysis of the expression patterns of transcription factors (TFs) subjected to cold stress. A total of 4002 TF genes were annotated, 2003 of which exhibited differential expression in response to cold conditions. The largest class of differentially expressed genes under cold stress was represented by the basic helix–loop–helix (bHLH) transcription factors (Figure S2). Notably, Tify family genes were predominantly upregulated following three hours of cold treatment; however, their expression levels at 12 and 24 h post-treatment were less definitive. This suggests that Tify genes may play a role in the early stages of the cold stress response (Table S1). Most mTERF and B3-ARF genes were downregulated after 12 h and upregulated after 24 h. However, expression levels at the three-hour mark were difficult to determine due to variability in gene expression under cold stress conditions. Conversely, the WRKY, TUB, PHD, NAC, and IWS1 TEs exhibited an opposite trend: they were upregulated after 12 h and downregulated after 24 h of cold treatment. This suggests their potential involvement in the later stages of the cold stress response.

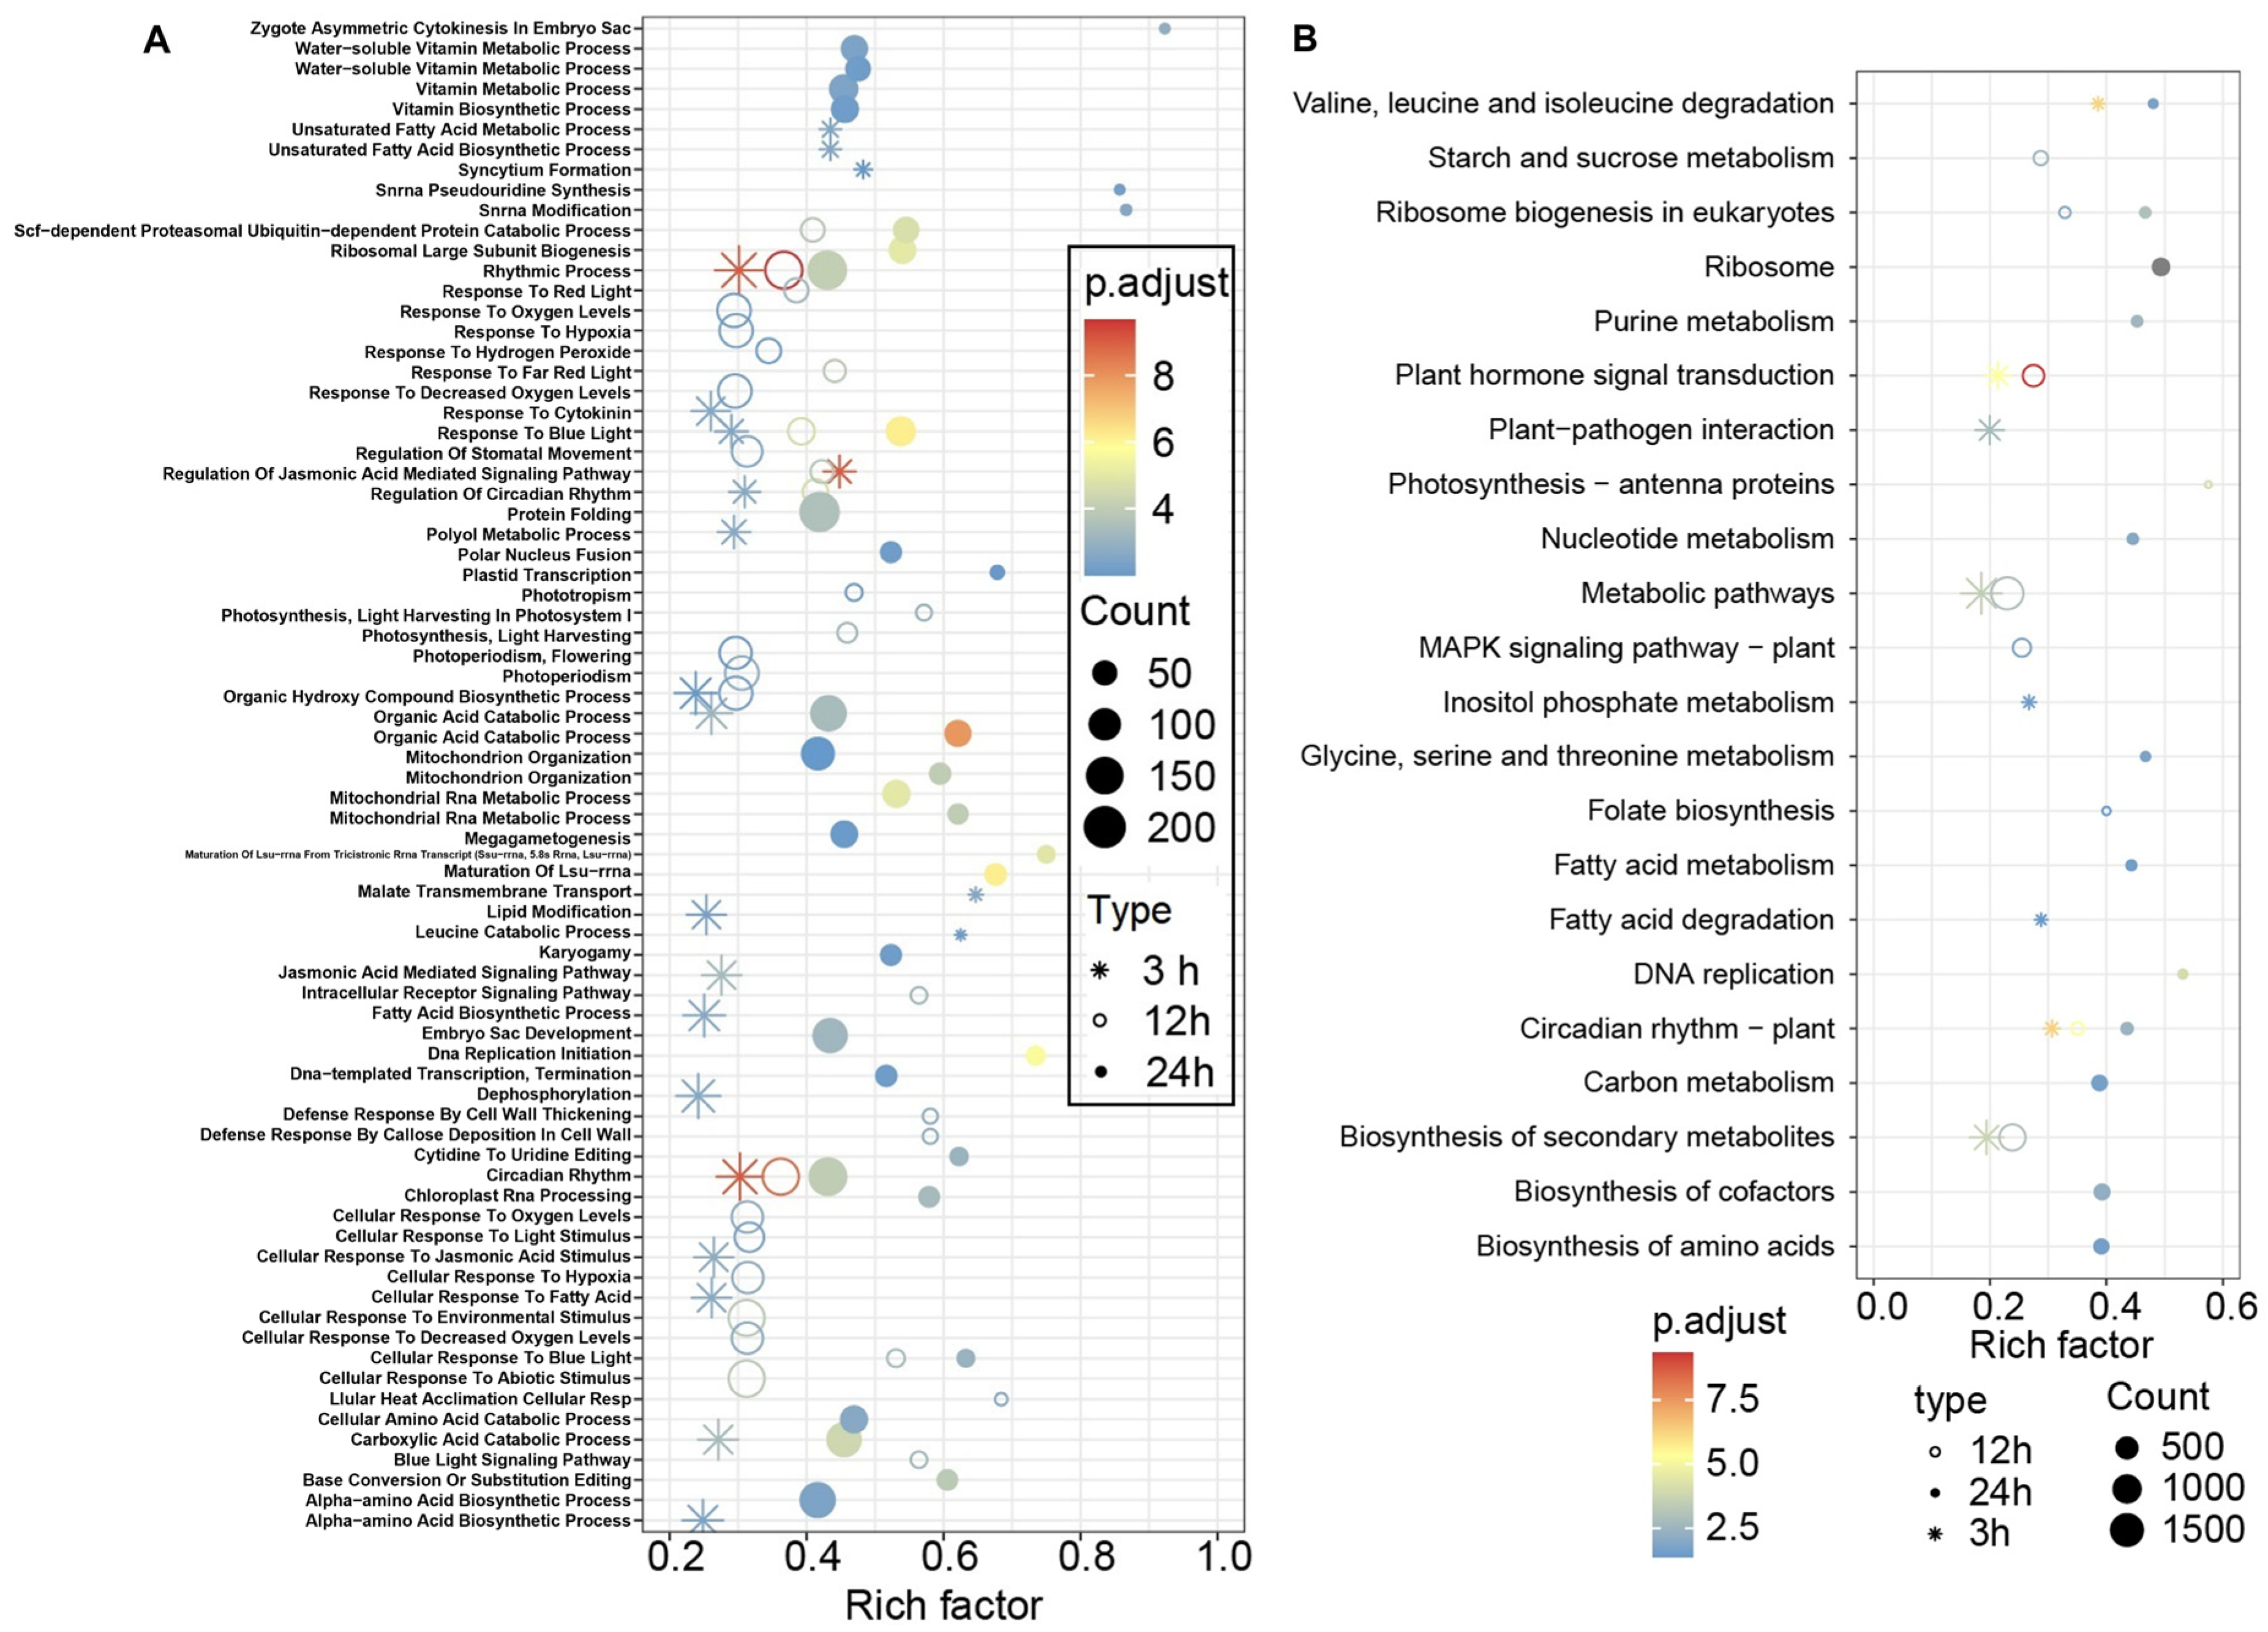
3.4. GO and KEGG Enrichment Analysis of the DEGs

To elucidate the pathways involved in the responses of green soybean to cold stress, we conducted enrichment analyses using GO and KEGG databases. The DEGs were categorized into three primary groups in the GO enrichment analysis: molecular functions, cellular components, and biological processes (Tables S2–S4). DEGs identified at 3, 12, and 24 h of cold treatment were significantly enriched in various biological processes (Figure 4A and detailed in Table S2). These processes include “rhythmic process”, “response to blue light”, and “circadian rhythm”. Additionally, the processes “organic acid catabolic process”, “organic hydroxy compound biosynthetic process”, “regulation of circadian rhythm”, “SCF-dependent proteasomal ubiquitin-dependent protein catabolic process”, “cellular response to blue light”, and “carboxylic acid catabolic process” were enriched in two of the treatment time points. In term of molecular functions, DEGs subjected to cold treatment for 3 and 12 h exhibited significant enrichment in “glucosyltransferase activity” (Table S2). Additionally, genes associated with “jasmonic acid hydrolase”, which are related to resistance mechanisms, were enriched following 3 h of cold treatment.
The KEGG enrichment analyses of the DEGs revealed that six pathways were associated with two specific points of cold treatment (Figure 4B, Table S5). These pathways include “isoleucine degradation”, “ribosome biogenesis in eukaryotes”, “circadian rhythm-plant”, “plant hormone signal transduction”, “metabolic pathways”, “biosynthesis of secondary metabolites”, and “valine, leucine”. Notably, “fatty acid degradation” and “fatty acid metabolism” were enriched in the 12 and 24 h low-temperature treatments.
Based on the aforementioned analysis, it can be concluded that, during the soybean’s response to cold stress, both the rhythmic pathway and the fatty acid metabolism pathway play significant roles. Concurrently, the red and blue light pathways are notably enriched, indicating that soybeans possess the capability to regulate certain cold-responsive genes and thereby enhance the plant’s frost resistance through mechanisms independent of the CBF/DREB1 pathway.
To better understand the responses of these pathways, we mapped differentially expressed genes (DEGs) to metabolic pathways. The results showed that, after 3 and 24 h of cold treatment, genes involved in fatty acid degradation were downregulated, while those involved in fatty acid synthesis were upregulated, indicating an accumulation of fatty acids (Figure 5). In contrast, after 12 h of cold treatment, the fatty acid content showed the opposite trend. Through homologous gene search and functional annotation, we identified key genes participating in the fatty acid metabolic pathway and specifically highlighted four genes sensitive to cold stress (Figure 5C). Specifically, Glyma.15G178400 and Glyma.09G070300 were identified as homologs of OsALDH7, a rice gene proven to enhance cold tolerance, while Glyma.03G144500 and Glyma.19G147400 are homologous to FAD2-1, which is associated with lipid accumulation and circadian rhythm. These genes exhibited rhythmic expression patterns under normal conditions, but cold treatment disrupted this rhythm and induced an opposite expression trend. Taken together, these results suggest that cold stress may facilitate the cold tolerance response in vegetable soybean by modulating genes involved in fatty acid metabolic pathways and disturbing the circadian rhythm of fatty acid metabolism.

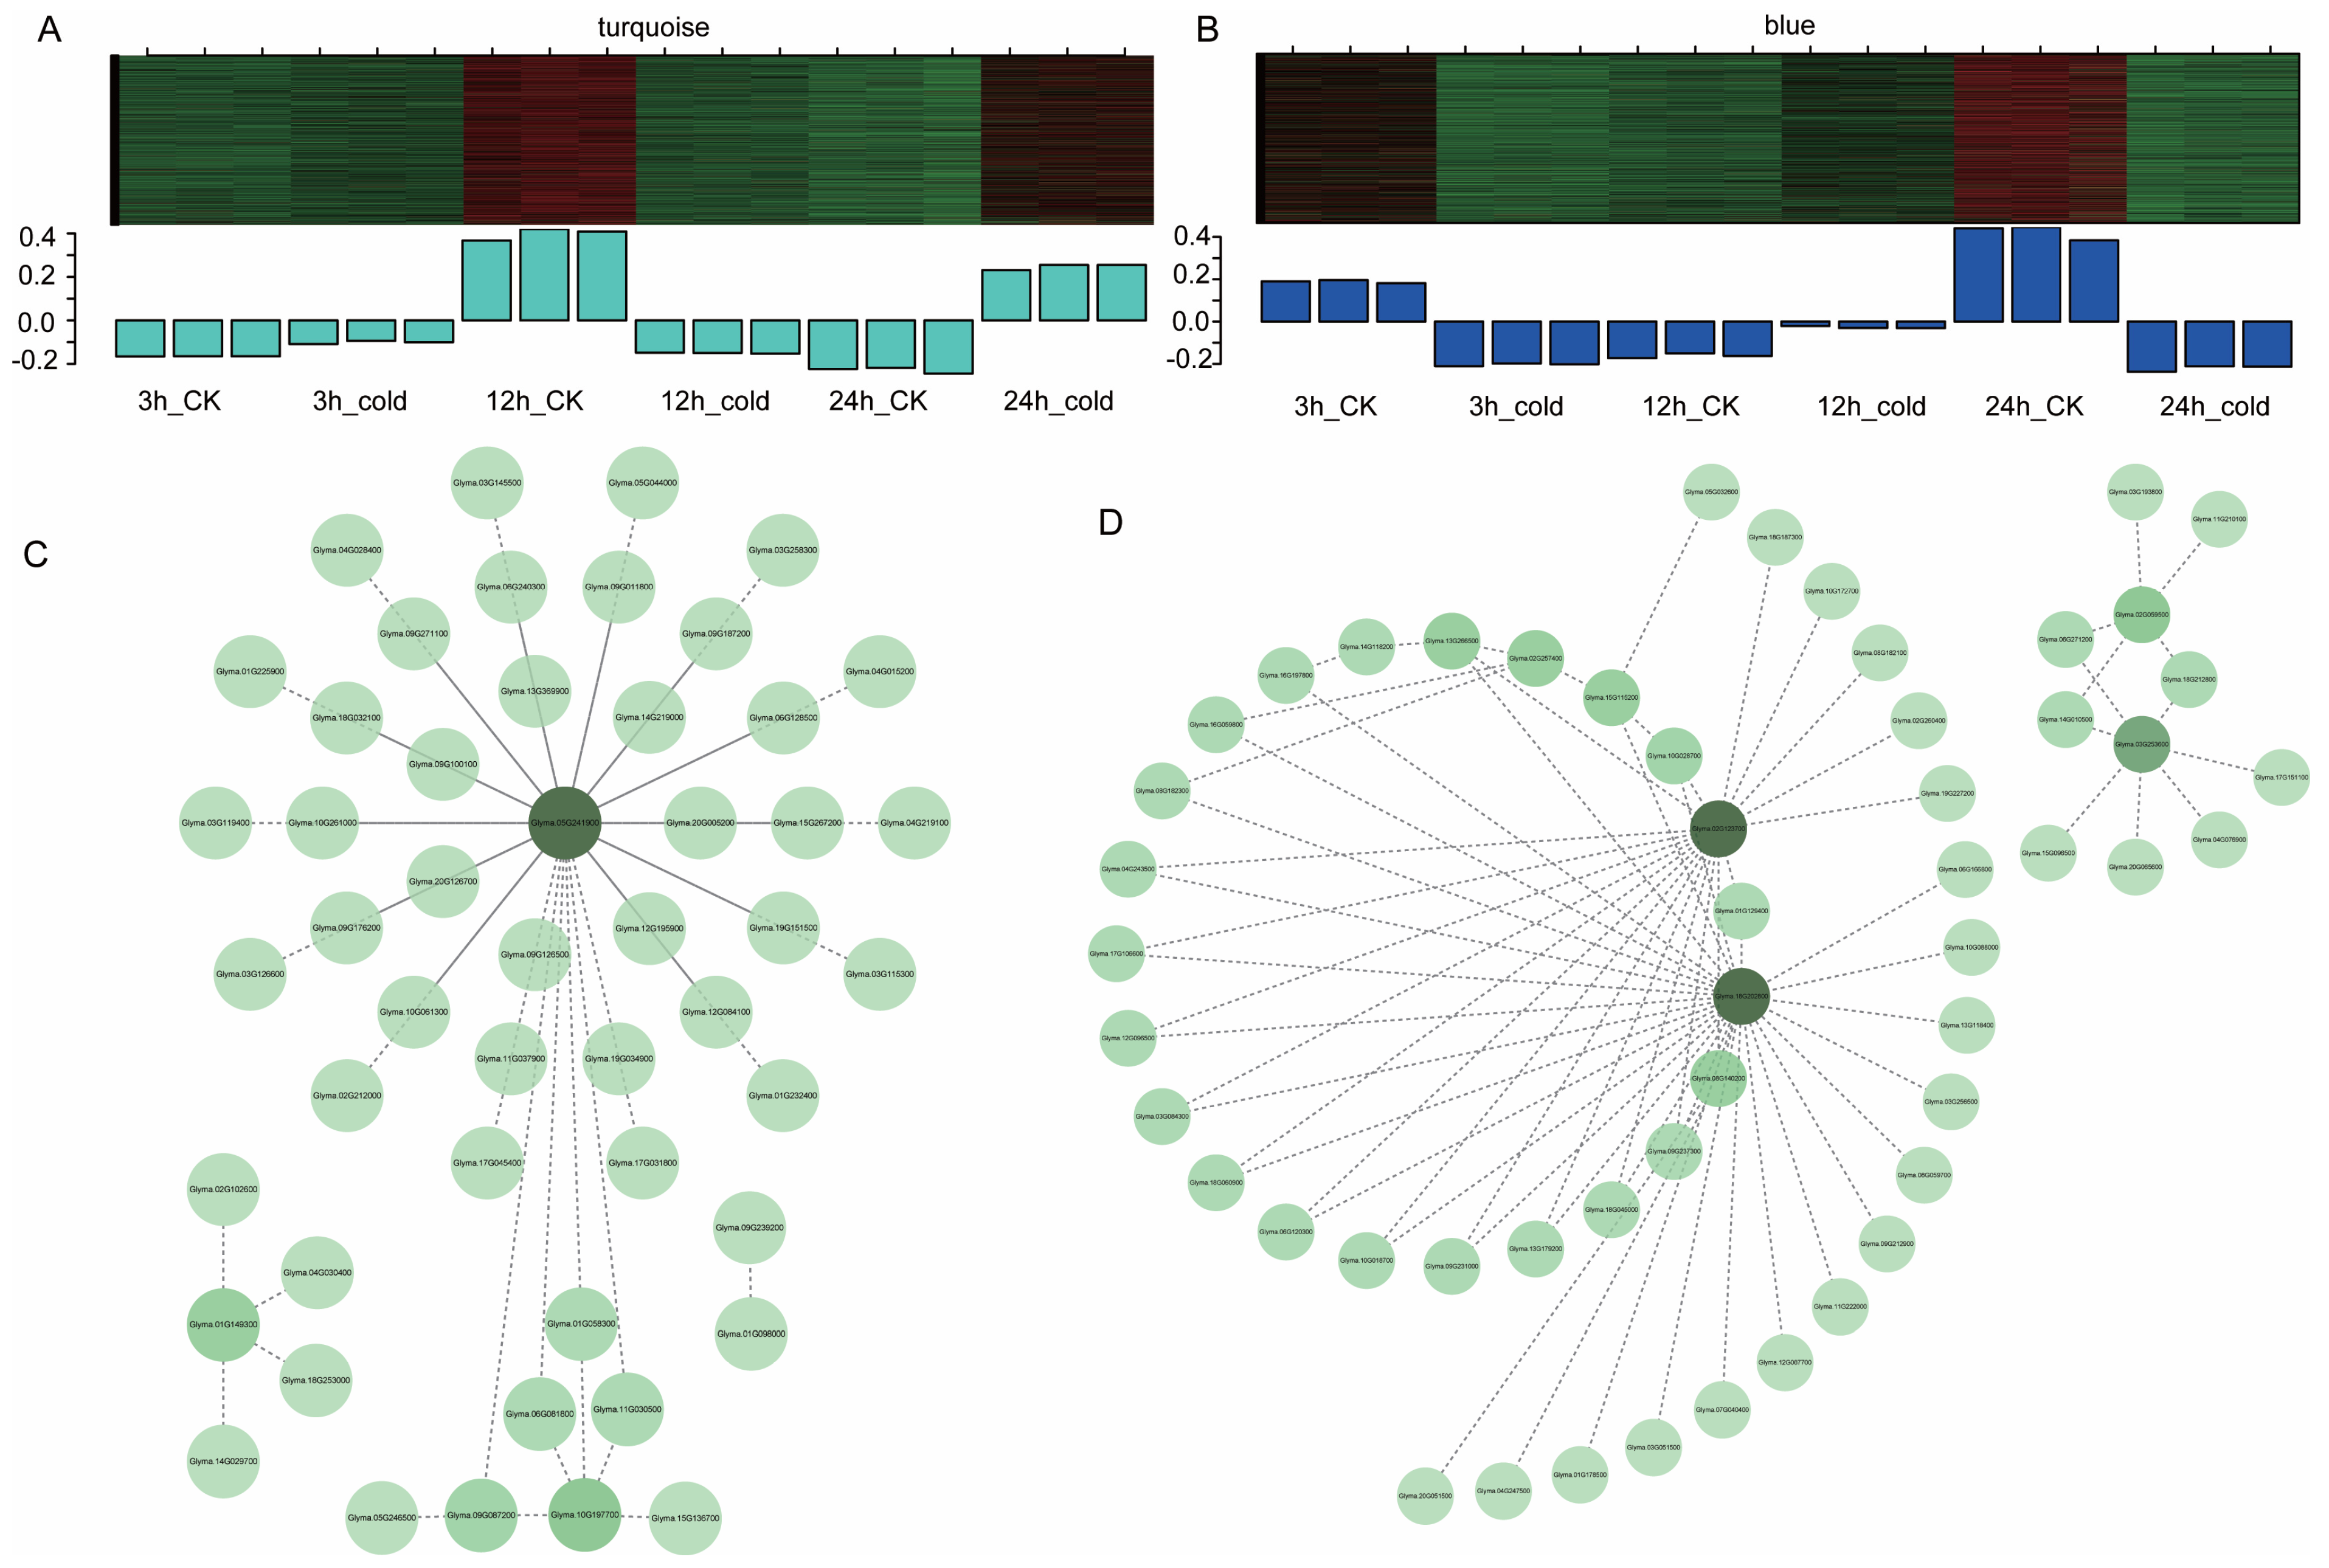
3.5. Gene Co-Expression Modules Responding to Cold Stress

To further elucidate the interacting network and hub genes involved in the cold response, we conducted weighted gene co-expression network analysis (WGCNA) on a dataset containing 34,472 genes. This analysis grouped the genes into 20 distinct modules, each represented by a unique color based on expression patterns (Figure 6A). The number of genes and transcription factors (TFs) in each module varied significantly. For example, the light-yellow module contained 79 genes, while the turquoise module included 9771 genes. On average, each module consisted of 1723 genes. We also generated a heatmap showing the correlations between modules and different time points after cold treatment (Figure 6B). The global expression trends of co-expressed genes within each module were examined across all time points. The results showed that the yellow module was closely related to the 3 h cold treatment, the pink module was linked to the 12 h cold treatment, and the brown module was associated with the 24 h time point (Figure 6C,D). In addition, the green-yellow and purple modules showed negative correlations at all three time points (3, 12, and 24 h) after cold treatment. The red and turquoise modules had negative correlations at 12 h, but positive correlations at 3 and 24 h. In contrast, the blue module displayed a positive correlation at 12 h, but negative correlations at 3 and 24 h.

3.6. Identification of Key Genes Involved in Cold Responses in Green Soybean

We found that genes related to fatty acid metabolism and circadian rhythm were mainly distributed in the turquoise and blue modules. Further analysis showed that, after 3 h of cold treatment, gene expression in the turquoise module exhibited minimal fluctuation; after 12 h, the expression of genes in this module increased significantly, and at 24 h, expression remained higher than in the control group. This module contains 9771 genes in total, including 681 transcription factors (TFs). To evaluate the roles of these genes in the cold response mechanism, we constructed a co-expression network for the turquoise module and selected the top 50 genes with the highest connectivity (see Figure 7A,C) for further analysis. Ultimately, we identified 44 core genes, including four transcription factors: AUX/IAA, B3-ARF, GRAS, and C2C2-GATA (details in Supplementary Table S6). In addition, the E3 ubiquitin ligase genes Glyma.04G015200 and Glyma.05G241900 were found to be closely associated with cellular responses to cold stress, suggesting they may be involved in the regulation of circadian rhythms.
The blue module comprises 2145 genes. Genes in this module were downregulated at 3 and 24 h after cold treatment but upregulated at 12 h. Using co-expression network analysis, we identified the top 50 most highly connected genes (Figure 7B,D) and constructed an interaction network. The results revealed several key genes in the network, such as phosphoinositide 4-kinase (Glyma.02G123700) and succinyl-CoA dehydrogenase (Glyma.18G202800) (Table S7), both of which are enriched in the cold stress pathway.

4. Discussion

Low temperature is an important abiotic stress factor that significantly inhibits the growth and development of green soybeans. In this study, transcriptomic analyses were conducted at multiple time points to identify differentially expressed genes (DEGs), including both up- and downregulated genes, at each stage. Comparative transcriptome analysis after 3, 12, and 24 h of low-temperature treatment revealed 232 genes that were commonly upregulated and 157 that were commonly downregulated. The low proportion of commonly expressed genes suggests that green soybeans’ response to cold stress is temporally heterogeneous. Interestingly, the DEG expression patterns at 3 and 24 h were similar, whereas the pattern at 12 h was markedly different. This indicates that the circadian rhythm plays a critical role in the green soybean’s response to cold stress.
Membrane lipid metabolism and remodeling constitute critical adaptive mechanisms enabling plants to withstand temperature-induced stress [64]. Exposure to low-temperature stress can cause irreversible alterations in the spatial conformation and physical state of membrane lipid molecules. Under cold stress conditions, the fluidity of membrane lipids diminishes, thereby reducing the selective permeability of cellular membranes. This reduction in membrane fluidity and permeability culminates in metabolic and functional disruptions within plant cells [65,66]. Research has demonstrated a substantial correlation between environmental temperature and the lipid composition of plant membranes [53]. The proportion of unsaturated fatty acids plays a pivotal role in preserving membrane fluidity; a higher proportion of polyunsaturated fatty acids is instrumental in maintaining fluidity at reduced temperatures [67]. Our findings demonstrate that the fatty acid content in green soybeans increased following low-temperature treatments of 3 h and 24 h, attributable to enhanced synthesis and inhibited degradation processes. Conversely, a decrease in fatty acid content was observed after 12 h of cold treatment. Previous research has established that exposure to temperature stress activates lipid-dependent signaling cascades, which subsequently regulate gene expression [68]. A comprehensive analysis of the cold stress transcriptome in maize roots identified 189 DEGs associated with lipid metabolism, with a notable enrichment in the “fatty acid elongation” pathways [69]. Similarly, in green soybeans, differential expression of several genes implicated in fatty acid metabolism and elongation was observed, resulting in alterations in fatty acid content. This indicates that fatty acids may have a more pivotal role in the response of green soybeans to cold stress relative to other plant species, possibly contributing to their reduced cold tolerance. Future research should focus more on lipid biosynthesis and signaling pathways in response to low temperatures in order to elucidate the mechanisms of stress resistance in green soybeans and the relationship between lipid function and physiological changes.
The circadian rhythm is a periodic biological cycle that is regulated by various external environmental factors, including abiotic stress [70]. When plants are subjected to abiotic stress, complex interactions occur between their internal clocks and external stimuli [71]. Enhanced synchronization between the circadian rhythms of plants and the external environment is closely associated with increased tolerance to abiotic stress [72]. At different times of the day, plants experience varying degrees of stress, and their circadian rhythms help them to manage these stresses and promote growth by regulating metabolic and physiological processes [73]. In the cold response pathway, the core regulators are C-repeat binding factors (CBFs), which are activated at low temperatures and are subject to circadian control. CBF proteins are predominantly expressed during the daytime, with extremely low levels at night, highlighting the crucial role of temporal regulation in cold stress responses. Our results align with this pattern: the GmDREB1D and GmDREB1B genes showed high expression at 3 and 24 h after cold treatment but were almost undetectable at 12 h. This temporal expression pattern is consistent with the behavior observed in many cold-responsive genes, which are typically upregulated during the day and gradually decrease at night [73,74]. We observed significant changes in the rhythm of gene expression in green soybean, suggesting increased sensitivity to circadian fluctuations. The interaction between the plant circadian clock and the pathways of the cold stress response is bidirectional and tightly connected, forming a feedback regulation loop that enhances adaptability to temperature changes [75,76]. Our analysis indicates that cold treatment disrupts the rhythmic expression of many genes, including CBF-related genes, which may contribute to green soybean’s increased sensitivity to cold stress.
Light and temperature are two key environmental factors influencing plant growth and development. Light plays a crucial role in temperature perception, as photosynthesis is often among the first physiological processes affected by temperature fluctuations. Experimental evidence has shown that the development of plant freezing tolerance is closely related to light conditions and associated photosynthetic activity during the cold acclimation phase [69]. Photosynthesis is highly sensitive to environmental changes and requires a dynamic balance between the energy absorbed by photosystems I and II (PSI and PSII) and the energy consumed by metabolic processes [77]. The red light receptor phytochrome B (phyB) not only senses temperature changes in the range of 10 °C to 30 °C but also interacts with light signaling component PIFs, regulating freezing tolerance through a low-temperature signaling pathway that is partially dependent on CBF/DREB1 [78,79]. Additionally, in Arabidopsis, the blue light receptor CRY2-COP1-HY5 module can positively regulate certain cold-responsive (COR) genes via BBX7/8 transcription factors, thereby enhancing freezing tolerance independently of the CBF/DREB1 pathway [80]. Gene ontology enrichment analysis indicates that cold-responsive genes are also enriched in blue-light-related pathways, suggesting that light-mediated signaling plays an important role in the cold response mechanism of green soybean.

5. Conclusions

In this study, comprehensive multi-time-point transcriptomic and network analyses were conducted to identify the key genes and pathways in the response to cold stress of green soybeans. We identified 3415 common DEGs across 3 h, 12 h, and 24 h cold treatments, with significant enrichment in “rhythmic process”, “response to blue light”, “fatty acid metabolism”, and “fatty acid degradation”. Notably, the expression patterns of these pathways were similar after 3 and 24 h of cold exposure. Subsequently, weighted gene co-expression network analysis revealed that the blue-green and blue modules were closely associated with rhythmic processes and fatty acid pathways. Finally, we identified four genes (Glyma.04G015200, Glyma.18G202800, Glyma.02G123700, and Glyma.13G266500) as potential candidate genes associated with mung bean cold tolerance. Overall, this study provides valuable transcriptomic resources for exploring plant cold adaptation mechanisms, aiding in the identification of key cold response genes and contributing to research aimed at enhancing crop cold tolerance.

Supplementary Materials

The following supporting information can be downloaded at: https://www.mdpi.com/article/10.3390/agronomy15061456/s1, Figure S1: Heatmaps showing genes differentially expressed at each time point before and after cold treatment (3 h, 12 h, 24 h); Figure S2: Comparative analysis of TFs that were either upregulated or downregulated following cold treatment durations of 3 h, 12 h, and 24 h in comparison to untreated controls; Table S1: Differentially expressed genes (DEGs) were identified at 3 h, 12 h, and 24 h following cold treatment in comparison to the untreated control; Table S2: Gene Ontology (GO) enrichment analysis for biological processes was conducted on differentially expressed genes (DEGs) in soybean following low-temperature treatment durations of 3 h, 12 h, and 24 h; Table S3: GO enrichment analysis for cellular components of differentially expressed genes (DEGs) in soybean subjected to low-temperature treatment for durations of 3 h, 12 h, and 24 h; Table S4: GO enrichment analysis for the molecular function of differentially expressed genes (DEGs) in soybean following 3 h, 12 h, and 24 h low-temperature treatments; Table S5: KEGG enrichment analysis in soybean subjected to low-temperature treatment for durations of 3 h, 12 h, and 24 h; Table S6: The characterization of gene associations within the turquoise module’s correlation network; Table S7: The characterization of the gene within the correlation network of the blue module.

Author Contributions

G.C. and Y.L. conceived and designed this research. Y.L. and J.X. undertook the material preparation and cold treatment. G.C. and L.L. contributed to data analysis and discussed the results. G.C. wrote the original draft. L.L., Y.L., and H.Z. revised the manuscript. L.L. supervised the entire study. Y.L. provided funding acquisition for the project. All authors have read and agreed to the published version of the manuscript.

Funding

This research was funded by the Talent Start-up Funding of Hainan Academy of Agricultural Sciences (HAAS2023RCQD22) and the Green and Efficient Industrialization Promotion Project Team of Hainan Food Crops.

Data Availability Statement

The raw sequence data reported in this study have been deposited in the Genome Sequence Archive (CRA019297) [81]. Data from the National Genomics Data Center [82], China National Center Bioinformation/Beijing Institute of Genomics, Chinese Academy of Sciences are publicly accessible at https://ngdc.cncb.ac.cn/gsa/ (accessed on 25 September 2024).

Conflicts of Interest

The authors declare that the research was conducted in the absence of any commercial or financial relationships that could be construed as potential conflicts of interest.

References

  1. Di, D.; He, S.; Zhang, R.; Gao, K.; Qiu, M.; Li, X.; Sun, H.; Xue, S.; Shi, J. Exploring the Dual Role of Anti-Nutritional Factors in Soybeans: A Comprehensive Analysis of Health Risks and Benefits. Crit. Rev. Food Sci. Nutr. 2024, 19, 1–18. [Google Scholar] [CrossRef] [PubMed]
  2. Nair, R.M.; Boddepalli, V.N.; Yan, M.-R.; Kumar, V.; Gill, B.; Pan, R.S.; Wang, C.; Hartman, G.L.; Silva E Souza, R.; Somta, P. Global Status of Vegetable Soybean. Plants 2023, 12, 609. [Google Scholar] [CrossRef]
  3. Bianchini, A.; Dutra de Moraes, P.V.; Domanski Jakubski, J.; Adami, P.F.; Bernardi Rankrape, C.; Rossi, P. Influence of Cover Crops with Allelopathic Potential and Their Reduction of Herbicide Use for Soybean Productivity. J. Environ. Sci. Health Part B 2022, 57, 890–896. [Google Scholar] [CrossRef]
  4. Wang, X.; Komatsu, S. Review: Proteomic Techniques for the Development of Flood-Tolerant Soybean. Int. J. Mol. Sci. 2020, 21, 7497. [Google Scholar] [CrossRef] [PubMed]
  5. Dhakal, K.; Zhu, Q.; Zhang, B.; Li, M.; Li, S. Analysis of Shoot Architecture Traits in Edamame Reveals Potential Strategies to Improve Harvest Efficiency. Front. Plant Sci. 2021, 12, 614926. [Google Scholar] [CrossRef] [PubMed]
  6. Gao, H.; Wu, G.; Wu, F.; Zhou, X.; Zhou, Y.; Xu, K.; Li, Y.; Zhang, W.; Zhao, K.; Jing, Y.; et al. Genome-Wide Association Analysis of Yield-Related Traits and Candidate Genes in Vegetable Soybean. Plants 2024, 13, 1442. [Google Scholar] [CrossRef]
  7. Moseley, D.; da Silva, M.P.; Mozzoni, L.; Orazaly, M.; Florez-Palacios, L.; Acuña, A.; Wu, C.; Chen, P. Effect of Planting Date and Cultivar Maturity in Edamame Quality and Harvest Window. Front. Plant Sci. 2021, 11, 585856. [Google Scholar] [CrossRef] [PubMed]
  8. Kao, C.-F.; He, S.-S.; Wang, C.-S.; Lai, Z.-Y.; Lin, D.-G.; Chen, S. A Modified Roger’s Distance Algorithm for Mixed Quantitative-Qualitative Phenotypes to Establish a Core Collection for Taiwanese Vegetable Soybeans. Front. Plant Sci. 2021, 11, 612106. [Google Scholar] [CrossRef]
  9. Wilkes, J.E.; Kirkpatrick, T.L. The Effects of Meloidogyne Incognita and Heterodera Glycines on the Yield and Quality of Edamame (Glycine max l.) in Arkansas. J. Nematol. 2020, 52, e2020-12. [Google Scholar] [CrossRef]
  10. Iman, M.N.; Irdiani, R.; Rahmawati, D.; Fukusaki, E.; Putri, S.P. Improvement of the Functional Value of Green Soybean (Edamame) Using Germination and Tempe Fermentation: A Comparative Metabolomics Study. J. Biosci. Bioeng. 2023, 136, 205–212. [Google Scholar] [CrossRef]
  11. Wang, Z.Q.; Senga, E.F.B.; Wang, D.Y. Vegetable Soy Bean (Glycine max (L.) Merrill) from Production to Processing. Outlook Agric. 2005, 34, 167–172. [Google Scholar] [CrossRef]
  12. Wszelaki, A.L.; Delwiche, J.F.; Walker, S.D.; Liggett, R.E.; Miller, S.A.; Kleinhenz, M.D. Consumer Liking and Descriptive Analysis of Six Varieties of Organically Grown Edamame-Type Soybean. Food Qual. Prefer. 2005, 16, 651–658. [Google Scholar] [CrossRef]
  13. Mozzoni, L.A.; Chen, P.; Morawicki, R.O.; Hettiarachchy, N.S.; Brye, K.R.; Mauromoustakos, A. Quality Attributes of Vegetable Soybean as a Function of Boiling Time and Condition. Int. J. Food Sci. Technol. 2009, 44, 2089–2099. [Google Scholar] [CrossRef]
  14. Lee, D.H.; Lee, W.; Shin, D.; Im, H.; Jung, G.; Lee, Y.-B.; Choi, J. Genomic and Metabolomic Analysis of Latilactobacillus sakei DCF0720 for Black Soybean Yogurt Fermentation. Int. J. Food Microbiol. 2024, 425, 110897. [Google Scholar] [CrossRef] [PubMed]
  15. Dong, Y.; Lan, T.; Liu, Z.; Xu, Z.; Jiang, L.; Zhang, Y.; Sui, X. Shear, Extensional Rheology, and Tribology of Polysaccharide-Thickened Soy Protein-Based Liquid Systems for Dysphagia Management. Food Chem. 2025, 463 Pt 1, 141145. [Google Scholar] [CrossRef]
  16. Zheng, L.; Regenstein, J.M.; Teng, F.; Li, Y. Tofu Products: A Review of Their Raw Materials, Processing Conditions, and Packaging. Compr. Rev. Food Sci. Food Saf. 2020, 19, 3683–3714. [Google Scholar] [CrossRef]
  17. Gawda, D.; Nowak, A.; Haliniarz, M.; Woniak, A. Yield and Economic Effectiveness of Soybean Grown Under Different Cropping Systems. Int. J. Plant Prod. 2020, 14, 475–485. [Google Scholar] [CrossRef]
  18. Zhang, Q.; Li, Y.; Chin, K.L.; Qi, Y. Vegetable Soybean: Seed Composition and Production Research. Ital. J. Agron. 2017, 12, 872. [Google Scholar] [CrossRef]
  19. Kopecká, R.; Kameniarová, M.; Černý, M.; Brzobohatý, B.; Novák, J. Abiotic Stress in Crop Production. Int. J. Mol. Sci. 2023, 24, 6603. [Google Scholar] [CrossRef]
  20. Wu, Y.; Liu, J.; Zhao, L.; Wu, H.; Zhu, Y.; Ahmad, I.; Zhou, G. Abiotic Stress Responses in Crop Plants: A Multi-Scale Approach. J. Integr. Agric. 2024, in press. [CrossRef]
  21. Esmaeili, N.; Shen, G.; Zhang, H. Genetic Manipulation for Abiotic Stress Resistance Traits in Crops. Front. Plant Sci. 2022, 13, 1011985. [Google Scholar] [CrossRef] [PubMed]
  22. Gong, Z.; Xiong, L.; Shi, H.; Yang, S.; Herrera-Estrella, L.R.; Xu, G.; Chao, D.-Y.; Li, J.; Wang, P.-Y.; Qin, F.; et al. Plant Abiotic Stress Response and Nutrient Use Efficiency. Sci. China Life Sci. 2020, 63, 635–674. [Google Scholar] [CrossRef] [PubMed]
  23. Villalobos-López, M.A.; Arroyo-Becerra, A.; Quintero-Jiménez, A.; Iturriaga, G. Biotechnological Advances to Improve Abiotic Stress Tolerance in Crops. Int. J. Mol. Sci. 2022, 23, 12053. [Google Scholar] [CrossRef] [PubMed]
  24. Ding, Y.; Shi, Y.; Yang, S. Advances and Challenges in Uncovering Cold Tolerance Regulatory Mechanisms in Plants. New Phytol. 2019, 222, 1690–1704. [Google Scholar] [CrossRef]
  25. Ermilova, E. Cold Stress Response: An Overview in Chlamydomonas. Front. Plant Sci. 2020, 11, 569437. [Google Scholar] [CrossRef]
  26. Zhang, Y.; Lin, D.; Yan, R.; Xu, Y.; Xing, M.; Liao, S.; Wan, C.; Chen, C.; Zhu, L.; Kai, W.; et al. Amelioration of Chilling Injury by Fucoidan in Cold-Stored Cucumber via Membrane Lipid Metabolism Regulation. Foods 2023, 12, 301. [Google Scholar] [CrossRef]
  27. Suzuki, N.; Rivero, R.M.; Shulaev, V.; Blumwald, E.; Mittler, R. Abiotic and Biotic Stress Combinations. New Phytol. 2014, 203, 32–43. [Google Scholar] [CrossRef]
  28. Kim, J.-S.; Kidokoro, S.; Yamaguchi-Shinozaki, K.; Shinozaki, K. Regulatory Networks in Plant Responses to Drought and Cold Stress. Plant Physiol. 2024, 195, 170–189. [Google Scholar] [CrossRef]
  29. Kao, P.-H.; Baiya, S.; Lai, Z.-Y.; Huang, C.-M.; Jhan, L.-H.; Lin, C.-J.; Lai, Y.-S.; Kao, C.-F. An Advanced Systems Biology Framework of Feature Engineering for Cold Tolerance Genes Discovery from Integrated Omics and Non-Omics Data in Soybean. Front. Plant Sci. 2022, 13, 1019709. [Google Scholar] [CrossRef]
  30. Wang, X.; Ding, Y.; Li, Z.; Shi, Y.; Wang, J.; Hua, J.; Gong, Z.; Zhou, J.-M.; Yang, S. PUB25 and PUB26 Promote Plant Freezing Tolerance by Degrading the Cold Signaling Negative Regulator MYB15. Dev. Cell 2019, 51, 222–235. [Google Scholar] [CrossRef]
  31. Mehrotra, S.; Verma, S.; Kumar, S.; Kumari, S.; Mishra, B.N. Transcriptional Regulation and Signalling of Cold Stress Response in Plants: An Overview of Current Understanding. Environ. Exp. Bot. 2020, 180, 104243. [Google Scholar] [CrossRef]
  32. Williams, M.M.; Zhang, B.; Fu, X.; Ross, J. Editorial: Everything Edamame: Biology, Production, Nutrition, Sensory and Economics. Front. Plant Sci. 2022, 13, 976008. [Google Scholar] [CrossRef] [PubMed]
  33. Bandara, A.Y.; Weerasooriya, D.K.; Bell, T.H.; Esker, P.D. Prospects of alleviating early planting-associated cold susceptibility of soybean using microbes: New insights from microbiome analysis. J. Agron. Crop Sci. 2021, 207, 171–185. [Google Scholar] [CrossRef]
  34. Tsegaw, M.; Zegeye, W.A.; Jiang, B.; Sun, S.; Yuan, S.; Han, T.; Wu, T. Progress and Prospects of the Molecular Basis of Soybean Cold Tolerance. Plants 2023, 12, 459. [Google Scholar] [CrossRef] [PubMed]
  35. Muncan, J.; Jinendra, B.M.S.; Kuroki, S.; Tsenkova, R. Aquaphotomics Research of Cold Stress in Soybean Cultivars with Different Stress Tolerance Ability: Early Detection of Cold Stress Response. Molecules 2022, 27, 744. [Google Scholar] [CrossRef]
  36. Wang, X.; Li, Z.; Shi, Y.; Liu, Z.; Zhang, X.; Gong, Z.; Yang, S. Strigolactones Promote Plant Freezing Tolerance by Releasing the WRKY41-Mediated Inhibition of CBF/DREB1 Expression. EMBO J. 2023, 42, e112999. [Google Scholar] [CrossRef]
  37. Chen, Y.; Liu, Z.; Han, D.; Yang, Q.; Li, C.; Shi, X.; Zhang, M.; Yang, C.; Qiu, L.; Jia, H.; et al. Cold Tolerance SNPs and Candidate Gene Mining in the Soybean Germination Stage Based on Genome-Wide Association Analysis. TAG Theor. Appl. Genet. Theor. Angew. Genet. 2024, 137, 178. [Google Scholar] [CrossRef]
  38. Hussain, M.A.; Li, S.; Gao, H.; Feng, C.; Sun, P.; Sui, X.; Jing, Y.; Xu, K.; Zhou, Y.; Zhang, W.; et al. Comparative Analysis of Physiological Variations and Genetic Architecture for Cold Stress Response in Soybean Germplasm. Front. Plant Sci. 2023, 13, 1095335. [Google Scholar] [CrossRef]
  39. Robison, J.D.; Yamasaki, Y.; Randall, S.K. The Ethylene Signaling Pathway Negatively Impacts CBF/DREB-Regulated Cold Response in Soybean (Glycine max). Front. Plant Sci. 2019, 10, 121. [Google Scholar] [CrossRef]
  40. Yang, M.; Teng, Y.; Yue, T.; Wang, Z.; Feng, G.; Ruan, J.; Yan, S.; Zheng, Y.; Zhang, L.; Chen, Q.; et al. The Overexpression of Peanut (Arachis hypogaea L.) AhALDH2B6 in Soybean Enhances Cold Resistance. Plants 2023, 12, 2928. [Google Scholar] [CrossRef]
  41. Shen, J.; Xu, Y.; Yuan, S.; Jin, F.; Huang, Y.; Chen, H.; Shan, Z.; Yang, Z.; Chen, S.; Zhou, X.; et al. Genome-Wide Identification of GmSPS Gene Family in Soybean and Expression Analysis in Response to Cold Stress. Int. J. Mol. Sci. 2023, 24, 12878. [Google Scholar] [CrossRef] [PubMed]
  42. Haidar, S.; Lackey, S.; Charette, M.; Yoosefzadeh-Najafabadi, M.; Gahagan, A.C.; Hotte, T.; Belzile, F.; Rajcan, I.; Golshani, A.; Morrison, M.J.; et al. Genome-Wide Analysis of Cold Imbibition Stress in Soybean, Glycine max. Front. Plant Sci. 2023, 14, 1221644. [Google Scholar] [CrossRef] [PubMed]
  43. Ren, C.; Wang, H.; Zhou, Z.; Jia, J.; Zhang, Q.; Liang, C.; Li, W.; Zhang, Y.; Yu, G. Genome-Wide Identification of the B3 Gene Family in Soybean and the Response to Melatonin under Cold Stress. Front. Plant Sci. 2023, 13, 1091907. [Google Scholar] [CrossRef]
  44. Bai, W.; Salih, H.; Yang, R.; Yang, Q.; Jin, P.; Liang, Y.; Zhang, D.; Li, X. ScDREBA5 Enhances Cold Tolerance by Regulating Photosynthetic and Antioxidant Genes in the Desert Moss Syntrichia caninervis. Plant Cell Environ. 2025, 48, 3293–3313. [Google Scholar] [CrossRef]
  45. Han, L.; Wang, Z.; Wang, Q.; Sun, D.W.; He, X.; Wang, H.; Ma, L.; Bai, C.; Watkins, C.B.; Zuo, J. Multiomics Comprehensive Analysis of Pre-Storage Low-Temperature on Cowpea Metabolism. Postharvest Biol. Technol. 2024, 216, 113056. [Google Scholar] [CrossRef]
  46. Zhang, X.; Yu, F.; Lyu, X.; Chen, J.; Zeng, H.; Xu, N.; Wu, Y.; Zhu, Q. Transcriptome Profiling of Bergenia purpurascens under Cold Stress. BMC Genom. 2023, 24, 754. [Google Scholar] [CrossRef]
  47. Yamasaki, Y.; Randall, S.K. Functionality of Soybean CBF/DREB1 Transcription Factors. Plant Sci. Int. J. Exp. Plant Biol. 2016, 246, 80–90. [Google Scholar] [CrossRef]
  48. Chen, M.; Xu, Z.; Xia, L.; Li, L.; Cheng, X.; Dong, J.; Wang, Q.; Ma, Y. Cold-Induced Modulation and Functional Analyses of the DRE-Binding Transcription Factor Gene, GmDREB3, in Soybean (Glycine max L.). J. Exp. Bot. 2009, 60, 121–135. [Google Scholar] [CrossRef] [PubMed]
  49. Su, L.-T.; Li, J.-W.; Liu, D.-Q.; Zhai, Y.; Zhang, H.-J.; Li, X.-W.; Zhang, Q.-L.; Wang, Y.; Wang, Q.-Y. A Novel MYB Transcription Factor, GmMYBJ1, from Soybean Confers Drought and Cold Tolerance in Arabidopsis thaliana. Gene 2014, 538, 46–55. [Google Scholar] [CrossRef]
  50. Pan, W.-J.; Tao, J.-J.; Cheng, T.; Shen, M.; Ma, J.-B.; Zhang, W.-K.; Lin, Q.; Ma, B.; Chen, S.-Y.; Zhang, J.-S. Soybean NIMA-Related Kinase1 Promotes Plant Growth and Improves Salt and Cold Tolerance. Plant Cell Physiol. 2017, 58, 1268–1278. [Google Scholar] [CrossRef]
  51. Li, J.; Sun, M.; Liu, Y.; Sun, X.; Yin, K. Genome-Wide Identification of Wild Soybean Mitochondrial Calcium Uniporter Family Genes and Their Responses to Cold and Carbonate Alkaline Stresses. Front. Plant Sci. 2022, 13, 867503. [Google Scholar] [CrossRef] [PubMed]
  52. Dong, Z.; Wang, H.; Li, X.; Ji, H. Enhancement of Plant Cold Tolerance by Soybean RCC1 Family Gene GmTCF1a. BMC Plant Biol. 2021, 21, 369. [Google Scholar] [CrossRef] [PubMed]
  53. Román, Á.; Andreu, V.; Hernández, M.L.; Lagunas, B.; Picorel, R.; Martínez-Rivas, J.M.; Alfonso, M. Contribution of the Different Omega-3 Fatty Acid Desaturase Genes to the Cold Response in Soybean. J. Exp. Bot. 2012, 63, 4973–4982. [Google Scholar] [CrossRef] [PubMed]
  54. Li, Y.; Tian, Q.; Wang, Z.; Li, J.; Liu, S.; Chang, R.; Chen, H.; Liu, G. Integrated Analysis of Transcriptomics and Metabolomics of Peach under Cold Stress. Front. Plant Sci. 2023, 14, 1153902. [Google Scholar] [CrossRef]
  55. Chen, W.; Zhang, J.; Zheng, S.; Wang, Z.; Xu, C.; Zhang, Q.; Wu, J.; Lou, H. Metabolite Profiling and Transcriptome Analyses Reveal Novel Regulatory Mechanisms of Melatonin Biosynthesis in Hickory. Hortic. Res. 2021, 8, 196. [Google Scholar] [CrossRef]
  56. Sun, J.; Qiu, C.; Ding, Y.; Wang, Y.; Sun, L.; Fan, K.; Gai, Z.; Dong, G.; Wang, J.; Li, X.; et al. Fulvic Acid Ameliorates Drought Stress-Induced Damage in Tea Plants by Regulating the Ascorbate Metabolism and Flavonoids Biosynthesis. BMC Genom. 2020, 21, 411. [Google Scholar] [CrossRef]
  57. Chen, S.; Zhou, Y.; Chen, Y.; Gu, J. Fastp: An Ultra-Fast All-in-One FASTQ Preprocessor. Bioinformatics 2018, 34, i884–i890. [Google Scholar] [CrossRef]
  58. Kim, D.; Paggi, J.M.; Park, C.; Bennett, C.; Salzberg, S.L. Graph-Based Genome Alignment and Genotyping with HISAT2 and HISAT-Genotype. Nat. Biotechnol. 2019, 37, 907–915. [Google Scholar] [CrossRef]
  59. Pertea, M.; Pertea, G.M.; Antonescu, C.M.; Chang, T.-C.; Mendell, J.T.; Salzberg, S.L. StringTie Enables Improved Reconstruction of a Transcriptome from RNA-Seq Reads. Nat. Biotechnol. 2015, 33, 290–295. [Google Scholar] [CrossRef]
  60. Liao, Y.; Smyth, G.K.; Shi, W. featureCounts: An Efficient General Purpose Program for Assigning Sequence Reads to Genomic Features. Bioinformatics 2014, 30, 923–930. [Google Scholar] [CrossRef]
  61. Love, M.I.; Huber, W.; Anders, S. Moderated Estimation of Fold Change and Dispersion for RNA-Seq Data with DESeq2. Genome Biol. 2014, 15, 550. [Google Scholar] [CrossRef] [PubMed]
  62. Langfelder, P.; Horvath, S. WGCNA: An R Package for Weighted Correlation Network Analysis. BMC Bioinform. 2008, 9, 559. [Google Scholar] [CrossRef] [PubMed]
  63. Shannon, P.; Markiel, A.; Ozier, O.; Baliga, N.S.; Wang, J.T.; Ramage, D.; Amin, N.; Schwikowski, B.; Ideker, T. Cytoscape: A Software Environment for Integrated Models of Biomolecular Interaction Networks. Genome Res. 2003, 13, 2498–2504. [Google Scholar] [CrossRef]
  64. Shomo, Z.D.; Li, F.; Smith, C.N.; Edmonds, S.R.; Roston, R.L. From Sensing to Acclimation: The Role of Membrane Lipid Remodeling in Plant Responses to Low Temperatures. Plant Physiol. 2024, 196, 1737–1757. [Google Scholar] [CrossRef] [PubMed]
  65. Sevillano, L.; Sanchez-Ballesta, M.T.; Romojaro, F.; Flores, F.B. Physiological, Hormonal and Molecular Mechanisms Regulating Chilling Injury in Horticultural Species. Postharvest Technologies Applied to Reduce Its Impact. J. Sci. Food Agric. 2009, 89, 555–573. [Google Scholar] [CrossRef]
  66. Winfield, M.O.; Lu, C.; Wilson, I.D.; Coghill, J.A.; Edwards, K.J. Plant Responses to Cold: Transcriptome Analysis of Wheat. Plant Biotechnol. J. 2010, 8, 749–771. [Google Scholar] [CrossRef]
  67. Radhakrishnan, V.S.; Reddy Mudiam, M.K.; Kumar, M.; Dwivedi, S.P.; Singh, S.P.; Prasad, T. Silver Nanoparticles Induced Alterations in Multiple Cellular Targets, Which Are Critical for Drug Susceptibilities and Pathogenicity in Fungal Pathogen (Candida albicans). Int. J. Nanomed. 2018, 13, 2647–2663. [Google Scholar] [CrossRef]
  68. Hou, Q.; Ufer, G.; Bartels, D. Lipid Signalling in Plant Responses to Abiotic Stress. Plant Cell Environ. 2016, 39, 1029–1048. [Google Scholar] [CrossRef]
  69. Knapp, B.D.; Huang, K.C. The Effects of Temperature on Cellular Physiology. Annu. Rev. Biophys. 2022, 51, 499–526. [Google Scholar] [CrossRef]
  70. Fagiani, F.; Di Marino, D.; Romagnoli, A.; Travelli, C.; Voltan, D.; Di Cesare Mannelli, L.; Racchi, M.; Govoni, S.; Lanni, C. Molecular Regulations of Circadian Rhythm and Implications for Physiology and Diseases. Signal Transduct. Target. Ther. 2022, 7, 41. [Google Scholar] [CrossRef]
  71. Liang, T.; Yu, S.; Pan, Y.; Wang, J.; Kay, S.A. The Interplay between the Circadian Clock and Abiotic Stress Responses Mediated by ABF3 and CCA1/LHY. Proc. Natl. Acad. Sci. USA 2024, 121, e2316825121. [Google Scholar] [CrossRef] [PubMed]
  72. Xu, X.; Yuan, L.; Yang, X.; Zhang, X.; Wang, L.; Xie, Q. Circadian Clock in Plants: Linking Timing to Fitness. J. Integr. Plant Biol. 2022, 64, 792–811. [Google Scholar] [CrossRef]
  73. Srivastava, D.; Shamim, M.; Kumar, M.; Mishra, A.; Maurya, R.; Sharma, D.; Pandey, P.; Singh, K.N. Role of Circadian Rhythm in Plant System: An Update from Development to Stress Response. Environ. Exp. Bot. 2019, 162, 256–271. [Google Scholar] [CrossRef]
  74. Cano-Ramirez, D.L.; Panter, P.E.; Takemura, T.; de Fraine, T.S.; de Barros Dantas, L.L.; Dekeya, R.; Barros-Galvão, T.; Paajanen, P.; Bellandi, A.; Batstone, T.; et al. Low-Temperature and Circadian Signals Are Integrated by the Sigma Factor SIG5. Nat. Plants 2023, 9, 661–672. [Google Scholar] [CrossRef]
  75. Kidokoro, S.; Shinozaki, K.; Yamaguchi-Shinozaki, K. Transcriptional Regulatory Network of Plant Cold-Stress Responses. Trends Plant Sci. 2022, 27, 922–935. [Google Scholar] [CrossRef]
  76. Sharma, M.; Irfan, M.; Kumar, A.; Kumar, P.; Datta, A. Recent Insights into Plant Circadian Clock Response Against Abiotic Stress. J. Plant Growth Regul. 2022, 41, 3530–3543. [Google Scholar] [CrossRef]
  77. Hüner, N.P.A.; Bode, R.; Dahal, K.; Hollis, L.; Rosso, D.; Krol, M.; Ivanov, A.G. Chloroplast Redox Imbalance Governs Phenotypic Plasticity: The “Grand Design of Photosynthesis” Revisited. Front. Plant Sci. 2012, 3, 255. [Google Scholar] [CrossRef]
  78. Qiu, Y.; Li, M.; Kim, R.J.-A.; Moore, C.M.; Chen, M. Daytime Temperature Is Sensed by Phytochrome B in Arabidopsis through a Transcriptional Activator HEMERA. Nat. Commun. 2019, 10, 140. [Google Scholar] [CrossRef] [PubMed]
  79. Legris, M.; Klose, C.; Burgie, E.S.; Costigliolo Rojas, C.; Neme, M.; Hiltbrunner, A.; Wigge, P.A.; Schaefer, E.; Vierstra, R.D.; Casal, J.J. Phytochrome B Integrates Light and Temperature Signals in Arabidopsis. Science 2016, 354, 897–900. [Google Scholar] [CrossRef]
  80. Li, Y.; Shi, Y.; Li, M.; Fu, D.; Wu, S.; Li, J.; Gong, Z.; Liu, H.; Yang, S. The CRY2-COP1-HY5-BBX7/8 Module Regulates Blue Light-Dependent Cold Acclimation in Arabidopsis. Plant Cell 2021, 33, 3555–3573. [Google Scholar] [CrossRef]
  81. Chen, T.; Chen, X.; Zhang, S.; Zhu, J.; Tang, B.; Wang, A.; Dong, L.; Zhang, Z.; Yu, C.; Sun, Y.; et al. The Genome Sequence Archive Family: Toward Explosive Data Growth and Diverse Data Types. Genom. Proteom. Bioinform. 2021, 19, 578–583. [Google Scholar] [CrossRef] [PubMed]
  82. CNCB-NGDC Members and Partners. Database Resources of the National Genomics Data Center, China National Center for Bioinformation in 2024. Nucleic Acids Res. 2024, 52, D18–D32. [Google Scholar] [CrossRef] [PubMed]
Figure 1. Characterization of all genes before and after cold treatment. (A) Correlation analysis of gene expression profiles, where darker colors indicate stronger correlations. (B) PCA of gene expression profiles before and after cold treatment, with each point representing a treatment condition for gene expression profiling.
Agronomy 15 01456 g001
Figure 2. Characterization of differentially expressed genes before and after cold treatment. (A) Quantification of differentially expressed genes following cold treatment for 3 h, 12 h, and 24 h, compared to untreated samples. (B) Venn diagrams illustrating the differentially expressed genes that are common and unique to the 3 h, 12 h, and 24 h cold treatment conditions.
Agronomy 15 01456 g002
Figure 3. The differential expression of cold-related genes. The asterisk symbol denotes statistical significance, where a single asterisk (**) signifies a highly significant difference.
Agronomy 15 01456 g003
Figure 4. Enrichment analyses of DEGs under cold treatment. (A) GO enrichment analysis for biological process categories of DEGs in soybeans subjected to low-temperature treatment for durations of 3 h, 12 h, and 24 h. (B) KEGG enrichment analyses were conducted on DEGs following 3 h, 12 h, and 24 h low-temperature treatments. The varying colors denote p-values, while the size of the markers corresponds to the number of genes. Hollow circles indicate the 12 h cold treatment, solid circles denote the 24 h cold treatment, and asterisks represent the 3 h treatment.
Agronomy 15 01456 g004
Figure 5. Mapping analyses of fatty acid metabolism pathway under cold treatment. DEG mapping analyses of (A) fatty acid biosynthesis and elongation, and (B) the fatty acid degradation pathway following 3 h of cold treatment compared to untreated controls. (C) Examination of candidate gene expression levels within fatty acid metabolism pathways, with asterisks (**) indicating statistically significant differences, NS indicates non-significant difference. Red represents upregulated genes, green represents downregulated genes. FAB2 represents acyl—[acyl-carrier protein] desaturase [EC:1.14.19.2 1.14.19.11 1.14.19.26]. FATA represents fatty acyl-ACP thioesterase A [EC:3.1.2.14]. FabF represents 3-oxoacyl-[acyl-carrier-protein] synthase II [EC:2.3.1.179]. FabG represents 3-oxoacyl—[acyl-carrier protein] reductase [EC:1.1.1.100]. FabZ represents 3-hydroxyacyl-[acyl-carrier-protein] dehydratase [EC:4.2.1.59]. FabI represents enoyl—[acyl-carrier protein] reductase I [EC:1.3.1.9 1.3.1.10]. ACOX1 represents acyl-CoA oxidase [EC:1.3.3.6]. ACADM represents acyl-CoA dehydrogenase [EC:1.3.8.7]. paaF represents enoyl-CoA hydratase [EC:4.2.1.17]. HADH represents 3-hydroxyacyl-CoA dehydrogenase [EC:1.1.1.35]. HADHA represents enoyl-CoA hydratase/long-chain 3-hydroxyacyl-CoA dehydrogenase [EC:4.2.1.17 1.1.1.211].
Agronomy 15 01456 g005
Figure 6. Identification of gene modules through differential gene expression analysis. (A) The hierarchical cluster tree from WGCNA shows co-expression modules, with each leaf representing a gene. The tree’s main branches define 20 distinct, color-coded modules. The x-axis lists genes, and the y-axis shows co-expression distance. A colored bar below the dendrogram marks the modules. (B) Module–time point correlation analysis: Rows represent modules, columns represent samples, and cell colors indicate the correlation coefficient between each module and sample. The gene expression patterns of the (C) purple module and (D) pink module are illustrated, with red representing high expression and green representing low expression.
Agronomy 15 01456 g006
Figure 7. Analyses of the turquoise and blue module. The gene expression patterns of the (A) turquoise module and (B) blue module are depicted, with red indicating high expression levels and green indicating low expression levels. The correlation networks of the (C) turquoise module and (D) blue module are presented. A gene network was built with WGCNA, showing genes as nodes and co-expression correlations as edges. The top 50 genes by edge count are visualized in Cytoscape, with circle colors indicating edge numbers.
Agronomy 15 01456 g007
Table 1. Summary of sequencing data quality.
SampleRaw
Reads
Clean
Reads
Clean
Base (G)
Q30
(%)
GC
Content (%)
Reads
Mapped
3h_CK_143,871,18443,211,2886.4892.6745.0741,622,905
(96.32%)
3h_CK_243,948,95443,235,3666.4992.545.3741,588,504
(96.19%)
3h_CK_361,577,25060,025,7709.0090.244.6457,794,718
(96.28%)
3h_cold_151,789,68650,931,4567.6492.5145.4349,039,983
(96.29%)
3h_cold_243,213,70442,391,0646.3692.6945.0140,910,763
(96.51%)
3h_cold_349,329,76648,449,9447.2792.3845.3246,613,834
(96.21%)
12h_CK_143,301,63842,618,5146.3992.744.8340,996,780
(96.19%)
12h_CK_250,526,54249,545,2727.4392.5544.5247,752,758
(96.38%)
12h_CK_348,957,65448,167,5187.2392.9944.4946,529,026
(96.60%)
12h_cold_148,718,24048,086,1687.2192.544.9646,329,279
(96.35%)
12h_cold_245,488,06844,703,3926.7192.2645.0543,147,507
(6.52%)
12h_cold_355,215,94053,451,4108.0290.544.2651,525,397
(96.40%)
24h_CK_144,086,61843,341,3306.592.4144.8141,568,022
(95.91%)
24h_CK_255,132,57253,774,9088.0792.5844.5551,604,386
(95.96%)
24h_CK_344,103,03243,475,4266.5292.6744.741,275,933
(94.94%)
24h_cold_144,451,84643,693,1006.5592.7544.7442,095,358
(96.34%)
24h_cold_247,111,75246,262,2906.9492.3844.5744,302,151
(95.76%)
24h_cold_343,195,26442,491,9086.3791.9144.5340,733,667
(95.86%)
Disclaimer/Publisher’s Note: The statements, opinions and data contained in all publications are solely those of the individual author(s) and contributor(s) and not of MDPI and/or the editor(s). MDPI and/or the editor(s) disclaim responsibility for any injury to people or property resulting from any ideas, methods, instructions or products referred to in the content.

