Article

Study on the Response of Cotton Leaf Color to Plant Water Content Changes and Optimal Irrigation Thresholds

1
College of Resources and Environment, Xinjiang Agricultural University, Urumqi 830052, China
2
Western Agriculture Research Center, Chinese Academy of Agricultural Sciences, Changji 831100, China
3
Institute of Environment and Sustainable Development in Agriculture, Chinese Academy of Agricultural Sciences, Beijing 100081, China
*
Authors to whom correspondence should be addressed.
Agronomy 2025, 15(6), 1477; https://doi.org/10.3390/agronomy15061477
Submission received: 15 May 2025 / Revised: 13 June 2025 / Accepted: 15 June 2025 / Published: 18 June 2025
(This article belongs to the Special Issue Water Saving in Irrigated Agriculture: Series II)

Abstract

Real-time monitoring of cotton moisture status and determination of appropriate irrigation thresholds are essential for achieving precision irrigation. Currently employed diagnostic methods based on physiological indicators, remote sensing, or soil moisture measurements typically present limitations including cumbersome procedures, high labor intensity, requirements for specialized technical expertise, and delayed results. To address these challenges, this study investigated the relationship between plant water content and leaf RGB color values (red, green, and blue color values measured using LScolor technology) during the bud, flowering, and boll development stages, with the objective of establishing a predictive model for rapid, real-time moisture status monitoring. Given that leaf position and color values (R, G, and B) of different functional leaves may influence the relationship between leaf color and plant water content, and this relationship varies across different temporal periods, a two-year experiment was conducted. In 2023, leaf color data from the top five functional leaves were measured at five time points daily throughout the irrigation cycle. In 2024, the following four irrigation treatments were established: one conventional irrigation control treatment (CK) and three irrigation treatments at 72% (T1), 70% (T2), and 68% (T3) plant water content thresholds. Results demonstrated that the following: (1) plant water content initially declined during the day and subsequently showed slight recovery, indicating cotton’s particular susceptibility to water stress between 2:30 p.m. and 7:00 p.m.; (2) plant water content continuously decreased across five measurement periods following irrigation during the bud, flowering, and boll development stages, with R and G color values of the five functional leaves showing declining trends between 2:30 p.m. and 7:00 p.m., while B color values exhibited no consistent pattern; (3) correlation analysis revealed significant positive correlations between plant water content and R and G color values of the five functional leaves during the 2:30 p.m. to 5:00 p.m. period, with highly significant correlations observed for the third and fourth leaves from the apex; (4) univariate and bivariate linear regression models were successfully established between cotton water content and R and G color values of the third and fourth leaves from the top; and (5) under 72% plant water content conditions, cotton achieved the highest yield and Irrigation Water Use Efficiency, indicating that 72% represents the optimal irrigation threshold. In conclusion, integrating leaf color–plant water content relationships with the 72% irrigation threshold enables rapid, non-destructive, large-scale diagnosis of cotton moisture status, providing a robust foundation for implementing effective precision irrigation strategies.

1. Introduction

As one of the important fiber crops, cotton is widely cultivated in more than 150 countries worldwide and plays a vital role in socio-economic development [1,2]. Global cotton production is estimated to reach 24 million tons by 2023 [3]. China is the second largest cotton-cultivated country, contributing over 6 million tons of cotton [4]. More than 90% of cotton yield in China is produced in Xinjiang [4]. The high cotton productivity in Xinjiang is partly attributed to the region’s abundant light and heat resources. Another contributing factor is the application of the “short, dense, early” cultivation mode under drip irrigation, which increases cotton yield by reducing individual plant height (short), increasing population density (dense), and promoting early boll formation. However, cotton production in Xinjiang has long been constrained by water scarcity and relies on a fixed irrigation amount (4500 m3·ha−1). Moreover, this fixed irrigation volume is evenly distributed throughout the growing season due to an unclear understanding of cotton’s temporal water requirements. Therefore, real-time and accurate assessment of plant water content is essential for optimizing irrigation strategies and maximizing cotton yield.
Numerous methods have been proposed to monitor plant water content based on soil moisture status, crop physiological indices, and remote sensing techniques [5,6,7]. Several physiological indices, such as leaf water potential and stomatal conductance, serve as reliable indicators for predicting plant water content due to their sensitivity to water stress [8,9,10,11,12]. Additionally, remote sensing monitoring is widely employed for crop water content assessment because it enables rapid, non-destructive information acquisition, particularly at large scales [13,14]. However, given that plant water content often lags behind soil moisture status [15,16], predictions of crop water content through physiological indices and remote sensing require expensive instrumentation and specialized technical knowledge. Consequently, there is a critical need to develop novel, accurate, and user-friendly methods for monitoring crop water content, which is particularly important for cotton farmers who typically lack access to advanced instruments and technical expertise.
Alternatively, leaf color is a potential and user-friendly method to assess crop water content based on the following reasons. Firstly, it is reported that leaf chlorophyll was positively associated with leaf R (red) and B (blue) colors due to Wang [17,18]. Secondly, leaf chlorophyll is in turn controlled by crop water content because chlorophyll synthesis is tightly determined by crop water content [19,20,21]. These findings indicated that, in theory, it is possible to monitor crop water content via leaf color. However, our knowledge about the relationship of leaf color with crop water content in practice is still rare.
This study hypothesized that leaf RGB color values would exhibit significant correlations with plant water content, with potential variations among different color components (R, G, and B values); that functional leaves at different positions might influence the relationship between leaf color values and moisture content; and that different time periods throughout the day could affect the correlations between cotton leaf color and water status. The experiment was conducted in two phases.
To address this knowledge gap, this study synchronously monitored cotton water content and RGB leaf color values across different growth stages to explore their relationship. Specifically, this study aimed to answer the following three scientific questions: (1) How does cotton water content vary at different growth stages? (2) How does the leaf RGB color of cotton change during each growth stage? (3) Among the RGB components, which is the best indicator for predicting cotton water content?

2. Materials and Methods

2.1. Study Site

This experiment was conducted at the Changji Comprehensive Experimental Base of the Chinese Academy of Agricultural Sciences in Changji, Xinjiang, China (44°16′ N; 87°19′ E, 453 m above sea level). The area is located at the northern foot of the Tianshan Mountains and the southeastern edge of the Junggar Basin. It has a mid-temperate continental arid climate characterized by cold winters, hot summers, and significant variations of temperature between day and night. The annual average sunshine hours are about 2700 h. The yearly accumulated temperature of ≥10 °C is 3450 °C, and the frost-free period is 160–190 days. The annual average precipitation is about 200 mm, mainly concentrated in the summer. Soil samples were randomly collected from 4 sampling points with 3 replicates, and the baseline values of the experimental site were determined as follows: alkali-hydrolyzable nitrogen 26 mg·kg−1; available phosphorus 47 mg·kg−1; available potassium 349 mg·kg−1; soil organic matter 13 g·kg−1; soil pH 8.4; electrical conductivity 1511 μS·cm−1; bulk density 1.49 g·cm−3. The soil texture of the study site was classified as clay loam.

2.2. Experimental Design

The cotton variety ‘Zhongmian 125’ was used in our study. The fertigation under film was applied, with a film width of 2.31 m. The cotton was seeded under the film with spacing between rows of 66 and 10 cm, resulting in 6 rows per film. The spacing between plants was 9.5 cm. The dripping belt was patch-type, with a spacing between drip heads of 30 cm. Field management was consistent with local tradition. The diammonium phosphate (18-46-0) was applied as base fertilizer at 375 kg·ha−1 before seeding. The urea (N 46%), potassium sulfate (K2O 50%), and monoammonium phosphate (12-61-0) were applied at 600 kg·ha−1, 375 kg·ha−1, and 450 kg·ha−1, respectively, with irrigation during the growth period. The length and width of our experimental plot were 38 m and 9.24 m, respectively. The cotton was sown on 26 April 2023 and entered the seedling stage on 9 May, the bud stage on 4 June, the flowering-boll stage on 25 June, and the boll-opening stage on 29 August. The cotton was harvested on 19 October.

2.2.1. Experiment 1

The experiment was conducted in 2023 to investigate the daily and periodic variations in cotton morphology and water content.
Daily variation: Previous studies have collected chlorophyll data by establishing different time points [22,23]. In this experiment, based on the changes in plant moisture and ambient temperature, five time periods were established: 9:30–12:00, 12:00–14:30, 14:30–17:00, 17:00–19:00, and 19:00–21:00. Color values of functional leaves from 10 cotton plants with uniform and continuous growth were collected during these five time periods each day, and the plant water content of the cotton was also measured.
Periodic variation: Within each irrigation cycle, the relationship between the changes in color values of functional leaves and the water content of cotton at different time periods was analyzed.

2.2.2. Experiment 2

Based on the fitting equation between leaf color and water content established in Experiment 1, the plant water status was determined using leaf color values measured during the optimal time period, with the experiment conducted in 2024. A field experimental design was adopted with four irrigation treatments. Each plot covered an area of 353.4 m2, measuring 38 m in length and 9.24 m in width, with irrigation amount uniformly set at 215 m3·ha−1. Control (CK): conventional field cultivation method with irrigation applied once every 8 days. Three soil moisture lower limits were established; irrigation was conducted when the whole-plant water content of cotton decreased to 72% (T1), 70% (T2), and 68% (T3), respectively.

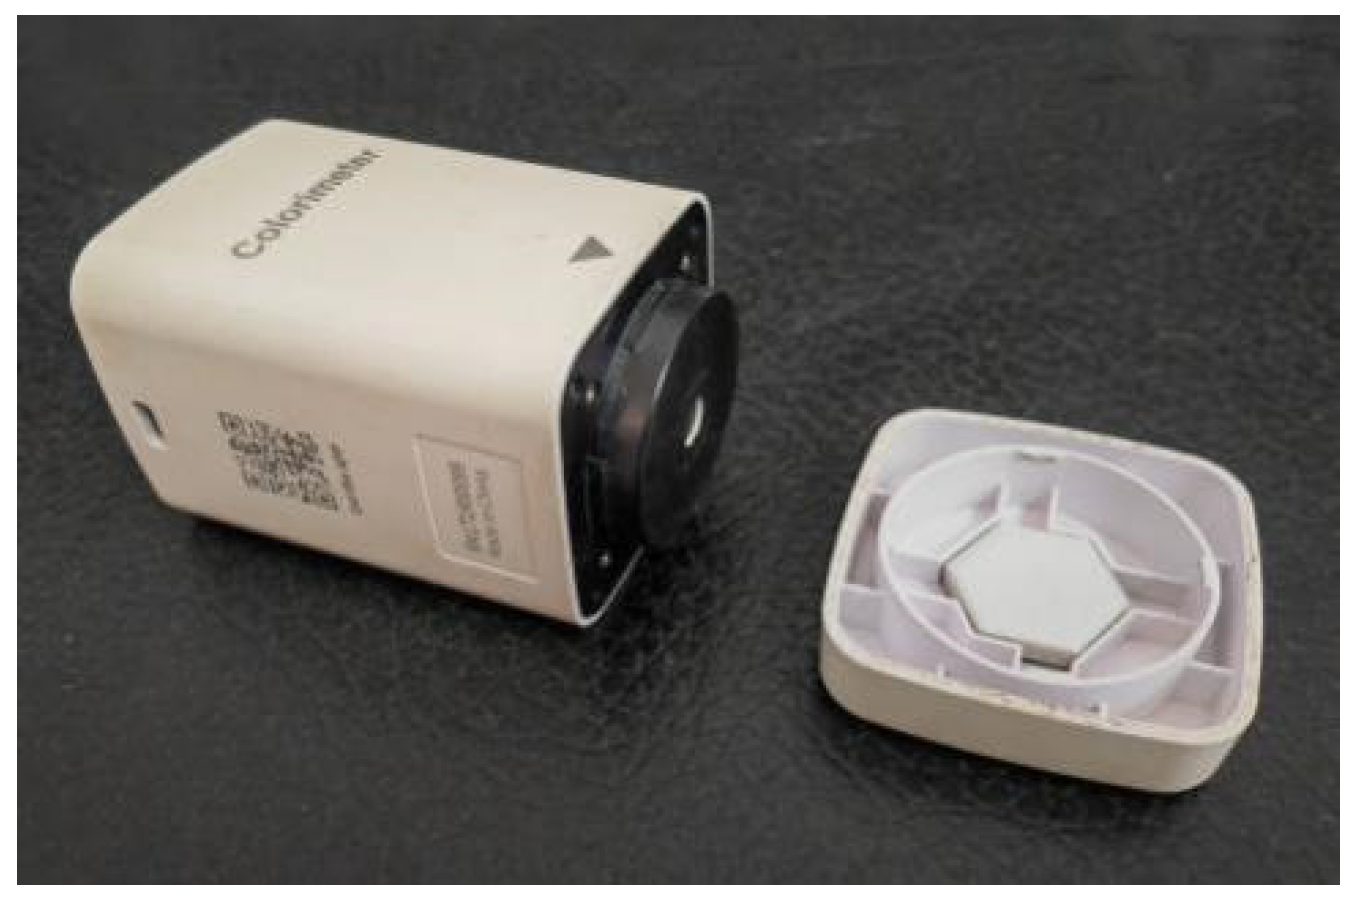
2.2.3. Cotton Leaf Color Value Collection

Prior to mid-June, environmental temperatures were relatively low and served as the primary limiting factor for cotton growth; during this period, cotton growth was predominantly vegetative. Following topping treatment in mid-July, the apical dominance of cotton was eliminated, and growth completely transitioned to the reproductive phase, no longer requiring regulation of the dynamic balance between vegetative and reproductive growth. Between mid-June and mid-July, however, environmental temperatures were elevated and stable, no longer functioning as a limiting factor. During this critical period, excessive water supply could result in overly vigorous vegetative growth, thereby suppressing reproductive development; moderate drought stress could inhibit vegetative growth and promote reproductive development; however, severe drought stress would simultaneously suppress both growth processes. Therefore, strategic water management is essential during this stage to achieve optimal balance between vegetative and reproductive growth. Based on this analysis, the experimental period was established from mid-June to mid-July, concluding with the topping treatment.
During each irrigation cycle at the bud, flowering, and boll-setting stages, 5 cotton plants with uniform growth and continuous arrangement were selected, with 3 replications; RGB color values of the second to sixth leaves (referring to the second to sixth leaves spreading outward from the main stem growing downward from the tip) were measured using the LScolor170 (Figure 1), conducted at five time periods daily. The LScolor170 has deviation values between 0.1 and 0.5, calibrated once per irrigation cycle using white and black reference boards. Under light-shielded conditions, leaf RGB tri-color values were measured using the LScolor170 instrument’s built-in light source, with RGB tri-color value measurement ranges between 0 and 255 (Shenzhen Linshang Technology Co., Ltd., Shenzhen, China).

2.3. Cotton Moisture Determination

During the irrigation cycle from mid-June to mid-July, two cotton plants with uniform growth near the designated observation sites were collected at five different time periods each day, with three replications. The water content of the entire cotton plant was determined using the oven-drying method. Before weighing, attached impurities or soil were removed from the collected cotton samples. After weighing, the whole cotton plant samples were cut into 3–5 cm pieces and immediately blanched at 105 °C for 0.5 h, then dried at a constant temperature of 80 °C for 12 h until reaching constant weight. The dry weight of the entire cotton plant was then measured. The plant water content of cotton was calculated using Formula (1).
Plant water content (%) = (Fresh weight − Dry weight) ÷ (Fresh weight)

2.4. Agronomic Traits and Yield

During yield measurement on 25 August, five consecutive cotton plants with uniform growth were selected for each treatment, with three replications. The following parameters were investigated: plant height (cm)—distance from cotyledon node to the main stem apex; stem diameter (mm)—measured at the position between the cotyledon node and the first main stem leaf using vernier calipers, with three measurements taken and the mean value presented; and the number of leaves on the main stem.
In each experimental plot, a representative area with uniform cotton growth was selected for yield measurement, with a total measured area of 6.67 m2. Within each area, the harvest density and the number of bolls per fruiting branch were recorded. This was repeated three times. Additionally, for each treatment, 30 bolls were collected from the lower (from 1st to 3rd fruiting branches), middle (from 4th to 6th fruiting branches), and upper parts (7th fruiting branch and above) of the plants. These bolls were air-dried and used to calculate the average individual boll weight. The seed cotton yield was calculated using the following Formula (2) [24]:
Seed Cotton Yield (kg·ha−1) = Harvest Density (plants·ha−1) × Bolls per Plant (bolls/plant) × Individual Boll Weight (g/boll) ÷ 1000 × 0.9

2.5. Data Processing and Analysis

Data processing was conducted using Microsoft Excel. Analysis of variance (ANOVA) was performed in Origin to examine the continuous temporal trends in plant water content and leaf color RGB values throughout each irrigation cycle. Correlation analysis was carried out using SPSS (IBM SPSS Statistics 27) to investigate the relationships between color values and plant moisture content, with significance levels set at p < 0.05 and high significance at p < 0.01. Both simple and multiple linear regression analyses were performed in Origin to model the relationships between plant water content and leaf color R and G values. Cotton yield, agronomic characteristics, and Irrigation Water Use Efficiency for all treatments were visualized through graphical representations generated in Origin (Origin 2022) software.

3. Results and Analysis

3.1. Plant Moisture Content and Leaf Color Change Trends

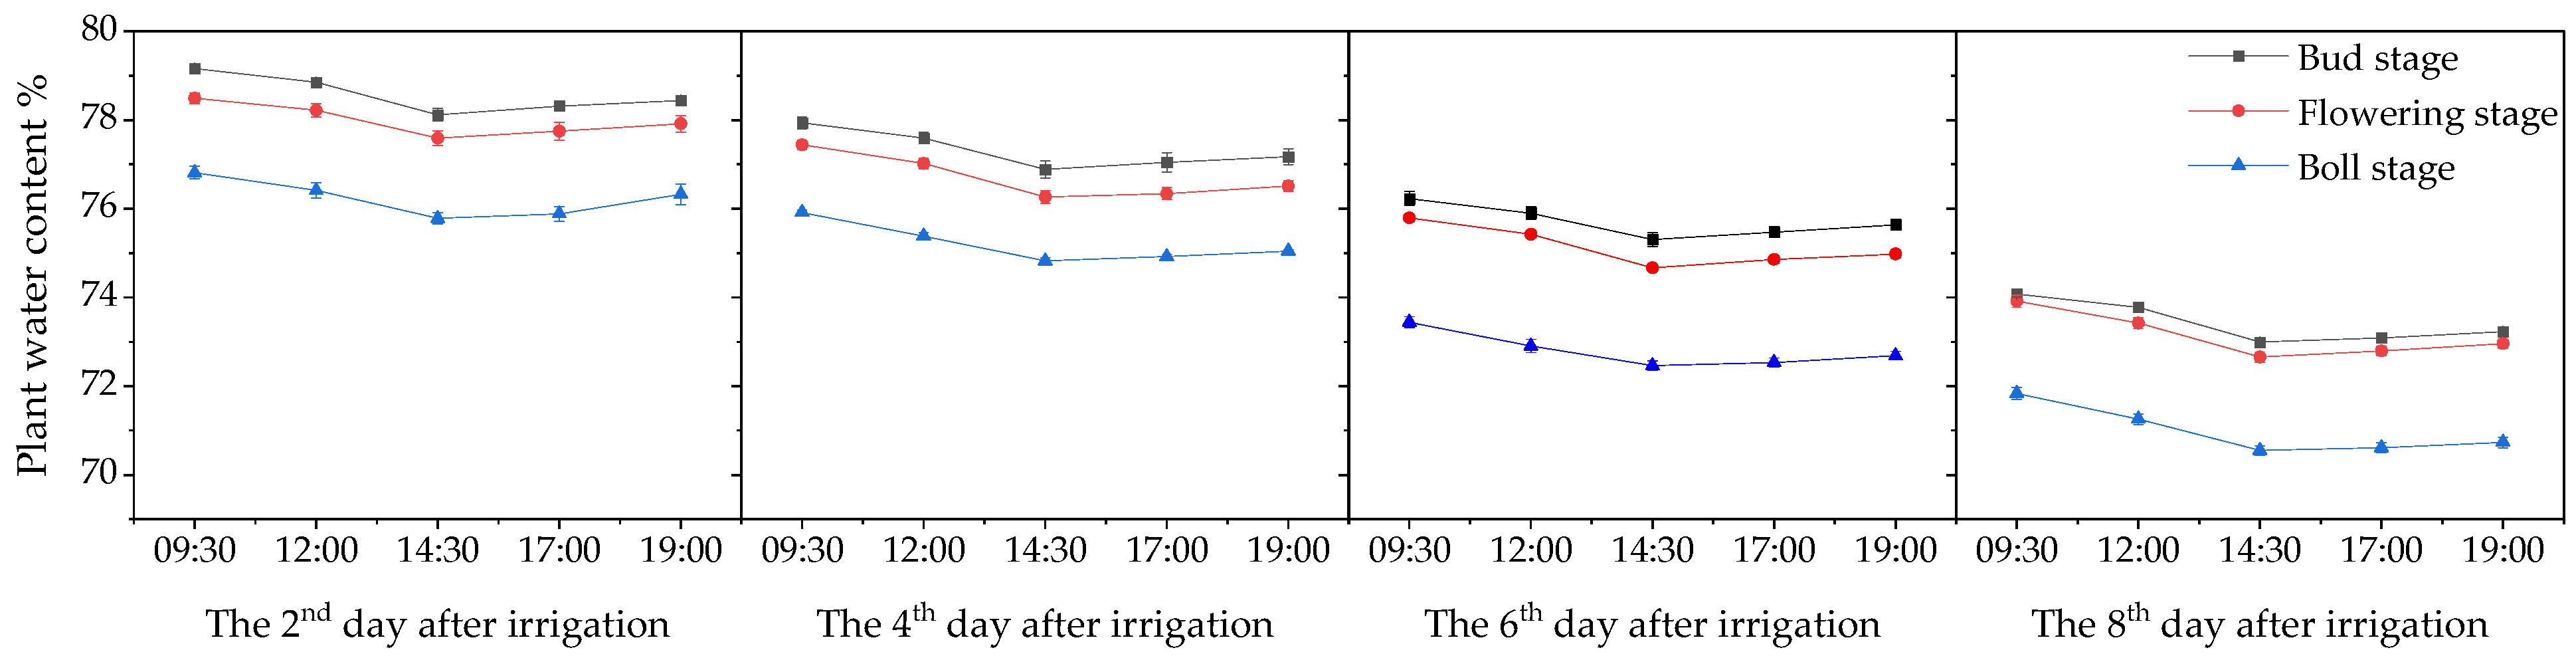
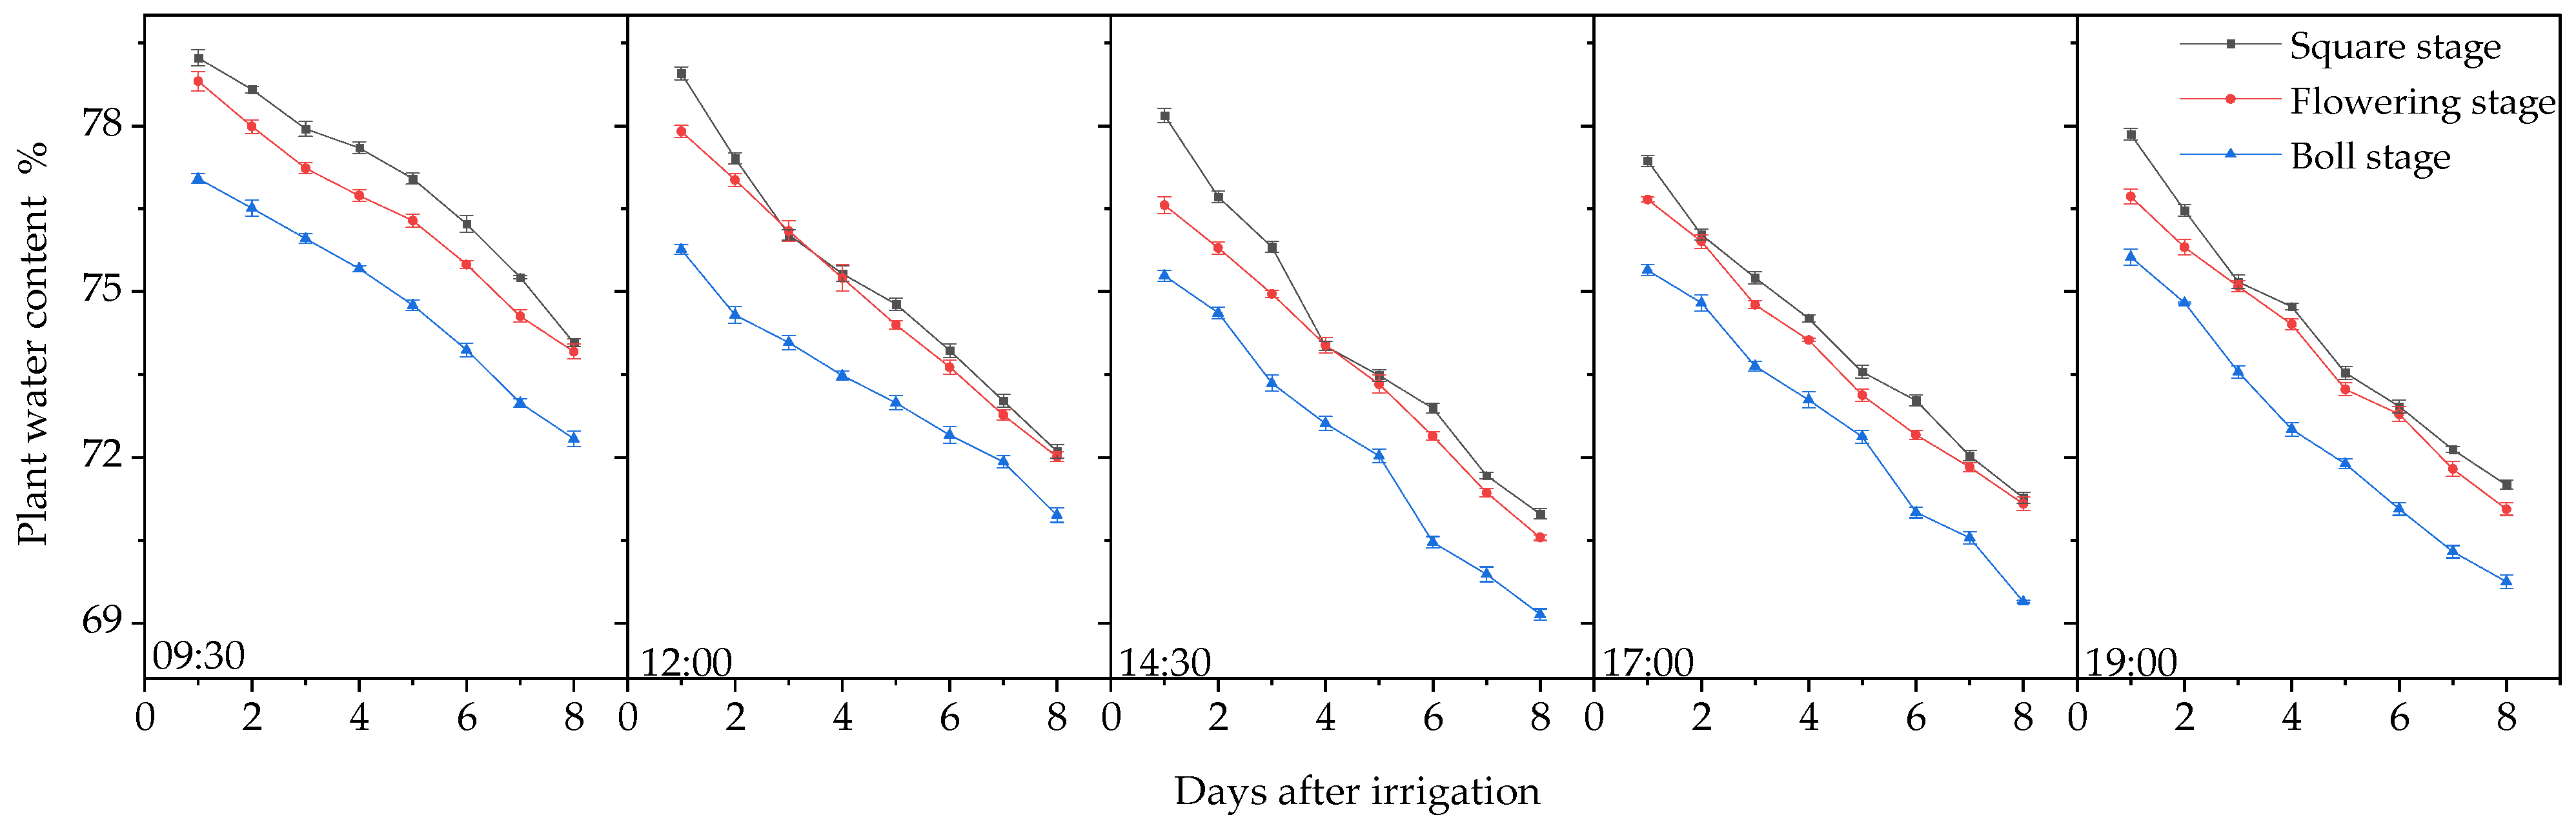
3.1.1. Changes in Plant Water Content

The water content of cotton plants exhibited a distinct diurnal pattern. From 09:30 to 14:30, plant water content decreased progressively and reached its minimum between 14:30 and 17:00. From 17:00 to 21:00, plant water content demonstrated a slight recovery trend (Figure 2). The diurnal patterns of plant water content showed consistent trends across the bud, flowering, and boll stages, with plant water content during the bud and flowering stages being higher than that observed during the boll stage.
Following irrigation, plant water content exhibited a declining trend over time, with ranges of 79.2–70.9%, 78.8–70.6%, and 77.0–69.2% during the bud, flowering, and boll stages, respectively. Plant water content during the bud and flowering stages was consistently higher than that observed during the boll stage (Figure 3).

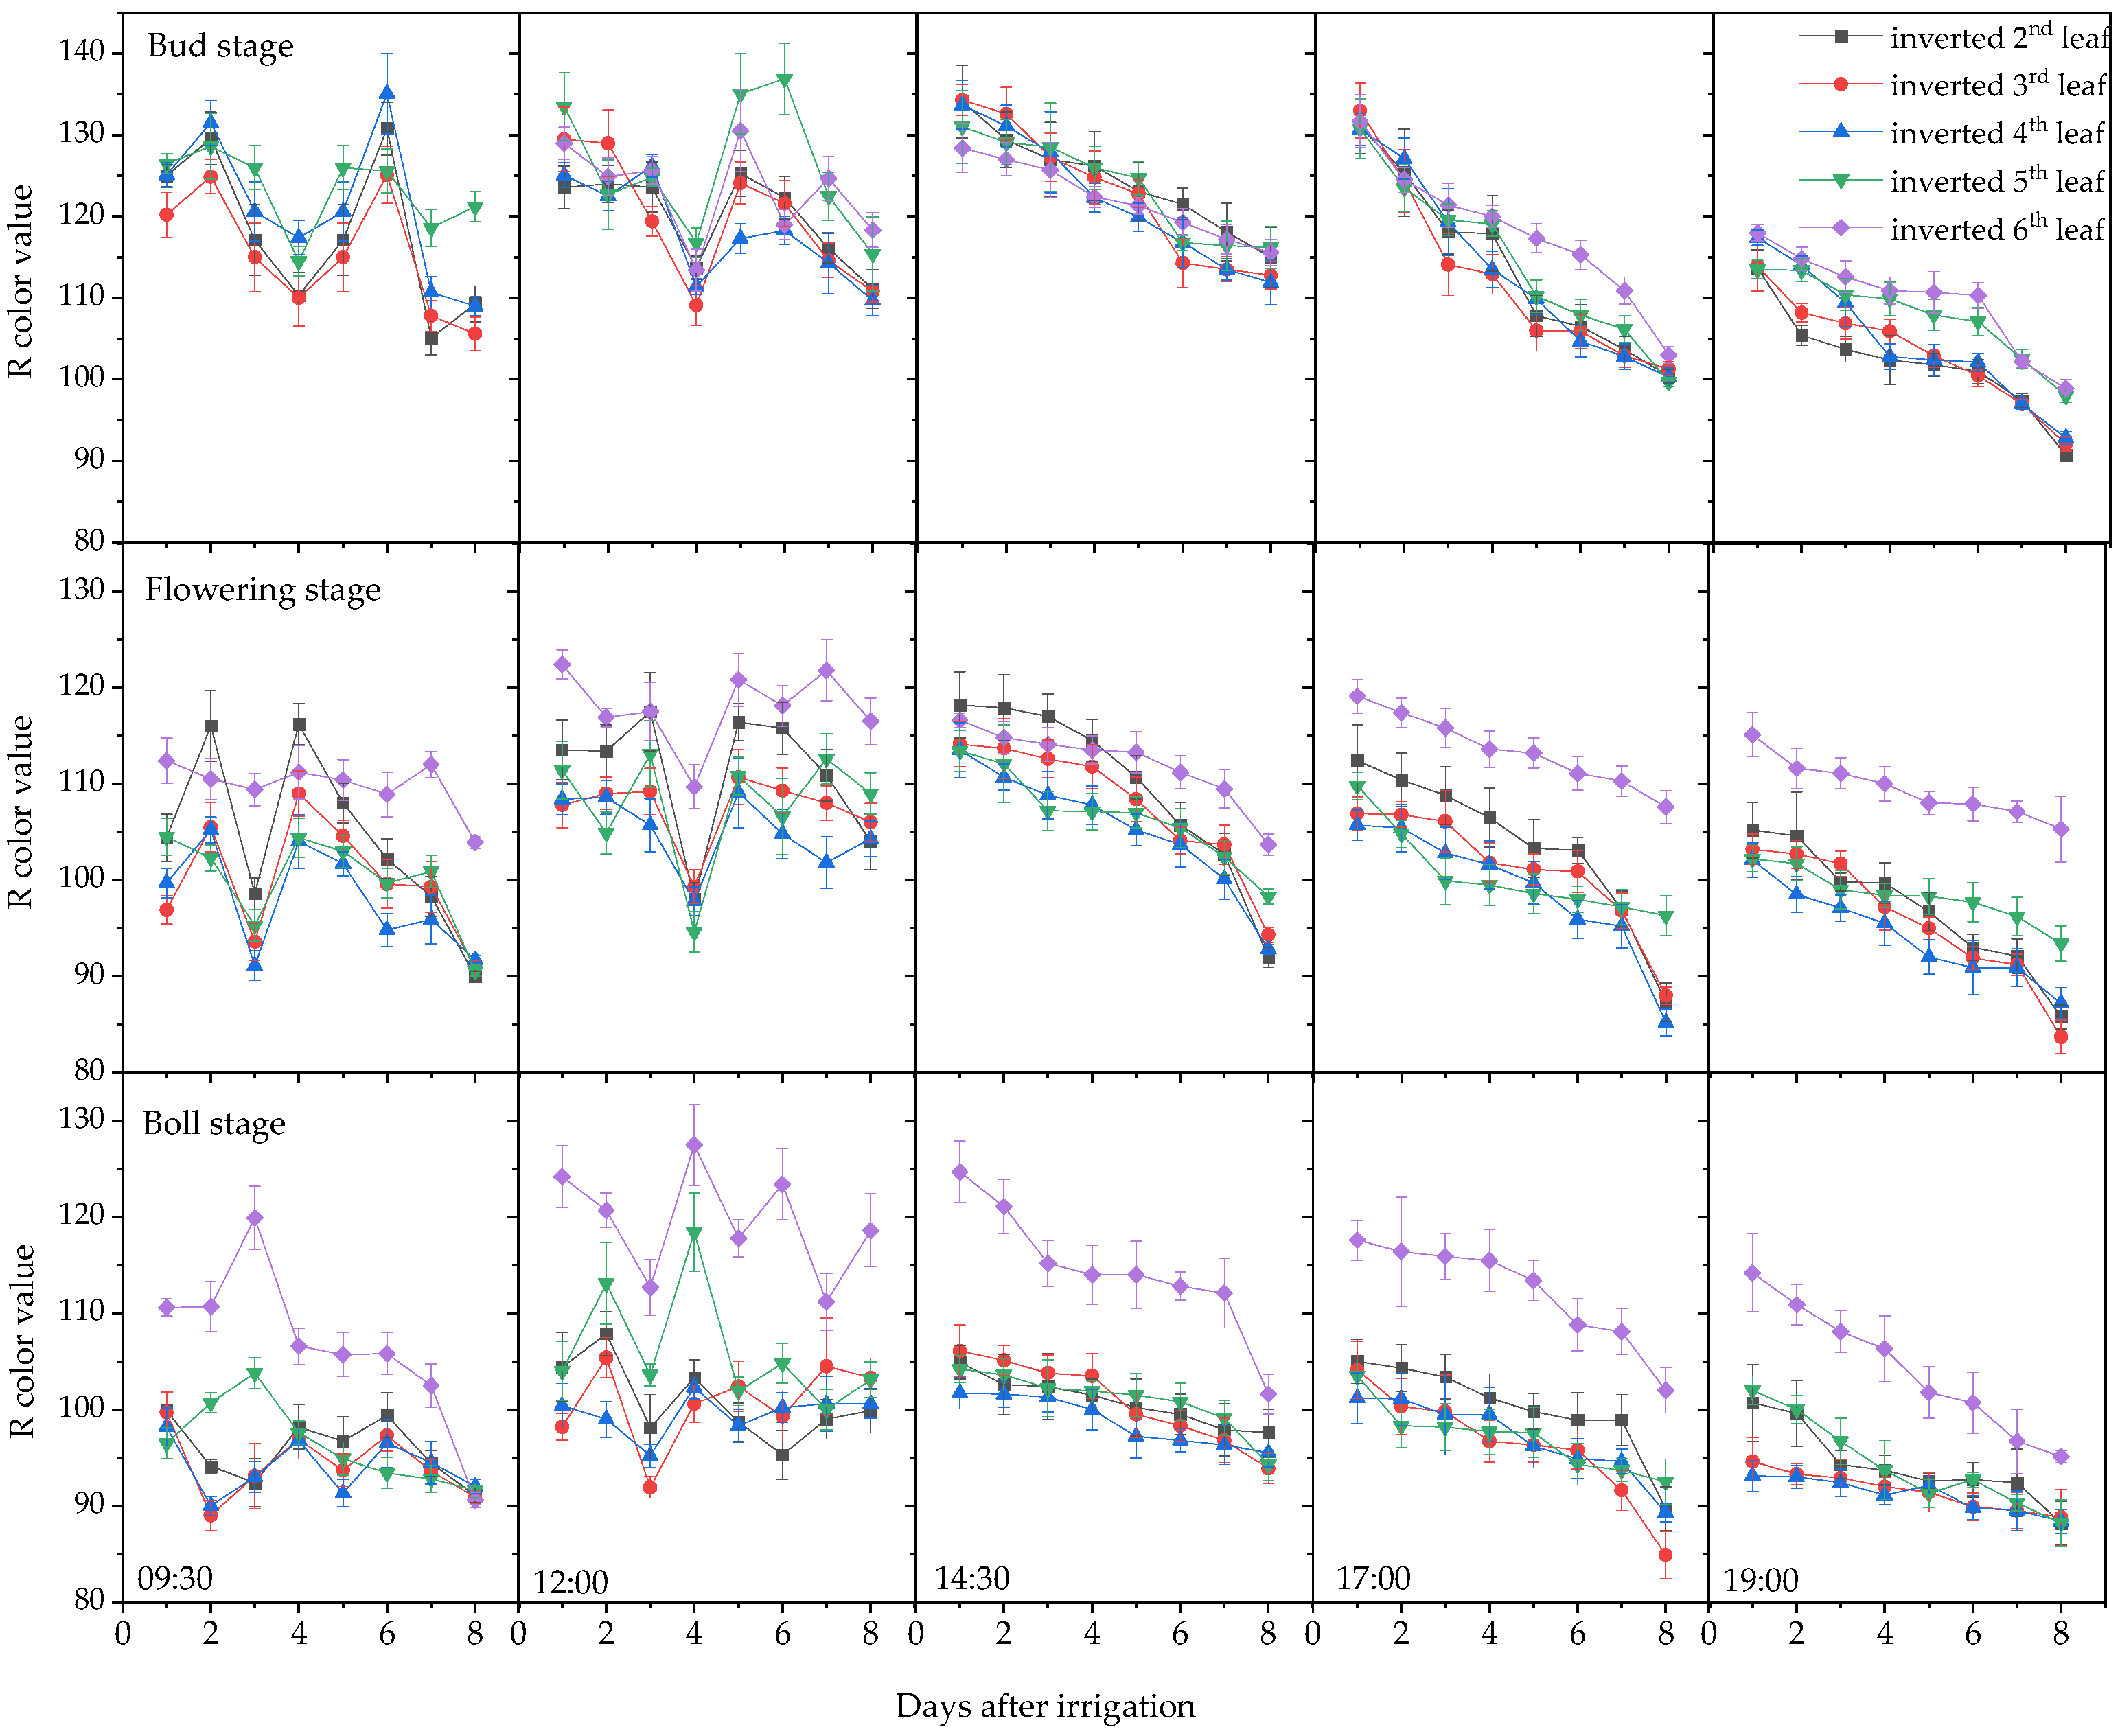
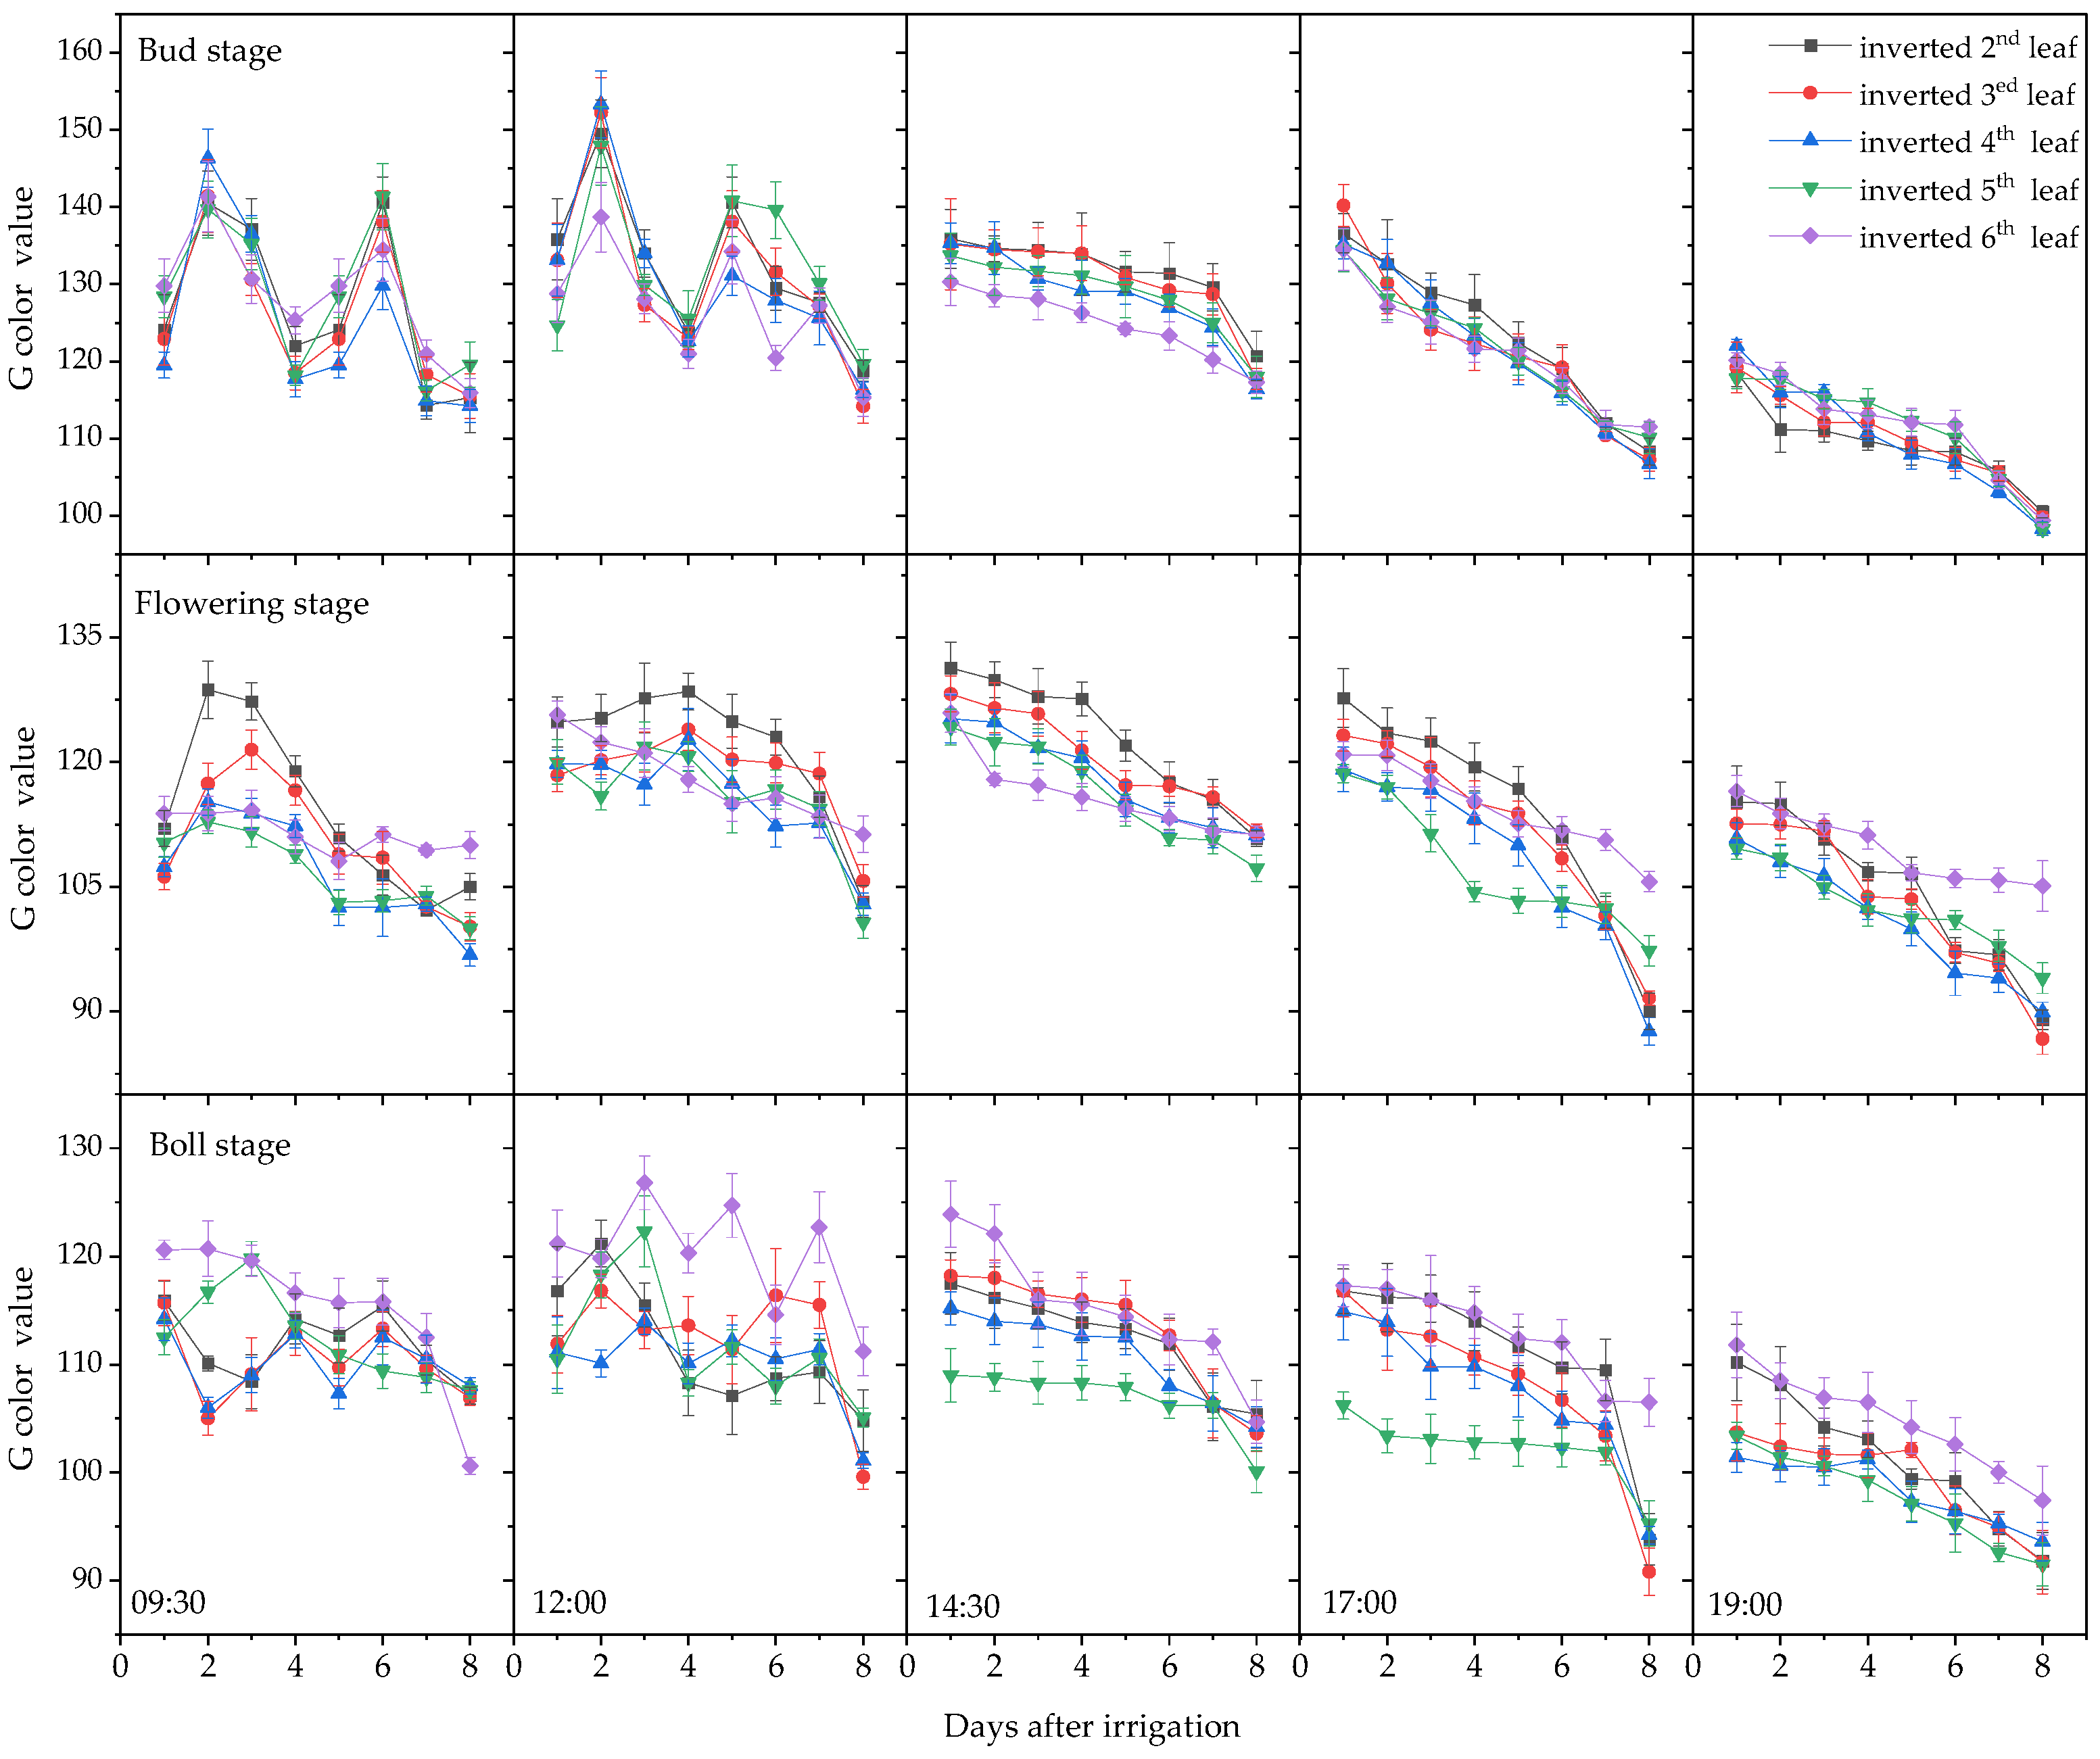
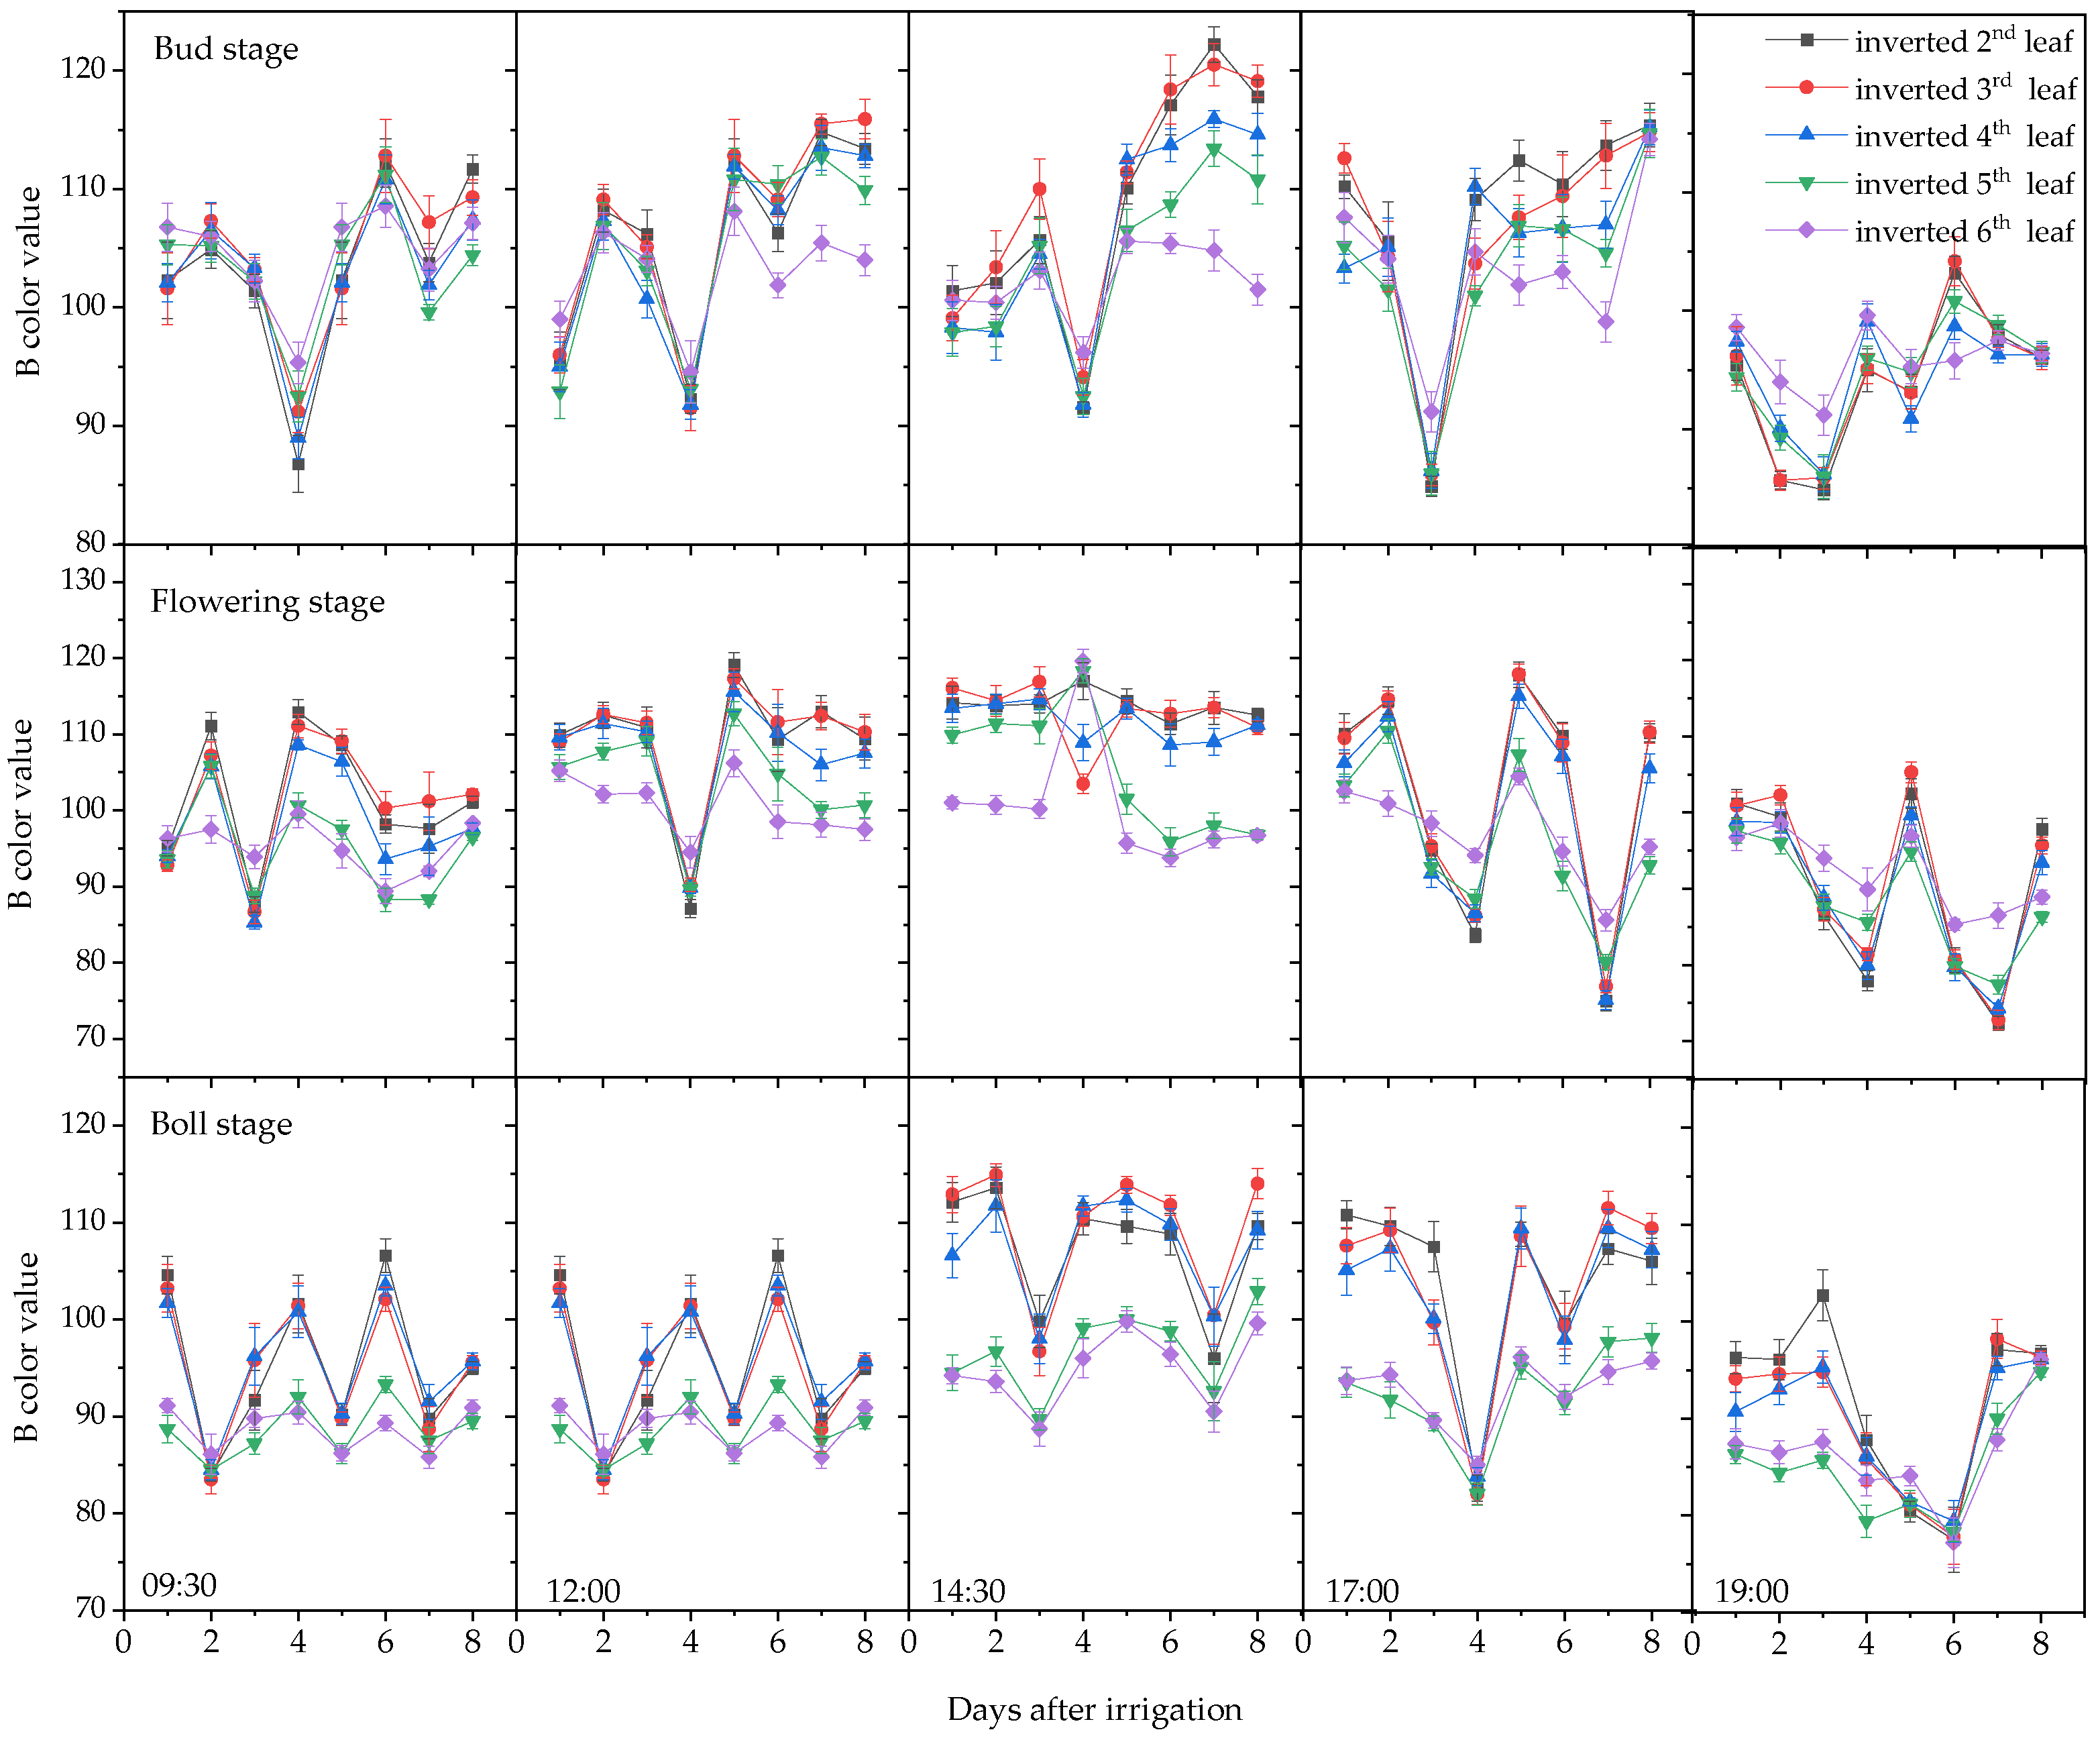
3.1.2. Variation in Leaf RGB Values

The leaf R color values from 09:30 to 14:30 fluctuated considerably over time following irrigation and did not exhibit a clear trend. However, the leaf R color values from 14:30 to 21:00 demonstrated a gradual decline over time after irrigation. All five functional leaves displayed similar patterns of change across the three growth stages (Figure 4).
The R and G color values from 09:30 to 14:30 showed large fluctuations after irrigation, while those from 14:30 to 21:00 showed a gradual downward trend over time (Figure 5). A similar trend was observed at the bud, flowering, and boll stages.
The B color value of different functional leaves from 9:30 to 21:00 showed large fluctuations over time after irrigation and did not show an obvious change trend (Figure 6).

3.1.3. Correlation Analysis Between Leaf RGB Values and Plant Water Content

The correlation analysis indicated that there was no significant correlation between plant water content and the leaf R and G color values from 09:30 to 14:30 (except for the third and fourth leaves during the boll stage). However, a significant positive relationship between plant water content and the R and G color values was observed from 14:30 to 21:00, with correlation coefficients ranging from 0.71 to 0.90 (except for the R color of the second leaf at 19:00 during the bud stage). Therefore, it is more appropriate to use the leaf R color value to diagnose plant water content during the period from 14:30 to 21:00 (see Table 1 and Table 2).
There was no significant correlation between the plant water content and leaf B color values from 09:30 to 21:30. Therefore, the leaf B color value should not be used as an indicator for diagnosing cotton water content (see Table 3).

3.1.4. Linear Regression of Leaf Color Values and Plant Water Content

Based on the results of the correlation analysis and the convenience of observation, cotton inverted third and fourth leaves were selected, and their R and G color values during the period from 14:30 to 17:00 were analyzed by linear regression with the plant water content. The univariate linear regression model between the leaf R or G color value and plant water content is significant, with the determination coefficients between 0.53 and 0.77 (Table 4). The bivariate linear regression model between the leaf R and G color values and plant water content is significant, with the determination coefficients between 0.78 and 0.89 (Table 5). Therefore, the R and G color values of inverted third and fourth leaves between 14:30 and 17:00 can be selected to construct a binary linear regression model of plant water content to diagnose the water status of the cotton.

3.2. Effects of Different Water Thresholds on Cotton Growth

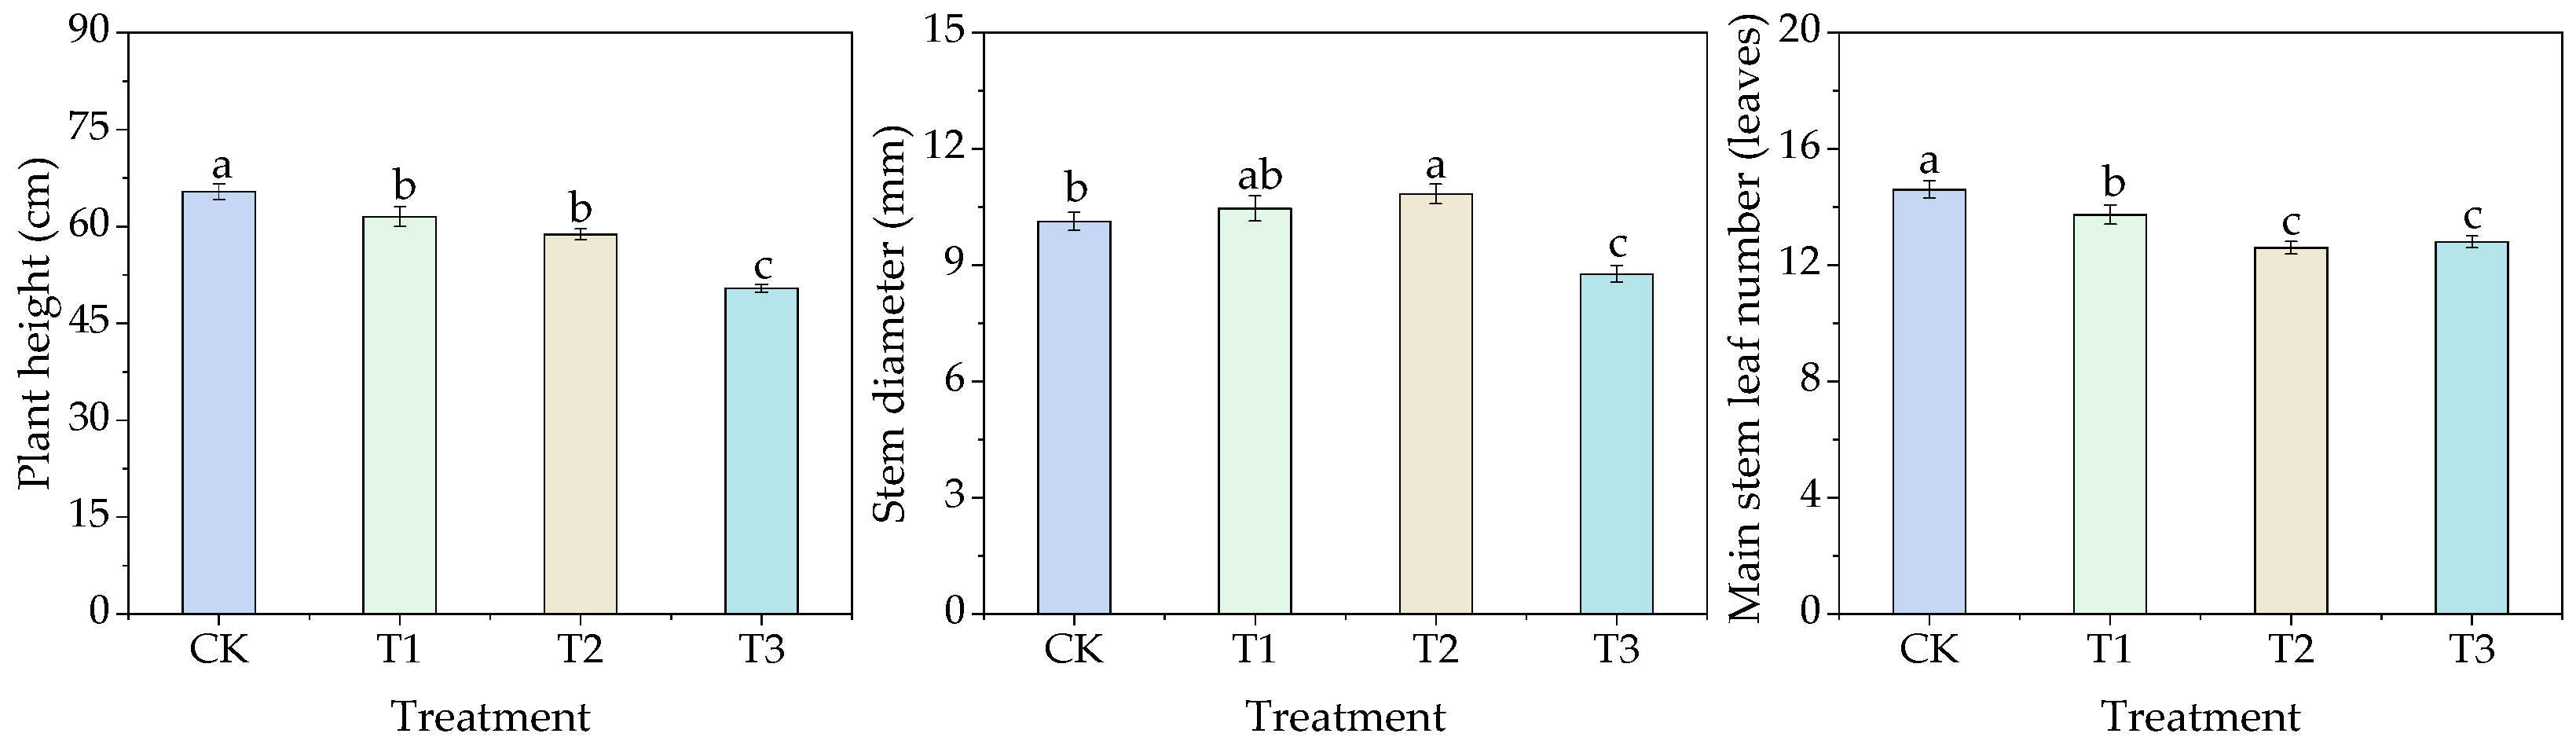
3.2.1. Effects of Different Water Thresholds on Cotton Agronomic Traits

Irrigation was conducted after each treatment reached the water threshold. Figure 7 shows the growth status of cotton under different irrigation thresholds. The plant heights of treatments T1, T2, and T3 were significantly reduced compared with that of CK by 5.9%, 10.1%, and 22.9%, respectively. The stem diameters of T1 and T2 were increased compared with that of CK, among which the increase in T1 was not significantly different from that of CK, while T2 showed a significant increase of 7%. The stem diameter of T3 was significantly lower than that of CK, decreasing by 13.4%. In the investigation of the number of main stem leaves, the formation of main stem leaves in treatments T1, T2, and T3 was significantly reduced compared with that of CK, decreasing by 5.9%, 12.9%, and 13.7%, respectively.
Figure 8 illustrates the changes in total boll formation, the number of retained bolls, and boll abscission rates of cotton under different irrigation thresholds. There were no significant differences in total boll formation and the number of retained bolls between T1 and CK treatments. However, compared with CK, treatments T2 and T3 showed significant reductions in total boll formation by 23.7% and 29.2% and in the number of retained bolls by 28.8% and 39.7%, respectively. Throughout the entire growth period, the boll abscission rates showed no significant differences among treatments, ranging from 79.65% to 80.99%.

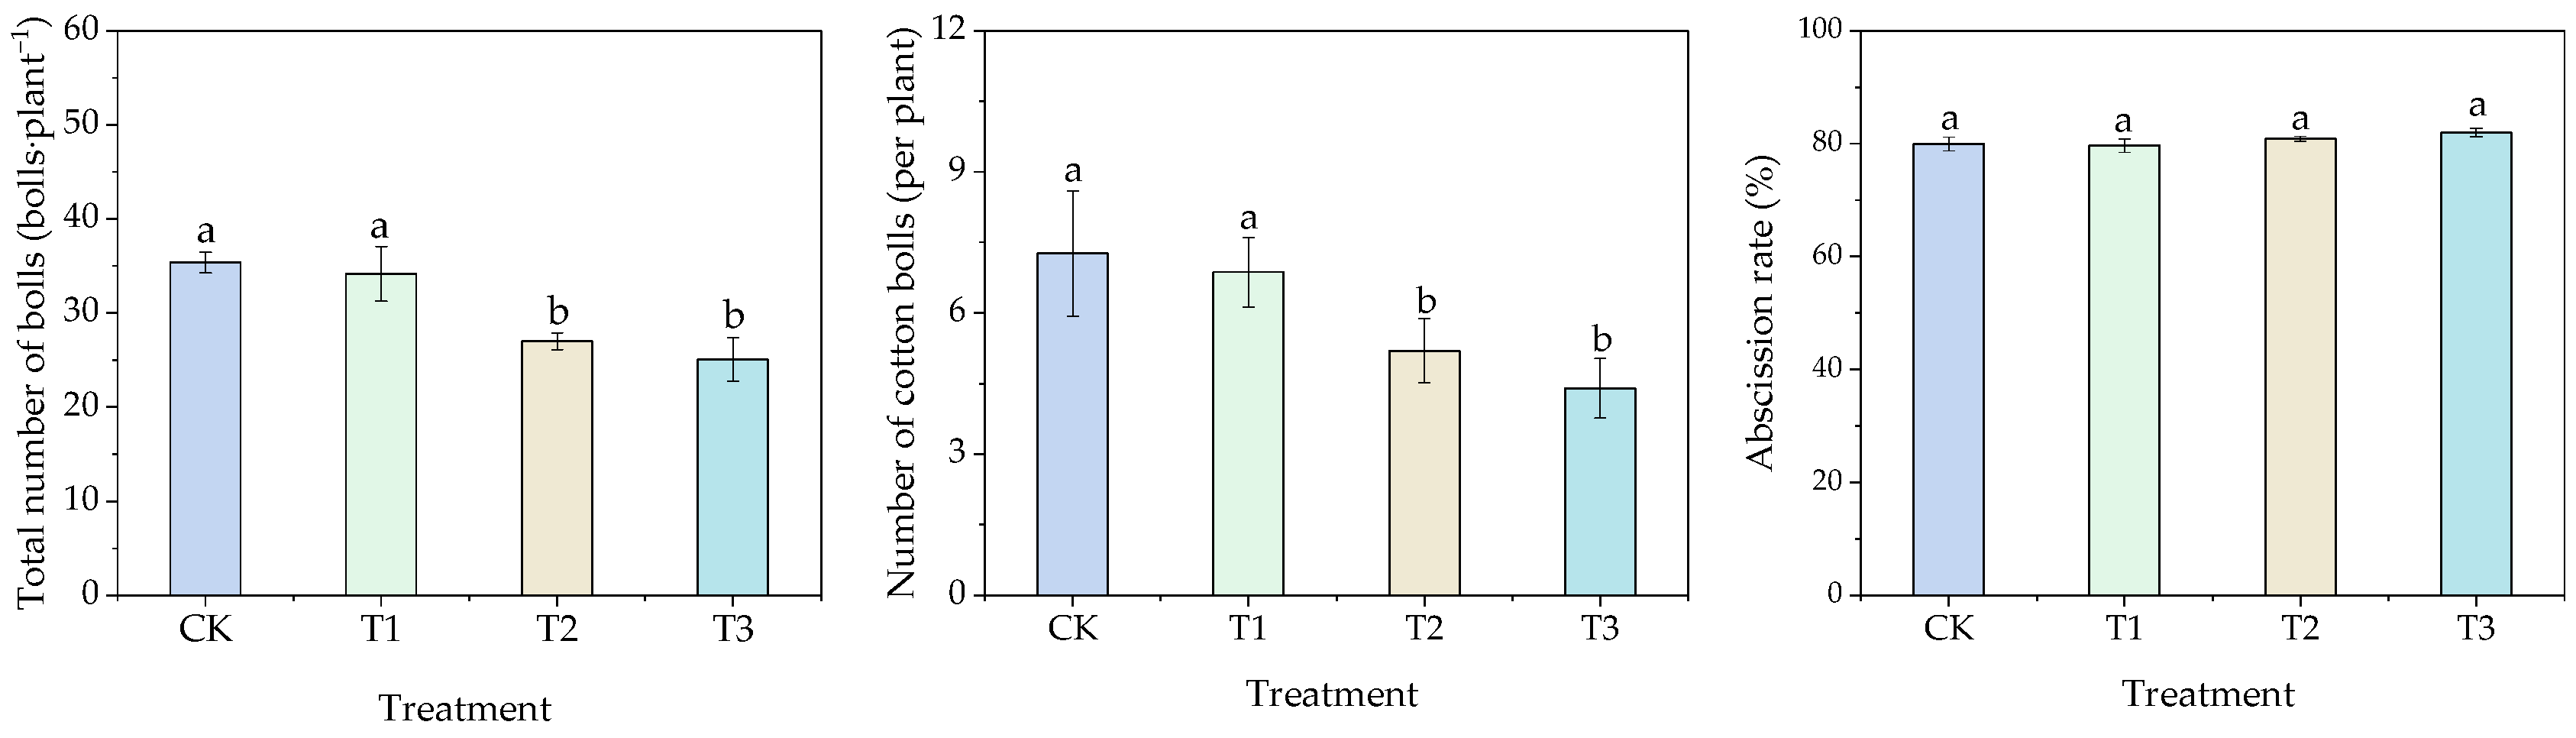
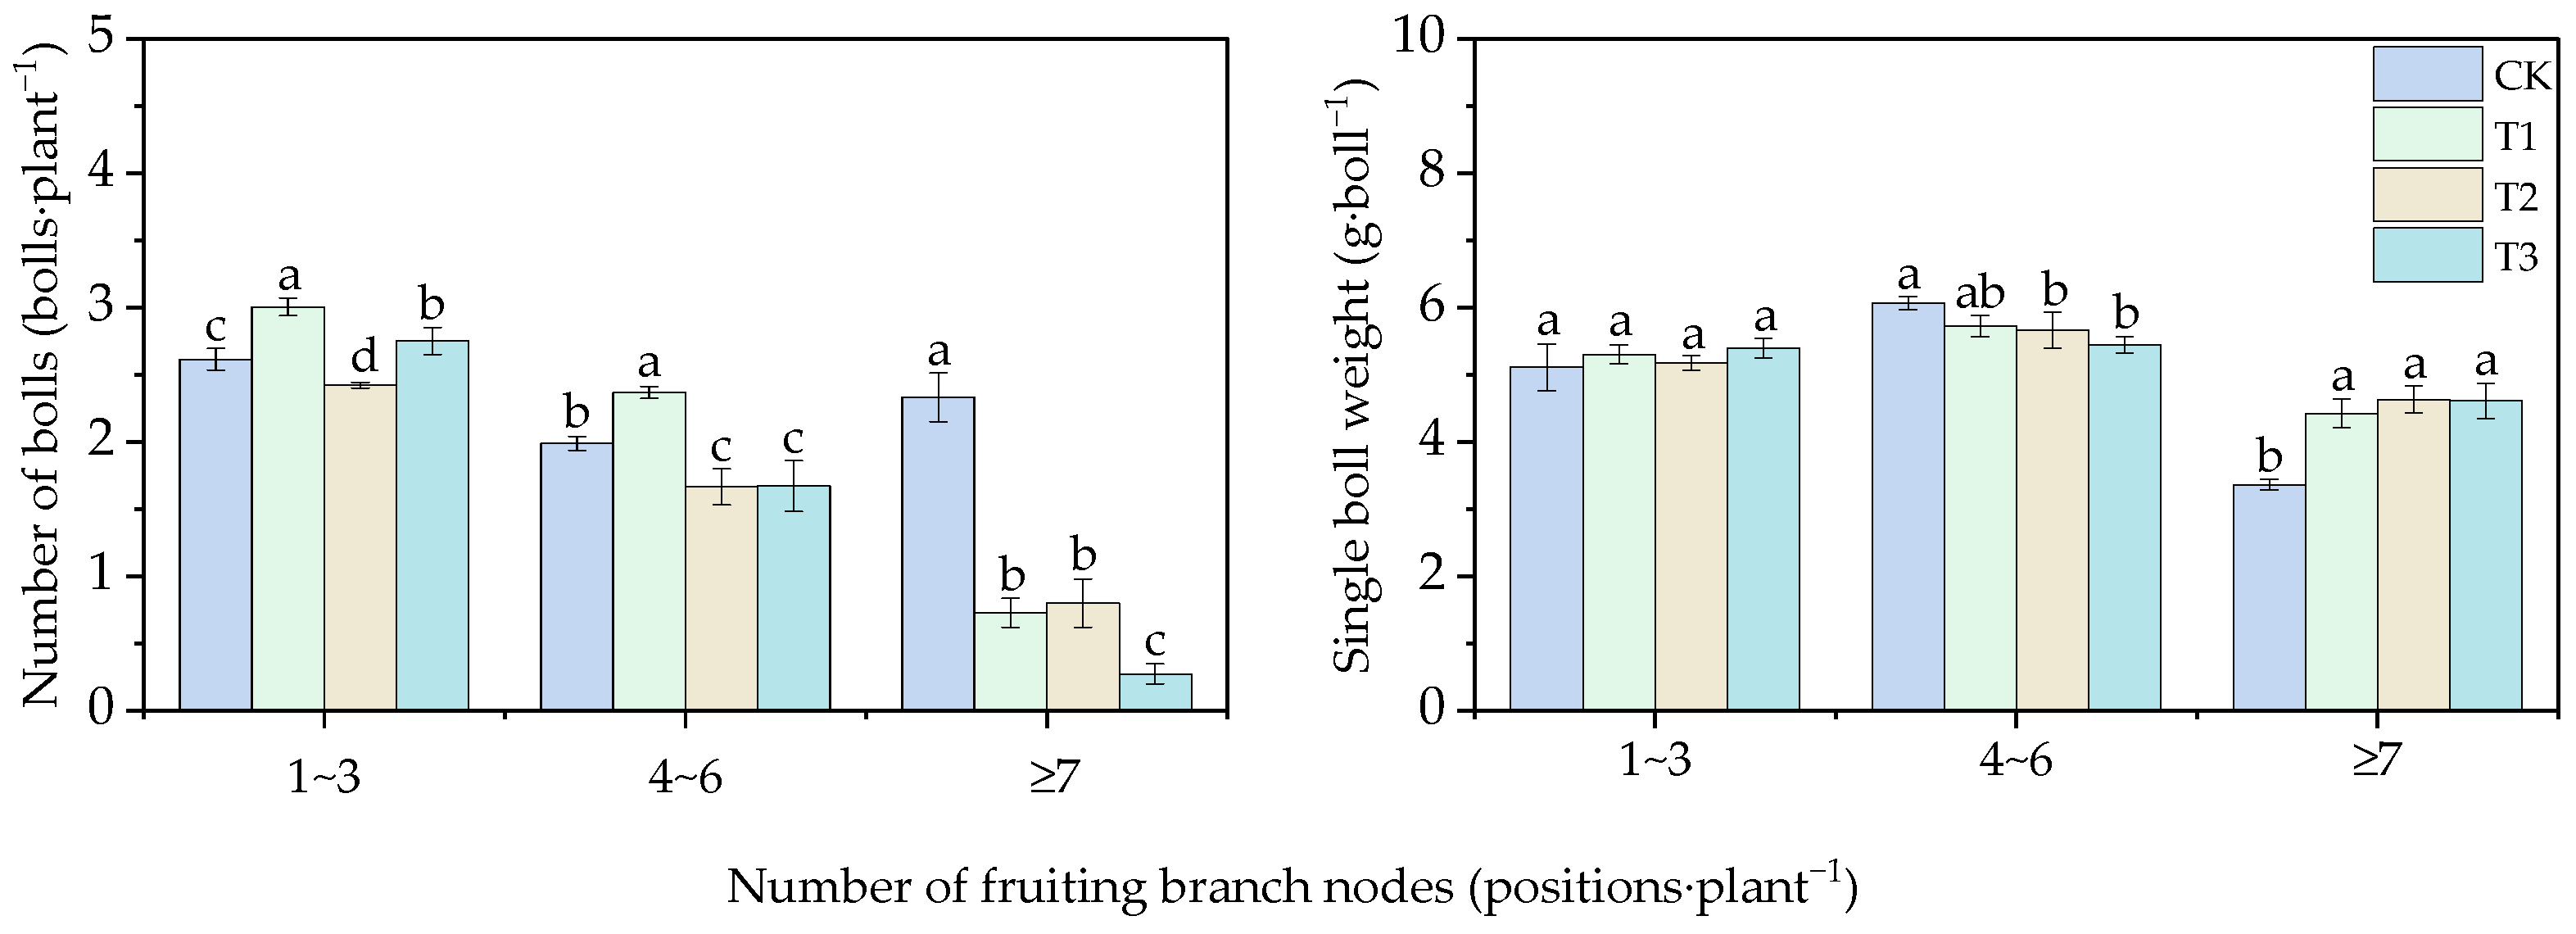
3.2.2. Effects of Different Water Thresholds on Boll Number and Individual Boll Weight in Cotton

Different irrigation thresholds had significant effects on both the number of bolls and individual boll weight. Figure 9 shows the distribution of boll numbers and individual boll weights at different fruiting branch positions. For the first to third fruiting branches, the boll numbers among the four treatments followed the order T1 > T3 > CK > T2. The boll numbers in T1 and T3 were significantly higher than those in CK, with increases of 14.9% and 5.2%, respectively, while T2 showed a significant decrease of 7.3% compared to CK. For the fourth to sixth fruiting branches, the boll number in T1 was significantly higher than that in CK by 19.1%. In contrast, the boll numbers in T2 and T3 were significantly lower than those in CK, with decreases of 15.9% and 16.2%, respectively. For the fruiting branches above the seventh position, the boll number under CK was significantly higher than those under T1, T2, and T3, being 3.2 times, 2.9 times, and 8.5 times higher, respectively. Regarding individual boll weight, no differences were observed among treatments for the first to third fruiting branches. For the fourth to sixth fruiting branches, T1 showed no difference compared to CK, while T2 and T3 showed significant decreases of 6.6% and 10.1%, respectively. For the fruiting branches above the seventh position, the individual boll weights of T1, T2, and T3 were significantly higher than that of CK by 31.5%, 37.6%, and 37.1%, respectively.

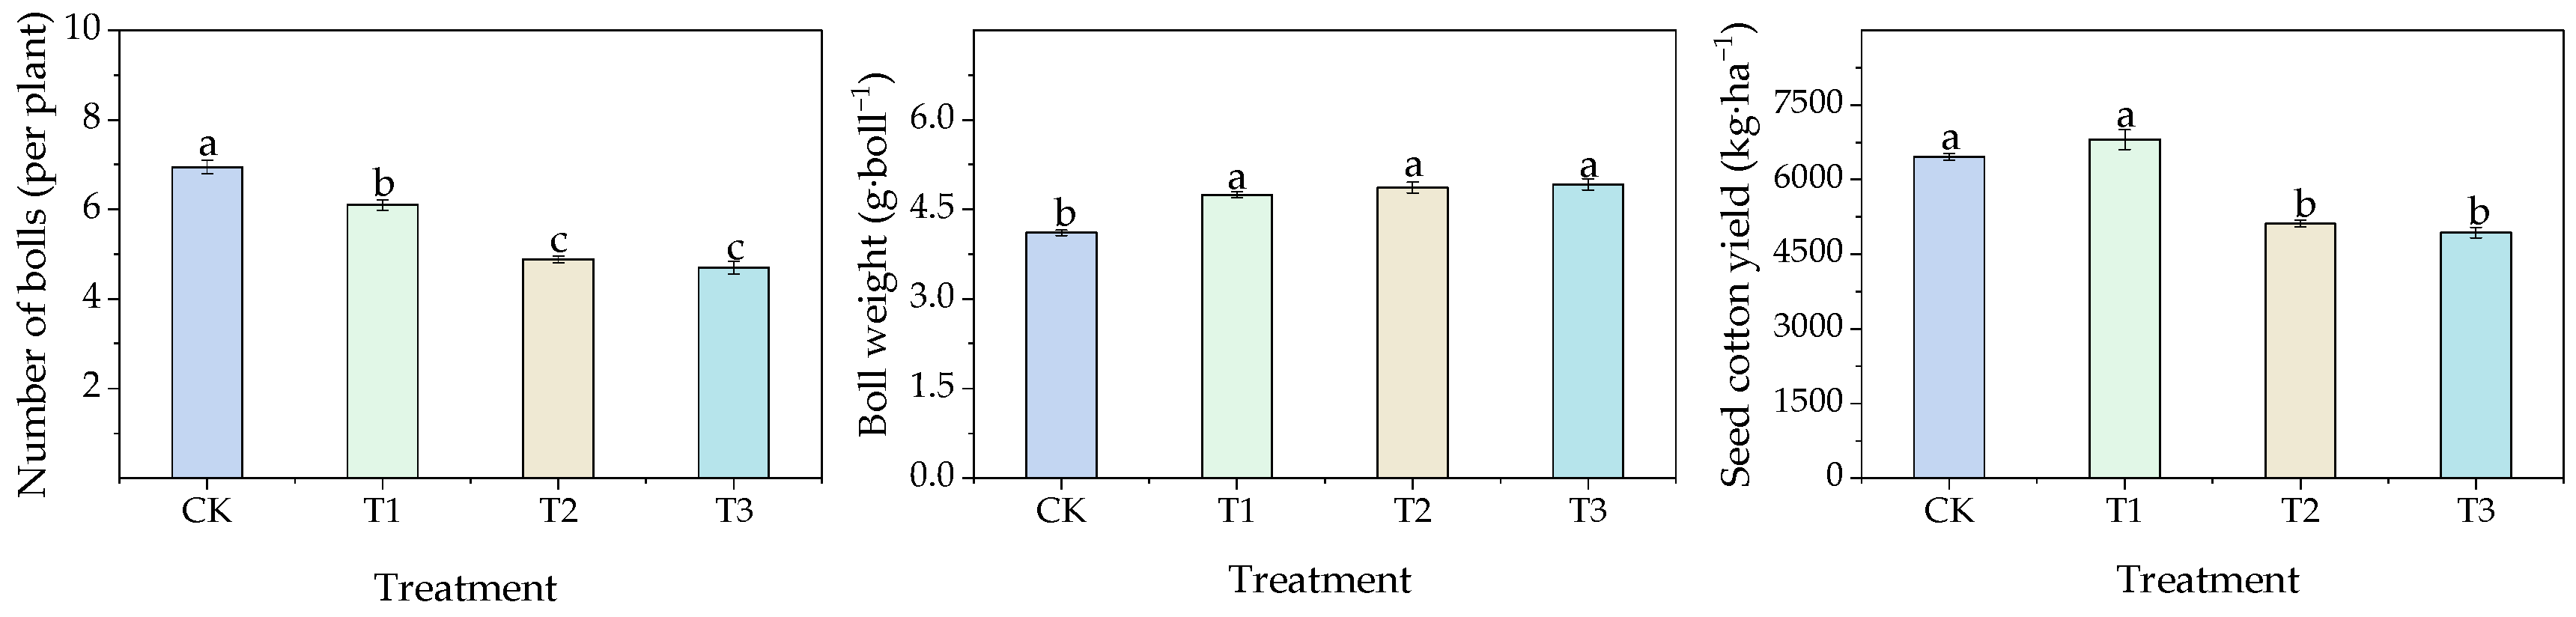
3.2.3. Effects of Different Water Thresholds on Cotton Yield and Its Components

Different water thresholds significantly affected cotton yield and its components. Figure 10 illustrates the cotton yield and its components under different treatments. The number of bolls per plant in treatments T1, T2, and T3 was significantly lower compared to CK, decreasing by 12.2%, 29.6%, and 32.3%, respectively. According to the individual boll weight survey, treatments T1, T2, and T3 had significantly higher individual boll weights compared to CK, with increases of 15.6%, 18.4%, and 19.8%, respectively. The seed cotton yield results showed no significant difference between T1 and CK, whereas T2 and T3 had significantly lower seed cotton yields compared to CK, decreasing by 20.9% and 23.7%, respectively.

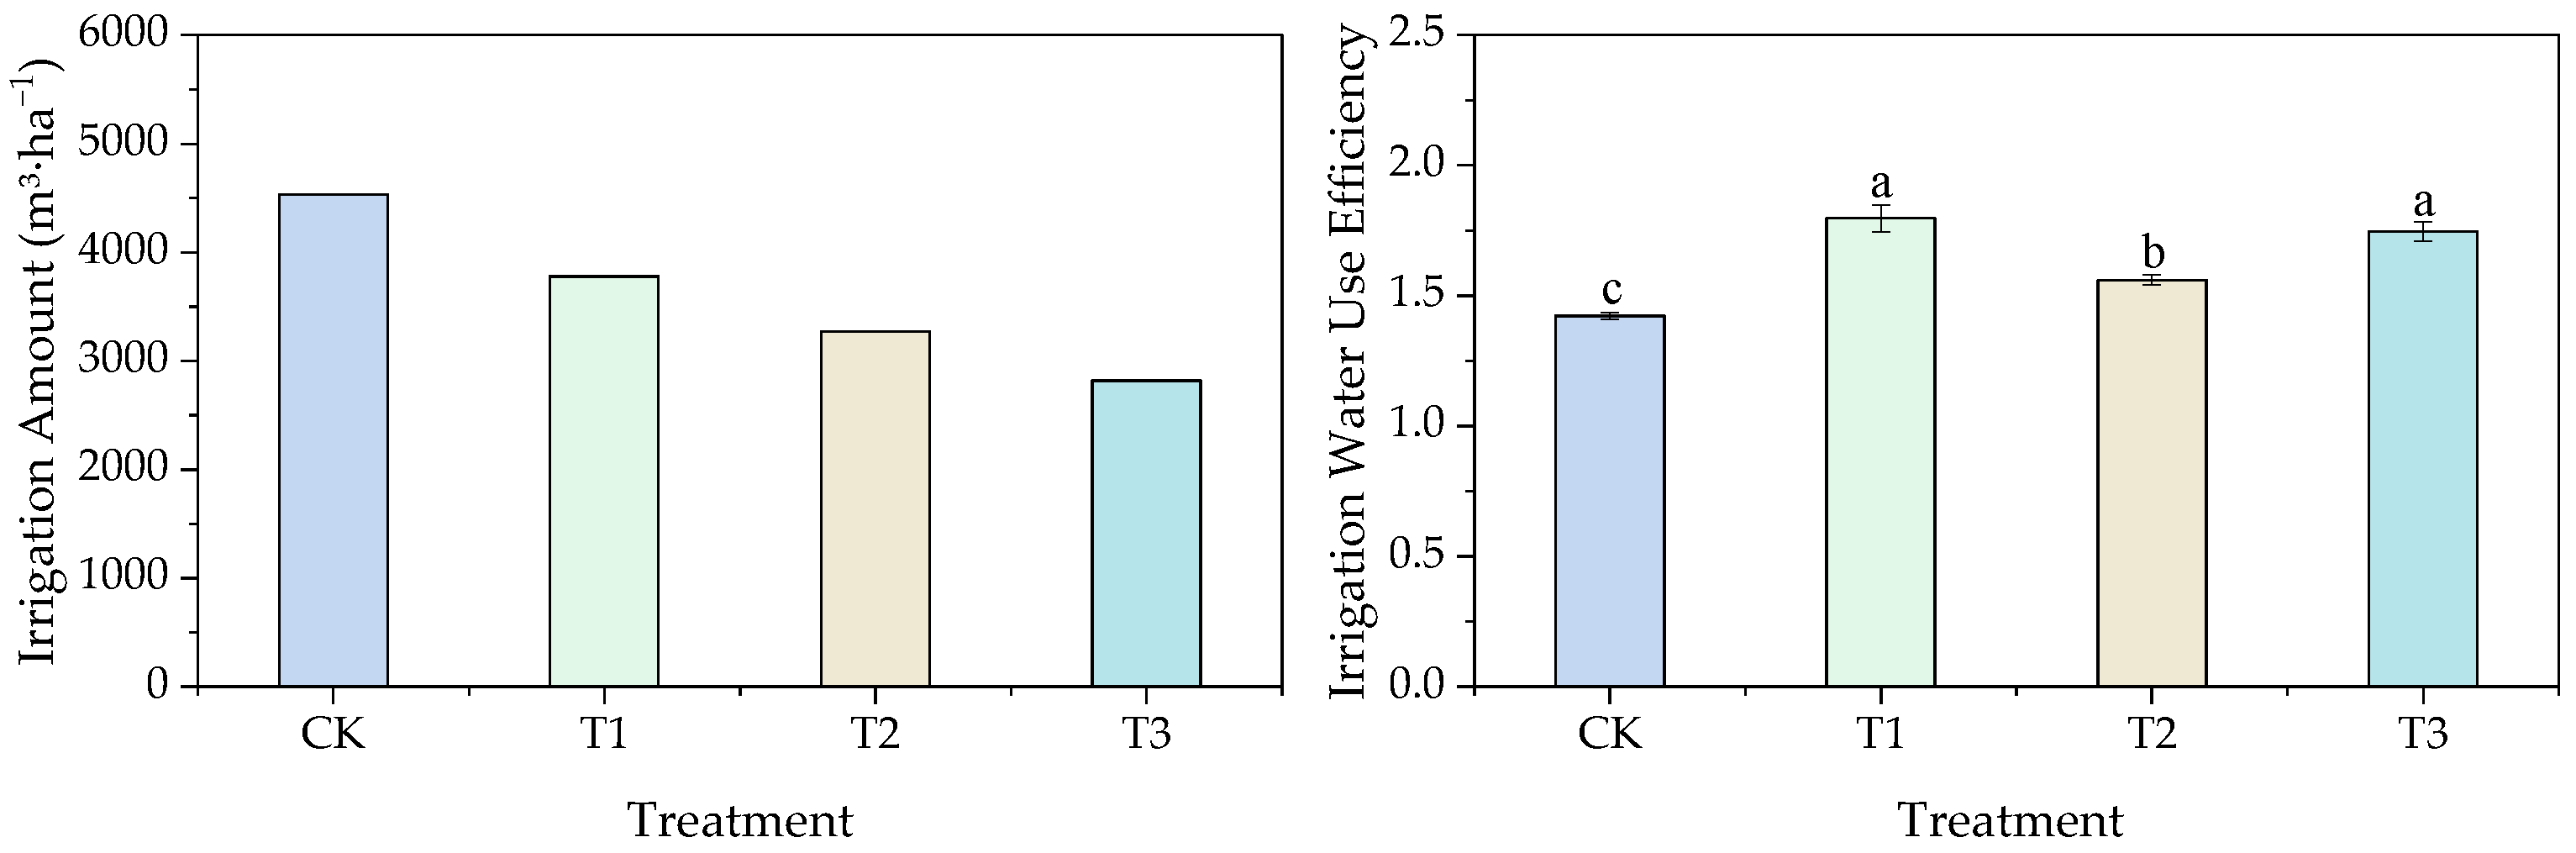
3.2.4. Effects of Different Water Thresholds on Cotton Water Application and Yield

Significant differences were observed in water application and Irrigation Water Use Efficiency across different water thresholds during the entire growth period of cotton. Figure 11 illustrates the water application and Irrigation Water Use Efficiency for each treatment. The water application amounts in treatments T1, T2, and T3 were significantly lower compared to CK, decreasing by 16.6%, 27.8%, and 37.7%, respectively. Meanwhile, the Irrigation Water Use Efficiency of these treatments was significantly higher than that of CK, with increases of 26.6%, 9.6%, and 22.7%, respectively.

4. Discussion

Plant water content changes due to variations in daily light and temperature. Results from the 2023 experiment showed that cotton plant water content shows a trend of “first decreasing and then slowly increasing” during the day, with the lowest values observed between 14:30 and 17:00. This is because the light is intense and the temperature is high between 14:30 and 17:00, which would cause stronger plant transpiration and water loss, resulting in plant drought stress.
The cotton leaf color changed with the plant’s moisture status. Results from the 2023 experiment showed that the leaf R, G, and B color values in the 09:30–14:30 showed no significant trend over time after irrigation. In the morning of the day, plant transpiration is weak and drought stress is not obvious, resulting in no significant trend in leaf color over time after irrigation. However, during the time period between 14:30 and 21:00, the leaf R and G color values showed a decreasing trend over time after irrigation. This may be because the cotton plants had sufficient water after irrigation, and the leaf cells absorbed water and expanded, which caused the chlorophyll content per unit leaf volume to be lower. The lower chlorophyll content per unit leaf volume makes the absorption of red and green light by the leaves per unit area weaker, and the reflection is stronger [25,26]. Over time after irrigation, the plant water content decreased and the leaf cells shrunk, or the increase in chlorophyll content surpassed the leaf cell division and growth [27,28], causing the chlorophyll content per unit leaf volume to increase relatively, the absorption of red and green light increased, and the reflection decreased [29,30,31]. Hence, the leaf’s red and green color showed a significant downward trend [9,32]. However, the leaf B value did not show a significant trend in change, which might be because the absorption of blue light by the leaf is not only affected by chlorophyll a and b but also by carotenoids, so it did not show a significant trend of change (Figure 12).
A correlation analysis was performed between the plant water content and the RGB color values of different functional leaves at different times of the day. Results from the 2023 experiment showed that during the period from 14:30 to 17:00, there was a significant positive correlation between the plant water content and the R and G color values of the third to sixth leaves. However, during the periods from 09:30 to 14:00 and 17:00 to 21:00, the correlation was not significant or weakened. This may be because, in the early morning and evening time periods of the day, the plant is not obviously stressed by drought, and no obvious relationship is exhibited between the plant water content and the leaf R and G color values. In addition, there was no significant correlation between the plant water content and the leaf B color value, which might be caused by the interruption of carotenoids.
Based on the correlation analysis result and convenience of observation, we constructed a linear regression model for the plant water content and the R and G color values of inverted third and fourth leaves in the period of 14:30–17:00. The results showed that the univariate and bivariate regression models both reached a significant level, with the determination coefficients of the bivariate regression models being higher (0.78–0.89). Therefore, it is appropriate to build the plant water content model using the R and G color values of cotton’s inverted third and fourth leaves during the period from 14:30 to 17:00 to diagnose cotton moisture.
Cotton yield and Irrigation Water Use Efficiency (WUE) are significantly affected by different irrigation thresholds. The experimental results show that there was no significant difference in yield between CK and T1 treatments, while the yields of T2 and T3 treatments were severely reduced. The WUE of T1, T2, and T3 treatments were all higher than that of CK, indicating that reducing water supply can improve cotton’s WUE. Although there was no significant difference in yield between CK and T1 treatments, the mechanisms driving these yields were opposite. In the CK treatment, high boll numbers per plant and low individual boll weight contributed to seed cotton yield. Conversely, in the T1 treatment, relatively lower boll numbers per plant but higher individual boll weights resulted in high seed cotton yield. Both approaches achieved high yields through different driving factors. The reasons for these differences may be attributed to changes in the primary growth direction of cotton at different irrigation thresholds. In the CK treatment, with ample water, vegetative growth was vigorous during the early stages, which inhibited reproductive growth. However, field management practices such as topping suppressed vegetative growth and promoted reproductive growth, leading to a high number of bolls per plant. However, because the formation of bolls occurred relatively late, their maturity was insufficient, resulting in lower individual boll weights. This finding aligns with the research by Bian and Koudahe [33,34]. In contrast, the T1 treatment experienced a moderate water deficit compared to CK. Although vegetative growth was somewhat reduced, photosynthetic product synthesis remained adequate. Enhanced reproductive growth led to earlier boll formation and higher maturity, resulting in larger individual boll weights. Despite a relative reduction in boll numbers per plant, the increased individual boll weight compensated for this, achieving the highest seed cotton yield. This result is consistent with studies by Lin and Guedes [35,36]. For the T2 and T3 treatments, more severe water deficits greatly inhibited both the vegetative and reproductive growth of cotton. The total number of bolls formed and the final number of retained bolls per plant were significantly reduced. Although individual boll weight increased to some extent, it could not compensate for the substantial loss in boll count, ultimately leading to a significant decrease in yield. These results are consistent with the findings of Patil and Eid [37,38]. In summary, excessive irrigation reduces individual boll weight and thus affects yield. Severe water deficits, although increasing individual boll weight, reduce boll numbers, leading to a significant drop in yield. Therefore, optimal irrigation can balance vegetative and reproductive growth, thereby increasing yield. This conclusion is supported by studies from Ma and Bian [39].
Soil type significantly influences irrigation effectiveness, with each type presenting distinct characteristics that affect water management strategies. Clay soils exhibit exceptional water retention capacity but are susceptible to waterlogging, which compromises root respiration and plant health. In contrast, sandy soils provide excellent aeration but demonstrate poor water retention, resulting in excessive percolation that necessitates more frequent irrigation applications with higher volumes. Loam soils represent the optimal compromise, offering a balanced combination of water retention and aeration properties that create ideal conditions for robust plant growth. Water stress diagnosis through leaf color assessment, grounded in crop water requirement principles, serves as an effective tool for preventing water resource waste associated with excessive irrigation practices [40]. Nevertheless, this approach cannot entirely eliminate the variable effects that different soil types exert on irrigation water effectiveness, highlighting the need for soil-specific calibration. Leaf color-based plant water status diagnosis demonstrates considerable sensitivity to prevailing weather conditions, as meteorological parameters substantially influence plant transpiration dynamics. During overcast and rainy periods, elevated atmospheric humidity suppresses leaf transpiration, minimizing water loss from cotton plants. Under these circumstances, even when cotton experiences significant water stress, visual symptoms remain subdued and difficult to detect, thereby limiting the reliability of leaf color diagnosis for accurate water status assessment. Conversely, hot and sunny conditions intensify evapotranspiration from both soil surfaces and plant tissues, accelerating water depletion and causing cotton to display pronounced water stress symptoms characterized by intensified leaf coloration. These enhanced visual indicators facilitate precise water status diagnosis through systematic leaf color observation. Wind velocity emerges as another critical factor influencing plant transpiration rates [41,42]. Moderate wind speeds enhance water vapor dispersion around leaf surfaces, promoting increased transpiration and resulting in more pronounced leaf coloration changes that improve diagnostic accuracy [43]. Furthermore, genetic variability among cotton cultivars may produce divergent leaf color responses under identical plant water content conditions, raising questions about the universal applicability of current diagnostic models across different varieties. This variability underscores the necessity for comprehensive validation studies across multiple cotton cultivars. Future research endeavors should prioritize the integration of environmental factors as auxiliary variables, incorporating temperature, humidity, and wind speed parameters to refine existing models and enhance both the accuracy and broader applicability of leaf color-based plant water diagnosis systems. Through systematic investigation of diverse cotton varieties under varied environmental conditions, researchers can develop universally applicable predictive equations that reliably correlate cotton leaf color characteristics with plant water status. This comprehensive approach aims to optimize irrigation decision-making through refined leaf color water diagnosis methodology, ultimately advancing agricultural water conservation objectives while maintaining crop productivity and quality standards.
The leaf color-based plant water status diagnosis method demonstrates considerable feasibility for crops such as corn and soybeans, as these crops exhibit distinct leaf color changes under water stress conditions. However, different crops vary in their leaf characteristics, water requirements across growth stages, and environmental sensitivity, necessitating the establishment of independent color–water relationship models and diagnostic thresholds for each specific crop. Therefore, while this method holds significant potential for broader application, crop-specific experimental validation must be conducted to ensure the accuracy and practicality of this diagnostic approach.

5. Conclusions

During the bud, flowering, and boll stages of cotton growth, univariate (R or G color value vs. plant water content) and bivariate (R and G color values vs. plant water content) regression models were established using the R and G color values of the third and fourth top leaves (i.e., the third and fourth leaves counted from the apex) measured between 2:30 p.m. and 5:00 p.m. These models estimated plant water content based on the correlation between leaf color and moisture levels. Moreover, maintaining plant water content at 72% not only ensured high cotton yield but also enhanced Irrigation Water Use Efficiency, reducing irrigation water consumption by over 15%. By combining the leaf R-G color values with the 72% plant water content threshold, this method enables real-time, non-destructive, and rapid diagnosis of cotton water status, avoiding traditional, time-consuming, and destructive moisture measurement methods, reducing interference with the plants, and providing a scientific basis for irrigation scheduling in cotton fields. However, this method faces practical limitations, including soil type variations affecting irrigation effectiveness, weather conditions impacting diagnosis accuracy, and uncertain applicability across different cotton varieties. Comprehensive validation across multiple cultivars and environmental conditions is essential to develop universally applicable equations for optimal irrigation decision-making.

Author Contributions

B.M.: study design, methodology, data collection, writing—original draft, and visualization. L.W.: methodology, study design, data analysis, data interpretation, and visualization. J.C.: data collection, formal analysis, and writing—review and editing. B.C.: validation, writing—original draft, and visualization. J.W.: project administration, resource management, and supervision. K.Z.: supervision, project administration, funding acquisition, writing—original draft, and writing—review. X.L.: conceptualization, methodology, supervision, writing—original draft, and writing—review. The contributions of each author accurately reflect the specific work and contributions made by each researcher. All authors have read and agreed to the published version of the manuscript.

Funding

This research was funded by the Key Research and Development Project of Xinjiang Uygur Autonomous Region (2022B02020–2); the Science and Technology Major Project of Xinjiang Uygur Autonomous Region (2022A02003–2); and the Research on Core Key Technologies of Smart Agriculture in Arid Desert Oasis (2023B02014-3).

Data Availability Statement

Since this study has only achieved preliminary results and the experiment involves some core content of the supervisor’s personal research direction, the data from this study cannot be made publicly available. However, these data can be obtained from the corresponding author upon request.

Acknowledgments

The authors would like to express their sincere gratitude to the College of Resources and Environment at Xinjiang Agricultural University and the Institute of Western Agriculture at the Chinese Academy of Agricultural Sciences for their invaluable guidance and support.

Conflicts of Interest

The authors declare that they have no known competing financial interests or personal relationships that could have appeared to influence the work reported in this paper.

References

  1. Tlatlaa, J.S.; Tryphone, G.M.; Nassary, E.K. Unexplored Agronomic, Socioeconomic and Policy Domains for Sustainable Cotton Production on Small Landholdings: A Systematic Review. Front. Agron. 2023, 5, 1281043. [Google Scholar] [CrossRef]
  2. Chabi Simin Najib, D.; Fei, C.; Dilanchiev, A.; Romaric, S. Modeling the Impact of Cotton Production on Economic Development in Benin: A Technological Innovation Perspective. Front. Environ. Sci. 2022, 10, 926350. [Google Scholar] [CrossRef]
  3. OECD/FAO. OECD-FAO Agricultural Outlook 2023–2032; OECD Publ.: Paris, France, 2023. [Google Scholar] [CrossRef]
  4. National Bureau of Statistics of China. China Statistical Yearbook 2024; China Statistics Press: Beijing, China, 2024. Available online: https://www.stats.gov.cn/sj/ndsj/2024/indexch.htm (accessed on 27 April 2025).
  5. Shamim, N.; Asim, M.; Baker, T.; Awad, A.I. Efficient Approach for Anomaly Detection in IoT Using System Calls. Sensors 2023, 23, 652. [Google Scholar] [CrossRef]
  6. Qi, Q.; Yang, H.; Zhou, Q.; Han, X.; Jia, Z.; Jiang, Y.; Chen, Z.; Hou, L.; Mei, S. Performance of Soil Moisture Sensors at Different Salinity Levels: Comparative Analysis and Calibration. Sensors 2024, 24, 6323. [Google Scholar] [CrossRef]
  7. Quemada, C.; Pérez-Escudero, J.M.; Gonzalo, R.; Ederra, I.; Santesteban, L.G.; Torres, N.; Iriarte, J.C. Remote Sensing for Plant Water Content Monitoring: A Review. Remote Sens. 2021, 13, 2088. [Google Scholar] [CrossRef]
  8. Pagano, M.; Baldacci, L.; Ottomaniello, A.; de Dato, G.; Chianucci, F.; Masini, L.; Carelli, G.; Toncelli, A.; Storchi, P.; Tredicucci, A.; et al. THz Water Transmittance and Leaf Surface Area: An Effective Nondestructive Method for Determining Leaf Water Content. Sensors 2019, 19, 4838. [Google Scholar] [CrossRef]
  9. Moyankova, D.; Stoykova, P.; Veleva, P.; Christov, N.K.; Petrova, A.; Atanassova, S. An Aquaphotomics Approach for Investigation of Water-Stress-Induced Changes in Maize Plants. Sensors 2023, 23, 9678. [Google Scholar] [CrossRef]
  10. Thalheimer, M. A Leaf-Mounted Capacitance Sensor for Continuous Monitoring of Foliar Transpiration and Solar Irradiance as an Indicator of Plant Water Status. J. Agric. Eng. 2023, 54. [Google Scholar] [CrossRef]
  11. Hama, A.; Matsumoto, Y.; Matsuoka, N. Estimating Leaf Water Content Through Low-Cost LiDAR. Agronomy 2022, 12, 1183. [Google Scholar] [CrossRef]
  12. Li, Y.; Song, X.; Li, S.; Salter, W.T.; Barbour, M.M. The Role of Leaf Water Potential in the Temperature Response of Mesophyll Conductance. New Phytol. 2020, 225, 1193–1205. [Google Scholar] [CrossRef]
  13. Ahmad, U.; Alvino, A.; Marino, S. A Review of Crop Water Stress Assessment Using Remote Sensing. Remote Sens. 2021, 13, 4155. [Google Scholar] [CrossRef]
  14. Dong, H.; Dong, J.; Sun, S.; Bai, T.; Zhao, D.; Yin, Y.; Wang, Y. Crop Water Stress Detection Based on UAV Remote Sensing Systems. Agric. Water Manag. 2024, 303, 109059. [Google Scholar] [CrossRef]
  15. Lloret, J.; Sendra, S.; Garcia, L.; Jimenez, J.M. A Wireless Sensor Network Deployment for Soil Moisture Monitoring in Precision Agriculture. Sensors 2021, 21, 7243. [Google Scholar] [CrossRef]
  16. Le, M.T.; Pham, C.D.; Nguyen, T.P.T.; Nguyen, T.L.; Nguyen, Q.C.; Hoang, N.B.; Nghiem, L.D. Wireless Powered Moisture Sensors for Smart Agriculture and Pollution Prevention: Opportunities, Challenges, and Future Outlook. Curr. Pollut. Rep. 2023, 9, 646–659. [Google Scholar] [CrossRef]
  17. Özreçberoğlu, N.; Kahramanoğlu, İ. Mathematical Models for the Estimation of Leaf Chlorophyll Content Based on RGB Colours of Contact Imaging with Smartphones: A Pomegranate Example. Folia Hortic. 2020, 32, 57–67. [Google Scholar] [CrossRef]
  18. Yadav, S.P.; Ibaraki, Y.; Gupta, D. Estimation of the Chlorophyll Content of Micropropagated Potato Plants Using RGB-Based Image Analysis. Plant Cell Tissue Organ Cult. 2010, 100, 183–188. [Google Scholar] [CrossRef]
  19. Bodor-Pesti, P.; Taranyi, D.; Nyitrainé Sárdy, D.Á.; Le Phuong Nguyen, L.; Baranyai, L. Correlation of the Grapevine (Vitis vinifera L.) Leaf Chlorophyll Concentration with RGB Color Indices. Horticulturae 2023, 9, 899. [Google Scholar] [CrossRef]
  20. González-Espíndola, L.Á.; Pedroza-Sandoval, A.; Trejo-Calzada, R.; Jacobo-Salcedo, M.d.R.; de los Santos, G.G.; Quezada-Rivera, J.J. Relative Water Content, Chlorophyll Index, and Photosynthetic Pigments on Lotus corniculatus L. in Response to Water Deficit. Plants 2024, 13, 961. [Google Scholar] [CrossRef]
  21. Zhang, Y.; Ru, G.; Zhao, Z.; Wang, D. Hyperspectral Prediction Models of Chlorophyll Content in Paulownia Leaves Under Drought Stress. Sensors 2024, 24, 6309. [Google Scholar] [CrossRef] [PubMed]
  22. Wang, J.; Zhang, Y.; Guo, J.; Wei, C.; Han, D. Effects of Different Imaging Methods on Spectral Parameters of Cotton Canopy Characteristics. J. Shihezi Univ. (Nat. Sci.) 2006, 24, 397–400. [Google Scholar]
  23. Wang, J.; Wei, C.; Wang, X.; Zhu, Q.; Zhu, J.; Wang, J. Prediction of Cotton Chlorophyll Content Using Computer Vision Corrected by Gray Board. Trans. Chin. Soc. Agric. Eng. 2013, 29, 173. [Google Scholar]
  24. Qi, W.; Wang, H.; Xue, H.; Wang, Z.; Ma, X.; Wang, J.; Xiao, J. Effects of Irrigation Lower Limit on Photosynthetic Physiology and Yield of Cotton in Northern Xinjiang. Water Sav. Irrig. 2024, 12, 95–101+110. [Google Scholar] [CrossRef]
  25. Ma, L.; Zhang, Y.; Zhang, Y.; Wang, J.; Li, J.; Gao, Y.; Wang, X.; Wu, L. Rapid Nondestructive Detection of Chlorophyll Content in Muskmelon Leaves Under Different Light Quality Treatments. Agronomy 2022, 12, 3223. [Google Scholar] [CrossRef]
  26. Li, W.; Pan, K.; Huang, Y.; Fu, G.; Liu, W.; He, J.; Xiao, W.; Fu, Y.; Guo, J. Monitoring the Maize Canopy Chlorophyll Content Using Discrete Wavelet Transform Combined with RGB Feature Fusion. Agronomy 2025, 15, 212. [Google Scholar] [CrossRef]
  27. Yang, Y.; Nan, R.; Mi, T.; Song, Y.; Shi, F.; Liu, X.; Wang, Y.; Sun, F.; Xi, Y.; Zhang, C. Rapid and Nondestructive Evaluation of Wheat Chlorophyll Under Drought Stress Using Hyperspectral Imaging. Int. J. Mol. Sci. 2023, 24, 5825. [Google Scholar] [CrossRef]
  28. Yan, W.; Lu, Y.; Guo, L.; Liu, Y.; Li, M.; Zhang, B.; Zhang, L.; Qin, D.; Huo, J. Effects of Drought Stress on Photosynthesis and Chlorophyll Fluorescence in Blue Honeysuckle. Plants 2024, 13, 2115. [Google Scholar] [CrossRef]
  29. Ye, X.; Kitaya, M.; Abe, S.; Sheng, F.; Zhang, S. A New Small-Size Camera with Built-In Specific-Wavelength LED Lighting for Evaluating Chlorophyll Status of Fruit Trees. Sensors 2023, 23, 4636. [Google Scholar] [CrossRef]
  30. Cotrozzi, L.; Lorenzini, G.; Nali, C.; Pellegrini, E.; Saponaro, V.; Hoshika, Y.; Arab, L.; Rennenberg, H.; Paoletti, E. Hyperspectral Reflectance of Light-Adapted Leaves Can Predict Both Dark- and Light-Adapted Chl Fluorescence Parameters, and the Effects of Chronic Ozone Exposure on Date Palm (Phoenix dactylifera). Int. J. Mol. Sci. 2020, 21, 6441. [Google Scholar] [CrossRef]
  31. Park, B.; Wi, S.; Chung, H.; Lee, H. Chlorophyll Fluorescence Imaging for Environmental Stress Diagnosis in Crops. Sensors 2024, 24, 1442. [Google Scholar] [CrossRef] [PubMed]
  32. Abid, M.; Ali, S.; Qi, L.K.; Zahoor, R.; Tian, Z.; Jiang, D.; Dai, T. Physiological and Biochemical Changes During Drought and Recovery Periods at Tillering and Jointing Stages in Wheat (Triticum aestivum L.). Sci. Rep. 2018, 8, 4615. [Google Scholar] [CrossRef]
  33. Bian, M.; Lv, T.; Li, W.; Chen, C.; Zhang, X.; Wang, M. Effect of Irrigation Amount on Cotton Growth and Optimization of Irrigation Regime Using AquaCrop in Southern Xinjiang. Agronomy 2025, 15, 1101. [Google Scholar] [CrossRef]
  34. Koudahe, K.; Sheshukov, A.Y.; Aguilar, J.; Djaman, K. Irrigation-Water Management and Productivity of Cotton: A Review. Sustainability 2021, 13, 10070. [Google Scholar] [CrossRef]
  35. Lin, M.; Wang, L.; Lv, G.; Gao, C.; Zhao, Y.; Li, X.; He, L.; Sun, W. Deficit Irrigation Effects on Cotton Growth Cycle and Preliminary Optimization of Irrigation Strategies in Arid Environment. Plants 2024, 13, 1403. [Google Scholar] [CrossRef]
  36. Guedes, W.A.; Nobre, R.G.; Soares, L.A.d.A.; de Lima, G.S.; Gheyi, H.R.; Fernandes, P.D.; Ferreira, A.P.N.; da Silva, A.A.R.; de Azevedo, C.A.V.; Silva, D.V.; et al. Irrigation Strategies with Controlled Water Deficit in Two Production Cycles of Cotton. Plants 2023, 12, 2892. [Google Scholar] [CrossRef]
  37. Patil, A.M.; Pawar, B.D.; Wagh, S.G.; Shinde, H.; Shelake, R.M.; Markad, N.R.; Bhute, N.K.; Červený, J.; Wagh, R.S. Abiotic Stress in Cotton: Insights into Plant Responses and Biotechnological Solutions. Agriculture 2024, 14, 1638. [Google Scholar] [CrossRef]
  38. Eid, M.A.M.; El-hady, M.A.A.; Abdelkader, M.A.; Abd-Elkrem, Y.M.; El-Gabry, Y.A.; El-Temsah, M.E.; El-Areed, S.R.M.; Rady, M.M.; Alamer, K.H.; Alqubaie, A.I.; et al. Response in Physiological Traits and Antioxidant Capacity of Two Cotton Cultivars Under Water Limitations. Agronomy 2022, 12, 803. [Google Scholar] [CrossRef]
  39. Ma, H.; Ge, C.; Liu, R.; Zhang, S.; Liu, S.; Shen, Q.; Chen, J.; Wan, S.; Pang, C. Effects of Different Irrigation Water Volumes with 1,1-Dimethyl-Piperidinium Chloride (DPC) on Cotton Growth and Yield. Agronomy 2024, 14, 1656. [Google Scholar] [CrossRef]
  40. Mahler, E. Innovations in Clay-Based Irrigation Technologies—A Systematic Review. Sustainability 2024, 16, 7029. [Google Scholar] [CrossRef]
  41. Devi, M.J.; Reddy, V.R. Transpiration Response of Cotton to Vapor Pressure Deficit and Its Relationship with Stomatal Traits. Front. Plant Sci. 2018, 9, 1572. [Google Scholar] [CrossRef]
  42. Zhu, Y.; Cheng, Z.; Feng, K.; Chen, Z.; Cao, C.; Huang, J.; Ye, H.; Gao, Y. Influencing factors for transpiration rate: A numerical simulation of an individual leaf system. Therm. Sci. Eng. Prog. 2022, 27, 101110. [Google Scholar] [CrossRef]
  43. Huang, C.W.; Chu, C.R.; Hsieh, C.I.; Palmroth, S.; Katul, G.G. Wind-induced leaf transpiration. Adv. Water Resour. 2015, 86, 240–255. [Google Scholar] [CrossRef]
Figure 1. Colorimeter used in this study.
Agronomy 15 01477 g001
Figure 2. Changes in daily plant water content at different growth stages in 2023.
Agronomy 15 01477 g002
Figure 3. Changes in plant water content across five time points per day after irrigation at different growth stages in 2023.
Agronomy 15 01477 g003
Figure 4. Changes in the R color values of functional leaves at five time points per day after irrigation during different growth stages in 2023.
Agronomy 15 01477 g004
Figure 5. Changes in the G color values of functional leaves at five time points per day after irrigation during different growth stages in 2023.
Agronomy 15 01477 g005
Figure 6. Changes in leaf B color value of functional leaves across five times per day after irrigation at different growth stages.
Agronomy 15 01477 g006
Figure 7. Agronomic traits under different water thresholds in 2024. Note: CK represents conventional field irrigation, while T1, T2, and T3 represent different irrigation lower limit treatments, corresponding to irrigation when plant water content drops to 72%, 70%, and 68%, respectively. In these figures, treatments sharing the same letter designation indicate no statistically significant differences between groups, whereas different letter designations denote statistically significant differences among treatments (a, b, c).
Agronomy 15 01477 g007
Figure 8. Cotton boll number and abscission rate under different water thresholds in 2024. Note: CK represents conventional field irrigation, while T1, T2, and T3 represent different irrigation lower limit treatments, corresponding to irrigation when plant water content drops to 72%, 70%, and 68%, respectively. In these figures, treatments sharing the same letter designation indicate no statistically significant differences between groups, whereas different letter designations denote statistically significant differences among treatments (a, b, c).
Agronomy 15 01477 g008
Figure 9. Boll number and individual boll weight at different fruit branch positions under various water thresholds in 2024. Note: In these figures, treatments sharing the same letter designation indicate no statistically significant differences between groups, whereas different letter designations denote statistically significant differences among treatments (a, b, c).
Agronomy 15 01477 g009
Figure 10. Cotton Yield and Its Components in 2024. Note: CK represents conventional field irrigation, while T1, T2, and T3 represent different irrigation lower limit treatments, corresponding to irrigation when plant water content drops to 72%, 70%, and 68%, respectively. In these figures, treatments sharing the same letter designation indicate no statistically significant differences between groups, whereas different letter designations denote statistically significant differences among treatments (a, b, c).
Agronomy 15 01477 g010
Figure 11. Cotton yield and its components under different water thresholds in 2024. Note: CK represents conventional field irrigation, while T1, T2, and T3 represent different irrigation lower limit treatments, corresponding to irrigation when plant water content drops to 72%, 70%, and 68%, respectively. In these figures, treatments sharing the same letter designation indicate no statistically significant differences between groups, whereas different letter designations denote statistically significant differences among treatments (a, b, c).
Agronomy 15 01477 g011
Figure 12. Absorption intensity of photosynthetic pigments for RGB values.
Agronomy 15 01477 g012
Table 1. Correlation analysis between plant water content and R color values of functional leaves at five time points per day during different growth stages in 2023.
StagesTimes of DayInverted Second LeafInverted Third LeafInverted Fourth LeafInverted Fifth LeafInverted Sixth Leaf
Bud Stage09:300.560.520.580.590.53
12:000.580.630.630.280.52
14:300.79 *0.82 *0.83 *0.79 *0.74 *
17:000.79 *0.82 *0.82 *0.79 *0.76 *
19:000.690.82 *0.80 *0.73 *0.74 *
Flowering Stage09:300.36−0.870.340.270.24
12:000.620.630.580.630.60
14:300.85 *0.90 **0.90 **0.87 *0.86 *
17:000.80 *0.82 *0.83 *0.79 *0.77 *
19:000.74 *0.80 *0.79 *0.76 *0.72 *
Boll Stage09:300.690.620.690.690.57
12:000.520.76 *0.72 *0.630.65
14:300.81 **0.85 **0.84 **0.83 **0.82 **
17:000.82 *0.86 **0.84 **0.84 **0.83 *
19:000.78 *0.82 *0.80 *0.79 *0.78 *
* significant at p < 0.05; ** significant at p < 0.01.
Table 2. Correlation analysis between plant water content and G color values of functional leaves at five time points per day during different growth stages in 2023.
StagesTimes of DayInverted Second LeafInverted Third LeafInverted Fourth LeafInverted Fifth LeafInverted Sixth Leaf
Bud Stage09:300.390.390.450.500.50
12:000.560.430.570.080.48
14:300.82 *0.86 *0.88 *0.80 *0.79 *
17:000.80 *0.83 *0.83 *0.74 *0.76 *
19:000.77 *0.82 *0.81 *0.77 *0.75 *
Flowering Stage09:300.30−0.050.290.520.59
12:000.690.690.600.530.57
14:300.81 *0.88 **0.86 **0.76 *0.87 **
17:000.80 *0.82 *0.82 *0.79 *0.79 *
19:000.76 *0.79 *0.78 *0.77 *0.71 *
Boll Stage09:300.670.72 *0.71 *0.670.63
12:000.670.76 *0.81 *0.690.66
14:300.81 **0.85 **0.84 **0.83 **0.81 **
17:000.81 *0.85 **0.85 **0.82 *0.81 *
19:000.78 *0.81 *0.82 *0.79 *0.77 *
* significant at p < 0.05; ** significant at p < 0.01.
Table 3. Correlation analysis between plant water content and B color values of functional leaves at five time points per day during different growth stages in 2023.
StagesTimes of DayInverted
Second Leaf
Inverted Third LeafInverted Fourth LeafInverted Fifth LeafInverted Sixth Leaf
Bud Stage09:300.390.390.460.500.50
12:000.560.430.570.080.48
14:30−0.67−0.72 *−0.72 *−0.69−0.34
17:00−0.27−0.15−0.26−0.220.33
19:00−0.43−0.42−0.07−0.470.15
Flowering
Stage
09:300.30−0.050.290.520.59
12:00−0.08−0.120.070.280.52
14:300.180.280.76 *0.700.26
17:000.210.210.230.570.61
19:000.350.400.450.690.73 *
Boll Stage09:300.050.170.03−0.260.48
12:000.27−0.26−0.24−0.52−0.49
14:300.18−0.03−0.20−0.59−0.53
17:000.13−0.13−0.12−0.45−0.24
19:000.480.370.340.150.43
* significant at p < 0.05;
Table 4. Linear regression analysis between plant water content and leaf R and G values.
StagesFunctional LeafColor ValueRegression EquationpR2
Bud StageInverted third leafRy = 0.25x + 40.97<0.050.77
Gy = 0.34x + 28.34<0.050.65
Inverted fourth leafRy = 0.24x + 41.79<0.050.69
Gy = 0.51x + 4.66<0.050.69
Flowering StageInverted third leafRy = 0.32x + 35.42<0.050.73
Gy = 0.20x + 45.82<0.050.53
Inverted fourth leafRy = 0.25x + 44.13<0.050.64
Gy = 0.18x + 49.11<0.050.56
Boll StageInverted third leafRy = 0.15x + 52.71<0.050.77
Gy = 0.36x + 28.24 <0.050.75
Inverted fourth leafRy = 0.19x + 48.68<0.050.77
Gy = 0.37x + 26.79<0.050.62
Note: R represents the red color value of leaves; G represents the green color value of leaves; p represents the significance level; p < 0.05 indicates a significant correlation between treatments, and p < 0.01 indicates a highly significant correlation between treatments; and R2 represents the coefficient of determination.
Table 5. Bivariate linear regression analysis between plant water content and leaf R and G values.
StagesFunctional LeafColor ValueRegression EquationpR2
Bud StageInverted third leafR: x1, G: x2y = 0.18x1 + 0.12x2 + 33.57<0.050.80
Inverted fourth leafR: x1, G: x2y = 0.14x1 + 0.29x2 + 16.82<0.050.78
Flowering StageInverted third leafR: x1, G: x2y = 0.83x1 − 0.39x2 + 27.66<0.050.87
Inverted fourth leafR: x1, G: x2y = 0.08x1 + 0.22x2 + 36.01<0.050.87
Boll StageInverted third leafR: x1, G: x2y = 0.10x1 + 0.16x2 + 40.41<0.050.89
Inverted fourth leafR: x1, G: x2y = 0.11x1 + 0.19x2 + 34.8<0.050.87
Note: R represents the red color value of leaves; G represents the green color value of leaves; p represents the significance level; p < 0.05 indicates a significant correlation between treatments, and p < 0.01 indicates a highly significant correlation between treatments; and R2 represents the coefficient of determination.
Disclaimer/Publisher’s Note: The statements, opinions and data contained in all publications are solely those of the individual author(s) and contributor(s) and not of MDPI and/or the editor(s). MDPI and/or the editor(s) disclaim responsibility for any injury to people or property resulting from any ideas, methods, instructions or products referred to in the content.

