Article

Bridging the Gap: Limitations of Machine Learning in Real-World Prediction of Heavy Metal Accumulation in Rice in Hunan Province

1
College of Ecology and Environment Sciences, Central South University of Forestry and Technology, Changsha 410004, China
2
Hunan Provincial Soil Pollution Remediation and Carbon Fixation Engineering Technology Research Center, Changsha 410004, China
3
Technical Center for Soil, Agricultural and Rural Ecological Environment, Ministry of Ecology and Environment, Beijing 100012, China
4
Hunan Huanbaoqiao Ecology and Environment Engineering Co., Ltd., Changsha 410205, China
*
Authors to whom correspondence should be addressed.
Agronomy 2025, 15(6), 1478; https://doi.org/10.3390/agronomy15061478
Submission received: 25 May 2025 / Revised: 11 June 2025 / Accepted: 13 June 2025 / Published: 18 June 2025

Abstract

:
Cadmium (Cd) pollution poses a severe threat to rice safety and human health, while traditional linear models exhibit significant limitations in predicting rice Cd accumulation due to environmental complexities. This study systematically evaluated the predictive performance of Random Forest (RF), Gradient Boosting Decision Tree (GBDT), and Residual Neural Networks (ResNet), using a multi-source soil–rice dataset comprising 57,200 samples from Hunan Province. The results showed that the RF model performed best on the test set (R2 = 0.62), with the dominant features being soil’s available Cd (contributing 9.74%) and precipitation during the rice-filling stage (joint contribution of 15.96%). However, the model’s predictive performance experienced a sharp decline on the independent 2023 validation set comprising 393 samples from Yizhang County and Lengshuitan District, with R2 values ranging from −0.12 to −0.31. This highlighted the fundamental limitations of static data-driven paradigms. Agronomic management measures, simplified by heterogeneous data and binary encoding, failed to effectively represent the actual intervention intensity. The study demonstrated that while machine learning models captured nonlinear relationships in laboratory environments, they struggled to adapt to the dynamic interactions and spatiotemporal heterogeneity of farmland systems. Future efforts should focus on developing hybrid models guided by mechanistic insights, integrating dynamic environmental processes and real-time data, and promoting localized “one model per region” strategies to enhance predictive robustness. This study provides methodological insights for the technological transformation of agricultural artificial intelligence, emphasizing that the deep integration of data-driven approaches and mechanistic understanding is crucial for overcoming the “last mile” challenge.

Graphical Abstract

1. Introduction

Cadmium (Cd) is a widespread heavy metal pollutant in agricultural soils, characterized by high biotoxicity. It can enter the human body through the soil–plant–food chain, posing a significant threat to human health [1]. Studies have shown that crop Cd uptake is influenced by multiple factors, including soil Cd concentration, pH, cation exchange capacity (CEC), and organic matter (SOM) [2,3]. In China, cadmium contamination in rice remains a major food safety concern, particularly in regions affected by industrial activities or with acidic soils. According to the most recent national food safety standard GB 2762–2022 [4], the maximum allowable cadmium concentration in rice is 0.2 mg·kg−1. This limit, which has remained unchanged for decades, reflects both health protection goals and agricultural feasibility under China’s soil conditions. However, rice exceeding this threshold continues to be reported in several provinces, highlighting ongoing risks to dietary exposure [5]. Soil acidification is recognized as a key factor promoting Cd accumulation in crops, as lower pH enhances Cd bioavailability, increasing its uptake by plants [6,7]. To mitigate the risk of Cd contamination in food, researchers have proposed various strategies, such as optimizing soil management, adjusting fertilization regimes, and selecting crop genotypes with lower Cd accumulation in edible parts [8,9]. Against this backdrop, developing predictive models based on soil characteristics to accurately estimate Cd concentrations in grains is of paramount importance for ensuring food safety and managing Cd pollution [10,11].
Following the recognition of Cd’s impact on agricultural soils and food safety, researchers have attempted to predict crop Cd accumulation using various models. However, prediction accuracy varies significantly across different crops and environmental conditions. A critical review of Cd pollution research in rice and wheat systems highlighted that wheat generally exhibits stronger correlations between grain Cd concentration and soil factors such as total Cd and pH, making it more predictable using traditional models. In contrast, rice Cd accumulation is influenced by more complex mechanisms, including redox-driven mobilization, fertilizer type and application rate, and varietal uptake differences, which complicate modeling efforts and often result in a lower predictive performance [12]. The weak correlation between soil Cd concentrations and rice grain Cd accumulation highlights the limitations of these models. Studies suggest that key factors influencing rice Cd accumulation extend beyond soil Cd levels to include root uptake mechanisms, field water management, and microbial activity [13]. Furthermore, atmospheric deposition serves as a significant source of rice Cd accumulation. Isotope tracing studies have demonstrated that newly deposited Cd enters rice plants through both leaf and root pathways, contributing 37% to 79% of the grain Cd content [14]. These findings further undermine the scientific validity of soil Cd concentration as the sole predictor in existing models. Consequently, the poor performance of linear regression models in complex rice Cd accumulation systems underscores the urgent need for developing nonlinear or mechanistic models that integrate climate conditions, agricultural management measures, and anthropogenic activities. Such models would not only enable accurate Cd contamination risk assessments but also provide a scientific basis for formulating targeted soil pollution management and food safety strategies.
The complexity of rice grain Cd accumulation at large regional scales and the limitations of traditional linear regression models have prompted researchers to adopt machine learning (ML) approaches. Compared to conventional statistical models, machine learning excels in handling complex, irregular, and high-dimensional data, enabling both classification and regression tasks while uncovering hidden nonlinear relationships [15]. In recent years, machine learning has been extensively applied in environmental science fields, including toxicity prediction, pollutant tracing, and heavy metal risk assessment. Specifically, machine learning models have demonstrated excellent predictive capabilities for rice Cd accumulation. For example, the Random Forest (RF) model has shown superior performance in predicting Cd uptake factors, achieving an R2 of 0.583, surpassing traditional Freundlich transfer equations [16]. Additionally, studies using the Gradient Boosting Decision Tree (GBDT) model have confirmed its robustness in capturing complex interactions among variables such as soil pH, SOM, and phosphorus content, achieving an R2 of 0.981 [17]. In rice Cd accumulation studies, machine learning prediction frameworks typically follow a three-step process:(1) feature selection and data preprocessing, (2) model training, and (3) label prediction. For instance, researchers have utilized near-infrared spectroscopy combined with chemometric algorithms to extract full-spectrum information from rice samples, building predictive models based on partial least squares (PLS) and bioconcentration factors (BCF), significantly improving Cd concentration prediction accuracy [18]. Moreover, integrating diffusive gradients in thin films (DGT) technology with machine learning algorithms has enabled the construction of precise Cd enrichment models for dynamic monitoring of Cd bioavailability [19].
Despite the promising potential of machine learning in predicting rice Cd accumulation, its applicability at large regional scales remains uncertain. On one hand, spatial heterogeneity and environmental noise in large-scale datasets can weaken model generalizability. On the other hand, differences in hyperparameter tuning and feature selection across models can impact prediction stability [20]. Therefore, further research is required to investigate the feasibility of machine learning models at regional scales and validate their robustness in predicting rice Cd accumulation [21]. Meanwhile, most existing studies focus on the model’s accuracy on the test set or limited single-region scales, lacking systematic validation of temporal extrapolation capabilities at larger scales. Current models often overlook the complex interactions in farmland systems (e.g., precipitation fluctuations and the agronomic management measures) and latent variables (e.g., road density and enterprise density near rice fields), leading to a disconnect between mechanistic understanding and data-driven predictions. Additionally, model performance evaluations are often limited to cross-validation on historical data, with few studies applying independent spatiotemporal validation datasets to reveal real-world generalization failures.
In this study, we propose a region-specific modeling strategy based on environmental stratification to improve the generalizability and robustness of AI models in agricultural applications. Therefore, this study integrates multi-source environmental data from Hunan Province, encompassing soil physicochemical properties, climatic conditions, agronomic management practices, and more. By constructing predictive frameworks using Random Forest (RF), Gradient Boosting Decision Tree (GBDT), and Residual Neural Networks (ResNet), we systematically compare the discrepancies between model accuracy on test sets and performance in real-world applications by using independent validation datasets. This study aims to address the following key questions: (1) evaluate and compare the predictive performance of RF, GBDT, and ResNet under a multi-source environmental variable dataset; (2) simplify models through feature importance analysis to achieve dimensionality reduction while maintaining accuracy for practical deployment; and (3) analyze the gap between test set accuracy and real-world performance using independent validation datasets, as well as exploring potential solutions to bridge this gap. Collectively, these objectives aim to provide a practical and scalable machine learning framework for predicting Cd accumulation in rice, with implications for real-world agricultural risk management.

2. Materials and Methods
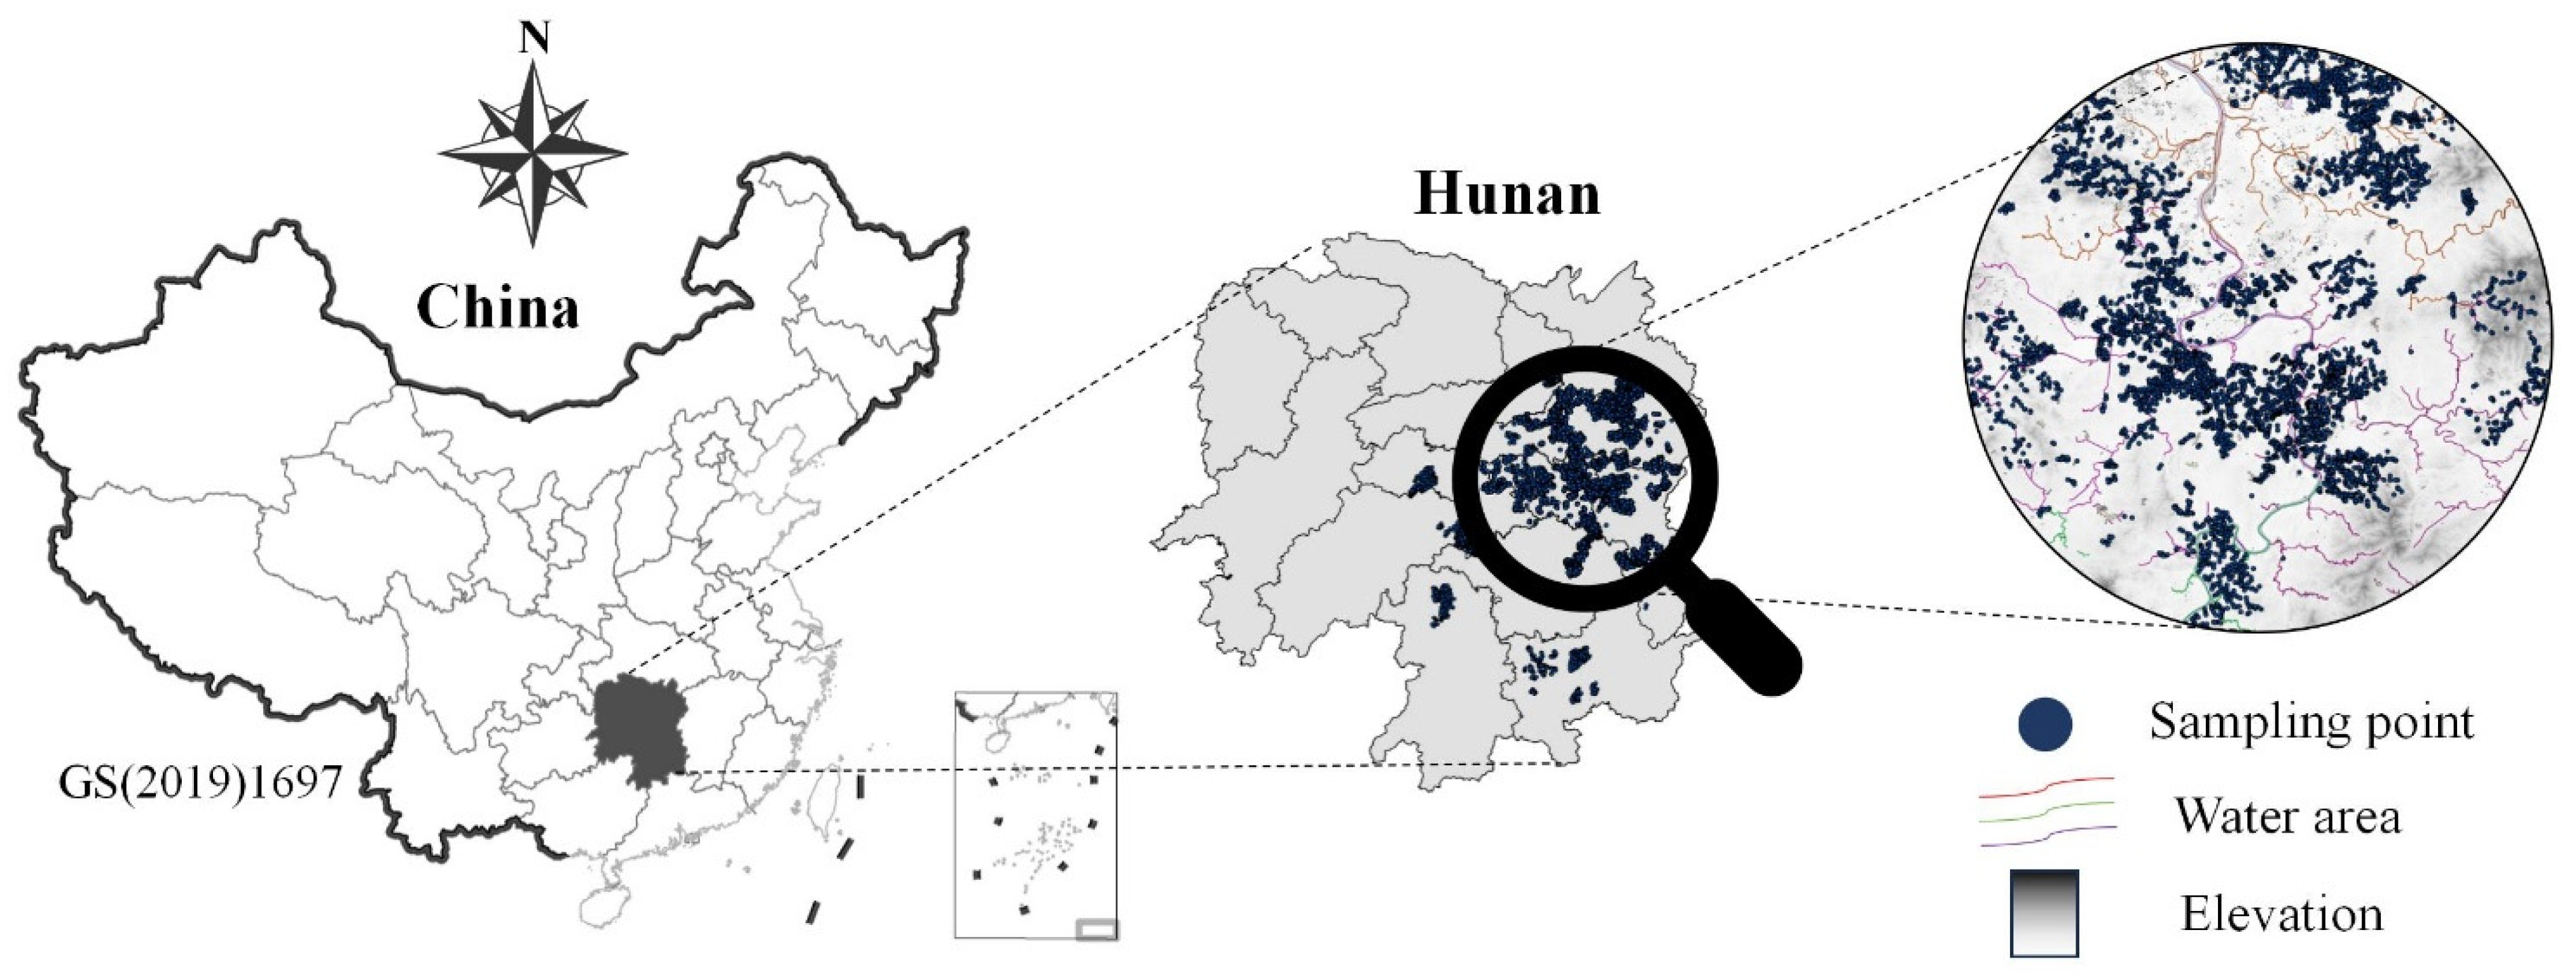
2.1. Study Area

This study covers key heavy metal pollution prevention and control zones in Hunan Province, including the Chang-Zhu-Tan urban agglomeration (Changsha, Zhuzhou, and Xiangtan), the Dongting Lake region (Yueyang and Yiyang), and the Southern Hunan mining belt (Chenzhou, Hengyang, Yongzhou, and Loudi), comprising nine prefecture-level cities in total. Hunan Province is located in central south China, with an average annual precipitation ranging from approximately 1200 to 1700 mm and an average annual temperature of 16–18 °C. The province is characterized by complex and diverse geographical features, with terrain gradually sloping from the southwest to the northeast. It is traversed by four major river systems, namely the Xiangjiang, Zijiang, Yuanjiang, and Lishui Rivers. These abundant water resources and the warm, humid climate make Hunan one of China’s most important rice-growing regions [22]. Paddy fields are primarily distributed across the interwoven areas of river valley plains and hilly basins, where the topography is conducive to the construction of irrigation systems and supports stable rice cultivation. Low-altitude plains accommodate extensive rice fields with high yields, while fields in hilly and mountainous areas are more fragmented due to limited irrigation conditions. Furthermore, rice cultivation in Hunan is typically concentrated along river courses to fulfill the substantial water requirements of paddy field irrigation [23].

2.2. Soil–Rice Physicochemical Data

The samples used for model establishment were collected from the fields in the above areas between 2014 and 2016, including 57,200 pairs of soil–rice samples (Figure 1). Paired soil–rice samples were used instead of independent sampling to ensure a direct linkage between soil properties and the corresponding grain Cd concentrations at each sampling point. This design enhances the reliability of modeling efforts by capturing site-specific environmental and agronomic influences on Cd uptake.
The soil samples were collected from the surface (0–20 cm), cleaned of stones, roots, and other debris, and air-dried naturally. After grinding and thorough mixing, the samples were sieved through nylon screens with 2.0 mm and 0.149 mm, respectively, and stored in sealed plastic bags for analysis. The soil pH was measured using a pH meter (PHS-3C, Shanghai Leici, Shanghai, China) at a ratio of 1:2.5 soil to water. SOM was measured using the potassium dichromate oxidation colorimetry method [24]. CEC was determined by the ammonium acetate saturation method [25]. Total heavy metals in the soil were digested using 10 mL aqua regia and 3 mL perchloric acid [26]. It is worth noting that the extractant for available the Cd in the soil were not uniform, including 0.01 mol·L−1 CaCl2, 0.1 mol·L−1 HCl, 0.05 mol·L−1 ethylenediaminetetraacetic acid (EDTA), and 0.005 mol·L−1 diethylenetriaminepentaacetic acid (DTPA). Both heavy metals and available Cd in the soil were measured by ICP-AES (ICP 6300, Thermo Fisher, San Jose, CA, USA). Total As in the soil was digested using diluted aqua regia (1:1), the digests were measured using an atomic fluorescence spectrometer (AFS-6801, Shanghai, China) [27]. The grains were carefully washed with running water and deionized water sequentially, rinsed, and dried at 105 °C for 30 min and then at 70 °C to a constant weight. The brown rice was ground and passed through 0.149 mm nylon screens. The Cd content in the grain was digested by nitric acid and perchloric acid, and measured using a graphite furnace atomic absorption spectrophotometer (240Z, Agilent, Santa Clara, CA, USA). The samples from the validation region (Yizhang County and Lengshuitan District) were collected in 2023, including 393 pairs of soil–rice samples (Figure 1), using the same analytical procedures as described in the methodology section.
The geographic distribution comprised 57,200 soil–rice paired samples across nine prefecture-level cities in Hunan Province, China, including the Chang-Zhu-Tan urban agglomeration, Dongting Lake region, and Southern Hunan mining belt. The sampling sites in Lengshuitan District (Yongzhou City) and Yizhang County (Chenzhou City) were used exclusively for independent model validation in 2023 and were therefore not included in the main dataset displayed in Figure 1.

2.3. Agricultural Management Data

The agronomic management data are in textual format [28], whereas machine learning algorithms require numerical input. Therefore, we need to perform encoding processing on the textual data. For feature encoding, ordinal encoding was applied to variables with inherent order relationships, such as “Low-Cd rice variety name”, “Foliar blocker name”, and “Organic fertilizer type”. This method preserves the ordinal nature of the data, allowing the model to capture potential dose-response effects or priority differences. In contrast, binary choice variables (e.g., “Implementation of water management” and “Application of quicklime”) were encoded using 0/1 binary encoding. Details on the specific rice varieties, foliar blockers, and organic fertilizer types used in this study are provided in the Supplementary Materials. In addition, it is worth noting that one-hot encoding was deliberately avoided to mitigate the risk of model overfitting arising from an exponential increase in feature dimensionality. Given that the dataset already includes over 30 features, applying one-hot encoding to multi-category variables would drastically expand the feature space, complicating the model and reducing its generalization capability. This decision aligns with the “Curse of Dimensionality” theory proposed by Hastie, which emphasizes the challenges of high-dimensional data in machine learning models [29]. The machine learning model developed in this study incorporates 13 agricultural management feature variables, detailed as follows:
(1)
Low-Cd variety (0/1)
(2)
Low-Cd varieties (ordinal encoding)
(3)
Water management (0/1)
(4)
Application of quicklime (0/1)
(5)
Foliar blocker (0/1)
(6)
Foliar blockers (ordinal encoding)
(7)
Soil conditioner (0/1)
(8)
Soil conditioners (ordinal encoding)
(9)
Green manure Astragalus (0/1)
(10)
Tillage improvement (0/1)
(11)
Organic fertilizer (0/1)
(12)
Organic fertilizers (ordinal encoding)
(13)
Fallow (0/1)
Note: Variables without an “s” (e.g., Low-Cd variety, Foliar blocker) represent binary indicators of whether the corresponding agronomic measure was applied (0 = no, 1 = yes). Variables with an “s” (e.g., Low-Cd varieties, Foliar blockers) denote the type or intensity of the application, encoded using ordinal values to reflect increasing levels or categories of use.

2.4. Multi-Source Environmental Data Integration

In this study, four categories of environmental variables (11 in total) from multi-source datasets were introduced into model construction, encompassing climate, geographic, and anthropogenic factors, and integrated using geographic information systems (GIS).

2.4.1. Climate Data

Precipitation and temperature data are as follows: Monthly data with a 1 km resolution were extracted from datasets published by Peng et al. (2019, 2020) (https://data.tpdc.ac.cn) (accessed on 1 October 2024) via FTP [30,31]. Climatic data for early rice cultivation were collected during March and April, while late rice data were acquired from July and August. These monthly datasets were categorized into distinct grain-filling phases, where data from March (early rice) and August (late rice) were assigned to the early grain-filling period, and data from April (early rice) and September (late rice) were assigned to the late grain-filling period. Precipitation and temperature variables were subsequently divided into two corresponding phases for both rice types.

2.4.2. Meteorological Data

Wind speed data were obtained from the National Centers for Environmental Information (NOAA/NCEI, https://www.ncei.noaa.gov) (accessed on 19 September 2024). Air quality data were sourced from QWeather (https://www.qweather.com) (accessed on 26 September 2024).

2.4.3. Geographic Environmental Data

Elevation data were sourced from the Geospatial Data Cloud platform (https://www.gscloud.cn) (accessed on 30 September 2024), with a spatial resolution of 90 m. It was assumed that interannual elevation changes were negligible.
Water quality data are obtained from the Ministry of Ecology and Environment of China (https://www.mee.gov.cn) (accessed on 9 October 2024) through the national surface water quality report published in March 2014. After importing the images into ArcGIS, geographic coordinates were calibrated to align with the vector map of Hunan Province. River systems and water quality levels were manually extracted, and a nearest-neighbor analysis was conducted to associate sampling points with the nearest river, assigning the corresponding water quality grade.
Soil and rock classification data were extracted from the International Soil Reference and Information Centre (ISRIC) SOTER database (https://www.isric.org) (accessed on 19 September 2024), with a spatial resolution of 1 km.

2.4.4. Anthropogenic Activities

Metal mine density was derived from the 2021 National Mineral Deposits Database using ArcGIS point density analysis.
Road density was calculated using line density analysis based on OpenStreetMap (OSM) road network data.
Enterprise density was extracted using point density analysis from Baidu Maps’ Points of Interest (POI) data.

2.5. Data Processing and Machine Learning Models

An ideal machine learning training dataset must comprehensively consider the impact of multiple environmental variables on rice Cd accumulation while minimizing the influence of outliers and extreme data values. In this study, soil physicochemical properties, agricultural management data, and remote sensing data were integrated into a dataset with 36 features. Samples with excessive missing features or extreme values (e.g., pH > 9) were manually removed, resulting in a final dataset of 37,893 samples (Table 1).
Missing data were imputed using the mean imputation method, and the z-score normalization (Equation (1)) was applied to standardize the feature values. The rice Cd concentration, used as the target variable, remained unprocessed. The dataset was randomly split into 80% for training and 20% for testing. It is important to note that in this study, the test set was solely used for model selection and to observe potential overfitting. Additional independent datasets, referred to as validation sets, were applied for further evaluation.
Random Forest (RF), Gradient Boosting Decision Tree (GBDT), and Residual Neural Networks (ResNet) are three widely used machine learning methods for predicting heavy metal concentrations in rice.
We first applied the Random Forest (RF) algorithm, a nonparametric and nonlinear ensemble learning method that builds multiple independent decision trees using bootstrap sampling. The final prediction is determined by either majority voting (for classification) or averaging (for regression) [32,33]. RF is particularly effective for handling high-dimensional data and exhibits a robust performance in the presence of outliers and noise, making it a common choice in agricultural prediction tasks [34].
Gradient Boosting Decision Tree (GBDT) was also employed to capture complex feature interactions through additive model optimization. Unlike RF, GBDT builds trees sequentially and typically offers higher accuracy, but is more sensitive to overfitting. It sequentially trains multiple weak learners (typically regression trees), with each iteration adjusting sample weights to focus on the errors of the previous model [35]. The primary advantage of GBDT is its adaptive structure, which enhances its ability to fit small datasets and achieve high prediction accuracy in complex, high-dimensional environments [36,37].
To explore deep learning potential, we implemented a Residual Neural Network (ResNet), which addresses vanishing gradient issues via shortcut connections. Unlike traditional tree-based models, ResNet is a deep learning-based model primarily used in image analysis [38]. It incorporates skip connections to mitigate the vanishing gradient problem in deep networks [39]. To adapt it for tabular data, a custom 10-layer ResNet was designed using PyTorch 2.2. Skip connections were introduced at every even-numbered hidden layer, with the number of neurons gradually decreasing from 512 to 32. This architecture is tailored for continuous variable prediction tasks. The TensorFlow Decision Forests (TFDF) library was used to implement the RF and GBDT models, with the hyperparameter template set to “benchmark_rank1”, a configuration known for its strong performance in various Kaggle competitions. Comparatively, the ResNet model was developed using PyTorch 2.2. Each model aims to explore the complex relationships between environmental variables and rice Cd concentrations from different perspectives. All models were trained using the same dataset and evaluated with R2 and RMSE on the test set for performance comparison.
To prevent certain features from contributing excessively to the models, the z-score (Equation (1)) normalization was applied to the features.
The formula is listed as follows:
x′ = (x − μ)/σ
where x is the feature value; μ is the mean of each feature; and σ is the standard deviation of each feature.

2.6. Model Simplification and Validation

To ensure practical applicability, reducing the complexity of the model is essential, as using all 36 features would result in excessively high implementation costs. Therefore, this study applied the SUM_SCORE metric from the TensorFlow Decision Forests library to evaluate the global feature importance. Based on the results, a simplified model was reconstructed using the top 12 key features, while maintaining the original hyperparameter settings. RF, GBDT, and ResNet models were retrained using the reduced feature set. The model achieving the best performance on the test set was considered the optimal model. For temporal extrapolation validation, independent datasets collected in 2023 from Yizhang County (297 paired samples) in Chenzhou City and Lengshuitan District (96 paired samples) in Yongzhou City were used. The environmental variable extraction methods for the validation data were consistent with those applied to the training data, ensuring comparability.
The validation process involved directly applying the trained optimal model to predict the Cd concentrations in the 2023 data, without any parameter adjustments or retraining. This strict evaluation assessed the model’s temporal generalization capability. The model’s performance degradation was assessed by comparing the following metrics between the test set and the validation set. The workflow of this study is shown in Figure 2.
A schematic of the prediction framework is as follows: (1) multi-source data integration (soil properties, agronomic practices, remote sensing); (2) feature engineering and normalization; (3) model training (RF, XGBoost, ResNet) with 36 features; (4) model simplification using top 12 features; and (5) independent spatiotemporal validation with 2023 datasets. Colors are used for visual clarity only and do not represent any specific categories or values.
R 2 = 1 i = 1 n ( Y i t e s t Y i p r e d ) 2 i = 1 n ( Y i t e s t Y ¯ t e s t ) 2
R M S E = 1 n i = 1 n ( Y i t e s t Y i p r e d ) 2
M A E = 1 m i = 1 m | y i y i p |
R2 is the coefficient of determination, indicating the goodness of fit.
RMSE (Root Mean Square Error) reflects the average magnitude of prediction errors.
MAE (Mean Absolute Error) measures the average absolute difference between predicted and actual values. These metrics provided insights into the extent of model deterioration in practical applications. Where Y i t e s t and Y i p r e d are test set data and predicted data, respectively. Y ¯ test is the mean value of test set data.

3. Results

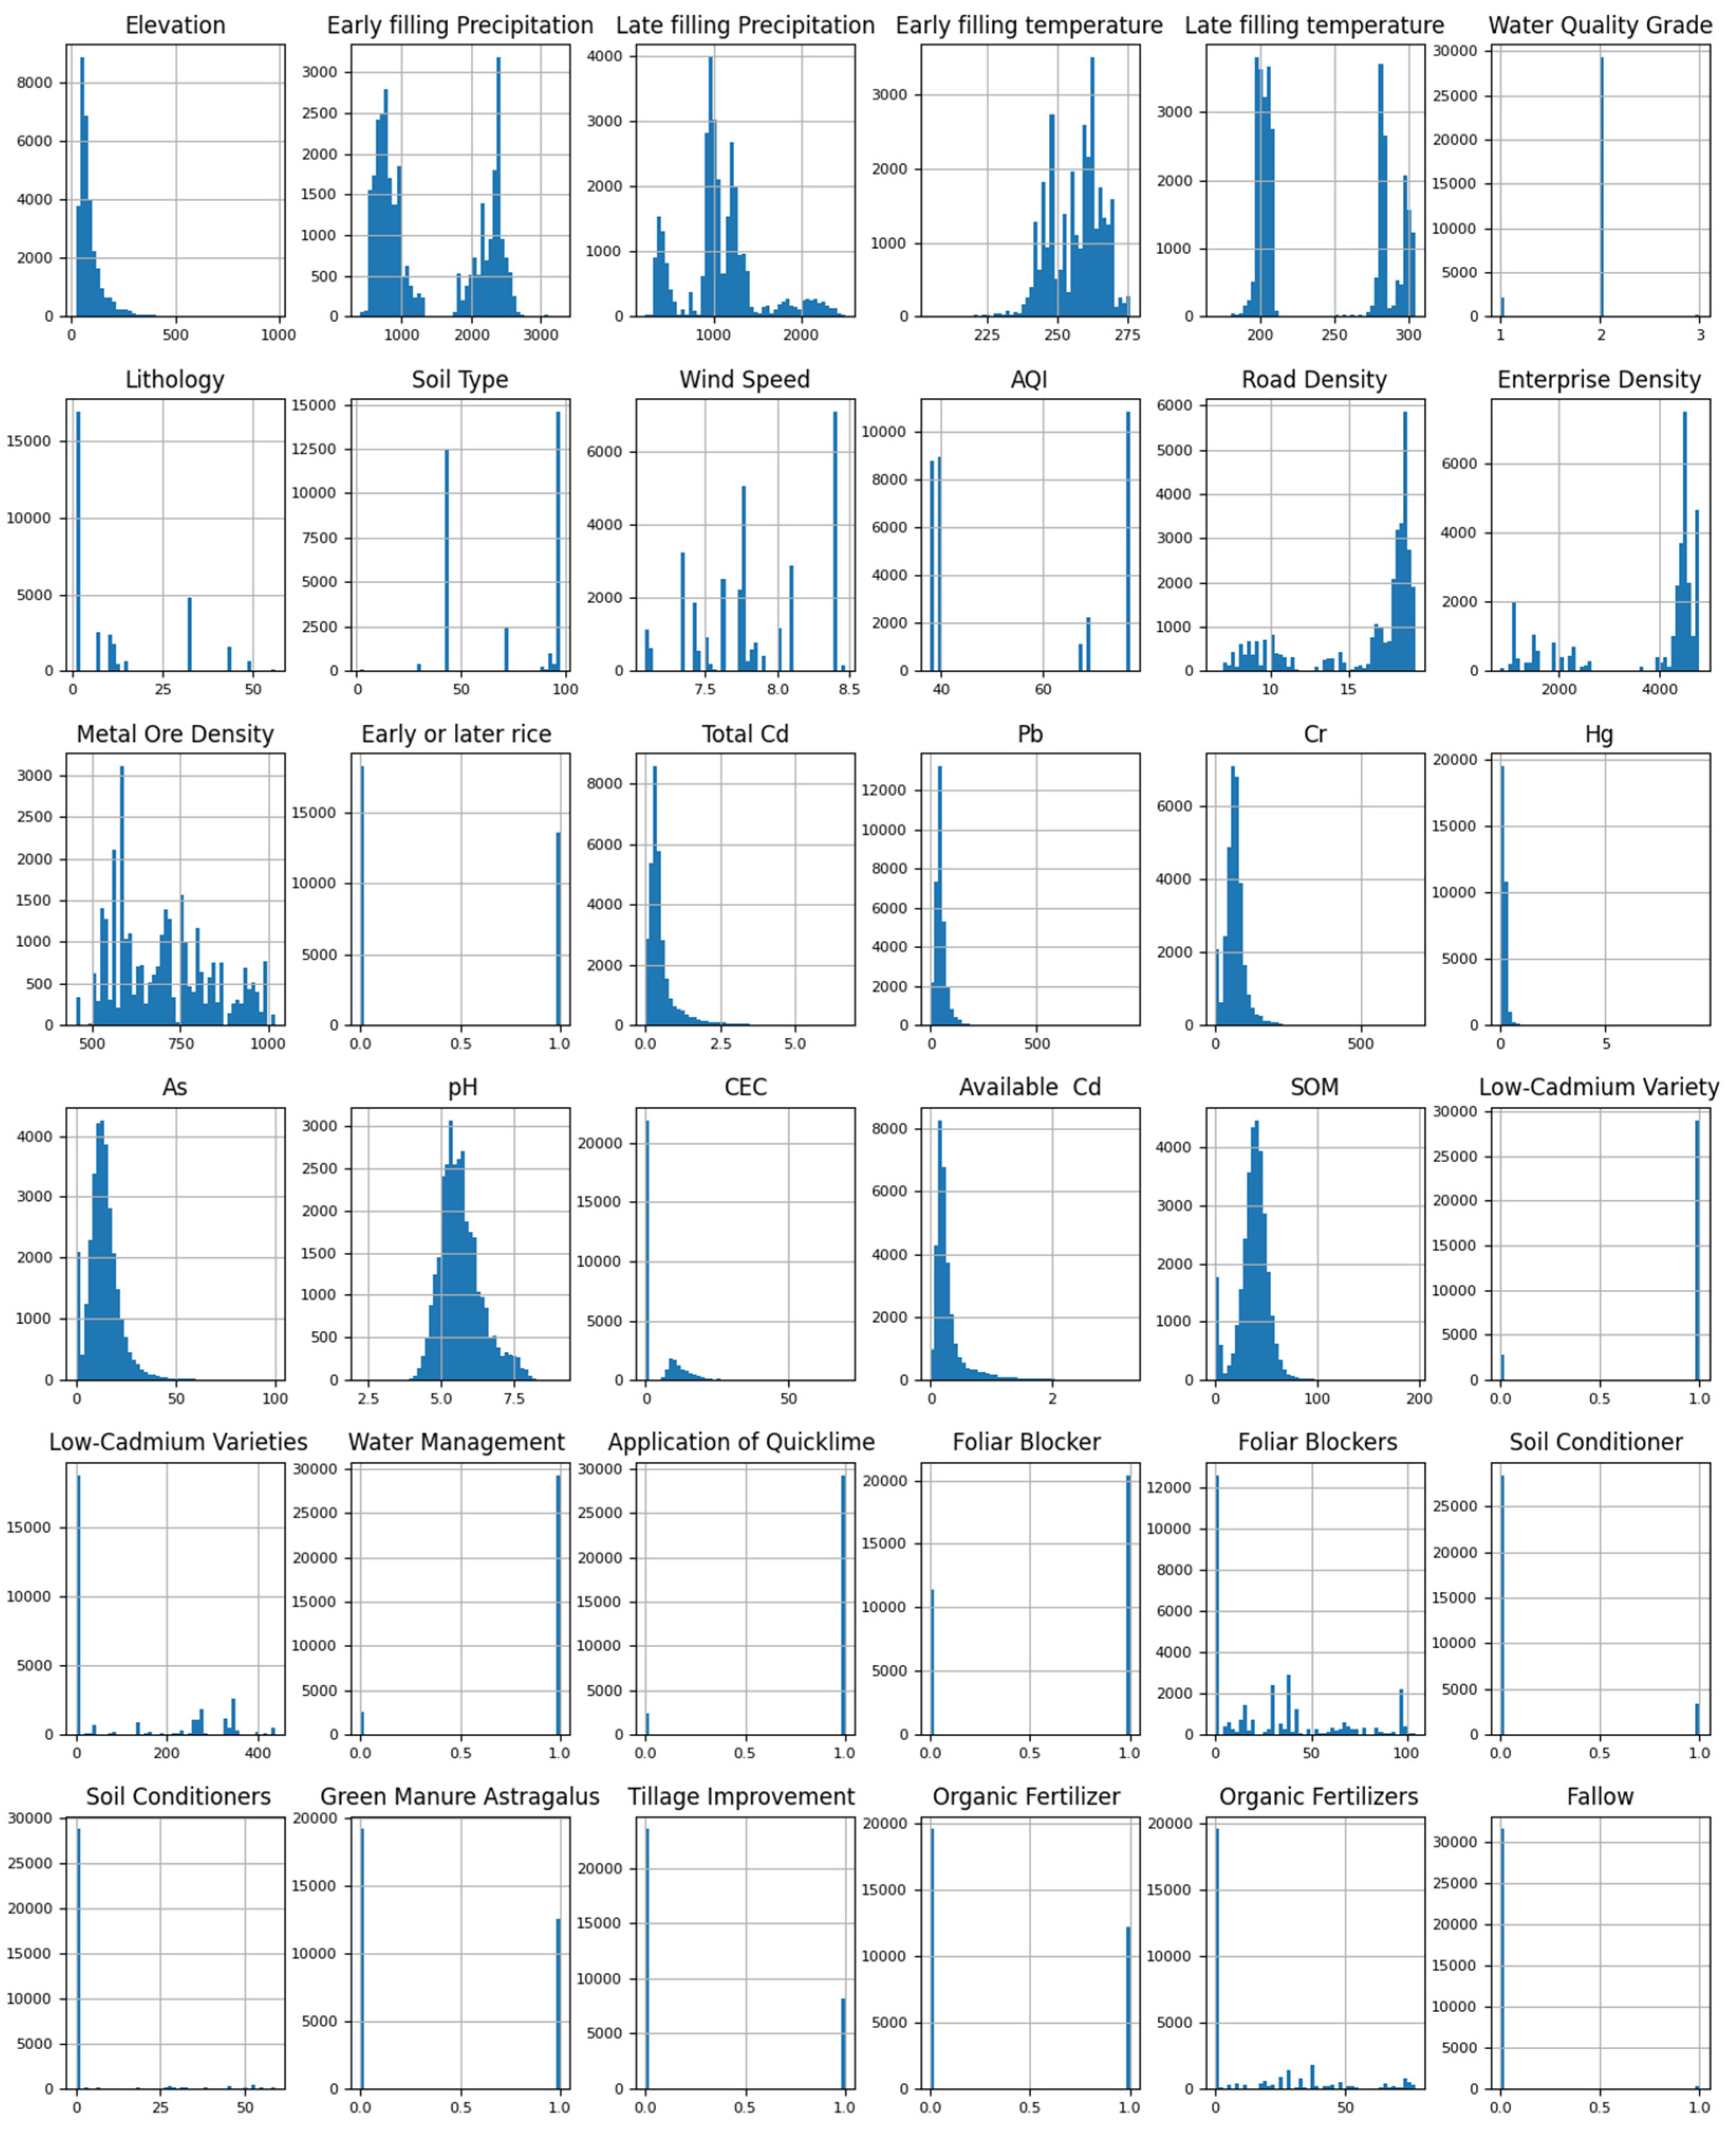
3.1. Primary Data Description

The pH distribution of the 37,893 soil samples showed that 44% were acidic (pH < 5.5), another 44% fell in the range of 5.5–6.5, and only 2.6% were above 7.5. Exceedance rates of five heavy metals—Cd, Hg, As, Pb, and Cr—under different pH conditions are summarized in Table 2. Thresholds were defined according to the China’s Soil Environmental Quality Risk Control Standard for Agricultural Land (GB15618-2018) [40]. Among them, cadmium (Cd) contamination was the most severe, with exceedance rates of up to 64% in acidic soils, whereas the levels of Hg, As, Pb, and Cr remained low across most pH intervals. Furthermore, topographic analysis showed that 93.9% of sampling sites were located at elevations below 200 m, primarily in low-lying floodplain and basin regions. Additional data distributions are detailed in Figure 3.
We summarized the distribution patterns of 36 environmental variables, including soil pH, available Cd, precipitation during grain-filling stages, elevation, and enterprise density. Boxplots and histograms depict variable distributions, emphasizing pH-dependent Cd contamination (44% samples with pH < 5.5) and spatial heterogeneity in Hunan’s paddy systems.

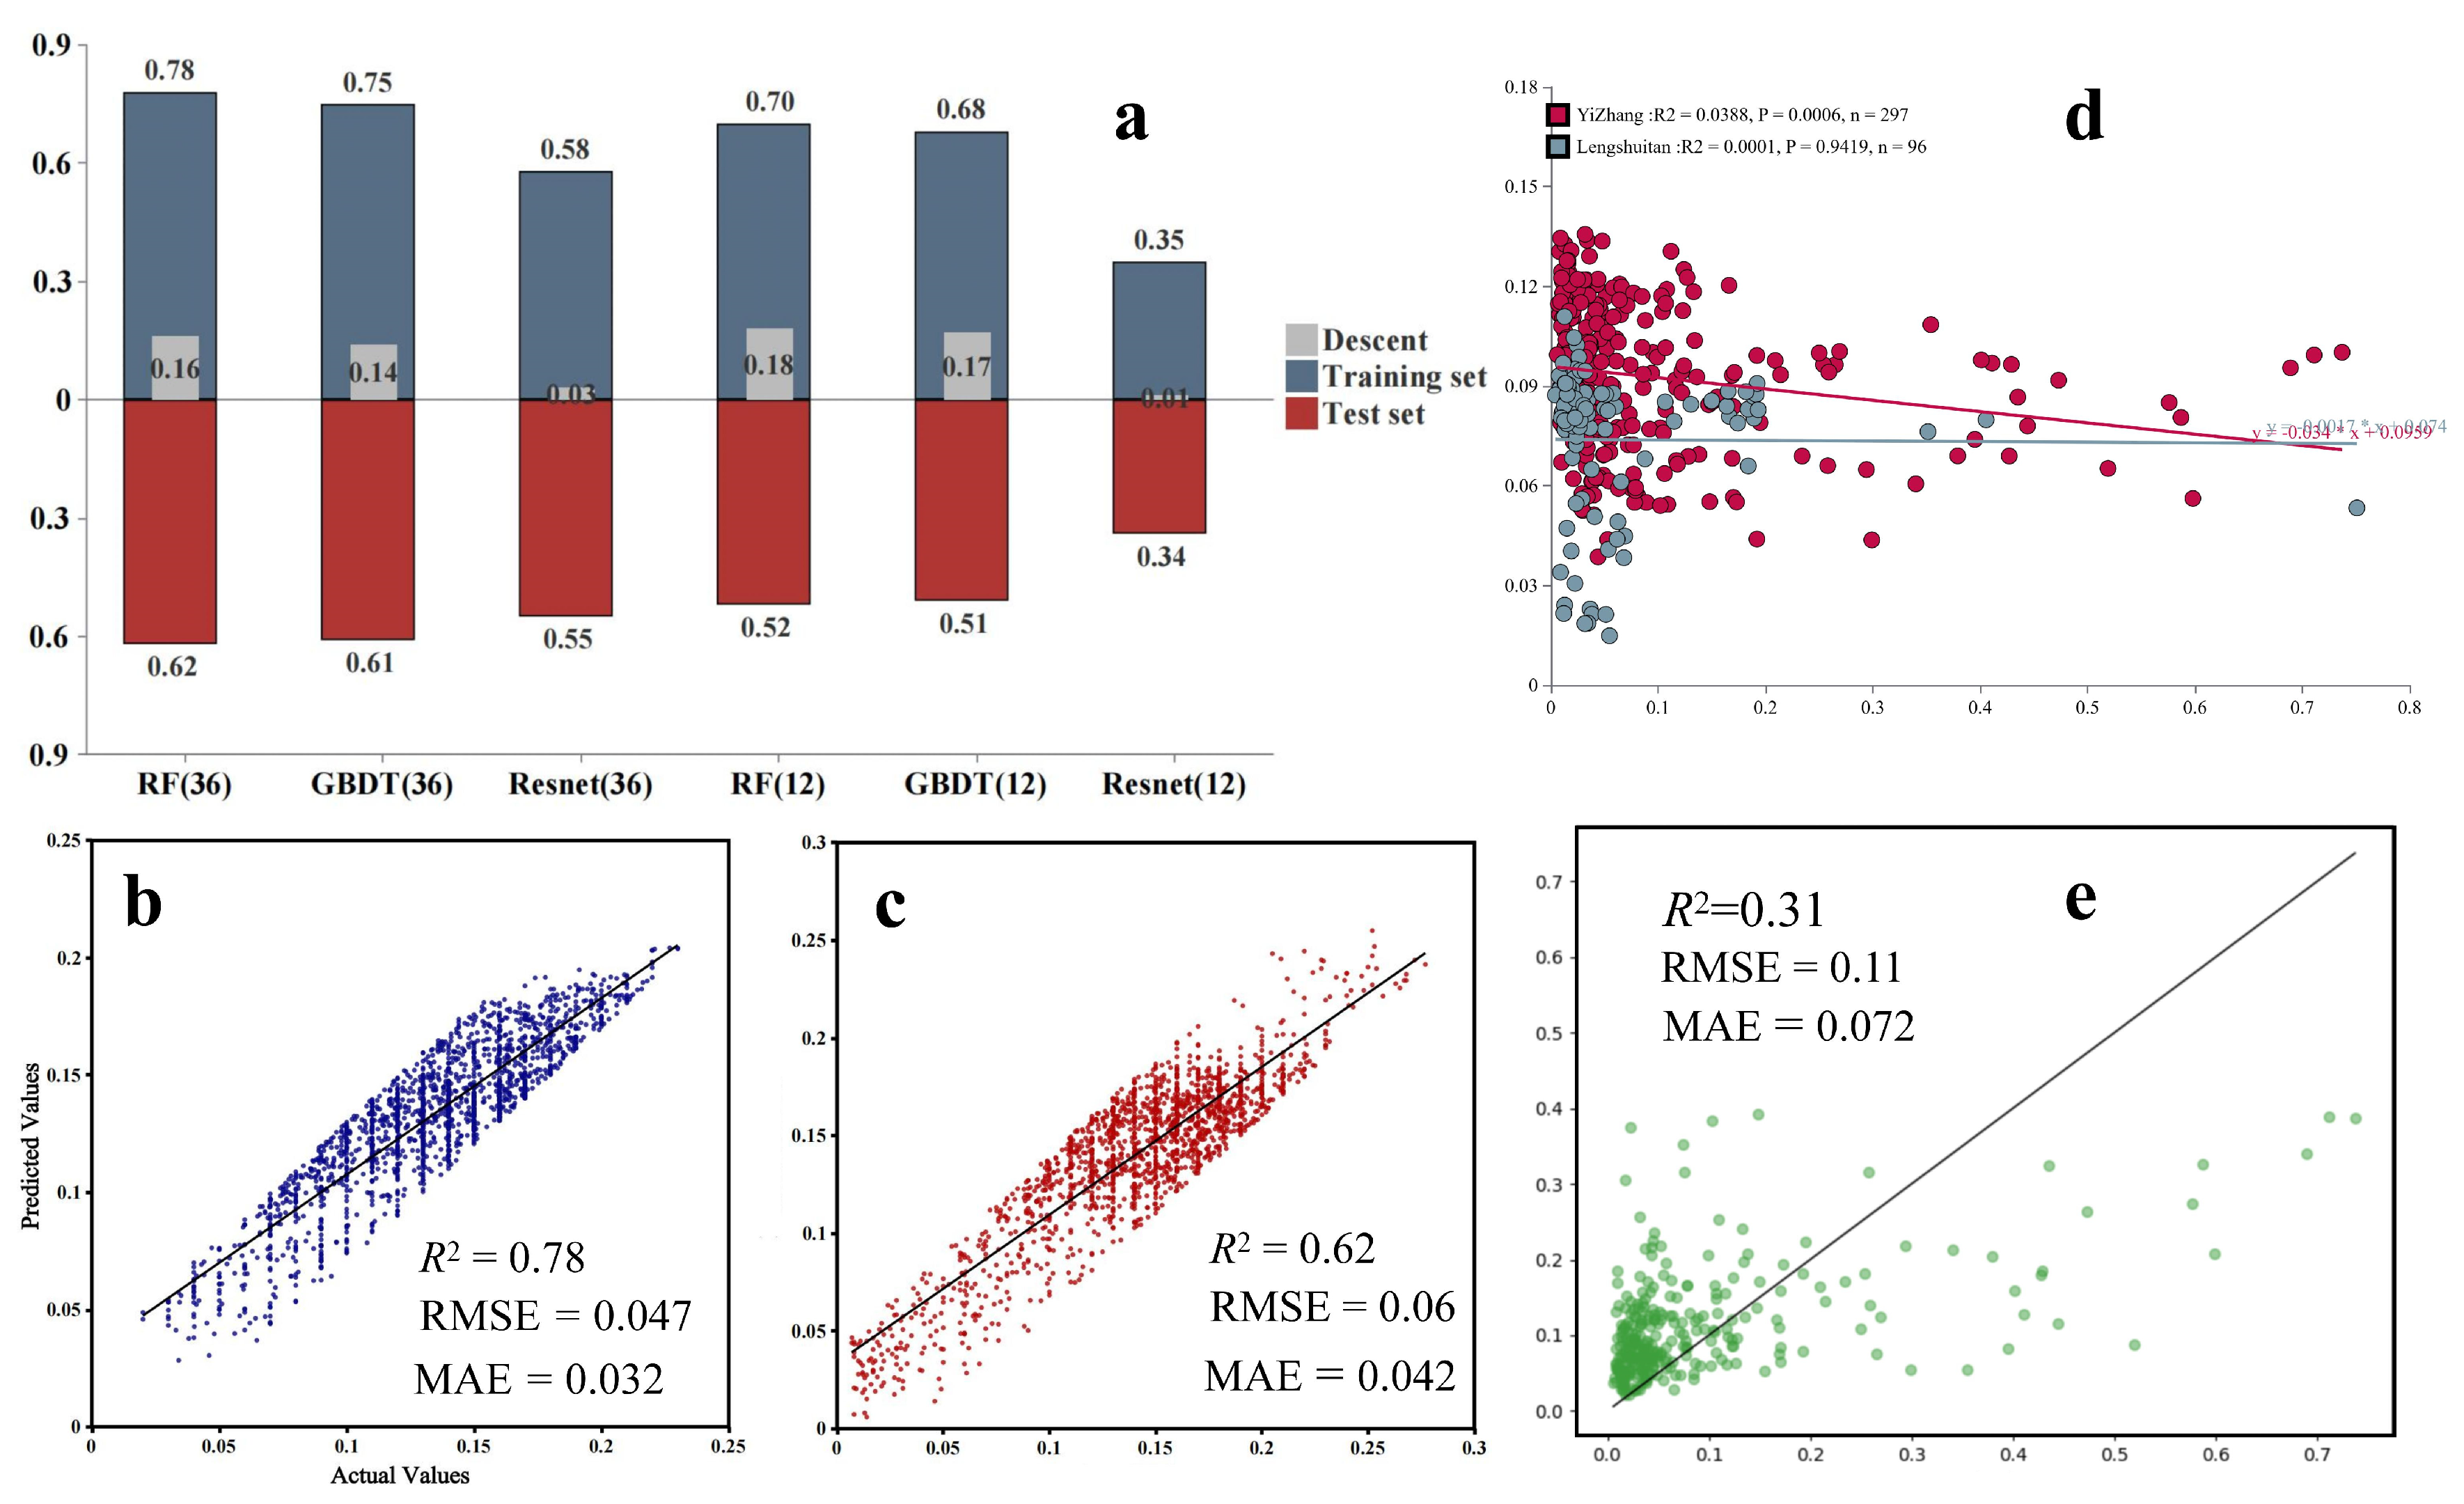
3.2. Feature Importance and Model Performance

Feature importance analysis identified available Cd (total score: 122,218.77) and total Cd (83,907.71) as the primary drivers of soil Cd bioavailability, jointly contributing 42.3% of predictive power. Precipitation variables (late-filling precipitation and early-filling precipitation) collectively accounted for 19.8%, highlighting hydrological regulation of heavy metal migration during grain-filling stages. Secondary contributors included Elevation (4.0%) and Enterprise Density (4.4%), reflecting indirect impacts of topography and anthropogenic activities. Weakly associated variables, such as agronomic management measures (e.g., Fallow (1/0), Soil conditioner (1/0)), exhibited minimal importance scores (<1000), underscoring the limited predictive utility of current agricultural practice data (Figure 4). To streamline the model, early-filling precipitation was replaced with Enterprise Density due to the functional overlap with late-filling precipitation.
Using a 36-feature dataset partitioned into training and test sets, this study compared three machine learning models. The RF model achieved R2 = 0.78 on the training set and R2 = 0.62 on the test set. GBDT yielded R2 = 0.75 (training) and R2 = 0.60 (test). The ResNet showed R2 = 0.58 (training) and R2 = 0.55 (test). The RF model demonstrated an optimal overall performance, with a moderate training-test gap (ΔR2 = 0.16), indicating its capability to capture nonlinear feature–label relationships under high-dimensional data (36 features, 37,893 samples) while maintaining strong generalization (Figure 5). Notably, the 36-feature model served primarily for environmental variable exploration, as practical deployment would be infeasible.
Simplified models using the top 12 features achieved test set performances of R2 = 0.52 (RF), R2 = 0.5 (GBDT), and R2 = 0.34 (ResNet). The modest R2 decline for RF and GBDT confirmed that key predictors (e.g., available Cd, late-filling precipitation) retained critical predictive information. The RF model was ultimately selected for field validation (Figure 5).
The Random Forest-based feature contribution ranking is as follows: available Cd (9.74%), late-filling precipitation (8%), and early-filling precipitation (7.96%) dominate prediction efficacy. Weak contributions from agronomic measures (e.g., soil conditioner application < 0.1%) reflect data heterogeneity. Error bars represent bootstrap resampling uncertainty.

3.3. Field Validation Results

Independent validation using 2023 data from Yizhang County (297 paired samples) and Lengshuitan District (96 paired samples) revealed significant performance degradation. For RF, Yizhang yielded R2 = −0.12, RMSE = 0.87 mg·kg−1, and MAE = 0.68 mg·kg−1; Lengshuitan showed R2 = −0.31, RMSE = 1.05 mg·kg−1, and MAE = 0.82 mg·kg−1. R2 values approaching zero suggest that the model’s predictions are equivalent to using mean values, thereby failing to demonstrate the predictive advantage of machine learning methods (Figure 5).

4. Discussion

4.1. Heavy Metal Contamination in Study Area

Our results demonstrate pronounced pH-dependent heavy metal contamination in the sampled soils, with Cd exhibiting the most severe pollution. Among soil samples collected over three years, 44% had pH < 5.5, where Cd exceedance rates reached 64%. As pH increased, Cd exceedance rates progressively declined to 28% in soils with pH > 7.5. Other heavy metals (Hg, As, Pb, Cr) showed lower exceedance rates overall, particularly Cr, which almost never exceeded thresholds in soils with pH > 6.5. These findings align with the existing literature. Extensive studies confirm that Cd bioavailability in acidic soils increases significantly due to its enhanced transformation from mineral-bound to exchangeable fractions under low pH conditions. Soil pH shows a strong negative correlation with Cd content in mining areas of Hunan, while rice Cd accumulation is positively associated with HCl-extractable Cd, underscoring the importance of Cd bioavailability as a key factor in crop uptake [41]. Cd exceedance rates are significantly higher in acidic soils compared to neutral and alkaline soils in industrial regions of Hunan [42]. In the Xiangjiang River Basin, spatial heterogeneity of soil Cd distribution is largely driven by variations in soil pH and mining intensity, whereas arsenic (As) and lead (Pb) exhibit lower mobility and contamination potential under acidic soil conditions [43].
Notably, most of our sampling sites were located at elevations below 200 m, where we observed a more frequent exceedance of cadmium (Cd) thresholds. This pattern is likely due to topography-driven drainage from surrounding mining and industrial zones into low-lying paddy fields [44].

4.2. Feature Importance Analysis

Using the Random Forest model (RF), this study evaluated 36 variables and identified soil-available Cd as the dominant driver of rice Cd accumulation (Figure 4). Available Cd ranked first, with a score of 122,218.8 (9.74% contribution), far surpassing the total Cd of 83,907.7 (6.6%), confirming the superior predictive value of bioavailability over total content. CaCl2-extractable Cd has been shown to exhibit a strong positive correlation with rice Cd accumulation in acidic soils, whereas total Cd exerts a limited influence on grain Cd levels [45,46]. Moreover, DTPA-extractable Cd has also been shown to correlate more strongly with rice grain Cd concentrations than total soil Cd, indicating its superior predictive ability for Cd accumulation in rice [47].
Precipitation during early and late grain-filling stages ranked second and third, jointly contributing 23.5%. Rainfall enhances Cd mobility via leaching, critically influencing bioavailability during crop growth. This pattern may be explained by precipitation-induced fluctuations in soil redox potential and pH, which are particularly pronounced under acidic conditions and can lead to increased Cd activation [48]. Mechanistic evidence from pot experiments further supports this explanation, showing that conventional water management practices—characterized by flooding during vegetative growth, drainage after tillering, and further drainage during mid-to-late grain-filling—result in approximately 98% of grain Cd accumulation occurring during the grain-filling stage. This finding highlights the critical role of precipitation during the late grain-filling period in influencing Cd uptake in rice.
Geographic and anthropogenic factors also contributed indirectly. Elevation and Enterprise Density reflected elevated Cd risks in low-altitude alluvial plains due to industrial emissions and topographic convergence. Topography and industrial activities have been shown to jointly influence rhizospheric Cd bioavailability, thereby affecting heavy metal uptake by rice [49]. SOM plays a critical role in regulating Cd uptake in rice by influencing the bioavailability of soil Cd, thereby indirectly controlling Cd accumulation in rice grains. A study conducted in Zhejiang Province demonstrated that higher SOM content significantly reduced soluble Cd concentrations in soil, leading to a notable decrease in Cd levels in rice grains [50]. Similarly, another experiment found that the addition of 2% organic materials to soil markedly reduced Cd accumulation in salt-tolerant rice varieties, with even more pronounced effects in non-salt-tolerant varieties. This highlights the synergistic mitigation effect of increased soil pH and SOM enhancement on Cd contamination [51]. Furthermore, the combined application of organic and inorganic amendments (e.g., farmyard manure and lime) effectively converted exchangeable Cd into organic-bound Cd in soil, thereby reducing its enrichment in rice grains [52]. Increased road density is typically associated with higher traffic intensity, resulting in Cd deposition from vehicle exhaust, tire wear particles, and brake linings in adjacent areas. A study on paddy fields along National Highway 319 revealed that soil Cd concentrations near the road were significantly higher than those in control areas farther away, with contamination primarily concentrated in the topsoil [53]. Importantly, this study also identified a significant positive correlation between Cd content in rice grains and soil Cd levels near roads, indicating that traffic-derived emissions are a key external factor contributing to Cd accumulation in rice. Therefore, in regions with high road density, enhancing soil Cd monitoring and implementing pollution control measures are essential to ensure rice safety.
Finally, agronomic management measures exhibited low importance scores (<0.1%). The limited contribution of agronomic management variables (e.g., lime application, foliar blockers) may be attributed to their binary encoding (0/1), which does not reflect critical contextual factors such as application dosage, timing, and frequency. This simplification likely masked the true impact of these interventions. In addition, passivators such as biochar have been shown to effectively reduce Cd bioavailability; however, their efficacy varies considerably across different soil types and agronomic management conditions [54]. In future studies, using more detailed quantitative or ordinal encoding schemes may enhance the models’ capacity to capture the nuanced effects of such practices.

4.3. Model Prediction Outcomes

Despite its success in computer vision, ResNet underperformed in our tabular dataset compared to RF and GBDT. This may be due to the following fundamental architectural mismatch: ResNet is optimized for image-like data with spatial locality and hierarchical patterns, while tabular data often lack such structured correlations. In high-dimensional environmental datasets, features are typically heterogeneous and uncorrelated, reducing the benefit of deep residual connections. Moreover, deep neural networks are more sensitive to limited sample sizes per feature and may require extensive hyperparameter tuning to avoid underfitting or overfitting. These factors likely contributed to the inferior performance of ResNet in our scenario [55].
The predictive performance of our RF model (R2 = 0.62) reflects a deliberate balance between generalizability and mechanistic clarity. While certain studies have reported higher accuracies (e.g., R2 > 0.8), these often rely on narrowly defined features, such as total soil Cd and pH [21], or focus on bioaccessibility prediction using speciation-specific data like DGT and BCR-extractable Cd [56]. Such approaches benefit from direct mechanistic relevance to plant uptake, but are limited in scope and field applicability. In contrast, our model integrates a broader feature set—including climate variables, varietal traits, and agronomic practices (52,000 samples). This scale and diversity enhances model robustness under real-world heterogeneity, but also introduces complex nonlinear interactions that can dilute prediction accuracy. Moreover, unlike studies that focus solely on available Cd derived from soil properties [57], our model targets actual grain Cd accumulation, which is influenced by both soil chemistry and farm-level interventions. The inclusion of management factors such as lime application, foliar blockers, and low-Cd cultivars enables a more practical decision-support tool, especially in regions with varied pollution sources and exposure pathways [58]. However, the absence of high-resolution speciation data (e.g., oxide-bound Cd fractions) remains a limiting factor for capturing fine-scale variation. Overall, the model’s performance demonstrates the challenges and trade-offs inherent in building scalable, field-relevant prediction tools for cadmium risk management in rice systems.
Studies reveal that micronutrients (e.g., K, Ca, Mg, Fe, Mn) critically influence rice Cd accumulation. Soil K, Ca, and Mg supply effectively reduce Cd content in rice tissues and limit its translocation, with Ca and Mg exhibiting the strongest antagonistic effects in grains [59,60,61,62]. Additionally, dynamic soil properties like pH and electrical conductivity modulate Cd bioavailability, regulating uptake and accumulation [63]. Current models treat environmental variables (e.g., precipitation, temperature) as static inputs, neglecting dynamic intra-seasonal processes (e.g., cumulative effects of precipitation timing during grain-filling on Cd activation) [64]. Furthermore, binary encoding of management measures (e.g., Foliar Blocker (1/0)) oversimplifies implementation details (e.g., dosage, timing), leading to underestimated heterogeneity in practice. For example, sampling sites with organic fertilizer application below 30% of recommended levels were still labeled as “1” (implemented), ignoring variations in intervention intensity and temporal dynamics [65].

4.4. Analysis of Field Validation Failure

The significant decline in model performance on the 2023 validation set (Yizhang R2 = −0.12; Lengshuitan R2 = −0.31) suggests the presence of covariate shift, where the joint distributions of input variables differ between training and test environments. Potential sources include regional differences in soil types, microclimates, crop varieties, and management practices not fully captured by the input features. As a result, the model trained on one spatiotemporal context fails to generalize to others. This highlights the necessity of incorporating dynamic or adaptive modeling techniques to mitigate distribution mismatches in agricultural applications [66].
In this study, Yizhang was excluded from the training set, while Lengshuitan contributed only 781 samples (1.4% of the original dataset). The training data covering these two regions are insufficient, so the model may be more influenced by the Cd accumulation patterns of rice in other regions. Disparities in soil properties and environmental variable distributions between regions induced covariate shift, degrading model generalizability [67]. Meanwhile, the temporal distance between training and prediction phases poses a fundamental challenge in environmental machine learning applications, particularly when dynamic systems are modeled using static historical data [68]. This shift arises not merely from data aging, but from structural changes in environmental variables, anthropogenic interventions, and latent policy-driven dynamics that alter the joint distribution of features and outcomes over time. As models are typically trained under the assumption of independently and identically distributed data, such temporal shifts violate this assumption, leading to significant reductions in predictive accuracy [69]. Training data originated from Hunan Province’s soil heavy metal remediation projects (2014–2016), which employed technologies such as increased the application of organic fertilizer, flooded irrigation, and lime application for pH adjustment [70]. However, these agronomic measures may take several years to show significant effects. They may not yield observable results in the early implementation stage, and thus the patterns cannot be captured by the prediction model [71,72]
Despite leveraging 57,200 samples and 36 variables—with the RF performance (R2 = 0.62) approaching theoretical limits—dynamic environmental shifts, latent variables, and covariate shift collectively create a theory–practice gap [73]. Merely increasing the sample size or model complexity cannot fundamentally resolve this issue; future works must prioritize developing regression models with an enhanced generalization capacity [74].

4.5. Future Perspectives

An analysis of 37,893 samples reveals potential overestimation of machine learning’s generalizability in rice Cd prediction. Significant discrepancies between model predictions and field observations underscore the necessity for future studies to prioritize real-world validation alongside test set accuracy. For precise Cd content prediction (beyond risk classification) [75], we propose a “site-specific and period-specific modeling” strategy as follows. (1) Modeling data should originate from homogeneous regions, avoiding cross-regional integration, with temporal spans ≤ 3 years unless no recent remediation projects exist [76]. (2) Data should be recorded as continuous numerical values rather than encoded variables. For instance, lime application rates should be documented as kilograms per hectare (kg ha−1), not merely as a binary indicator of application presence/absence. (3) Soil trace elements, particularly Fe and Mn concentrations, must be included alongside routine physicochemical properties. This approach enables farm operators to leverage machine learning for accurate prediction of rice heavy metal concentrations in upcoming seasons, thereby enabling cost-effective monitoring.
To empirically validate this strategy, we constructed a Random Forest model using 2020 to 2022 data from Yizhang County, following identical modeling procedures. Validation with 2023 data revealed that the regional model achieved significantly improved accuracy despite utilizing a substantially smaller training dataset compared to the provincial-scale model. This outcome underscores the promise of location-specific modeling strategies (Figure 5).

5. Conclusions

This study evaluated the performance and applicability of three machine learning models—Random Forest (RF), Gradient Boosting Decision Tree (GBDT), and Residual Neural Network (ResNet)—for predicting cadmium (Cd) accumulation in rice. A dataset of 57,200 soil–rice paired samples and 36 multi-source environmental variables from nine prefecture-level cities in Hunan Province was used. Among the models, RF achieved the highest test set performance (R2 = 0.62), demonstrating the potential of data-driven methods for large-scale Cd risk prediction under controlled settings.
Independent validation using 2023 samples from Yizhang and Lengshuitan (n = 393) revealed a sharp performance decline (R2 = −0.12 and −0.31), highlighting poor temporal extrapolation and spatial transferability. This weakness stems from environmental heterogeneity and oversimplified variable encoding—particularly for agronomic measures such as lime application, which were represented as binary values without capturing dosage or timing. These limitations underscore the vulnerability of static data-driven models in dynamic agricultural systems.
To overcome these challenges, future studies should develop hybrid models that integrate soil chemistry, crop physiology, and hydrological processes. Real-time data assimilation and temporal-sensitive feature engineering (e.g., encoding management timing) are needed to capture latent variables. Localized “one-site-one-model” frameworks and standardized farmland environmental datasets will also be essential. Our findings emphasize the importance of combining data-driven and mechanistic approaches to improve the reliability of AI applications in food safety and environmental risk prediction.

Supplementary Materials

The following supporting information can be downloaded at: https://www.mdpi.com/article/10.3390/agronomy15061478/s1, Section S1. Data acquisition details: Figure S1. Procedure for downloading elevation data from the Geospatial Data Cloud platform. Figure S2. Procedure for acquiring soil and rock classification data from ISRIC-SOTER and visualization in ArcGIS. Figure S3. Workflow for extracting river system water quality classification from MEE and linking with sampling points in ArcGIS. Section S2. Detailed rice cultivars used in this study.

Author Contributions

J.-F.G.: funding acquisition, writing—review and editing, and supervision. Q.-Q.P.: data curation, formal analysis, investigation, software, and writing—original draft. X.Z.: methodology. R.Z.: funding acquisition, writing—review and editing, and supervision. Z.-Y.H.: methodology. H.Z.: funding acquisition, data curation, and supervision. P.Z.: supervision. L.H.: supervision. Y.L.: methodology. All authors have read and agreed to the published version of the manuscript.

Funding

This work was funded by the National Key Research and Development Program of China (2022YFD1700104-01), the National Key Research and Development Program of China (2024YFC3713900), the Furong Program Huanbaoqiao Enterprise Team on Science & Technology Innovation and Entrepreneurship of Hunan Province, and the Changsha Enterprise Science and Technology Commissioner Project (No. CSKJFZ0117).

Data Availability Statement

Data is contained within the article and Supplementary Material.

Conflicts of Interest

Authors Lu Hu and Jiao-Feng Gu were employed by the company Hunan Huanbaoqiao Ecology and Environment Engineering Co., Ltd. The remaining authors declare that the research was conducted in the absence of any commercial or financial relationships that could be construed as a potential conflict of interest.

References

  1. Karalija, E.; Selović, A.; Bešta-Gajević, R. Thinking for the future: Phytoextraction of cadmium using primed plants for sustainable soil clean-up. Physiol. Plant. 2022, 174, e13739. [Google Scholar] [CrossRef] [PubMed]
  2. Gao, J.; Ye, X.; Wang, X. Derivation and validation of thresholds of cadmium, chromium, lead, mercury and arsenic for safe rice production in paddy soil. Ecotoxicol. Environ. Saf. 2021, 220, 112404. [Google Scholar] [CrossRef] [PubMed]
  3. Mubeen, S.; Ni, W.; He, C. Agricultural strategies to reduce cadmium accumulation in crops for food safety. Agriculture 2023, 13, 471. [Google Scholar] [CrossRef]
  4. GB 2762-2022; National Food Safety Standard—Maximum Levels of Contaminants in Foods. National Health Commission of the People’s Republic of China and State Administration for Market Regulation: Beijing, China, 2022.
  5. Sun, J.; Shao, Y.; He, G. Statement on establishment of a provisional health-based guidance value for dietary exposure to cadmium in China. China CDC Weekl. 2023, 5, 499. [Google Scholar] [CrossRef]
  6. Li, X.; Du, J.; Sun, L. Derivation of soil criteria of cadmium for safe rice production applying soil–plant transfer model and species sensitivity distribution. Int. J. Environ. Res. Public Health 2022, 19, 8854. [Google Scholar] [CrossRef]
  7. Mamun, S.A.; Sultana, N.; Hasan, M. Phytoaccumulation of cadmium in leafy vegetables grown in contaminated soil under varying rates of compost and phosphate fertilizer application. Commun. Soil Sci. Plant Anal. 2021, 52, 2161–2176. [Google Scholar] [CrossRef]
  8. Majeed, A.; Niaz, A.; Rizwan, M. Effects of biochar, farm manure, and pressmud on mineral nutrients and cadmium availability to wheat (Triticum aestivum L.) in Cd-contaminated soil. Physiol. Plant. 2021, 173, 191–200. [Google Scholar] [CrossRef]
  9. Zhao, X.; Lei, M.; Gu, R. Knowledge mapping of the phytoremediation of cadmium-contaminated soil: A bibliometric analysis from 1994 to 2021. Int. J. Environ. Res. Public Health 2022, 19, 6987. [Google Scholar] [CrossRef]
  10. Al Mamun, S.; Saha, S.; Ferdush, J. Cadmium contamination in agricultural soils of Bangladesh and management by application of organic amendments: Evaluation of field assessment and pot experiments. Environ. Geochem. Health 2021, 43, 3557–3582. [Google Scholar] [CrossRef]
  11. Subašić, M.; Šamec, D.; Selović, A. Phytoremediation of cadmium polluted soils: Current status and approaches for enhancing. Soil Syst. 2022, 6, 3. [Google Scholar] [CrossRef]
  12. Dai, Z.W.; Fang, C.; Sun, B. Cadmium accumulation characteristics and impacting factors of different rice varieties under paddy soils with high geological backgrounds. Huanjing Kexue 2021, 42, 2016–2023. [Google Scholar] [PubMed]
  13. Li, L.; Ma, L.; Tang, L. Key factors controlling cadmium and lead contents in rice grains of plants grown in soil with different cadmium levels from an area with typical karst geology. Agronomy 2024, 14, 2076. [Google Scholar] [CrossRef]
  14. Zhou, J.; Xia, R.; Landis, J.D. Isotope evidence for rice accumulation of newly deposited and soil legacy cadmium: A three-year field study. Environ. Sci. Technol. 2024, 58, 17283–17294. [Google Scholar] [CrossRef] [PubMed]
  15. Zhang, Y.; Fu, T.; Chen, X. Modeling cadmium contents in a soil–rice system and identifying potential controls. Land 2022, 11, 617. [Google Scholar] [CrossRef]
  16. Niu, S.; Li, Y.L.; Yang, Y. Prediction of cadmium uptake factor in wheat based on machine learning. Huanjing Kexue 2023, 44, 3619–3626. [Google Scholar]
  17. Keçeci, M.; Gökmen, F.; Usul, M. Prediction of cadmium content using machine learning methods. Environ. Earth Sci. 2024, 83, 362. [Google Scholar] [CrossRef]
  18. Miao, X.; Miao, Y.; Gong, H. NIR spectroscopy coupled with chemometric algorithms for the prediction of cadmium content in rice samples. Spectrochim. Acta A Mol. Biomol. Spectrosc. 2021, 257, 119700. [Google Scholar] [CrossRef]
  19. Chen, R.; Cheng, N.; Ding, G. Predictive model for cadmium uptake by maize and rice grains on the basis of bioconcentration factor and the diffusive gradients in thin-films technique. Environ. Pollut. 2021, 289, 117841. [Google Scholar] [CrossRef]
  20. Yang, Y.; Li, C.; Yang, Z. Application of cadmium prediction models for rice and maize in the safe utilization of farmland associated with tin mining in Hezhou, Guangxi, China. Environ. Pollut. 2021, 285, 117202. [Google Scholar] [CrossRef]
  21. Zhao, B.; Zhu, W.; Hao, S. Prediction of heavy metals accumulation risk in rice using machine learning and mapping pollution risk. J. Hazard. Mater. 2023, 448, 130879. [Google Scholar] [CrossRef]
  22. Wang, C.; Zhang, Z.; Zhang, J. The effect of terrain factors on rice production: A case study in Hunan Province. J. Geogr. Sci. 2019, 29, 287–305. [Google Scholar] [CrossRef]
  23. Hu, Z.; Zheng, W.W.; Liu, P.L. The forms and structures of traditional landscape genome maps: A case study of Hunan Province. Acta Geogr. Sin. 2018, 73, 317–332. [Google Scholar]
  24. Nelson, D.W.; Sommers, L.E. Total carbon, organic carbon, and organic matter. Methods Soil Anal. Part 3 Chem. Methods 1996, 5, 961–1010. [Google Scholar]
  25. Kahr, G.; Madsen, F.T. Determination of the cation exchange capacity and the surface area of bentonite, illite and kaolinite by methylene blue adsorption. Appl. Clay Sci. 1995, 9, 327–336. [Google Scholar] [CrossRef]
  26. Zeng, P.; Wei, B.; Zhou, H. Co-application of water management and foliar spraying silicon to reduce cadmium and arsenic uptake in rice: A two-year field experiment. Sci. Total Environ. 2022, 818, 151801. [Google Scholar] [CrossRef]
  27. Gómez-Ariza, J.L.; Sánchez-Rodas, D.; Giráldez, I. A comparison between ICP-MS and AFS detection for arsenic speciation in environmental samples. Talanta 2000, 51, 257–268. [Google Scholar] [CrossRef]
  28. Han, L.; Zhao, Z.; Li, J. Application of humic acid and hydroxyapatite in Cd-contaminated alkaline maize cropland: A field trial. Sci. Total Environ. 2023, 859, 160315. [Google Scholar] [CrossRef]
  29. Hastie, T.; Tibshirani, R.; Friedman, J.H. The Elements of Statistical Learning: Data Mining, Inference, and Prediction; Springer: New York, NY, USA, 2009. [Google Scholar]
  30. Peng, S.; Gang, C.; Cao, Y. Assessment of climate change trends over the Loess Plateau in China from 1901 to 2100. Int. J. Climatol. 2018, 38, 2250–2264. [Google Scholar] [CrossRef]
  31. Peng, S.; Ding, Y.; Liu, W. 1 km monthly temperature and precipitation dataset for China from 1901 to 2017. Earth Syst. Sci. Data 2019, 11, 1931–1946. [Google Scholar] [CrossRef]
  32. Dong, M.; Yao, L.; Wang, X. Gradient boosted neural decision forest. IEEE Trans. Serv. Comput. 2021, 16, 330–342. [Google Scholar] [CrossRef]
  33. Yunianta, A.; Wulandhari, L.A.; Desnelita, Y. Enhancing rice production prediction in Indonesia using advanced machine learning models. IEEE Access 2024, 12, 151161–151177. [Google Scholar]
  34. Lingwal, S.; Bhatia, K.K.; Singh, M. A novel machine learning approach for rice yield estimation. J. Exp. Theor. Artif. Intell. 2024, 36, 337–356. [Google Scholar] [CrossRef]
  35. Sinha, D.; Dasmandal, T.; Yeasin, M. GB5mCPred: Cross-species 5mc site predictor based on bootstrap-based stochastic gradient boosting method for Poaceae. Curr. Bioinform. 2025, 20, 139–148. [Google Scholar] [CrossRef]
  36. Dangi, S.L.; Karaliūtė, V.; Maurya, N.K. Predicting flow in porous media: A comparison of physics-driven neural network approaches. Math. Model. Eng. 2023, 9, 52–71. [Google Scholar] [CrossRef]
  37. Zhang, Z.; Zhu, X.; Liu, D. Model of gradient boosting random forest prediction. In Proceedings of the 2022 IEEE International Conference on Networking, Sensing and Control (ICNSC), Shanghai, China, 15–18 December 2022; pp. 1–6. [Google Scholar]
  38. Khan, R.U.; Zhang, X.; Kumar, R. Evaluating the performance of ResNet model based on image recognition. In Proceedings of the 2018 International Conference on Computing and Artificial Intelligence, Chengdu, China, 12–14 March 2018; pp. 86–90. [Google Scholar]
  39. Liang, J. Image classification based on ResNet. J. Phys. Conf. Ser. 2020, 1634, 012110. [Google Scholar] [CrossRef]
  40. GB 15618-2018; Soil Environment Quality—Risk Control Standard for Soil Contamination of Agricultural Land. Ministry of Environmental Protection of China: Beijing, China, 2018.
  41. Du, Y.; Hu, X.F.; Wu, X.H. Effects of mining activities on Cd pollution to the paddy soils and rice grain in Hunan province, Central South China. Environ. Monit. Assess. 2013, 185, 9843–9856. [Google Scholar] [CrossRef]
  42. Wang, M.; Chen, W.; Peng, C. Risk assessment of Cd-polluted paddy soils in the industrial and township areas in Hunan, Southern China. Chemosphere 2016, 144, 346–351. [Google Scholar] [CrossRef]
  43. Yu, Y.; Luo, H.; He, L. Level, source, and spatial distribution of potentially toxic elements in agricultural soil of typical mining areas in Xiangjiang River Basin, Hunan Province. Int. J. Environ. Res. Public Health 2020, 17, 5793. [Google Scholar] [CrossRef]
  44. Fang, X.; Peng, B.; Wang, X. Distribution, contamination and source identification of heavy metals in bed sediments from the lower reaches of the Xiangjiang River in Hunan Province, China. Sci. Total Environ. 2019, 689, 557–570. [Google Scholar] [CrossRef]
  45. Huang, B.Y.; Lü, Q.X.; Tang, Z.X. Machine learning methods to predict cadmium (Cd) concentration in rice grain and support soil management at a regional scale. Fundam. Res. 2024, 4, 1196–1205. [Google Scholar] [CrossRef]
  46. Chen, J.; Zheng, C.; Ruan, J.; Zhang, C.; Ge, Y. Cadmium bioavailability and accumulation in rice grain are controlled by pH and Ca in paddy soils with high geological background of transportation and deposition. Bull. Environ. Contam. Toxicol. 2021, 106, 92–98. [Google Scholar]
  47. Xiao, W.; Ye, X.; Zhu, Z. Evaluation of cadmium (Cd) transfer from paddy soil to rice (Oryza sativa L.) using DGT in comparison with conventional chemical methods: Derivation of models to predict Cd accumulation in rice grains. Environ. Sci. Pollut. Res. 2020, 27, 14953–14962. [Google Scholar] [CrossRef] [PubMed]
  48. Zhao, F.J.; Wang, P. Arsenic and cadmium accumulation in rice and mitigation strategies. Plant Soil 2020, 446, 1–21. [Google Scholar] [CrossRef]
  49. Hou, D.; Wang, R.; Gao, X. Cultivar-specific response of bacterial community to cadmium contamination in the rhizosphere of rice (Oryza sativa L.). Environ. Pollut. 2018, 241, 63–73. [Google Scholar] [CrossRef]
  50. Zhao, K.L.; Fu, W.J.; Dai, W.; Ye, Z.Q.; Gao, W. Characteristics and quantitative model of heavy metal transfer in soil-rice systems in typical rice production areas of Zhejiang Province. Chin. J. Eco-Agric. 2016, 24, 226–234. [Google Scholar]
  51. Hossain, M.Z.; Islam, M.A.; Kibria, K.Q. Effects of soil pH and organic matter on the accumulation of cadmium in the grains of salt-tolerant rice genotypes grown in Cd-contaminated soil. Khulna Univ. Stud. 2024, 1, 120–131. [Google Scholar] [CrossRef]
  52. Li, B.; Yang, L.; Wang, C.Q. Effects of organic-inorganic amendments on the cadmium fraction in soil and its accumulation in rice (Oryza sativa L.). Environ. Sci. Pollut. Res. 2019, 26, 13762–13772. [Google Scholar] [CrossRef]
  53. Lin, J.; Du, Z.; Chen, J. Distribution of cadmium and lead in soil and rice along road polluted by traffic exhaust. J. Environ. Health 1992, 9, 1–10. [Google Scholar]
  54. Zhang, M.; Shan, S.; Chen, Y. Biochar reduces cadmium accumulation in rice grains in a tungsten mining area—Field experiment: Effects of biochar type and dosage, rice variety, and pollution level. Environ. Geochem. Health 2019, 41, 43–52. [Google Scholar] [CrossRef]
  55. He, F.; Liu, T.; Tao, D. Why resnet works? residuals generalize. IEEE Trans. Neural Netw. Learn. Syst. 2020, 31, 5349–5362. [Google Scholar] [CrossRef]
  56. Xie, K.; Ou, J.; He, M. Predicting the bioaccessibility of soil Cd, Pb, and As with advanced machine learning for continental-scale soil environmental criteria determination in China. Environ. Health 2024, 2, 631–641. [Google Scholar] [CrossRef] [PubMed]
  57. Huang, J.; Fan, G.; Liu, C. Predicting soil available cadmium by machine learning based on soil properties. J. Hazard. Mater. 2023, 460, 132327. [Google Scholar] [CrossRef] [PubMed]
  58. Zhou, Y.M.; Long, S.S.; Li, B.Y. Enrichment of cadmium in rice (Oryza sativa L.) grown under different exogenous pollution sources. Environ. Sci. Pollut. Res. 2020, 27, 44249–44256. [Google Scholar] [CrossRef] [PubMed]
  59. Deng, X.; Chen, Y.; Yang, Y. Cadmium accumulation in rice (Oryza sativa L.) alleviated by basal alkaline fertilizers followed by topdressing of manganese fertilizer. Environ. Pollut. 2020, 262, 114289. [Google Scholar] [CrossRef]
  60. Hu, K.; Yu, H.; Feng, W.Q. Effects of secondary, micro- and beneficial elements on rice growth and cadmium uptake. Acta Ecol. Sin. 2011, 31, 2341–2348. [Google Scholar]
  61. Li, X.; Teng, L.; Fu, T. Comparing the effects of calcium and magnesium ions on accumulation and translocation of cadmium in rice. Environ. Sci. Pollut. Res. 2022, 29, 41628–41639. [Google Scholar] [CrossRef]
  62. Zhang, J.; Kong, F.Y.; Lu, S.G. Remediation effect and mechanism of inorganic passivators on cadmium-contaminated acidic paddy soil. Huanjing Kexue 2022, 43, 4679–4686. [Google Scholar]
  63. Wu, J.; Li, R.; Lu, Y. Sustainable management of cadmium-contaminated soils as affected by exogenous application of nutrients: A review. J. Environ. Manag. 2021, 295, 113081. [Google Scholar] [CrossRef]
  64. Li, S.; Huang, X.; Li, G. Effects of mineral-based potassium humate on cadmium accumulation in rice (Oryza sativa L.) under three levels of cadmium-contaminated alkaline soils. Sustainability 2023, 15, 2836. [Google Scholar] [CrossRef]
  65. Islam, M.S.; Magid, A.S.I.A.; Chen, Y. Effect of calcium and iron-enriched biochar on arsenic and cadmium accumulation from soil to rice paddy tissues. Sci. Total Environ. 2021, 785, 147163. [Google Scholar] [CrossRef]
  66. Rezaei, A.; Liu, A.; Memarrast, O.; Ziebart, B.D. Robust fairness under covariate shift. In Proceedings of the AAAI Conference on Artificial Intelligence, Vancouver, Canada, 2–9 February 2021; Volume 35, pp. 9419–9427. [Google Scholar]
  67. Magahud, J.C.; Badayos, R.B.; Sanchez, P.B. Levels and sources of potassium, calcium, sulfur, iron and manganese in major paddy soils of the Philippines. Int. J. Philipp. Sci. Technol. 2015, 8, 1–8. [Google Scholar] [CrossRef]
  68. Liang, J.; He, R.; Tan, T. A comprehensive survey on test-time adaptation under distribution shifts. Int. J. Comput. Vis. 2025, 133, 31–64. [Google Scholar] [CrossRef]
  69. Acevedo, N.; Cortez, C.; Brooks, C. Fairness Hub Technical Briefs: Definition and detection of distribution shift. arXiv 2024, arXiv:2405.14186. [Google Scholar]
  70. Jiang, X.J.; Luo, Y.M.; Liu, Q. Effects of cadmium on nutrient uptake and translocation by Indian mustard. Environ. Geochem. Health 2004, 26, 319–324. [Google Scholar] [CrossRef]
  71. Zhu, Y.X.; Zhuang, Y.; Sun, X.H. Interactions between cadmium and nutrients and their implications for safe crop production in Cd-contaminated soils. Crit. Rev. Environ. Sci. Technol. 2023, 53, 2071–2091. [Google Scholar] [CrossRef]
  72. Sarwar, N.; Saifullah; Malhi, S.S. Role of mineral nutrition in minimizing cadmium accumulation by plants. J. Sci. Food Agric. 2010, 90, 925–937. [Google Scholar] [CrossRef]
  73. Mao, P.; Zhuang, P.; Li, F. Phosphate addition diminishes the efficacy of wollastonite in decreasing Cd uptake by rice (Oryza sativa L.) in paddy soil. Sci. Total Environ. 2019, 687, 441–450. [Google Scholar] [CrossRef]
  74. Patchipala, S. Tackling data and model drift in AI: Strategies for maintaining accuracy during ML model inference. Int. J. Sci. Res. Arch. 2023, 10, 1198–1209. [Google Scholar] [CrossRef]
  75. Bhindhu, P.S.; Sureshkumar, P.; Abraham, M. Effect of liming on soil properties, nutrient content and yield of wetland rice in acid tropical soils of Kerala. Int. J. Bio-Resour. Stress Manag. 2018, 9, 541–546. [Google Scholar]
  76. Suksabye, P.; Pimthong, A.; Dhurakit, P. Effect of biochars and microorganisms on cadmium accumulation in rice grains grown in Cd-contaminated soil. Environ. Sci. Pollut. Res. 2016, 23, 962–973. [Google Scholar] [CrossRef]
Figure 1. Sampling Site Distribution.
Agronomy 15 01478 g001
Figure 2. Methodological Workflow.
Agronomy 15 01478 g002
Figure 3. Feature Data Overview.
Agronomy 15 01478 g003
Figure 4. Feature Importance Analysis.
Agronomy 15 01478 g004
Figure 5. Model Performance Comparison. (a) R2 values for RF, GBDT, and ResNet models using 36 and 12 features, with gray bars indicating the performance drop (ΔR2) from training to test sets; (b) training set prediction accuracy of the RF model with 36 features; (c) test set prediction accuracy of the RF model with 36 features. Due to the large sample size, only 2000 points were randomly selected for visualization in (b,c). (d) Regional-scale model prediction results for Yizhang and Lengshuitan areas. (e) Prediction results from the Random Forest model developed exclusively for Yizhang using the location-specific modeling strategy.
Agronomy 15 01478 g005
Table 1. Summary of Variable Categories, Data Sources, Processing Methods, and Screening Criteria for Rice Grain Cd Prediction Model.
CategoryVariablesData SourceProcessing MethodScreening Criteria
Soil PropertiespH, SOM, CEC, Total_Cd, Available_Cd (CaCl2/HCl/EDTA/DTPA)52,000 paired soil–rice samples (Hunan Province, 2014–2016)Air-dried, sieved (2 mm/0.149 mm)Excluded samples with pH > 9
ICP-AES for Cd quantificationRemoved outliers (3σ Law)
Agronomic PracticesLow-Cd variety (binary), Water management (binary), Lime application (binary)Field surveys and government reports (2014–2016)Ordinal encoding for categorical variables (e.g., variety types)Excluded records with >30% missing values
Binary (0/1)Manual verification of farm records
Environmental DataPrecipitation (early/late-filling), Elevation, Enterprise densityRemote sensing (NOAA, Peng et al. 2019 [30,31]), GIS (ArcGIS), POI mining (Baidu Map)Z-score normalizationRemoved pixels with cloud cover >20%
Spatial interpolation (kriging)Excluded non-agricultural land use
Geospatial FeaturesRiver proximity, Road density, Mining activity intensityNational Geospatial Database (2021), OSM road networkKernel density estimationBuffered zones > 5 km from industrial areas excluded
Euclidean distance calculation
Table 2. Heavy metal exceedance rates in soils across pH ranges.
pH SamplesCdHgAsPbCr
<5.544%64%1.80%3.00%12%0.17%
5.5–6.544%44%2.10%3.40%3.50%0.20%
6.5–7.510%34%1.40%9.10%1.00%0.00%
>7.52.00%28%0.70%31%0.80%0.00%
Note: Exceedance rates are based on GB15618-2018 thresholds. Cd = Cadmium; Hg = Mercury; As = Arsenic; Pb = Lead; Cr = Chromium.
Disclaimer/Publisher’s Note: The statements, opinions and data contained in all publications are solely those of the individual author(s) and contributor(s) and not of MDPI and/or the editor(s). MDPI and/or the editor(s) disclaim responsibility for any injury to people or property resulting from any ideas, methods, instructions or products referred to in the content.

