Article

The Adaptability of Different Wheat Varieties to Deep Sowing in Henan Province of China

1
Wheat Research Institute, Henan Academy of Agricultural Sciences, Postgraduate T&R Base of Zhengzhou University, Zhengzhou 450002, China
2
School of Agricultural Sciences, Zhengzhou University, Zhengzhou 450052, China
*
Authors to whom correspondence should be addressed.
These authors contributed equally to this work.
Agronomy 2025, 15(6), 1466; https://doi.org/10.3390/agronomy15061466
Submission received: 17 May 2025 / Revised: 10 June 2025 / Accepted: 13 June 2025 / Published: 16 June 2025

Abstract

:
Appropriate deep sowing holds significant potential in enhancing wheat production, particularly in dry and low-rainfall regions. Henan Province is a major winter wheat-producing area in China; evaluating the adaptability of wheat varieties to deep sowing through scientific methods is crucial to improve wheat production. This study investigates 26 wheat cultivars in Henan. By assessing key traits of seeds and seedlings at various sowing depths, we analyzed the effects of sowing depth on seed germination and seedlings. A comprehensive index for deep sowing tolerance was established using principal component analysis (PCA) and the membership function method, followed by the classification of the varieties according to their tolerance to deep sowing. The results indicated that, with increased sowing depth, seedling emergence time, coleoptile length, and coleoptile internode length increased, while seedling emergence rate, seedling height, leaf area, and shoot dry weight per unit area decreased. Based on PCA and membership function values, the 26 wheat varieties were classified into three categories: deep sowing tolerant, moderately tolerant, and intolerant, comprising 3, 19, and 4 varieties. This study provides valuable insights for optimizing wheat variety selection and improving sowing practices in Henan Province, offering both theoretical and practical contributions to local wheat production.

1. Introduction

Wheat (Triticum aestivum L.) is one of the world’s most important food crops, offering substantial nutritional and economic value [1,2]. As the largest producer and consumer of wheat globally, China plays a key role in the world’s wheat market, with Henan Province being a vital region for winter wheat production. The stability and improvement of wheat yields in this area are crucial for ensuring food security in China [3].
Seed germination and seedling emergence are critical factors that influence the number of productive tillers and the final yield of wheat [4]. Sowing depth is a critical factor that affects seed germination and seedling emergence. Previous studies have shown that deep sowing primarily influences germination and emergence by altering soil moisture and compaction. Excessive sowing depth can impede seedling emergence due to poor soil aeration, increased resistance during emergence, and excessive nutrient consumption during soil penetration [5,6]. On the other hand, shallow sowing may lead to rapid evaporation of surface soil moisture, potentially causing seeds to absorb insufficient water and lose their ability to germinate. An optimal sowing depth can improve seedling emergence by enhancing the availability of soil moisture, particularly in dry or low-rainfall regions [7,8]. Furthermore, moderate deep sowing can reduce the negative impacts of seed predation by rodents and birds, which can further limit yield losses [9]. In practical production, improper land preparation or inaccurate seeder calibration often leads to excessive sowing depth, resulting in poor emergence quality. Therefore, selecting deep-sowing-tolerant wheat varieties and adopting appropriate sowing depths can mitigate adverse effects from meteorological factors like drought, as well as challenges related to seed predation and poor sowing practices.
Accurately assessing the adaptability of different wheat varieties to deep sowing is critical for selecting varieties best suited for such conditions [10,11]. Wheat varieties bred in different regions may not be suitable for cultivation across diverse ecological zones, as ecological and climatic conditions limit the adaptability of wheat varieties [12,13]. Henan Province is located in the transitional zone between the warm temperate and subtropical zones, characterized by distinct four seasons, and the annual average precipitation ranges from 512.6 to 1133.3 mm, simultaneous occurrence of rainfall and heat, and complex diversity. Henan Province boasts a wealth of wheat varieties, with numerous varieties being released annually. However, there is currently no research on the deep-sowing adaptability of these varieties in the region. This study aims to assess the seedling emergence rate, emergence time, and morphological characteristics of 26 wheat varieties under different sowing depths. By analyzing the sensitivity of seed germination and seedling traits to deep sowing, this research will highlight varietal differences and classify the varieties based on their comprehensive response to deep sowing. The findings will provide a theoretical foundation for the rational use of deep-sowing-tolerant wheat varieties and improve sowing quality in Henan province of China.

2. Materials and Methods

2.1. Plant Materials and Growing Conditions

The experimental materials were 26 wheat varieties suitable for cultivation in Henan Province (Table 1), all of which were provided by the Wheat Research Institute of Henan Academy of Agricultural Sciences.
The experiment was conducted in February 2023 in the artificial climate greenhouse of Henan Academy of Agricultural Sciences, and the temperature in the greenhouse was controlled to 20–22 °C and humidity to 60%. Since the greenhouse is transparent, light intensity was not controlled and remained close to natural light conditions. The experiment was set at five sowing depths of 3 cm, 5 cm, 7 cm, 9 cm, and 11 cm. The soil was taken from the Modern Agricultural Science and Technology Experimental Demonstration Base of Henan Academy of Agricultural Sciences (Yuanyang, Henan, China, 35°00′ N, 113°40′ E), which has a high content of organic matter and is a weakly alkaline soil type. The sieved soil was packed into pots (25.1 cm × 13.1 cm × 14.6 cm), and 50 seeds were sown in each pot. Sterilized and treated wheat seeds of uniform size, full and free of defects, were selected and evenly sown on the moist soil surface (0 cm) and covered with soil for 3 cm, 5 cm, 7 cm, 9 cm, and 11 cm for natural germination according to the set depth, with three replications for each treatment. Fourteen days after sowing, rinse the soil in the pot with water. From each treatment, randomly select 10 healthy, well-developed seedlings of similar size and shape, and transfer them to the laboratory. Then, measure the growth parameters of the wheat seedlings.

2.2. Seedling Emergence Time and Emergence Rate

Observe the emergence time after sowing. The time of emergence was determined by the length of time when the number of wheat seedlings per pot exceeded 50%, or when the seedling height reached 2 cm (the number of seedlings did not reach 50%), counting from the time of sowing. Meanwhile, the seedling emergence rate (amount of seedlings/number of seeds sown × 100%) of each treatment group was counted.

2.3. Coleoptile Length, Coleoptile Internode and Seedling Height

The length between the seed and the coleoptile node was measured using a standard ruler and recorded as the coleoptile internode length. The length from the base of the coleoptile to the tip of the coleoptile was measured and recorded as the coleoptile length. The length from the coleoptile node to the tip of the leaf was measured and recorded as the plant height.

2.4. Latest Fully Expanded Leaf Area

Measure the length and width of the latest fully expanded leaf using a standard ruler, and calculate the area of the latest fully expanded leaf (length × width × 0.83) [14].

2.5. Shoot Dry Weight per Unit Area

The collected wheat seedlings were killed by heating at 105 °C for 15 min and then dried at 80 °C until a constant weight was achieved. The shoot dry weight of each plant was weighed and recorded. The shoot dry weight was expressed as the shoot dry weight part per unit area (shoot dry weight of a single plant × number of plants/sowing area).

2.6. Deep Sowing Resistance Coefficient (DSRC)

DSRC (%) = Deep sowing measurement/Control measurement × 100%

2.7. Membership Function Values of the Deep Sowing Resistance Coefficient of Each Trait

The membership function method was used to evaluate the deep sowing resistance coefficient of each trait of the 26 wheat varieties [15,16,17,18]. The formula is as follows:
UXj = (Xj − Xjmin)/(Xjmax − Xjmin)
Note: UXj represents the membership value of deep sowing tolerance for the J index of all materials, Xj represents the measured value of the J index of all materials, Xjmin represents the minimum value of the J index of all materials, and Xjmax represents the maximum value of the J index of all materials.

2.8. Weights of Comprehensive Indicators

Calculate the weights of the eigenvector obtained from the principal component analysis [17,18]. The formula is as follows:
W j = P j / j = 1 n P j     j = 1 , 2 n
Note: Wj represents the importance of the J composite indicator among all comprehensive indicators, and Pj is the contribution rate of the J comprehensive indicator of each variety.

2.9. Calculation of Comprehensive Deep Sowing Tolerance

D = j = 1 n [ U X j × W j ]     j = 1 , 2 n
Note: The D value is the comprehensive evaluation value of deep sowing tolerance of each variety under deep sowing conditions.

2.10. Statistical Analysis

The experimental data were organized, and the maximum value, minimum value, mean value, standard deviation (SD), standard error (SE), and coefficient of variation (CV) (=standard error/mean value) of all samples were calculated. Correlation analysis and principal component analysis were performed using SPSS 20.0. Principal components with eigenvalues greater than or equal to 1 in the principal component analysis were retained, and hierarchical cluster analysis was carried out on the results of the principal component analysis [19]. Data were plotted using GraphPad Prism 8.0.2 (San Diego, CA, USA) software.

3. Results

3.1. Effects of Sowing Depth on the Emergence Rate of Different Wheat Varieties

In this experiment, distinct differences were observed in the deep sowing tolerance and adaptability among the various wheat varieties (Figure A1). A comparison of emergence rates across different wheat varieties at various sowing depths (3 cm, 5 cm, 7 cm, 9 cm, and 11 cm) revealed a general decline in emergence rates with increasing sowing depth. However, the magnitude of this decline varied significantly among varieties (Figure 1A). As the sowing depth increased, the coefficient of variation in emergence rates also rose, from 4.9% at 3 cm to 22.27% at 11 cm (Table A1), indicating that the variation in emergence rates among varieties increased with greater sowing depths (Figure 1B). At a depth of 11 cm, the emergence rates of most wheat varieties fell below 80% (Figure 1A), and the seedlings exhibited symptoms such as yellowing and weak growth (Figure A2). Since seedling emergence rates below 80% render the varieties impractical for agricultural production. Consequently, a sowing depth of 9 cm can be considered the threshold for deep sowing treatment in wheat. In subsequent analyses of deep sowing tolerance and the evaluation of tolerant traits, 9 cm was used as the deep sowing treatment, with 3 cm serving as the control.

3.2. Effects of Deep Sowing on Wheat Germination Characteristics and Seedling Phenotypes

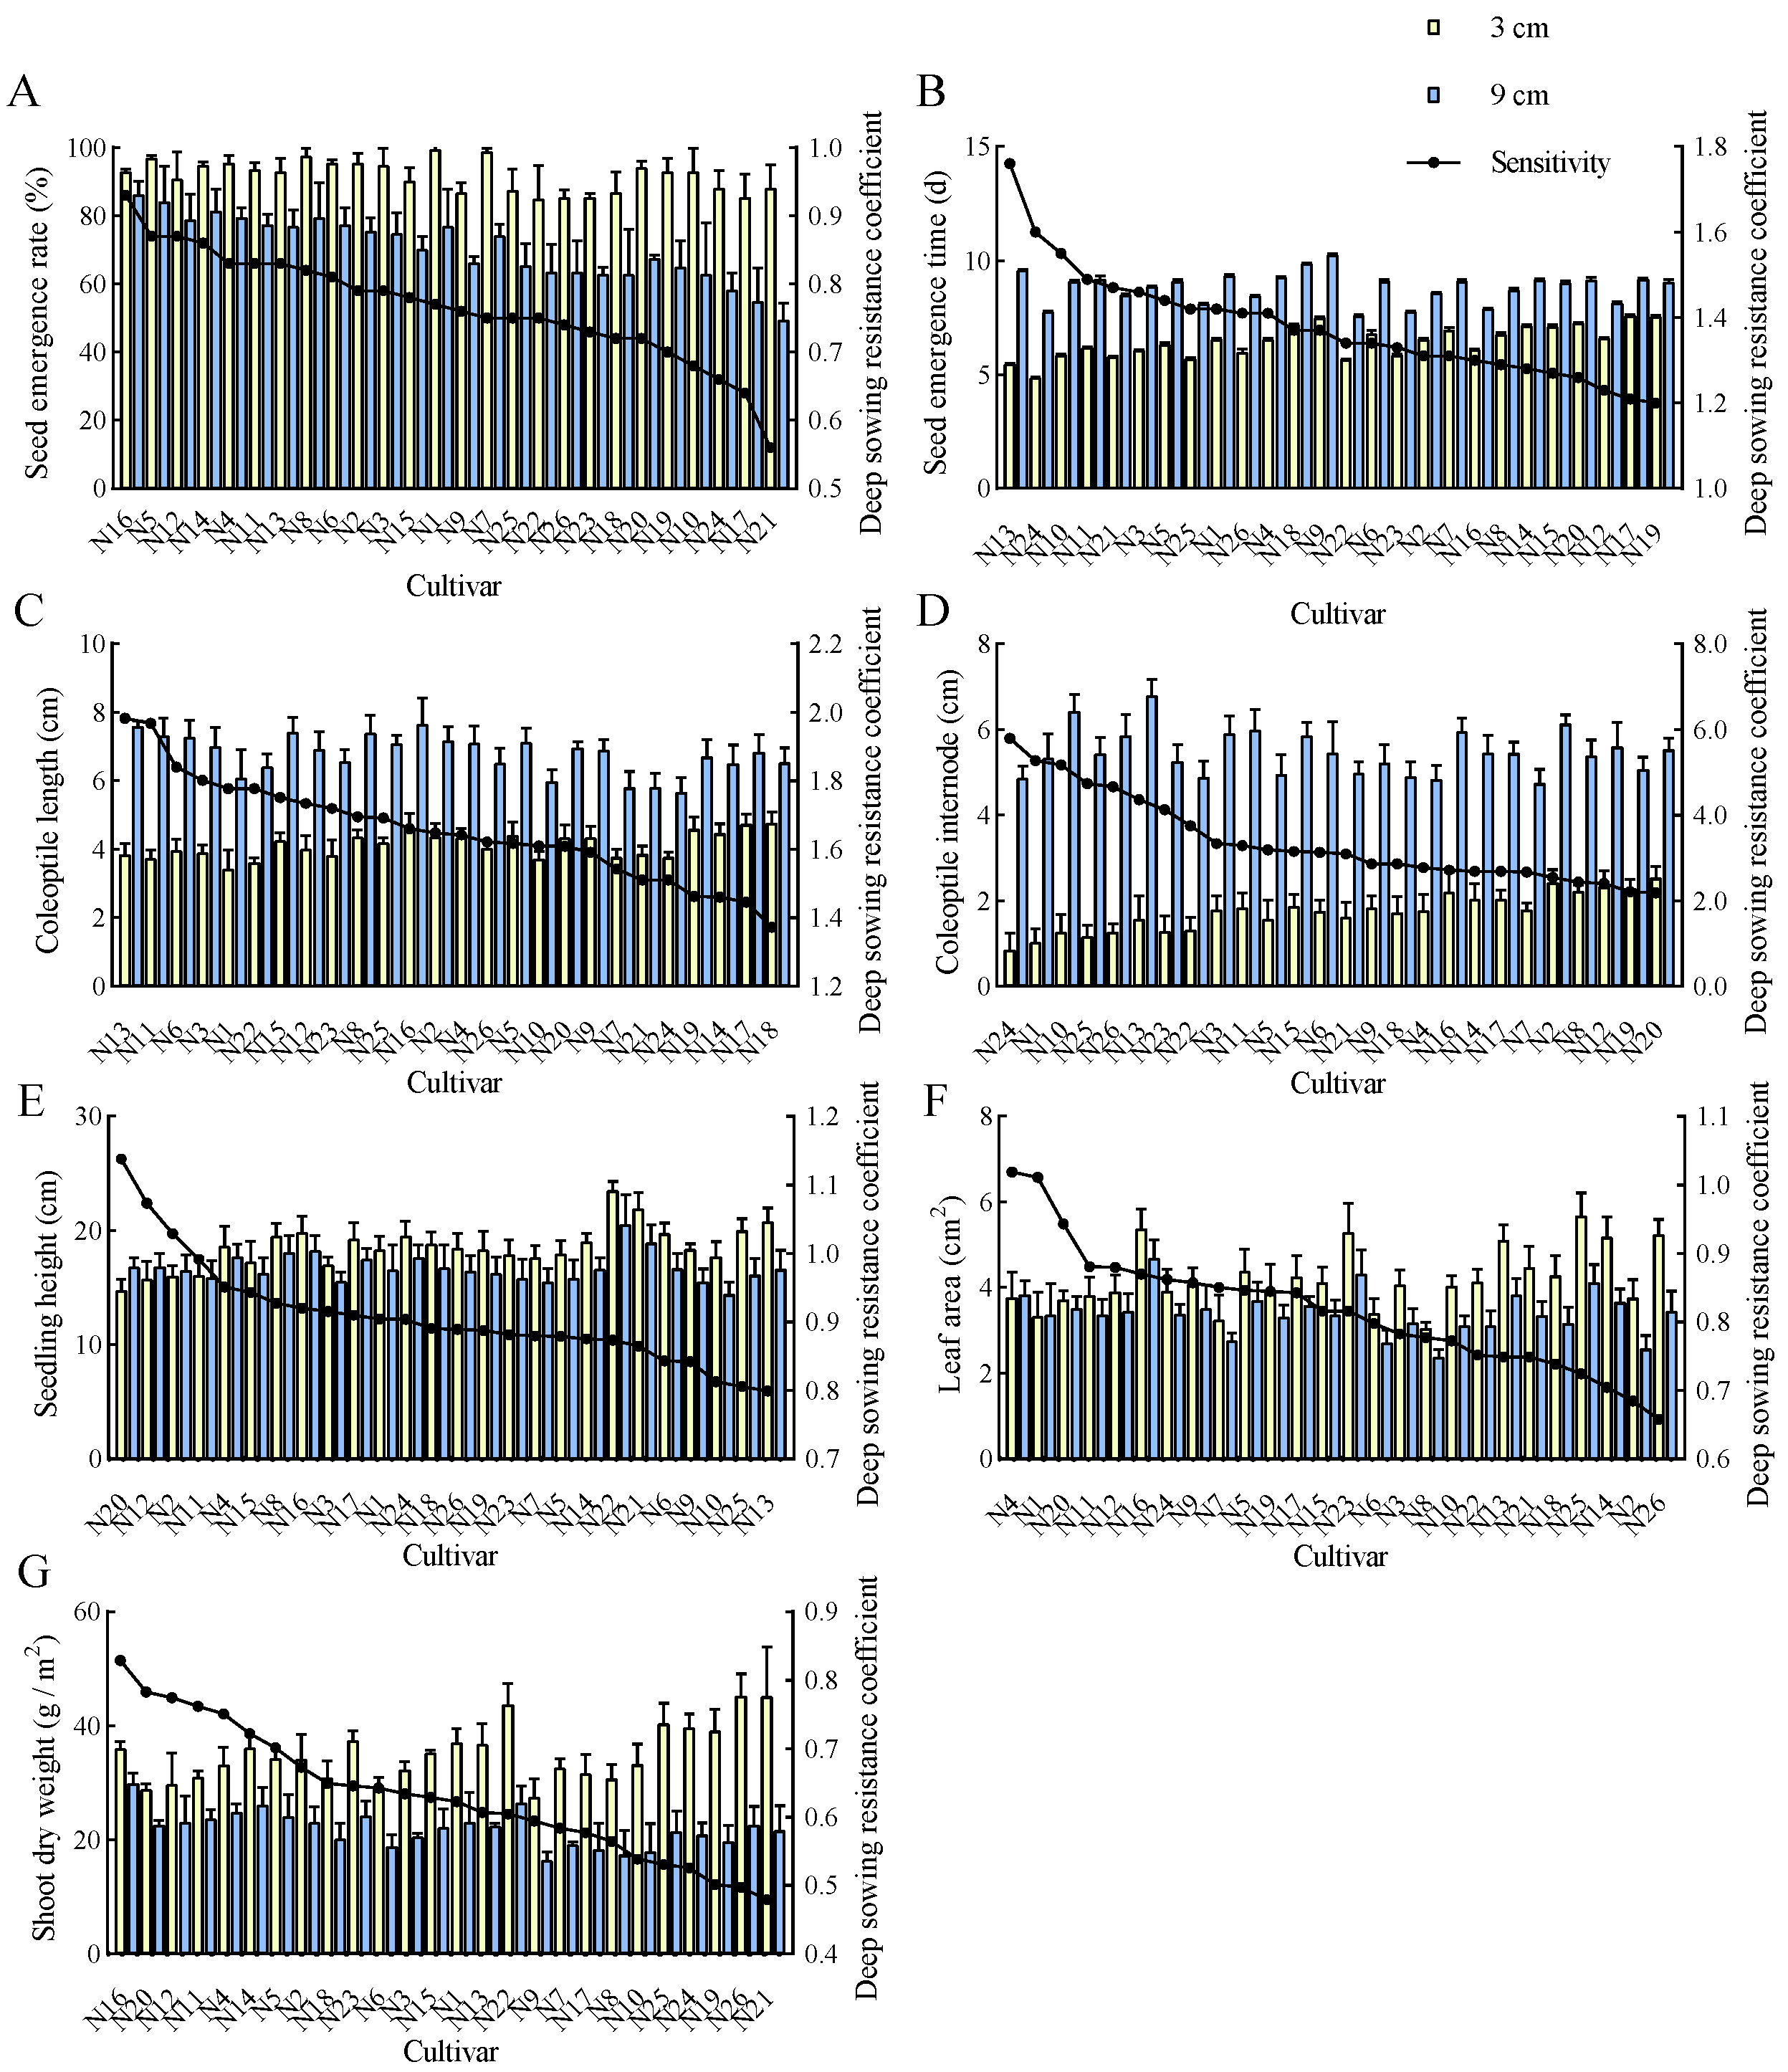
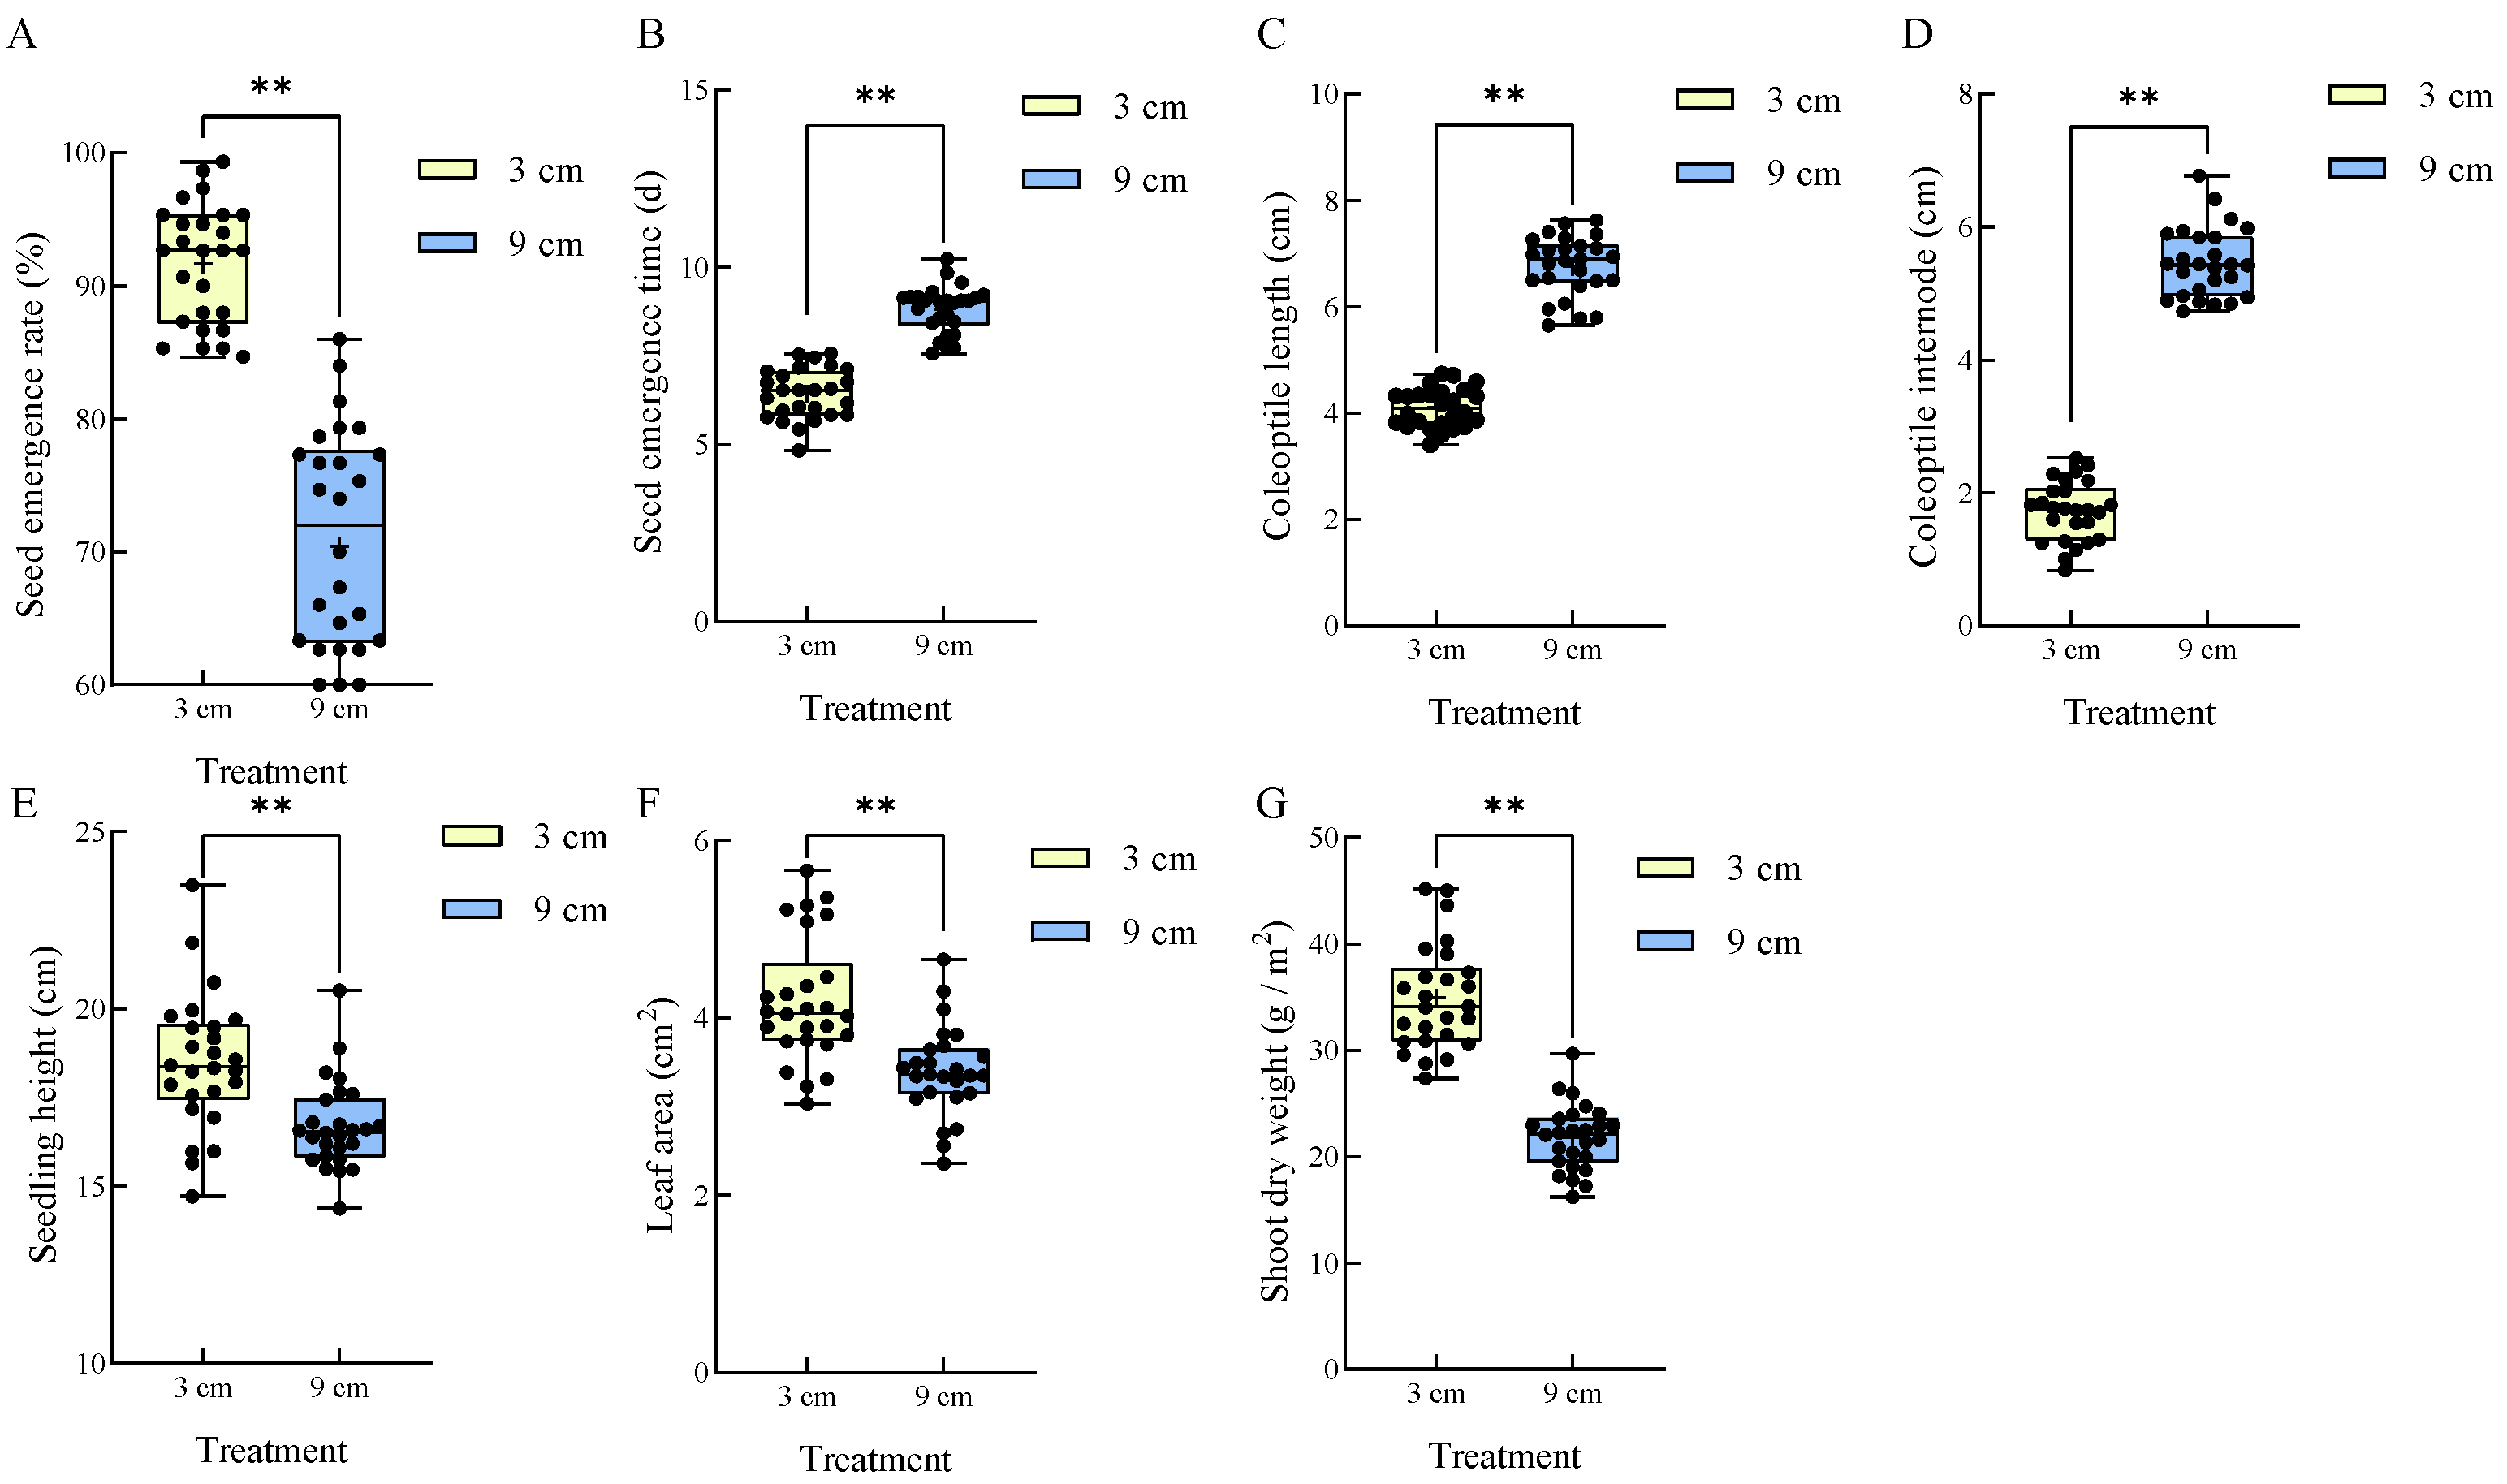
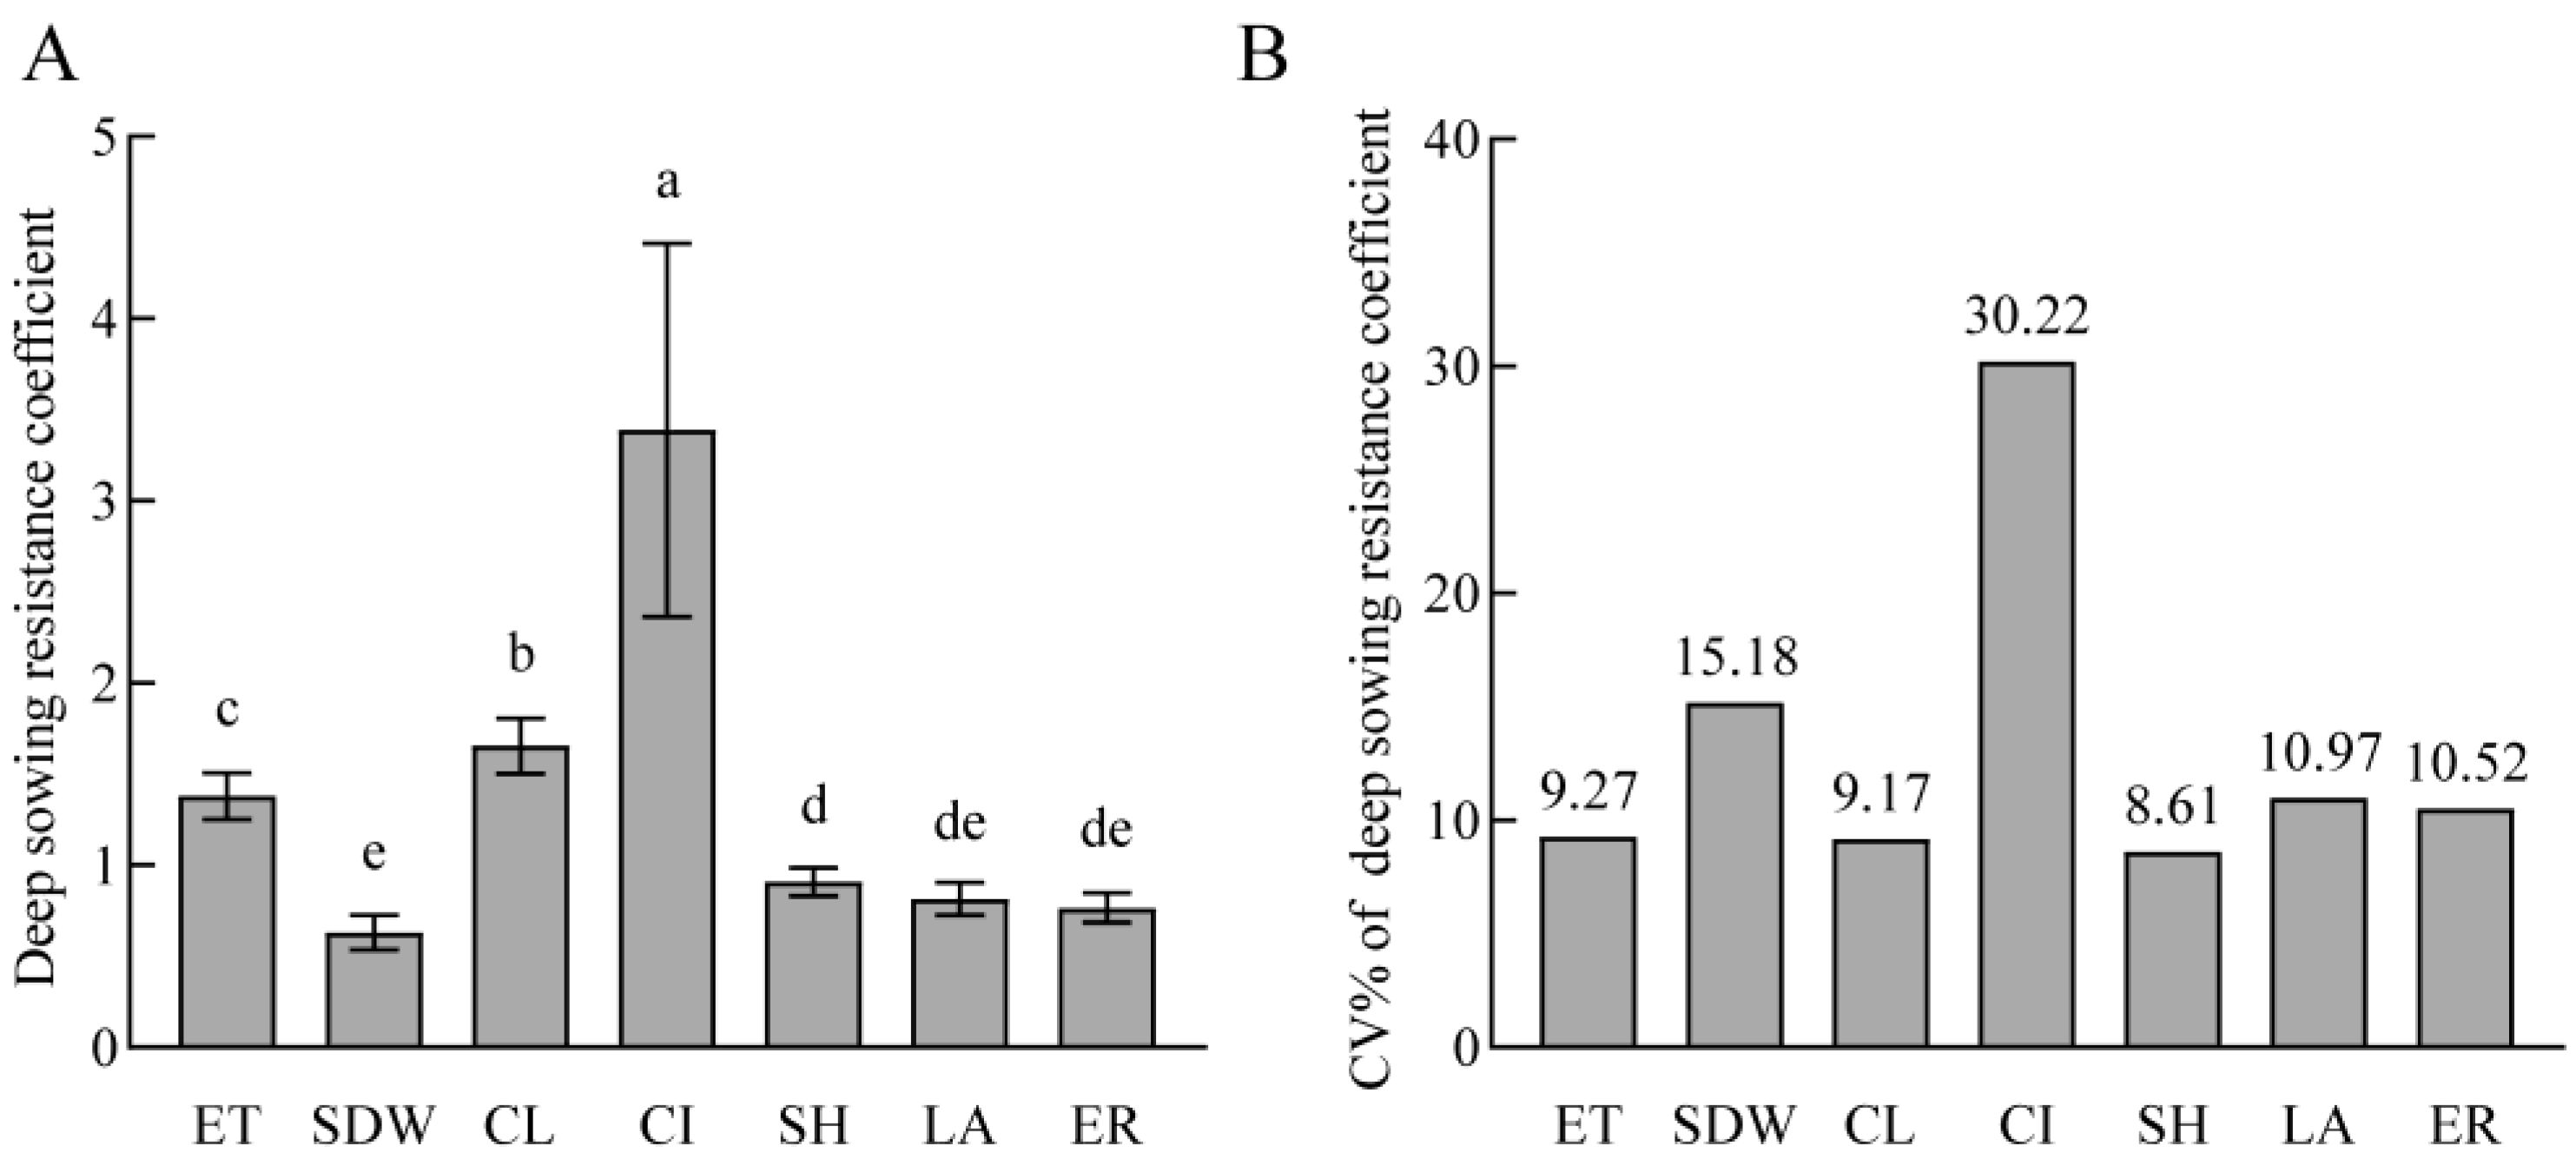
Based on the above results, sowing depth of 9 cm was designated as the deep sowing treatment, while sowing depth of 3 cm was used as the conventional control. For the deep sowing treatment, the emergence rate, seedling height, leaf area and shoot dry weight per unit area all decreased significantly, while the emergence time, coleoptile length, and coleoptile internode increased significantly (Figure 2). Following the method [18], the deep sowing resistance coefficient of seedling stage traits of different varieties under deep sowing treatment was calculated. It was shown that the variation ranges of different parameters among different varieties differed significantly (Figure 3). The variation degree of different parameters descended in an order of coleoptile internode, coleoptile length, emergence time, seedling height, the latest expanded leaf area, emergence rate and shoot dry weight per unit area. When the parameters of all varieties were averaged, it was observed that the average emergence rate decreased from 91.67% at a sowing depth of 3 cm to 70.41% at 9 cm; the average seedling height decreased from 18.49 cm at 3 cm to 16.71 cm at 9 cm; the average area of the latest expanded leaf decreased from 4.2 cm2 at 3 cm to 3.4 cm2 at 9 cm; the average shoot dry weight per unit area decreased from 34.93 g/m2 at 3 cm to 21.82 g/m2 at 9 cm; the average emergence time increased from 6.43 days at 3 cm to 8.81 days at 9 cm; the average coleoptile length increased from 4.1 cm at 3 cm to 6.76 cm at 9 cm; and the average coleoptile internode increased from 1.73 cm at 3 cm to 5.46 cm at 9 cm (Figure 3 and Table A2).
Under the deep sowing treatment, the variation coefficients were ranked as follows: the latest expanded leaf area > shoot dry weight per unit area > emergence rate > coleoptile internode > coleoptile length > emergence time > seedling height (Table A2). It is noteworthy that, compared with the variation coefficients at the control sowing depth, the variation coefficients of the 26 wheat varieties, except for the emergence rate, decreased under the deep sowing treatment (Table A2). This indicates that, compared with CK (sowing at 3 cm), there is a reduction in phenotypic variation among individual varieties under deep sowing.
To better describe the natural variation in the adaptability to deep sowing among different wheat varieties, we calculated the coefficient of variation (CV%) for the deep sowing resistance coefficient to assess the variability across different samples (Figure 4A). The coefficients of variation for emergence time, shoot dry weight per unit area, coleoptile length, coleoptile internode, seedling height, the latest expanded leaf area, and emergence rate were 9.27%, 15.18%, 9.17%, 30.22%, 8.61%, 10.97%, and 10.52% (Figure 4B). It suggests that the genetic differences of different traits among varieties under deep sowing differ significantly. Among them, the coleoptile internode exhibits the greatest genetic variation.

3.3. Correlation Analysis of Deep Sowing Traits of Wheat During Seed Germination

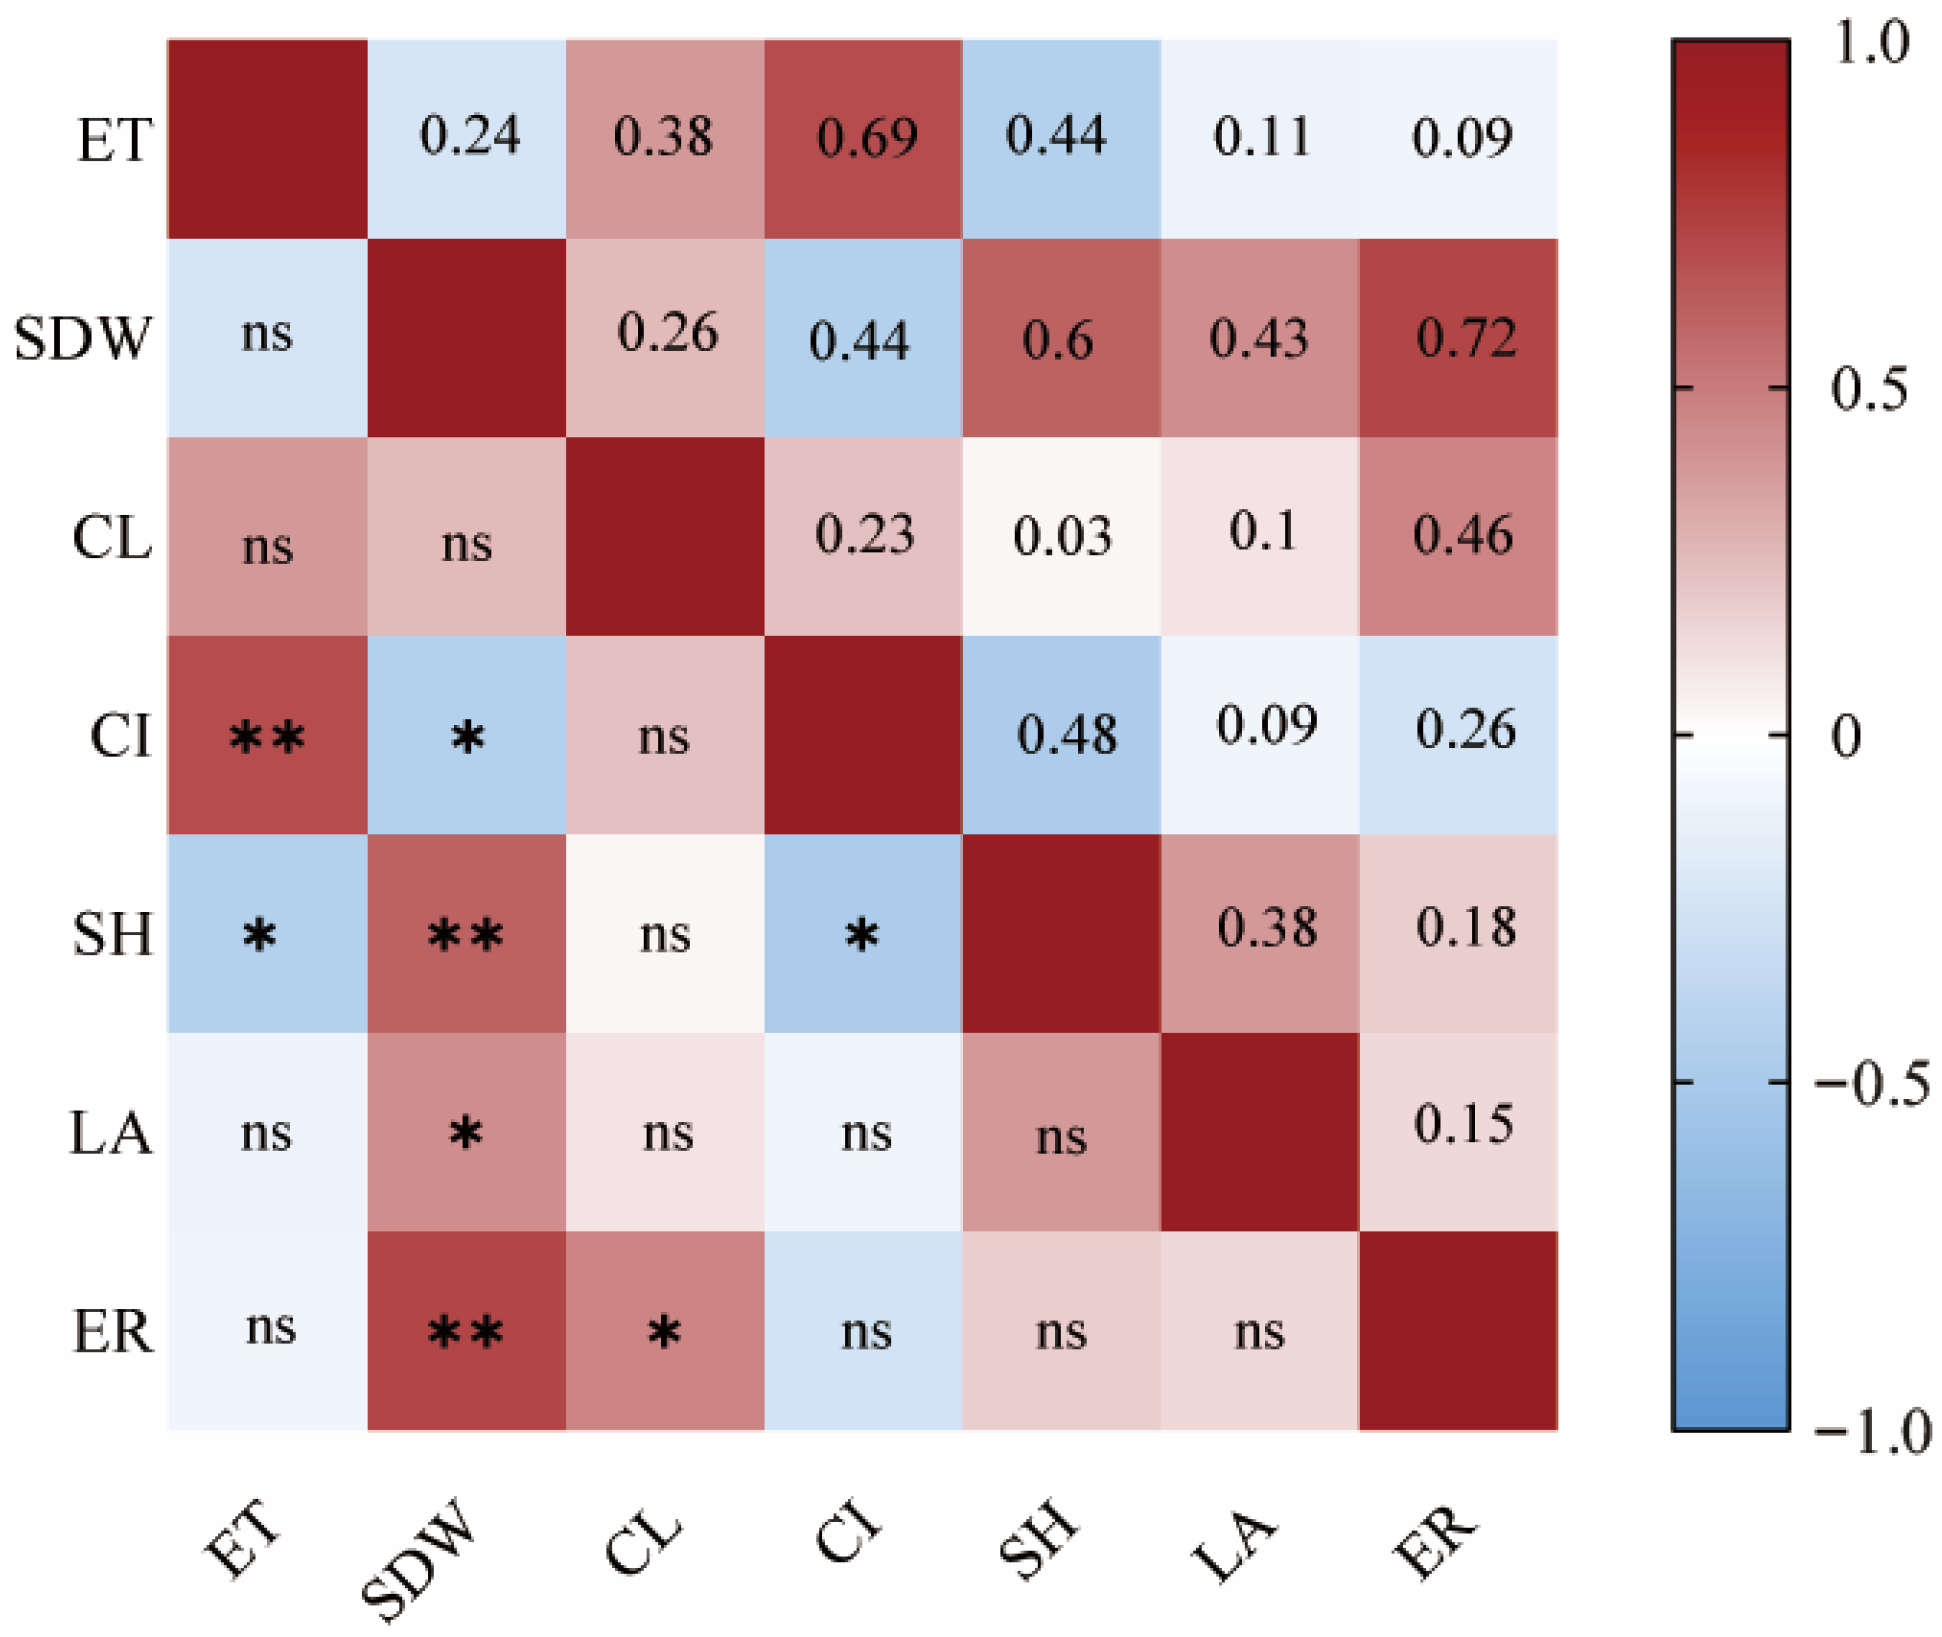
Under deep sowing conditions, a correlation analysis was conducted among the deep sowing traits of 26 wheat varieties (Figure 5). There was a significant positive correlation between coleoptile internode and emergence time and a significant negative correlation between coleoptile internode and shoot dry weight per unit area. A significant positive correlation was observed between seedling height and shoot dry weight per unit area, while a significant negative correlation existed between seedling height and both emergence time and coleoptile internode. There was a significant positive correlation between the latest expanded leaf area and shoot dry weight per unit area. Moreover, the emergence rate was significantly positively correlated with both shoot dry weight per unit area and coleoptile length.

3.4. Principal Component Analysis of Deep Sowing Traits of Different Wheat Varieties

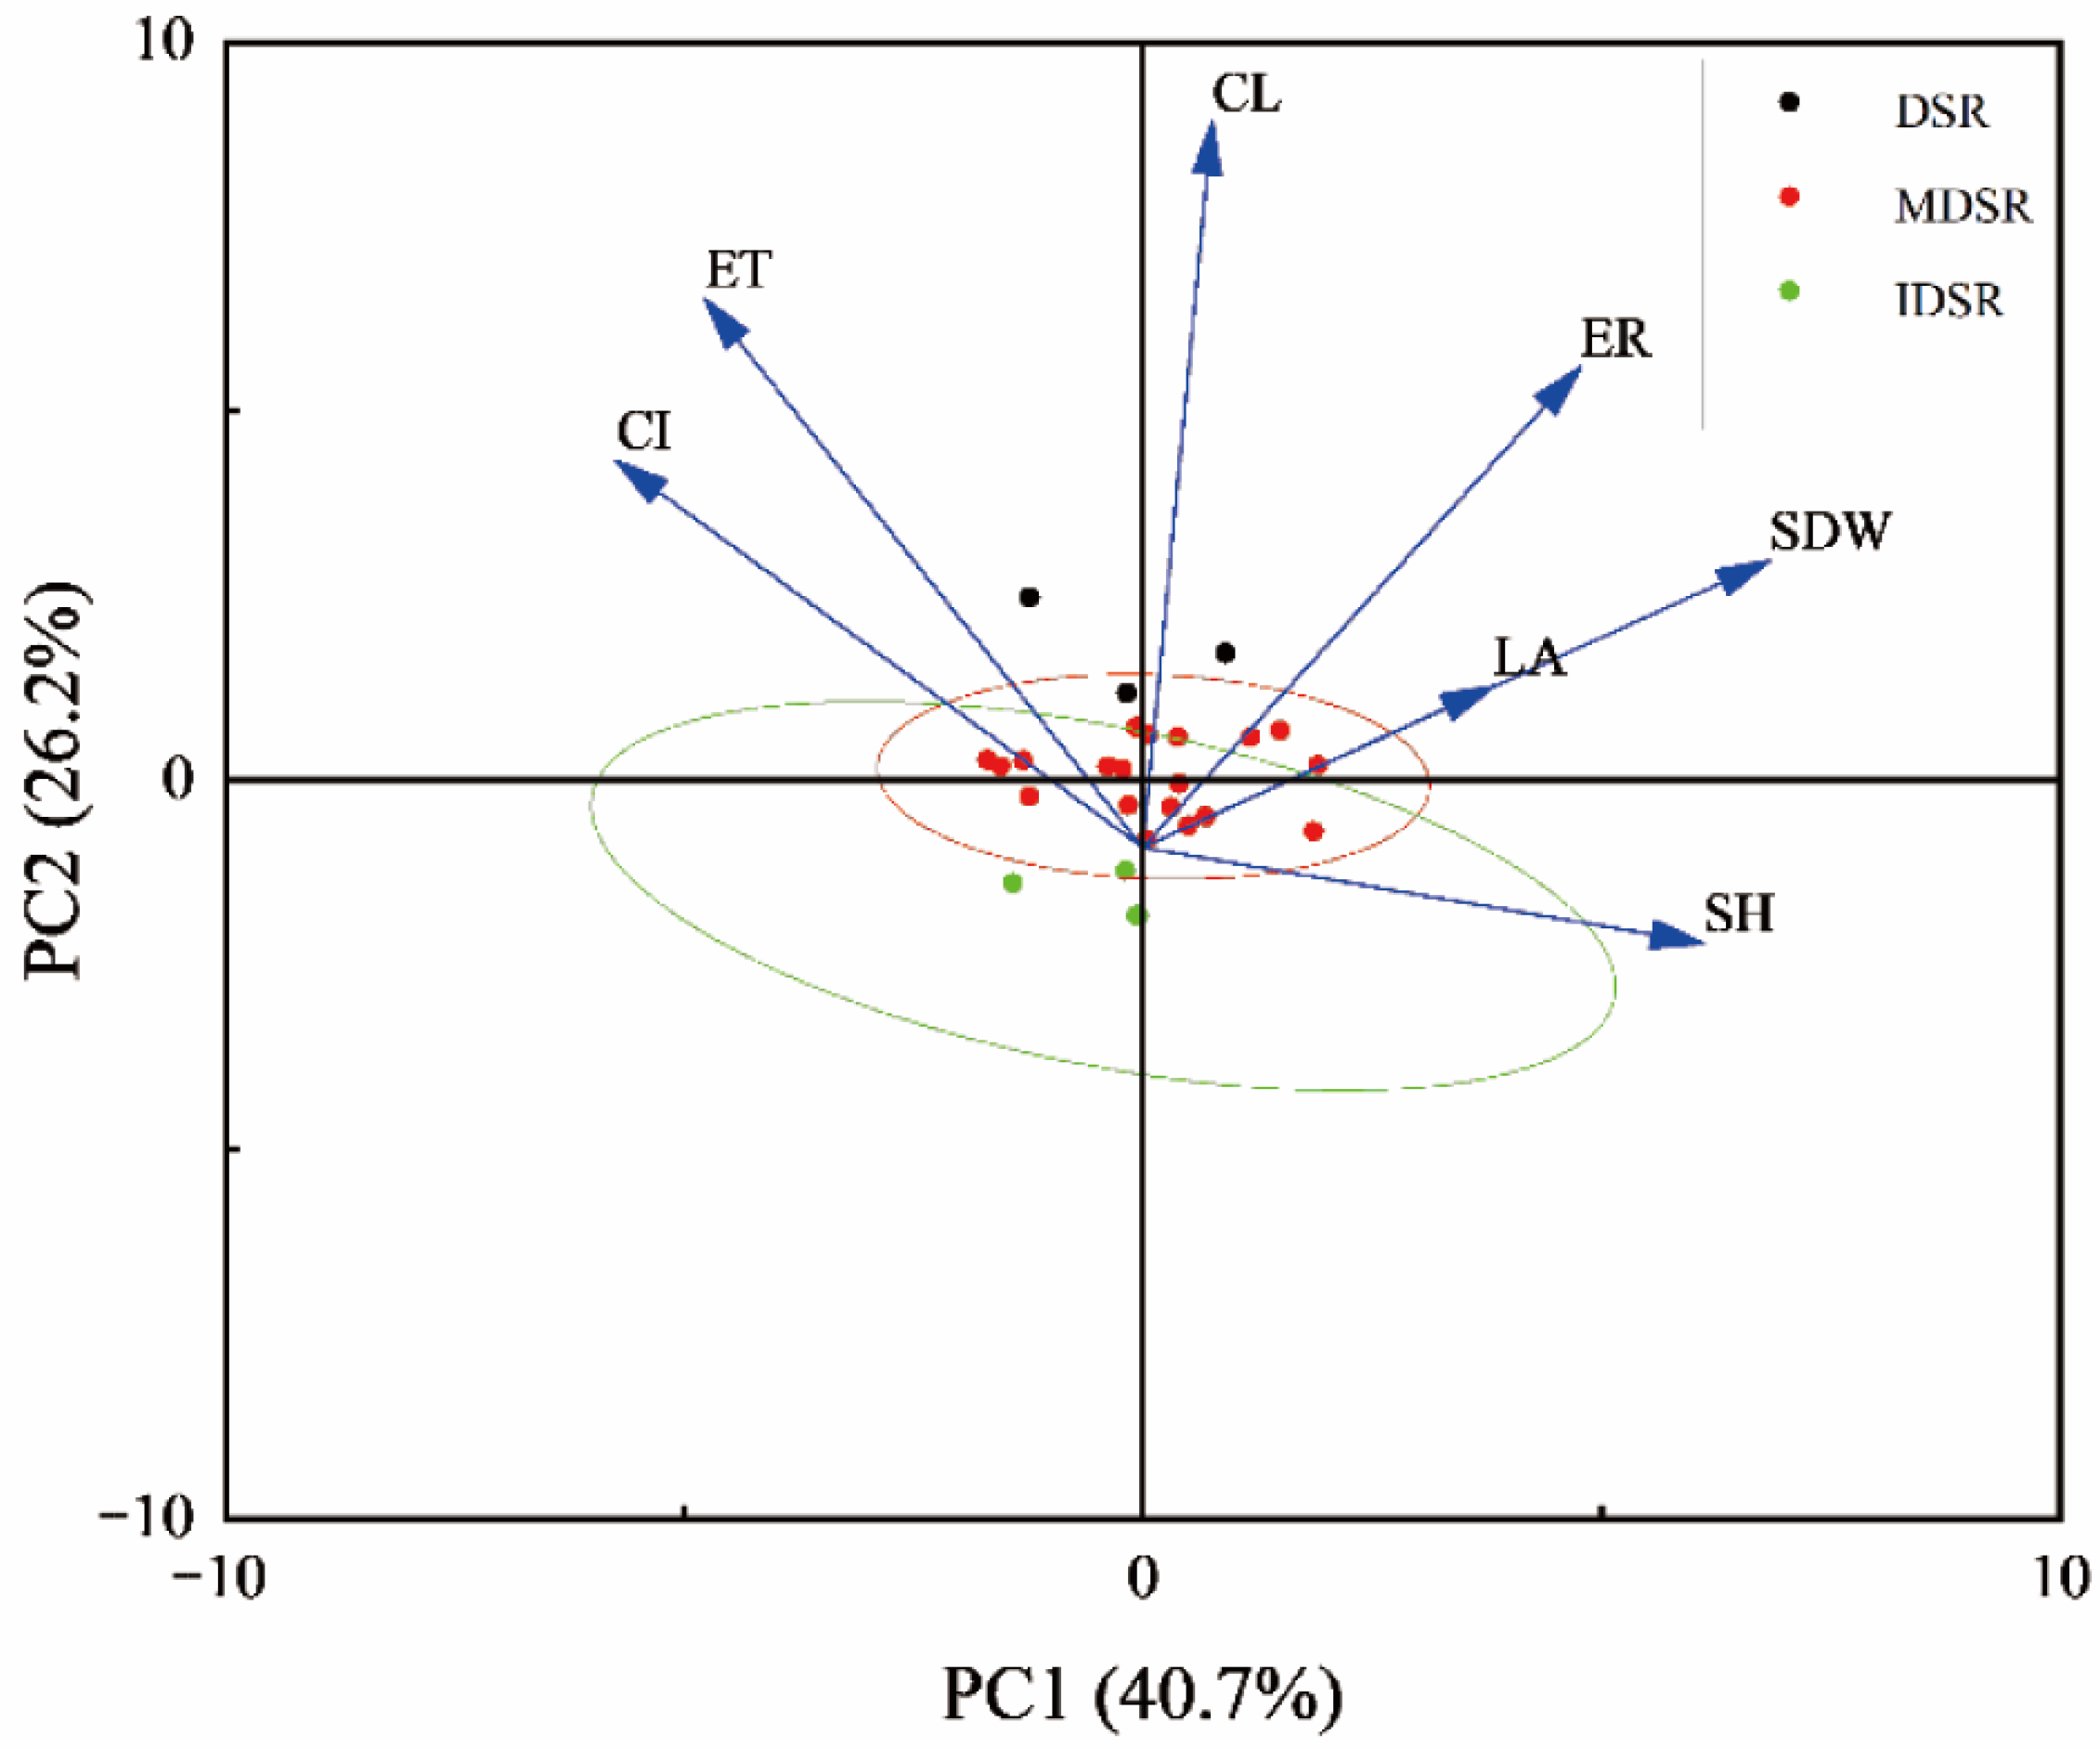
The principal component analysis method was adopted to conduct a correlation analysis of emergence time, emergence rate, and morphological indicators under deep sowing treatment. By statistically analyzing the deep sowing resistance coefficient of 7 traits in 26 wheat varieties (Table A3), the corresponding membership function values were calculated using Formula 2 (Table A4), and a principal component analysis was performed on the membership function values of the deep sowing sensitivities in the tested materials (Table A5). The principal component analysis extracted 2 main components (Eigenvalue > 1), which explained 66.94% of the total variation. PC 1 (X-axis, Figure 6) accounted for 40.7% of the variation among lines and was positively correlated with the latest expanded leaf area, shoot dry weight per unit area, and seedling height, while negatively correlated with the influence of coleoptile internode and emergence time. PC 2 (Y-axis, Figure 6) contributed 26.24% to the variation, with a positive loading for coleoptile length and a negative loading for seedling height. The results of the principal component analysis showed a strong correlation between emergence time and coleoptile internode, as well as between the latest expanded leaf area and shoot dry weight per unit area (Figure 6).

3.5. Classification of Wheat Varieties According to Deep Sowing Tolerance

To objectively evaluate the deep sowing tolerance of 26 wheat varieties, based on the contribution rates of the two comprehensive indicators (40.7% and 26.24%), the weights were calculated using Formula 3, which were 0.51 and 0.49, respectively. The comprehensive deep sowing resistance coefficient D-value was calculated using Formula 4 (Table A5), and a hierarchical cluster analysis was performed on the D-values. The results showed that the D-values of the tested materials ranged from 0.35 to 1.66. The D-values were clustered into 3 subgroups (Figure 7), corresponding to three groups: deep-sowing-tolerant varieties (D ≥ 1.33), moderately deep-sowing-tolerant varieties (0.67 ≤ D < 1.33), and non-deep-sowing-tolerant varieties (D < 0.67) (Table 2).

3.6. Screening of Indicators for Deep Sowing Tolerance of Wheat During Seed Germination

The correlations between the comprehensive deep sowing resistance coefficient during wheat germination and the germination and growth traits were analyzed (Table 3). Under deep sowing conditions, the comprehensive deep sowing resistance coefficient D-value was significantly positively correlated with emergence time, shoot dry weight per unit area, coleoptile length, and emergence rate. The correlation coefficients were 0.57, 0.44, 0.86, and 0.62. The results indicate that emergence time, shoot dry weight per unit area, coleoptile length, and emergence rate can be used as evaluation indicators for deep sowing tolerance during wheat germination.

4. Discussion

The emergence rate is a crucial factor influencing population quantity, the final number of spikes and yield, and is widely used in agricultural production as well as seed and agronomic research [20,21,22]. In this study, all wheat varieties showed a decline in emergence rate as sowing depth increased. Previous studies have shown that there are two main reasons affecting the quality of seedling emergence under deep sowing conditions: one is environmental factors, such as soil aeration, humidity, temperature, and compactness, which have a negative impact on the seed germination process. Increased mechanical resistance during the elongation of the hypocotyl causes excessive nutrient consumption during the soil-breaking process, preventing wheat embryos from emerging [19,23]. Excessive soil moisture leads to insufficient oxygen content, causing seeds to undergo anaerobic respiration and produce alcohol, which can poison the seeds or sprouts and even lead to seed rot [24,25]. Low soil temperature affects cell membrane permeability and enzyme activity, inhibiting seed germination [26]. The second reason is genetic factors, such as the maximum elongation length of the coleoptile and the subterranean stem. Since the elongation of the coleoptile and the subterranean stem is the main driving force for seed germination and soil-breaking, the maximum elongation length of the coleoptile and the subterranean stem is an important factor affecting seed emergence under deep sowing conditions [27,28]. In this study, both the soil used for all the wheat cultivars and the growth environment are the same, so the 26 wheat varieties showed different sensitivity to deep sowing, which was mainly due to genetic reasons. The varying degrees of emergence rate decline among different wheat varieties with increasing sowing depth (Figure 1A) suggest that these wheat varieties exhibit considerable genetic diversity in their adaptability to deep sowing conditions.
Selecting an appropriate sowing depth is crucial for evaluating and comparing the deep-sowing adaptability of different wheat varieties. If the sowing depth is too shallow or too deep, it may obscure the differences in adaptability among varieties. Li et al. [29] conducted a study on the evaluation method of deep sowing tolerance, using 15 wheat varieties with distinct differences in deep sowing tolerance. They showed that the sowing depth of 11 cm could better distinguish the differences in emergence rates among different wheat varieties. Li et al. [30] evaluated the deep sowing tolerance of 100 wheat varieties; they used the sowing depth of 15 cm to classify the deep sowing tolerance of various materials. However, some of the materials in the previous studies included early-released varieties or extreme deep-sowing-tolerant materials. In this experiment, the focus was on wheat varieties bred in recent years, requiring an adjustment in sowing depth to more accurately reflect differences in deep sowing tolerance. In practical agricultural production, achieving a basic seedling density of 150,000–200,000 plants per acre is critical for ensuring high wheat yields, particularly in the Yellow River and Huaihe River regions. When the emergence rate falls below 80% with a conventional seeding rate of 10 kg per acre, the seedling density may significantly decrease, impacting yield potential. To ensure that deep-sowing-tolerant wheat varieties maintain adequate seedling density within the normal seeding rate range, we defined the critical sowing depth as the point at which more than 50% of the wheat varieties exhibit emergence rates below 80%. In this study, when the sowing depth exceeded 9 cm, the emergence rates of more than 50% of the wheat varieties fell below 80%. Based on this, we determined that a sowing depth of 9 cm is optimal for identifying wheat varieties with deep sowing adaptability.
The coleoptile length is a crucial factor influencing seed germination under deep sowing conditions [31,32,33]. As a result, the maximum coleoptile length of seedlings germinated in darkness is often used to assess deep sowing tolerance in wheat and other crop varieties [34]. However, this method does not account for factors such as soil compaction, temperature, and humidity, which can impact seedling performance under real-world soil conditions. Moreover, deep sowing not only significantly reduces the emergence rate but also negatively affects traits such as leaf area, seedling height, and chlorophyll content [35,36]. To more comprehensively reflect the phenotypic differences among wheat varieties under deep sowing conditions, this study employed the membership function value method to construct a composite index, referred to as the D-value. This index incorporates various indicators, including leaf area, seedling height, coleoptile length, coleoptile internode, and shoot dry weight per unit area. The D-value for 26 wheat varieties ranged from 0.35 to 1.66 (Table A5), with a significant positive correlation to coleoptile length, emergence rate, and shoot dry weight per unit area (Table 3). These findings show that coleoptile length, emergence rate, and shoot dry weight per unit area are the primary traits reflecting deep sowing tolerance in wheat varieties. Similar findings have been reported in previous studies on deep sowing tolerance in crops such as rice and corn, as well as in the evaluation of wheat germplasm resources [37,38], further supporting the validity and reliability of the present study. Cluster analysis based on D-values identified three wheat varieties with strong deep-sowing tolerance, all of which are high-yielding and have passed official approval. These varieties not only represent valuable germplasm resources for breeding deep-sowing-tolerant wheat but also have practical applications in agricultural production.

5. Conclusions

In summary, analysis of wheat phenotypic traits during the seed germination seedling growth period under deep sowing conditions reveals that deep sowing has a significant impact on wheat phenotypes. The results showed that deep sowing of wheat seeds led to a reduction in emergence rate, seedling height, leaf area, and shoot dry weight per unit area, while increasing emergence time, coleoptile length, and coleoptile internode. Moreover, wheat showed significant genetic variation for all traits under deep sowing conditions, with coleoptile internode showing the greatest genetic variation and seedling height the least. Additionally, a comprehensive index was developed to assess the deep-sowing tolerance of 26 winter wheat varieties during the germination period, followed by cluster analysis. This analysis identified 3 deep-sowing-tolerant varieties, 19 moderately tolerant varieties, and 4 non-tolerant varieties. These findings provide a theoretical foundation for the optimal selection and utilization of wheat varieties, as well as for improving sowing practices.

Author Contributions

Conceptualization, C.Y. and B.T.; Writing—review and editing, C.Y.; Project administration, C.Y.; Funding acquisition, C.Y. and X.L.; Methodology, R.W. and D.Z.; Investigation, R.W. and C.T.; Data curation, R.W. and H.S.; Writing—original draft preparation, R.W.; Visualization, R.W.; Formal analysis, C.T.; Literature search, D.Z.; Validation, H.C., B.F. and H.J.; Data collection, H.C. and H.J.; Data interpretation, B.F. and H.S.; Supervision, X.L., F.W. and G.Y.; Study design, B.T. and F.W.; Figures, G.Y. All authors have read and agreed to the published version of the manuscript.

Funding

This work was supported by the National Key Research and Development Program of China (2022YFD2300802; 2022YFD2300202), Independent Innovation of Henan Academy of Agricultural Sciences (2025ZC01), Special Fund for Henan Agriculture Research System (HARS-22-01-G5), and Henan Academy of Agricultural Sciences Innovation Team.

Data Availability Statement

All data are available upon request.

Conflicts of Interest

The authors declare no conflicts of interest.

Appendix A

Table A1. Changes in emergence rate of 26 wheat varieties at different sowing depths.
NumberVarietySeedling Emergence Rate at Different Depths
3 cm5 cm7 cm9 cm11 cm
1Fanmai 50.99 ± 0.010.91 ± 0.050.93 ± 0.050.77 ± 0.110.62 ± 0.09
2Bainong 41990.95 ± 0.030.91 ± 0.020.91 ± 0.030.75 ± 0.040.47 ± 0.09
3Zhongmai 8950.95 ± 0.050.89 ± 0.080.91 ± 0.040.75 ± 0.060.75 ± 0.12
4Zhengmai 09190.95 ± 0.020.93 ± 0.020.93 ± 0.040.79 ± 0.030.58 ± 0.12
5Zhengmai 6610.97 ± 0.010.95 ± 0.040.94 ± 0.050.84 ± 0.110.62 ± 0.1
6Zhengmai 13540.95 ± 0.010.95 ± 0.030.9 ± 0.050.77 ± 0.050.58 ± 0.02
7Xinmai 260.99 ± 0.010.97 ± 0.030.92 ± 0.050.74 ± 0.030.52 ± 0.02
8Aikang 580.97 ± 0.020.92 ± 0.020.95 ± 0.050.79 ± 0.10.72 ± 0.06
9Zhengmai 6620.87 ± 0.030.86 ± 0.020.77 ± 0.040.66 ± 0.020.52 ± 0.11
10Xinong 5110.93 ± 0.070.88 ± 0.050.89 ± 0.030.63 ± 0.150.61 ± 0.05
11Zhengmai 1360.93 ± 0.020.91 ± 0.010.91 ± 0.010.77 ± 0.030.7 ± 0.09
12Wanfeng 2690.91 ± 0.080.95 ± 0.030.9 ± 0.030.79 ± 0.080.63 ± 0.17
13Zhengmai 3790.93 ± 0.040.92 ± 0.040.88 ± 0.040.77 ± 0.050.55 ± 0.07
14Zhengmai 18600.95 ± 0.010.88 ± 0.030.84 ± 0.050.81 ± 0.060.51 ± 0.01
15Zhengmai 09430.9 ± 0.040.91 ± 0.040.87 ± 0.040.7 ± 0.040.55 ± 0.21
16Zhengmai 200.93 ± 0.010.94 ± 00.89 ± 0.030.86 ± 0.040.72 ± 0.05
17Zhengmai 3690.85 ± 0.070.77 ± 0.050.75 ± 0.050.55 ± 0.10.33 ± 0.03
18Fanmai 80.87 ± 0.060.76 ± 0.040.77 ± 0.120.63 ± 0.130.38 ± 0.07
19Zhoumai 220.93 ± 0.040.82 ± 0.030.81 ± 0.010.65 ± 0.080.47 ± 0.09
20Zhengmai 220.94 ± 0.020.91 ± 0.010.85 ± 0.010.67 ± 0.010.46 ± 0.23
21Xinmai 450.88 ± 0.070.81 ± 0.050.67 ± 0.090.49 ± 0.050.43 ± 0.05
22Zhengmai 1130.85 ± 0.10.75 ± 0.080.72 ± 0.090.63 ± 0.080.41 ± 0.05
23Hemai 17070.85 ± 0.010.79 ± 0.010.78 ± 0.020.63 ± 0.020.51 ± 0.06
24Jimai 220.88 ± 0.050.83 ± 0.060.73 ± 0.080.58 ± 0.050.27 ± 0.01
25Zhengmai 160.87 ± 0.060.79 ± 0.060.76 ± 0.070.65 ± 0.060.58 ± 0.09
26Zhengmai 76980.85 ± 0.020.77 ± 0.030.71 ± 0.090.63 ± 0.090.5 ± 0.11
Average0.92 ± 0.040.87 ± 0.040.84 ± 0.050.7 ± 0.070.54 ± 0.08
CV%4.9%7.84%9.8%13.38%22.27%
Table A2. Seedling indicators of 26 wheat varieties at different sowing depths (3 cm and 9 cm).
ParameterET (%)CL (cm)CI (cm)ET (d)SH (cm)SDW (g/m2)LA (cm2)
3 cm9 cm3 cm9 cm3 cm9 cm3 cm9 cm3 cm9 cm3 cm9 cm3 cm9 cm
Maximum99.3386.004.747.622.526.777.5710.2323.520.5245.1729.725.664.66
Minimum84.6749.333.415.650.844.734.837.5714.7214.3727.3716.253.032.36
Average91.6770.414.106.761.735.466.438.8118.4916.7134.9321.824.203.40
Standard deviation4.499.420.370.560.450.520.710.661.911.264.933.080.710.51
Coefficient of variation (%)4.9013.388.918.3325.869.5911.077.5410.327.5314.1214.1116.8114.95
Note: ET, Emergence time; SDW, Shoot dry weight per unit area; CL, Coleoptile length; CI, Coleoptile internode; SH, Seedling height; LA, The latest expanded leaf area. Coefficient of variation = standard deviation/average.
Table A3. Deep sowing resistance coefficient of 26 wheat varieties.
VarietyX1X2X3X4X5X6X7
Fanmai 51.420.621.785.280.901.010.77
Bainong 41991.310.671.652.541.030.680.79
Zhongmai 8951.460.631.803.340.910.780.79
Zhengmai 09191.410.751.642.770.951.020.83
Zhengmai 6611.440.701.623.190.880.850.87
Zhengmai 13541.340.641.843.130.840.800.81
Xinmai 261.310.581.542.660.880.850.75
Aikang 581.290.561.702.430.930.780.82
Zhengmai 6621.370.591.592.860.840.860.76
Xinong 5111.550.541.615.170.810.770.68
Zhengmai 1361.490.761.973.290.990.880.83
Wanfeng 2691.230.771.732.411.070.880.87
Zhengmai 3791.760.611.984.360.800.750.83
Zhengmai 18601.280.721.462.690.870.700.86
Zhengmai 09431.270.631.753.150.940.820.78
Zhengmai 201.300.831.662.720.920.870.93
Zhengmai 3691.210.581.442.680.910.840.64
Fanmai 81.370.651.372.860.890.740.72
Zhoumai 221.200.501.462.210.890.840.70
Zhengmai 221.260.781.612.191.140.940.72
Xinmai 451.470.481.513.100.860.750.56
Zhengmai 1131.340.601.783.750.870.750.75
Hemai 17071.330.651.724.130.880.820.73
Jimai 221.600.531.515.790.900.860.66
Zhengmai 161.420.531.694.740.810.720.75
Zhengmai 76981.410.501.624.660.890.660.74
Note: X1, Emergence time; X2, Shoot dry weight per unit area; X3, Coleoptile length; X4, Coleoptile internode; X5, Seedling height; X6, The latest expanded leaf area; X7, Emergence rate.
Table A4. The membership function values of 26 wheat varieties.
VarietyU (X1)U (X2)U (X3)U (X4)U (X5)U (X6)U (X7)
Fanmai 50.400.410.660.860.310.980.57
Bainong 41990.200.550.450.100.680.080.62
Zhongmai 8950.470.440.700.320.340.350.62
Zhengmai 09190.380.780.440.160.451.000.74
Zhengmai 6610.430.630.400.280.240.520.84
Zhengmai 13540.250.470.770.260.130.390.68
Xinmai 260.190.300.280.130.240.530.52
Aikang 580.160.240.530.070.380.330.69
Zhengmai 6620.310.330.360.190.130.550.55
Xinong 5110.630.170.390.830.040.320.31
Zhengmai 1360.510.810.980.300.570.620.73
Wanfeng 2690.060.840.590.060.810.610.84
Zhengmai 3791.000.361.000.600.000.250.73
Zhengmai 18600.140.690.140.140.220.130.81
Zhengmai 09430.130.430.620.270.430.440.59
Zhengmai 200.171.000.470.150.360.591.00
Zhengmai 3690.020.280.120.140.330.510.22
Fanmai 80.310.490.000.190.270.220.44
Zhoumai 220.000.070.150.010.260.520.37
Zhengmai 220.110.870.390.001.000.790.42
Xinmai 450.480.000.230.250.190.250.00
Zhengmai 1130.260.360.660.430.220.260.51
Hemai 17070.230.480.570.540.240.440.47
Jimai 220.710.130.231.000.310.570.27
Zhengmai 160.400.150.520.710.020.180.51
Zhengmai 76980.380.050.410.690.270.000.49
Note: X1, Emergence time; X2, Shoot dry weight per unit area; X3, Coleoptile length; X4, Coleoptile internode; X5, Seedling height; X6, The latest expanded leaf area; X7, Emergence rate.
Table A5. Comprehensive evaluation values of 26 wheat varieties.
VarietyPrincipal Component 1Principal Component 2D
Fanmai 51.680.961.33
Bainong 41991.64−0.070.81
Zhongmai 8951.600.691.16
Zhengmai 09192.240.041.17
Zhengmai 6611.800.411.12
Zhengmai 13541.650.591.13
Xinmai 261.210.110.68
Aikang 581.460.150.82
Zhengmai 6621.250.360.82
Xinong 5110.621.330.97
Zhengmai 1362.440.571.52
Wanfeng 2692.50−0.411.08
Zhengmai 3791.521.811.66
Zhengmai 18601.51−0.040.75
Zhengmai 09431.620.230.94
Zhengmai 202.43−0.081.21
Zhengmai 3690.88−0.170.37
Fanmai 80.980.080.54
Zhoumai 220.84−0.170.35
Zhengmai 222.24−0.690.81
Xinmai 450.290.600.44
Zhengmai 1131.290.680.99
Hemai 17071.370.601.00
Jimai 220.661.260.95
Zhengmai 160.811.150.98
Zhengmai 76980.680.970.82
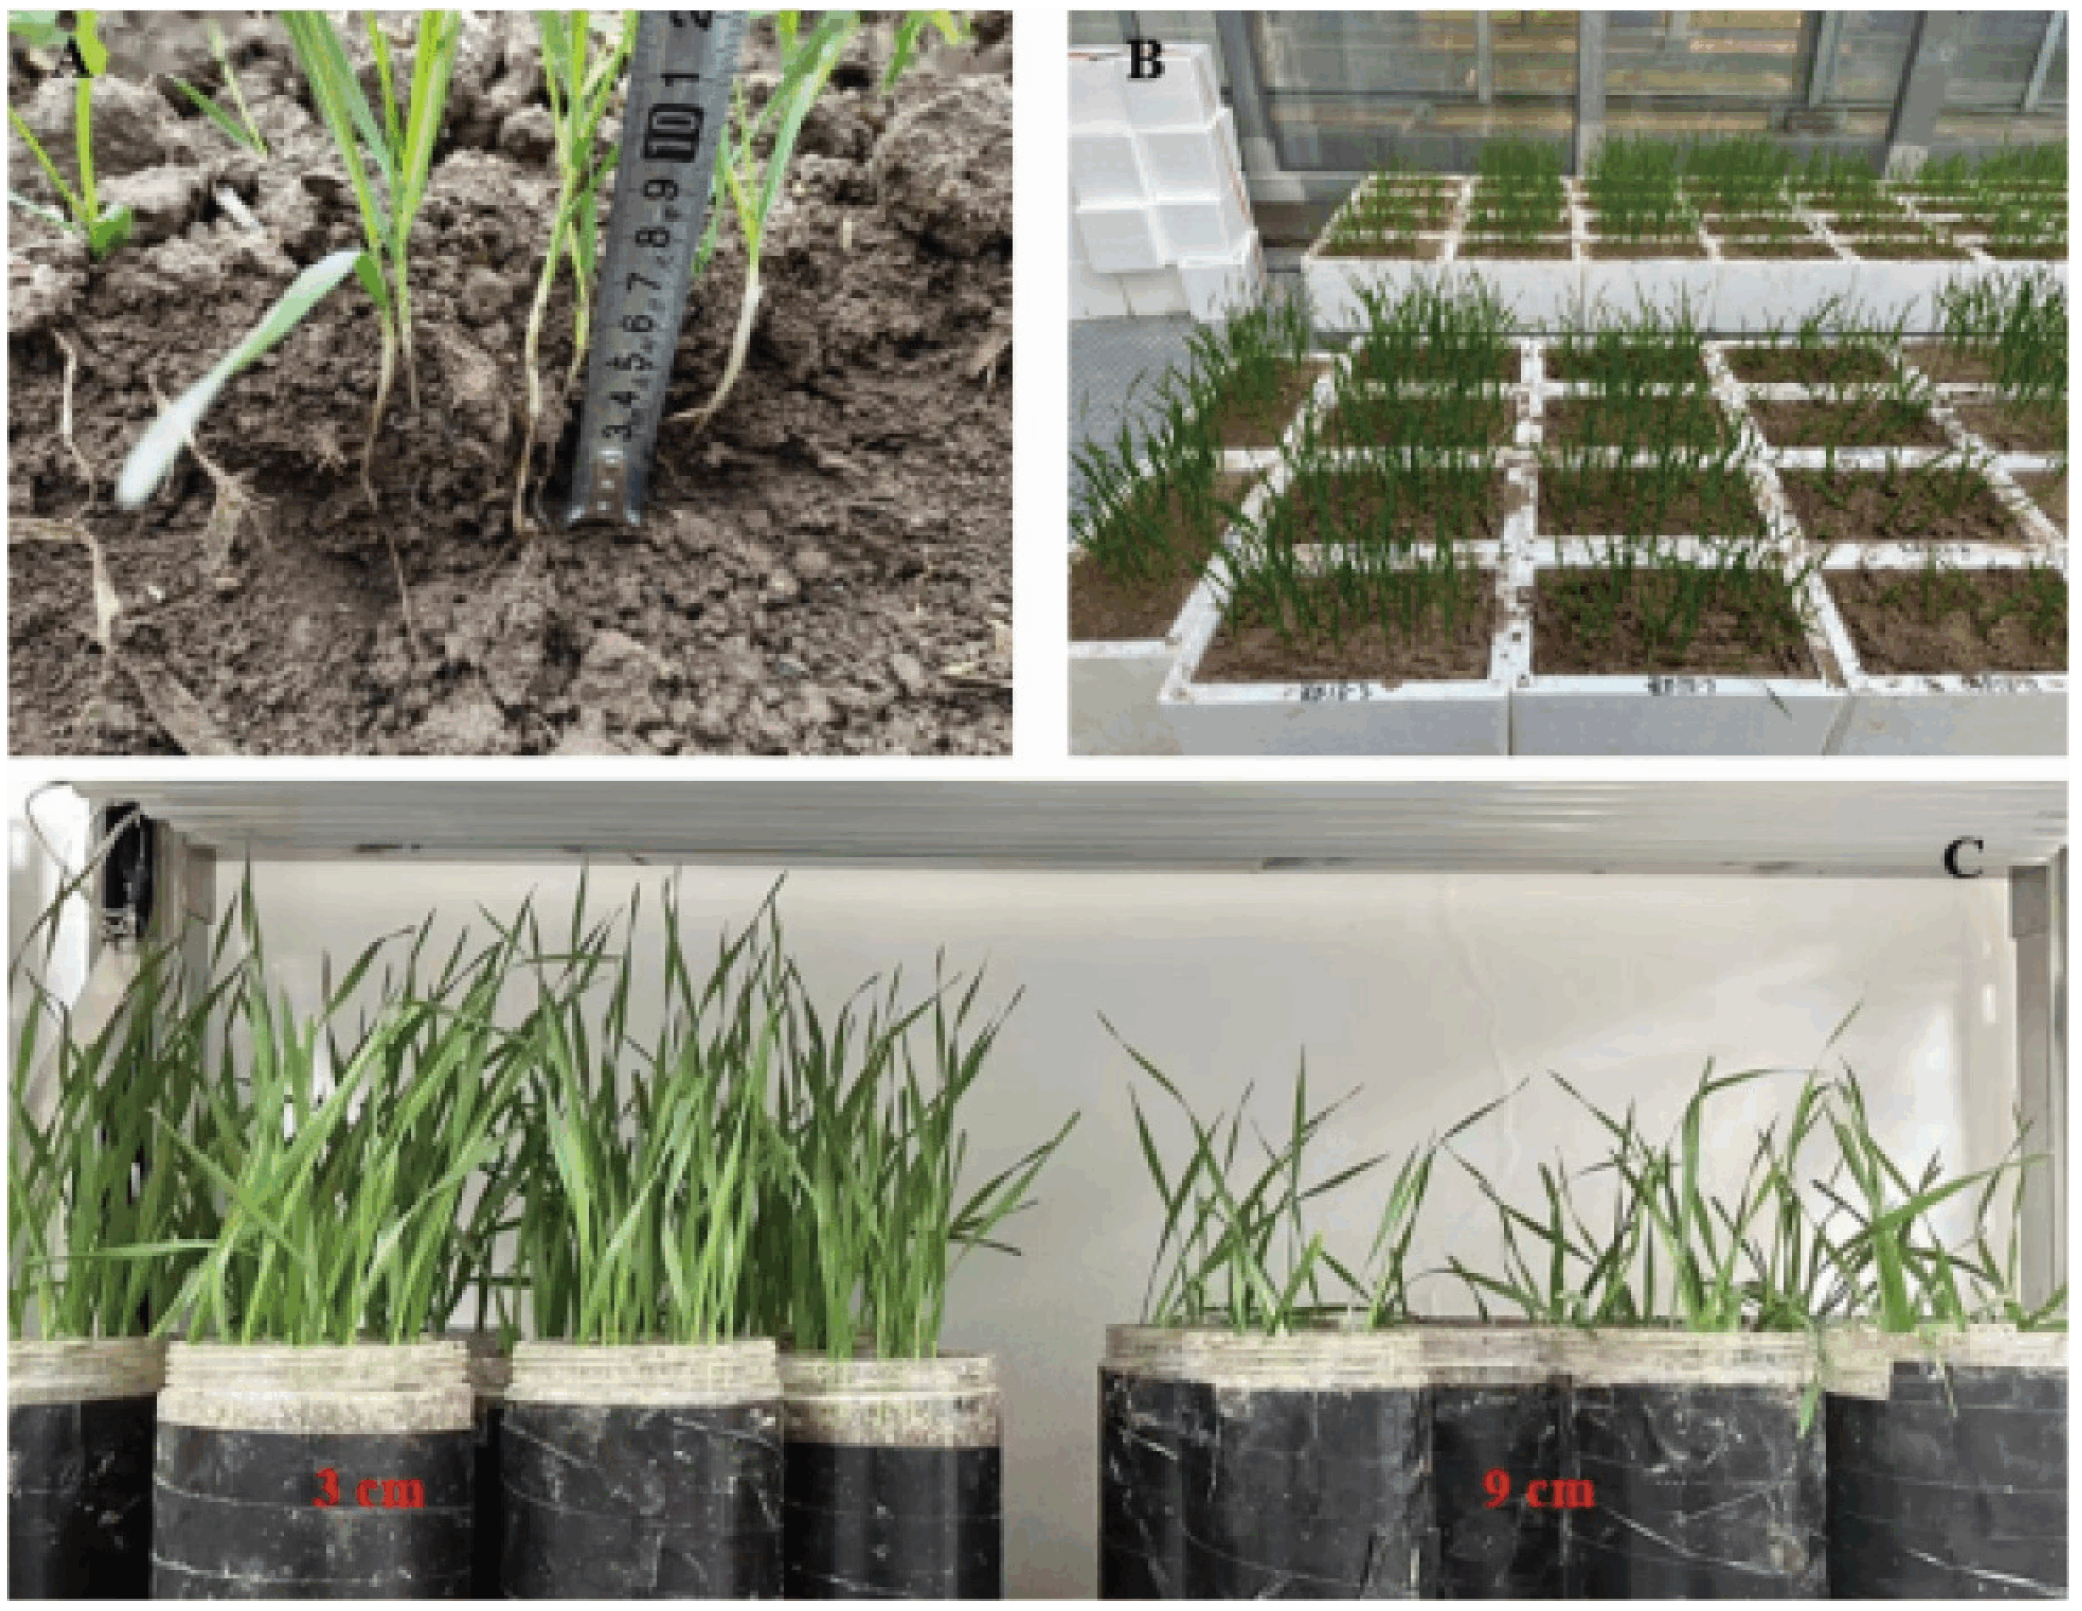
Figure A1. (A) Field experiment of deep sowing seedlings. (B) Greenhouse experiments with different depths of sowing. (C) Example of laboratory screening for deep seeding seedlings.
Agronomy 15 01466 g0a1
Figure A2. Phenotype of wheat seedlings sown at different depths. Wheat seedlings from left to right were sown at 3 cm, 5 cm, 7 cm, 9 cm, and 11 cm, respectively.
Agronomy 15 01466 g0a2

References

  1. Ji, H.; Xiao, L.; Xia, Y.; Song, H.; Liu, B.; Tang, L.; Cao, W.; Zhu, Y.; Liu, L. Effects of jointing and booting low temperature stresses on grain yield and yield components in wheat. Agric. For. Meteorol. 2017, 243, 33–42. [Google Scholar] [CrossRef]
  2. Reynolds, M.; Foulkes, J.; Furbank, R.; Griffiths, S.; King, J.; Murchie, E.; Parry, M.; Slafer, G. Achieving yield gains in wheat. Plant Cell Environ. 2012, 35, 1799–1823. [Google Scholar] [CrossRef] [PubMed]
  3. Mou, H.; Sun, L.; Wang, Z.; Wang, Y.; Song, Y.; Zhang, R.; Duan, J.; Xie, Y.; Kang, G.; Wang, Y.; et al. Effect of nitrogen application rate and planting density on the lodging resistance and grain yield of two winter wheat varieties. Sci. Agric. Sin. 2023, 56, 2863–2879. [Google Scholar]
  4. Amram, A.; Fadida-Myers, A.; Golan, G.; Nashef, K.; Ben-David, R.; Peleg, Z. Effect of GA-sensitivity on wheat early vigor and yield components under deep sowing. Front. Plant Sci. 2015, 6, 487–496. [Google Scholar] [CrossRef]
  5. Zhou, F.; Cheng, Q.; Jin, R.; Du, L.; Li, X.; Chen, X.; Liu, B.; Yuan, J.; Kong, F. Effects of kernel size and sowing depth on maize root growth in the middle Sichuan hilly area. Chinese J. Eco-Agric. 2019, 27, 1799–1811. [Google Scholar]
  6. Zhu, R.; Zhao, M.; Yao, Y.; Li, Y.; Li, X.; Liu, Z. Effects of straw returning methods and sowing depth on soil physical properties and emergence characteristics of summer peanut. Acta Agron. Sin. 2024, 50, 2106–2121. [Google Scholar]
  7. Zuo, Q.; Kuai, J.; Zhao, L.; Hu, Z.; Wu, J.; Zhou, G. The effect of sowing depth and soil compaction on the growth and yield of rapeseed in rice straw returning field. Field Crops Res. 2017, 203, 47–54. [Google Scholar] [CrossRef]
  8. Schillinger, W.F.; Donaldson, E.; Allan, R.E.; Jones, S.S. Winter wheat seedling emergence from deep sowing depths. Agron. J. 1998, 90, 582–586. [Google Scholar] [CrossRef]
  9. Brown, P.R.; Singleton, G.R.; Tann, C.R.; Mock, I. Increasing sowing depth to reduce mouse damage to winter crops. Crop Prot. 2003, 22, 653–660. [Google Scholar] [CrossRef]
  10. Chaichi, M.; Nemati, A.; Dadrasi, A.; Heydari, M.; Hassanisaadi, M.; Yousefi, A.R.; Baldwin, T.C.; Mastinu, A. Germination of triticum aestivum L.: Effects of soil-seed interaction on the growth of seedlings. Soil. Syst. 2022, 6, 37. [Google Scholar] [CrossRef]
  11. Rebetzke, G.J.; Richards, R.A.; Fettell, N.A.; Long, M.; Condon, A.G.; Forrester, R.I.; Botwright, T.L. Genotypic increases in coleoptile length improves stand establishment, vigour and grain yield of deep-sown wheat. Field Crops Res. 2007, 100, 10–23. [Google Scholar] [CrossRef]
  12. Zhao, Z.; Wang, E.; Kirkegaard, J.A.; Rebetzke, G.J. Novel wheat varieties facilitate deep sowing to beat the heat of changing climates. Nat. Clim. Change 2022, 12, 291–296. [Google Scholar] [CrossRef]
  13. Semahegn, Y.; Shimelis, H.; Laing, M.; Mathew, I. Evaluation of bread wheat (Triticum aestivum L.) genotypes for yield and related traits under drought stress conditions. Acta Agric. Scand. B Soil. Plant Sci. 2020, 70, 474–484. [Google Scholar]
  14. Zhou, B.; Wang, Z.; Yue, Y.; Ma, W.; Zhao, M. Comparison of yield and light-temperature resource use efficiency between wheat-maize and maize-maize cropping systems. Acta Agron. Sin. 2015, 41, 1393–1405. [Google Scholar] [CrossRef]
  15. Xu, C.; Mao, J.; Li, X.; Burner, D.M.; Li, C.; Hussin, S.H. Evaluation of drought tolerance in sugarcane genotypes using the membership function value of drought tolerance (MFVD). Euphytica 2023, 219, 1–13. [Google Scholar] [CrossRef]
  16. Wang, J.; Zhou, M.; Xu, R.; Lu, C.; Huang, Z. Studies on selecting indices and evaluation methods for barley’s (Hordeum vulgare L.) water logging tolerance. Sci. Agric. Sin. 2007, 10, 2145–2152. [Google Scholar]
  17. Xie, Z. Basic concepts of fuzzy sets. In Fuzzy Mathematical Methods in Agricultural Science, 3rd ed.; Huazhong University of Science and Technology Press: Wuhan, China, 1993; Volume 1, pp. 12–50. [Google Scholar]
  18. Zheng, J.; Mi, S.; Jing, J.; Bai, Z.; Li, C. Principal component analysis and comprehensive evaluation on physiological traits of tolerance to low phosphorus stress in wheat substitution. Sci. Agric. Sin. 2013, 46, 1984–1993. [Google Scholar]
  19. Rebetzke, G.J.; Bruce, S.E.; Kirkegaard, J.A. Longer coleoptiles improve emergence through crop residues to increase seedling number and biomass in wheat (Triticum Aestivum L.). Plant Soil. 2005, 272, 87–100. [Google Scholar] [CrossRef]
  20. Gooding, S.; Botwright Acuna, T.L.; Fox, P.N.; Wade, L.J. Emergence, stand establishment and vigour of deep-sown Australian and CIMMYT wheats. Anim. Prod. Sci. 2006, 46, 1167–1175. [Google Scholar] [CrossRef]
  21. Singh, P.; Ibrahim, H.M.; Flury, M.; Schillinger, W.F.; Knappenberger, T. Critical water potentials for germination of wheat cultivars in the dryland northwest USA. Seed Sci. Res. 2013, 23, 189–198. [Google Scholar] [CrossRef]
  22. Schillinger, W.F.; Schofstoll, S.E.; Smith, T.A.; Jacobsen, J.A. Laboratory method to evaluate wheat seedling emergence from deep planting depths. Agron. J. 2017, 109, 2004–2010. [Google Scholar] [CrossRef]
  23. Grzesiak, M.T.; Szczyrek, P.; Rut, G.; Ostrowska, A.; Hura, K.; Rzepka, A.; Hura, T.; Grzesiak, S. Interspecific differences in tolerance to soil compaction, drought and waterlogging stresses among maize and triticale genotypes. J. Agron. Crop Sci. 2015, 201, 330–343. [Google Scholar] [CrossRef]
  24. Yasin, M.; Andreasen, C. Effect of reduced oxygen concentration on the germination behavior of vegetable seeds. Hortic. Environ. Biotechnol. 2016, 57, 453–461. [Google Scholar] [CrossRef]
  25. Ozbingol, N.; Corbineau, F.; Come, D. Responses of tomato seeds to osmoconditioning as related to temperature and oxygen. Seed Sci. Res. 1998, 8, 377–384. [Google Scholar] [CrossRef]
  26. Zhang, M.; Dai, R.; Zhang, S.; Jiang, H. Alleviation effects of seed soaking with H2O2 on seed germination in rape under low temperature stress. JNAU 2017, 40, 963–970. [Google Scholar]
  27. Matsui, T.; Inanaga, S.; Shimotashiro, T.; An, P.; Sugimoto, Y. Morphological characters related to varietal differences in tolerance to deep sowing in wheat. Plant Prod. Sci. 2002, 5, 169–174. [Google Scholar] [CrossRef]
  28. Takeda, K.; Takahashi, H. Varietal varation for deep-seeding tolerance in barley and wheat. Breed. Res. 1999, 1, 1–8. [Google Scholar] [CrossRef]
  29. Li, Y.; Wang, X.; Zhang, Y.; Li, Y.; Gou, Z.; Chen, W.; Qi, X. Study on evaluation system for deep sowing tolerance of wheat (Triticum aestivum L.) germplasms. Tcrop 2021, 41, 37–43. [Google Scholar]
  30. Li, Y.; Wang, X.; Zhang, Y.; Gou, Z.; Chen, W.; Qi, X. Difference of deep sowing tolerance ability in wheat germplasms. Tcrop 2017, 37, 483–490. [Google Scholar]
  31. Yu, J.B.; Bai, G.H. Mapping quantitative trait loci for long coleoptile in Chinese wheat landrace wangshuibai. Crop Sci. 2010, 50, 43–50. [Google Scholar] [CrossRef]
  32. Rebetzke, G.J.; Zheng, B.; Chapman, S.C. Do wheat breeders have suitable genetic variation to overcome short coleoptiles and poor establishment in the warmer soils of future climates? Funct. Plant Biol. 2016, 43, 961–972. [Google Scholar] [CrossRef] [PubMed]
  33. Suge, H.; Nishizawa, T.; Takahashi, H.; Takeda, K. Phenotypic plasticity of internode elongation stimulated by deep-seeding and ethylene in wheat seedlings. Plant Cell Environ. 1997, 20, 961–964. [Google Scholar] [CrossRef]
  34. Luo, H.; Hill, C.B.; Zhou, G.; Zhang, X.; Li, C. Genome-wide association mapping reveals novel genes associated with coleoptile length in a worldwide collection of barley. BMC Plant Biol. 2020, 20, 346. [Google Scholar] [CrossRef] [PubMed]
  35. Liatukas, Z.; Ruzgas, V. Coleoptile length and plant height of modern tall and semi-dwarf european winter wheat varieties. Acta Soc. Bot. Pol. 2011, 80, 197–203. [Google Scholar] [CrossRef]
  36. Saeed, S.; Ullah, S.; Amin, F.; Al-Hawadi, J.S.; Okla, M.K.; Alaraidh, I.A.; AbdElgawad, H.; Liu, K.; Harrison, M.T.; Saud, S.; et al. Salicylic acid and tocopherol improve wheat (Triticum aestivum L.) physio-biochemical and agronomic features grown in deep sowing stress: A way forward towards sustainable production. BMC Plant Biol. 2024, 24, 477. [Google Scholar] [CrossRef]
  37. Wang, F.; Feng, Z.; Yang, X.; Zhou, G.; Peng, Y. Physiological parameters and transcriptomic levels reveal the response mechanism of maize to deep sowing and the mechanism of exogenous MeJA to alleviate deep sowing stress. Int. J. Mol. Sci. 2024, 25, 10718. [Google Scholar] [CrossRef]
  38. Yang, W.; Xu, D.; Li, S.; Tang, X.; Pan, S.; Chen, X.; Mo, Z. Emergence and seedling establishment of rice varieties at different sowing depths. J. Plant Growth Regul. 2021, 41, 1672–1686. [Google Scholar] [CrossRef]
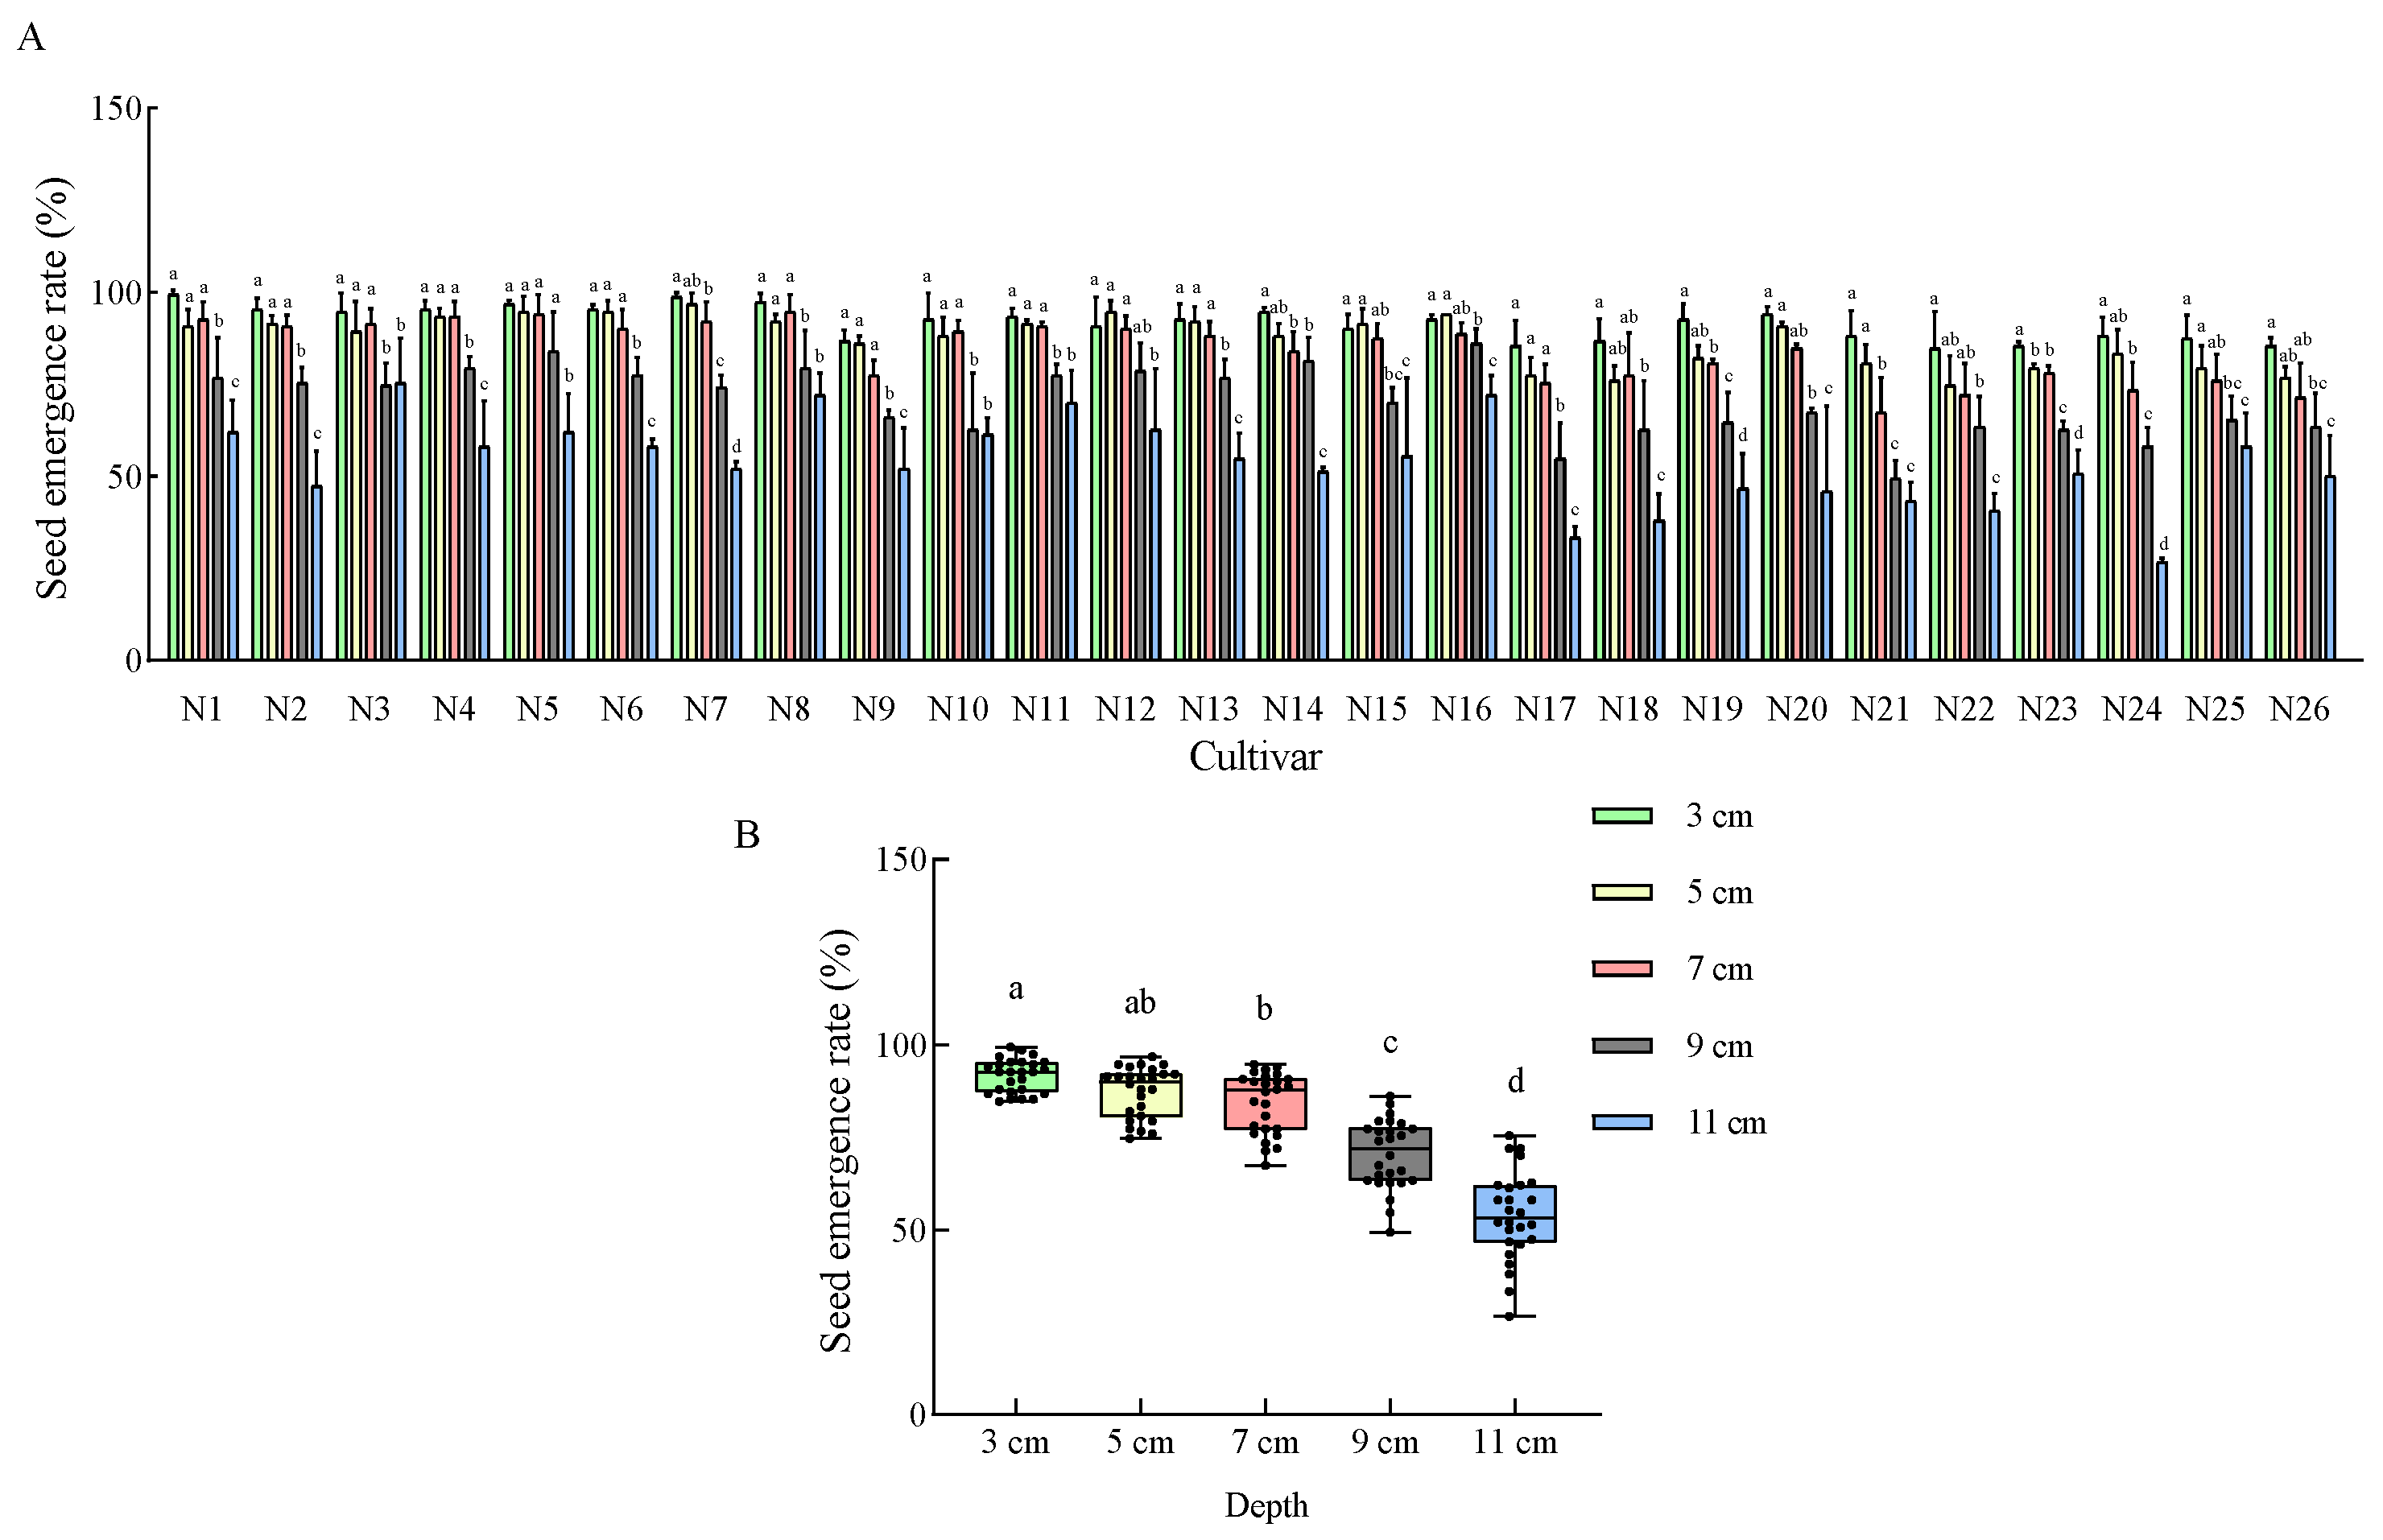
Figure 1. Changes in the emergence rate of 26 wheat varieties under different sowing depths. (A) The emergence rate of each wheat variety sown at 3 cm, 5 cm, 7 cm, 9 cm, and 11 cm. Each value is the average germination rate of 3 pots from a wheat cultivar, expressed as mean ± SE (n = 3). (B) Box plots of seedling emergence rates for 26 wheat varieties sown at 3 cm, 5 cm, 7 cm, 9 cm, and 11 cm. The border represents the upper and lower quartiles, the middle line represents the median, the dotted line represents the range of variation, and the circle represents the average value of each variety. The different letters indicate significant differences (p < 0.05) between various treatments.
Agronomy 15 01466 g001
Figure 2. Changes in the germination characteristics and seedling phenotypes of 26 wheat varieties subjected to deep sowing treatment. The cultivars are arranged from large to small according to their deep sowing resistance coefficient. (A,B) The emergence rate and time of different wheat varieties sown at 3 cm and 9 cm. Each value is the average of the emergence rate and emergence time of 3 pots from a wheat cultivar, expressed as mean ± SE (n = 3). (CG) Seedling phenotype of various wheat varieties sown at 3 cm and 9 cm. Each value is the average of 10 plants from a wheat cultivar (the average dry weight per unit area per 3 pots), expressed as mean ± SE (n = 10). The black circle represents the deep sowing resistance coefficient, calculated as Parameter (9 cm)/Parameter (3 cm).
Agronomy 15 01466 g002
Figure 3. Changes in relevant indicators of germination and growth characteristics of wheat seedlings after deep sowing. (A) Variation in emergence rate with different sowing depths. (B) Variation in emergence time with different sowing depths. (C) Variation in coleoptile length with different sowing depths. (D) Variation in coleoptile intemode with different sowing depths. (E) Variation in seeding height with different sowing depths. (F) Variation in leaf area with different sowing depths. (G) Variation in shoot dry weight with different sowing depths. The border represents the upper and lower quartiles, the median line represents the median, the dotted line represents the range of variation, and the circle represents the average value of each variety. Significant differences are indicated by asterisks (** p < 0.01).
Agronomy 15 01466 g003
Figure 4. (A) The average deep sowing sensitivity of 26 wheat varieties. (B) Variation coefficient (CV%) of deep sowing sensitivity for 26 wheat varieties. ET, Emergence time; SDW, Shoot dry weight per unit area; CL, Coleoptile length; CI, Coleoptile internode; SH, seedling height; LA, The latest expanded leaf area; ER, Emergence rate. Sharing the same lowercase letters signifies no significant relationship between the two.
Agronomy 15 01466 g004
Figure 5. Correlation analysis of deep sowing resistance coefficient of 26 wheat varieties. ET, Emergence time; SDW, Shoot dry weight per unit area; CL, Coleoptile length; CI, Coleoptile internode; SH, Seedling height; LA, The latest expanded leaf area; ER, Emergence rate. Lower left part: Significant differences are indicated by asterisks (* p < 0.05 and ** p < 0.01); ns, no significant difference. Upper right part: Each value represents a correlation coefficient value.
Agronomy 15 01466 g005
Figure 6. Principal component analysis of deep sowing resistance coefficient for 26 wheat varieties. ET, Emergence time; SDW, Shoot dry weight per unit area; CL, Coleoptile length; CI, Coleoptile internode; SH, Seedling height; LA, The latest expanded leaf area; ER, Emergence rate.
Agronomy 15 01466 g006
Figure 7. Systematic clustering analysis of 26 wheat varieties.
Agronomy 15 01466 g007
Table 1. Wheat cultivars used in this study.
NumberNameAbbreviationNumberNameAbbreviation
1Fanmai 5N114Zhengmai 1860N14
2Bainong 4199N215Zhengmai 0943N15
3Zhongmai 895N316Zhengmai 20N16
4Zhengmai 0919N417Zhengmai 369N17
5Zhengmai 661N518Fanmai 8N18
6Zhengmai 1354N619Zhoumai 22N19
7Xinmai 26N720Zhengmai 22N20
8Aikang 58N821Xinmai 45N21
9Zhengmai 662N922Zhengmai 113N22
10Xinong 511N1023Hemai 1707N23
11Zhengmai 136N1124Jimai 22N24
12Wanfeng 269N1225Zhengmai 16N25
13Zhengmai 379N1326Zhengmai 7698N26
Table 2. Classification of wheat varieties according to deep sowing tolerance.
ClassificationWheat Varieties
First kindZhengmai 379Zhengmai 136Fanmai 5
Second kindBainong 4199Zhongmai 895Zhengmai 0919Zhengmai 661Zhengmai 1354
Xinmai 26Aikang 58Zhengmai 662Xinong 511Wanfeng 269
Zhengmai 1860Zhengmai 0943Zhengmai 20Zhengmai 22Zhengmai 113
Hemai 1707Jimai 22Zhengmai 16Zhengmai 7698
Third kindZhengmai369Fanmai 8Zhoumai 36Xinmai 45
Table 3. Correlation analysis between deep sowing resistance coefficient and germination and growth traits.
TraitsETSDWCLCISHLA
D values0.57 **0.44 *0.86 **0.38−0.010.26
Note: ET, Emergence time; SDW, Shoot dry weight per unit area; CL, Coleoptile length; CI, Coleoptile internode; SH, Seedling height; LA, The latest expanded leaf area. Lower left part: Significant differences are indicated by asterisks (* p < 0.05 and ** p < 0.01).
Disclaimer/Publisher’s Note: The statements, opinions and data contained in all publications are solely those of the individual author(s) and contributor(s) and not of MDPI and/or the editor(s). MDPI and/or the editor(s) disclaim responsibility for any injury to people or property resulting from any ideas, methods, instructions or products referred to in the content.