Article

Surviving the Extremes: The Synergistic Impact of Drought and Salinity on Thymus capitatus Growth, Physiology, and Biochemistry

Department of Medicinal and Aromatic Plants, Institute of Horticultural Science, Hungarian University of Agriculture and Life Sciences, Villányi Str. 29-43, H-1118 Budapest, Hungary
*
Author to whom correspondence should be addressed.
Agronomy 2025, 15(6), 1449; https://doi.org/10.3390/agronomy15061449
Submission received: 22 May 2025 / Revised: 10 June 2025 / Accepted: 11 June 2025 / Published: 13 June 2025

Abstract

Thymus capitatus, a Mediterranean medicinal plant, exhibits complex physiological and biochemical responses to environmental stress. This study investigated the effects of drought (40% SWC), salinity (70% SWC + 90 mM NaCl), and their combination (40% SWC + 90 mM NaCl) on the morphological, physiological, and biochemical traits of T. capitatus over 39 days. All stress treatments reduced shoot and root biomass, relative water content, chlorophyll, and carotenoids, with combined stress causing the most severe declines. Proline and soluble sugars accumulated, indicating osmotic adjustment. Total polyphenol content remained stable under single stress but increased under combined stress (123.28 mg GAE/g DW), suggesting an enhanced defense response. Hydrogen peroxide levels surged, particularly under combined stress (7.76 µmol H2O2/g FW), reflecting oxidative stress. Essential oil yield declined from 3.22 mL/100 g DW under control conditions to −30% and −34% under drought and combined stress, respectively, while carvacrol content increased (+4.71%) under combined stress, indicating a stress-induced metabolic shift. Antioxidant capacity significantly declined under salt and combined stress, likely due to oxidative stress overwhelming the plant’s defense mechanisms. These findings highlight Thymus capitata’s resilience, with combined stress having the most detrimental impact, followed by drought, while salinity had a more moderate effect. Despite these challenges, the plant retained key bioactive compounds, reinforcing its potential for stress prone environments.

1. Introduction

Thymus capitatus (L.) Hoffmanns. & Link (formerly classified as Thymbra capitata (L.) Cav. or Coridothymus capitatus (L.) Rchb. f.), commonly known as Zaatar [1,2,3,4], is a perennial, woody, aromatic shrub native to the Mediterranean region, where it grows naturally on dry, rocky hillsides and can also be cultivated, highlighting its adaptability to challenging environments [5,6,7]. Typically ranging from 20 to 40 cm in height, it has upright, spreading branches and forms dense, compact clusters. The small, glandular leaves (6–12 mm) are arranged oppositely, with a linear to lanceolate shape and pointed tips, contributing to the plant’s distinctive appearance [5,8].
The essential oil extracted from T. capitatus is renowned for its abundance of carvacrol, the primary volatile compound often credited with its extensive biological activities [9]. However, variations in the profile of active compounds across different studies highlight an intriguing phenomenon: despite differences in composition, these essential oils consistently exhibit similar properties. Such variability can be attributed to diverse factors, including genetic makeup, developmental stages, environmental conditions, agricultural practices, and processing techniques [10].
A recent study on Moroccan T. capitatus essential oil identified 28 constituents, with oxygenated monoterpenes comprising 79.79%, predominantly carvacrol (75.73%), which exhibited strong antioxidant and antifungal activities [11]. Similarly, Tunisian T. capitatus, containing 65.38% carvacrol, demonstrated potent antioxidant, antibacterial, and antifungal efficacy while being non-cytotoxic to human colon cancer cell line HCT116 [12]. These findings align with those of Benoutman et al. [13], who emphasized the role of T. capitatus essential oil and extracts beyond their antioxidant and antifungal properties; these compounds exhibited significant DNA protective activity, positioning this herb as a promising candidate for phytopharmaceutical applications and the food industry.
Conversely, research conducted on the Greek island of Lemnos revealed thymol (39.8%) as the dominant compound in T. capitatus essential oil, followed by p-cymene (31.1%) and carvacrol (5.7%); this composition exhibited notable antioxidant activity and successfully inhibited the growth of major foodborne pathogens, including Salmonella enterica serovar Typhimurium, Listeria monocytogenes, and Yersinia enterocolitica [14]. In another study, T. capitatus essential oil, rich in both thymol and carvacrol, displayed remarkable anticancer activity against breast cancer cells (T47D) by inducing apoptosis and disrupting cellular functions [15]. Furthermore, its efficient antioxidant capacity effectively inhibited lipid peroxidation, enhancing its potential as a therapeutic agent for antioxidant and anticancer applications [15]. Moreover, T. capitatus essential oil is expanding its application in unconventional fields, such as dairy farming. Nehme et al. [16] explored its antibacterial properties in dairy cattle, reporting no adverse effects on milk quality, further solidifying the oil’s versatility and potential in diverse industries.
Today, in the context of climate change, research highlights that the shifting climate is poised to significantly influence the habitat suitability and distribution of Thymus spp., largely due to variations in abiotic factors [17]. However, understanding the response of Thymus spp. to these factors remains a complex challenge, as demonstrated by numerous studies.
Drought stress, for instance, has been shown to impair photosynthesis, primarily by reducing chlorophyll content and disrupting enzymatic activity, thereby affecting overall thyme growth [18,19]. Additionally, drought stress was observed to decrease nitrogen and phosphorus levels in Thymus daenensis, essential for phenolic synthesis, while increasing cinnamic acid, rosmarinic acid, and most phenolic compounds, except thymol. This suggests a complex adaptive response to stress [20]. Similarly, another study on Thymus eriocalyx found that drought stress elevated the levels of thymol, carvacrol, and trans-caryophyllene, while reducing the concentrations of other volatile oil compounds [21].
In Egypt, T. capitatus has been noted for its high drought tolerance and efficient oxidative stress management, attributed to its rich anthocyanin and phenolic compound content, making it highly suitable for sustainable development in arid regions [22]. Under such stress conditions, plants synthesize low-molecular-weight osmolytes, including proline, glycine betaine, and soluble sugars, which stabilize cellular functions [19,23]. This process is often accompanied by increased levels of hydrogen peroxide and malondialdehyde, which help plants cope with oxidative stress [24,25].
Furthermore, salinity stress, a significant global challenge affecting plant growth and productivity, exerts a distinct yet equally intricate impact on Thymus spp. This stress leads to the accumulation of ions such as sodium (Na+) and chloride (Cl) in plant tissues, resulting in ion toxicity and triggering oxidative stress [26,27]. Much like drought stress, the response of Thymus spp. to salinity is multifaceted. For instance, salinity levels of 60 and 90 mM NaCl have been shown to significantly reduce dry matter production in Thymus vulgaris by 28% and 40%, respectively, while simultaneously increasing total phenolic content by approximately 20% at 60 mM NaCl, with notable enhancements in gallic and rosmarinic acids [28]. This adaptive response has been attributed to the activation of antioxidative systems by thymol, which mitigates reactive oxygen species (ROS) accumulation under saline conditions [29]. Similarly, Khalil [30] reported that salinity levels starting from 3.13 dS/m negatively affected the growth parameters, chlorophyll content, and chemical composition of T. capitatus grown in Egypt, suggesting this species is relatively sensitive to salinity stress.
Despite the clear evidence of the impacts of individual stressors on T. capitatus, most previous studies have focused exclusively on isolating these stressors, offering limited insights into their combined effects. To address this gap, our current study integrates the impact of both drought and salinity stress to provide a comprehensive understanding of the morphological, physiological, and biochemical responses of T. capitatus.

2. Materials and Methods

All chemicals and reagents used in this study were of analytical grade. Acetone (80%), sulfosalicylic acid, glacial acetic acid, proline, ethanol, anthrone, and titanium reagents were obtained from Sigma-Aldrich (St. Louis, MO, USA). Ninhydrin, gallic acid, TPTZ and ferric chloride were purchased from Merck KGaA (Darmstadt, Germany), and toluene from Carl ROTH GmbH (Karlsruhe, Germany). Glucose and Folin–Ciocalteu reagent were provided by VWR Chemicals (Leuven, Belgium). Ascorbic acid was sourced from Reanal Labor (Budapest, Hungary), while ammonia, sulfuric acid and sodium carbonate were obtained from Lach-Ner (Neratovice, Czech Republic). Hydrogen peroxide was purchased from Fisher Chemical (Loughborough, UK).
The Clevenger-type apparatus used for essential oil extraction was supplied by VWR Chemicals (Leuven, Belgium). The centrifugation was carried out using a Heraeus Biofuge Primo centrifuge (Thermo Fisher Scientific, Waltham, MA, USA), and absorbance measurements were performed using a spectrophotometer (Model Evolution 201, Thermo Fisher Scientific, Waltham, MA, USA). Volatile compound identification was conducted using a gas chromatograph (Model 6890 N, Agilent Technologies, Santa Clara, CA, USA) coupled with a mass spectrometer (Model 5975 Inert, Agilent Technologies, Santa Clara, CA, USA).

2.1. Experiment Design

T. capitatus seed material was collected from wild plants in the Aousja hills, located in the north of Tunisia, within the Bizerte Governorate (37°09′35.6″ N 10°06′00.9″ E). In February 2024, the seeds were pretreated with 100 ppm gibberellic acid for 24 h. Following this, they were sown and maintained in a phytotron at 15 °C with a photoperiod of 16 h of light per day. After approximately two weeks, T. capitatus seedlings emerged. At this stage, the plants were kept in the phytotron under controlled conditions (daytime temperature: 22 °C; nighttime temperature: 20 °C; humidity: 50%; daytime light duration: 16 h) for three months.
On 1 June 2024, the plants were transferred to the greenhouse at the Hungarian University of Agriculture and Life Sciences, Budapest, for a 10-day acclimatization period before the experiment started. The experimental phase lasted for 39 days, until 19 July 2024.
The growth medium used for the experiment consisted of a mixture of 40% peat moss, 30% potting soil, 20% perlite, and 10% sand. The composition and characteristics of these components are detailed in Table 1. The soil water capacity (SWC) was determined by calculating the saturated soil weight (Ss) and oven-dry soil weight (Ds) of the pots filled with the growth medium. SWC was calculated using the formula provided by Reynolds [31]:
SWC (%) = [(Ss − Ds)/Ds] × 100
The plants were transplanted into larger pots (2 L) and randomly divided into four treatment groups, each containing 20 plants: control (70% SWC), drought stress (40% SWC), salt stress (70% SWC + 90 mM NaCl), and combined drought and salt stress (40% SWC + 90 mM NaCl).
Watering was performed twice a week using normal tap water, which was analyzed prior to the experiment to determine its salinity, as shown in Table 2. The salinity of the tap water was found to be approximately 1.037 mM, and this concentration was used as the baseline for the control and drought stress treatments. For the salt stress and combined stress treatments, NaCl was added to the tap water to achieve a final concentration of 90 mM.

2.2. Morphological Parameters

2.2.1. Shoot Parameters Determination

One day prior to harvest, the height and number of shoots of all thyme plants were recorded. On the day of harvest, the fresh weight of the shoots was measured. The shoots were then air-dried, and their dry weight was subsequently determined.

2.2.2. Root Parameters Determination

On the same day as the harvest, five plants were randomly selected from each treatment. Their roots were carefully cleaned, and both their length and fresh weight were measured. After drying, the dry weight of the roots was also recorded.

2.3. Physiological Parameters

2.3.1. Relative Water Content Determination

The relative water content (RWC) of five randomly selected plants from each treatment was determined following the method described by Orsini et al. [32]. Twenty leaves from T. capitatus were carefully harvested and immediately weighed to record their fresh weight (FW). The leaves were then submerged in distilled water and kept at 4 °C for 24 h to reach their saturated weight (SW). After that, they were oven-dried at 70 °C for 48 h to obtain their dry weight (DW). The RWC was calculated using the following formula:
RWC (%) = [(FW − DW)/(SW − DW)] × 100

2.3.2. Pigments Determination

The chlorophyll and carotenoid levels in the plants were determined using the method described by Mackinney [33]. For this analysis, and with four replications, 0.1 g of fresh leaves was homogenized in 10 mL of acetone (80%). The mixture was then centrifuged (Heraeus Biofuge Primo centrifuge) at 1000× g for 3 min at 4 °C. The absorbance of the resulting supernatant was measured at three wavelengths: 663 nm, 644 nm, and 480 nm, using a Thermo Fisher Scientific spectrophotometer (Model: Evolution 201). The pigment levels were calculated using the following formula:
Chlorophyll a = [12.7 × absorbance at (663nm) − 2.69 × absorbance at (644nm)] × (V/w)
Chlorophyll b = [22.9 × absorbance at (644 nm) − 4.68 × absorbance at (663 nm)] × (V/w)
Chlorophyll a + b = [20.2 × absorbance at (644 nm) + 8.02 × absorbance at (663 nm)] × (V/w)
Carotenoids = [5.01 × absorbance at (480 nm)] × (V/w)
where: V = volume of tissue extract (10 mL); w = fresh weight of the tissue (0.1 g).

2.3.3. Proline Content Determination

The method described by Bates et al. [34] was adopted for determining proline content. Proline was extracted from 0.5 g of plant tissue in four replications by adding 3 mL of 3% sulfosalicylic acid. The homogenate was filtered through Whatman filter paper, and 2 mL of the filtrate was transferred to a test tube. To this, 2 mL of ninhydrin reagent and 2 mL of glacial acetic acid were added. The mixture was incubated in a boiling water bath for 1 h. Afterward, the tubes were immediately cooled on ice, and 4 mL of toluene was added. The solution was vortexed and, after phase separation, the absorbance of the upper layer was measured at 520 nm using a Thermo Fisher Scientific spectrophotometer (Model: Evolution 201). Calibration was performed using a stock solution of proline at known concentrations (2, 4, 6, 8 and 10 µg/mL), and the results were expressed as micromoles of proline per gram of fresh weight (µmol/g FW).

2.3.4. Soluble Sugar Content Determination

The extraction of soluble sugars was carried out using the method outlined by Trevelyan et al. [35]. Samples (0.4 g) were treated with 5 mL of 95% ethanol, heated at 85 °C in a water bath for 20 min, and then centrifuged at 10,000× g for 10 min. In chilled test tubes, 1 mL of the sugar extract was layered onto 5 mL of anthrone reagent, which was prepared by dissolving 200 mg of anthrone in 100 mL of a 5:2 sulfuric acid to distilled water solution. This mixture was then incubated in boiling water for 10 min. After cooling, the absorbance was measured at 620 nm. Glucose standards were used for calibration at known concentrations of 20, 40, 60, 80 and 100 µg/mL and the results were expressed as milligrams of glucose per gram of fresh weight (mg/g FW).

2.4. Biochemical Parameters

2.4.1. Essential Oil Content Determination

The dried plant material was finely cut and placed into a distillation flask, followed by the addition of water to initiate the distillation process. The distillation was carried out for 2 h using a Clevenger-type apparatus, as described in Pharmacopoea Hungarica 8.0 [36]. After completing the distillation, the essential oil content in each sample was measured and compared to the minimum essential oil level of 0.3 mL/100 g dry weight, as specified by the European Pharmacopoeia 11.0 [37]. The results were then expressed as milliliters of essential oil per 100 g of dry weight (mL/100 g DW).

2.4.2. Essential Oil Composition Determination

Following the distillation process, the extracted essential oil was analyzed to determine its composition and the levels of volatile compounds across different treatments. Gas chromatography with flame ionization detection (GC–FID) was performed using an Agilent Technologies 6890 N GC System equipped with an HP-5 capillary column and helium as the carrier gas. For gas chromatography–mass spectrometry (GC–MS), the same system was coupled to an Agilent MS 5975 inert detector operating in full scan mode. These methods have been thoroughly described in our previous research [38].

2.4.3. Total Polyphenols Determination

In four replications, dried plant material was ground into a fine powder, and 0.5 g of the sample, in triplicate, was measured and mixed with 50 mL of boiling water to extract active compounds. The mixture was left for 24 h, after which it was filtered, and a sample from the extract was stored in the freezer until further analysis of total polyphenols and antioxidant properties.
The total polyphenol content was determined using the method described by Singleton and Rossi [39]. Briefly, 2.5 mL of Folin–Ciocalteu reagent was added to a test tube, followed by 460 µL of distilled water and 40 µL of the sample. Finally, 2 mL of sodium carbonate (Na2CO3) was added. The tubes were immediately incubated in a warm water bath until a color change occurred, and the absorbance was measured at 760 nm using a Thermo Fisher Scientific spectrophotometer (Model: Evolution 201). Calibration was performed using gallic acid at concentrations of 1.06, 2.27, 3.35, 4.54, and 5.69 µg/mL, and results were expressed as milligrams of gallic acid equivalents per gram of dry weight (mg GAE/g DW).

2.4.4. Antioxidant Capacity Determination

The antioxidant capacity of the samples was measured using the FRAP (Ferric Reducing Antioxidant Power) assay based on the method by Benzie and Strain [40]. The FRAP solution was prepared by mixing 50 mL of acetate buffer, 5 mL of TPTZ (5 mL of 2,4,6-Tripyridyl-S-triazine) solution, and 5 mL of ferric chloride solution. In a test tube, 1.5 mL of the FRAP solution was added, along with 40 µL of distilled water and 10 µL of the sample. The mixture was vortexed and the absorbance was measured at 593 nm using a Thermo Fisher Scientific spectrophotometer (Model: Evolution 201). Calibration was carried out using ascorbic acid standards at concentrations of 1.02, 2.04, 3.06, 4.08, and 5.10 µg/mL, and results were expressed as milligrams of ascorbic acid equivalents per gram of dry weight (mg AAE/g DW).

2.4.5. Hydrogen Peroxide (H2O2) Level Determination

The determination of hydrogen peroxide levels was performed using the method from [41], which relies on the direct reaction of H2O2 with titanium. A 1 g portion of plant tissue was homogenized in 2 mL of cold acetone and centrifuged at 10,000× g for 10 min using a Heraeus Biofuge Primo centrifuge. Afterwards, 0.1 mL of titanium reagent (20% titanium tetrachloride in concentrated HCl) was added to 1 mL of the supernatant in a new test tube, allowing the reaction to occur fully.
To precipitate the Ti-H2O2 complex, 0.2 mL of 17 M ammonia was added, and the mixture was centrifuged. The resulting precipitate was washed five times with cold acetone, with each washing step involving shaking, centrifugation, and removal of acetone. The final precipitate was dissolved in 3 mL of 2 N H2SO4, and the absorbance was measured at 410 nm using a Thermo Fisher Scientific spectrophotometer (Model: Evolution 201). Calibration was conducted using hydrogen peroxide standards at concentrations of 0.1, 0.2, 0.4, 0.6, and 0.8 µM, and results were expressed as micromoles of hydrogen peroxide per gram of fresh weight (µmol/g FW).

2.5. Evaluation of Stress Indices

The stress susceptibility index (SSI) and stress tolerance index (STI) were calculated to provide meaningful insights into the plants’ sensitivity to and resilience against the imposed stress factors. These indices serve as essential tools for assessing plant performance under adverse conditions.

2.5.1. Stress Susceptibility Index

As outlined by Fischer and Maurer [42], the stress susceptibility index highlights the degree of sensitivity of each treatment to the applied stress. It is calculated using the following formula:
SSI = [(1 − Ys/Yp)/SI]
where: Ys = plant weight under stress; Yp = average weight of unstressed plants; SI = stress intensity (SI = 1 − ( Y s ¯ / Y p ¯ ), where Y s ¯ = average weight of plants of all treatments under stress).

2.5.2. Stress Tolerance Index

The stress tolerance index is an effective measure to identify treatments that maintain higher yield potential under stress relative to their performance under optimal conditions. According to Fernandez G. C [43], STI is determined using the following formula:
STI = ( Ys × Yp ) / Y p 2
where: Ys = plant weight under stress; Yp = average weight of unstressed plants.

2.6. Statistical Analysis

The experiment was designed using a completely randomized layout. Data analysis was performed through a one-way ANOVA, followed by either the Tukey HSD test or the Games–Howell test to determine significant differences, with a significance level of p < 0.05, ensured after assessing normality and homogeneity. All statistical analyses were carried out using IBM SPSS Statistics (v27). Additionally, principal component analysis (PCA) and the clustered heatmap were generated using RStudio (2024.12.0 Build 467).

3. Results

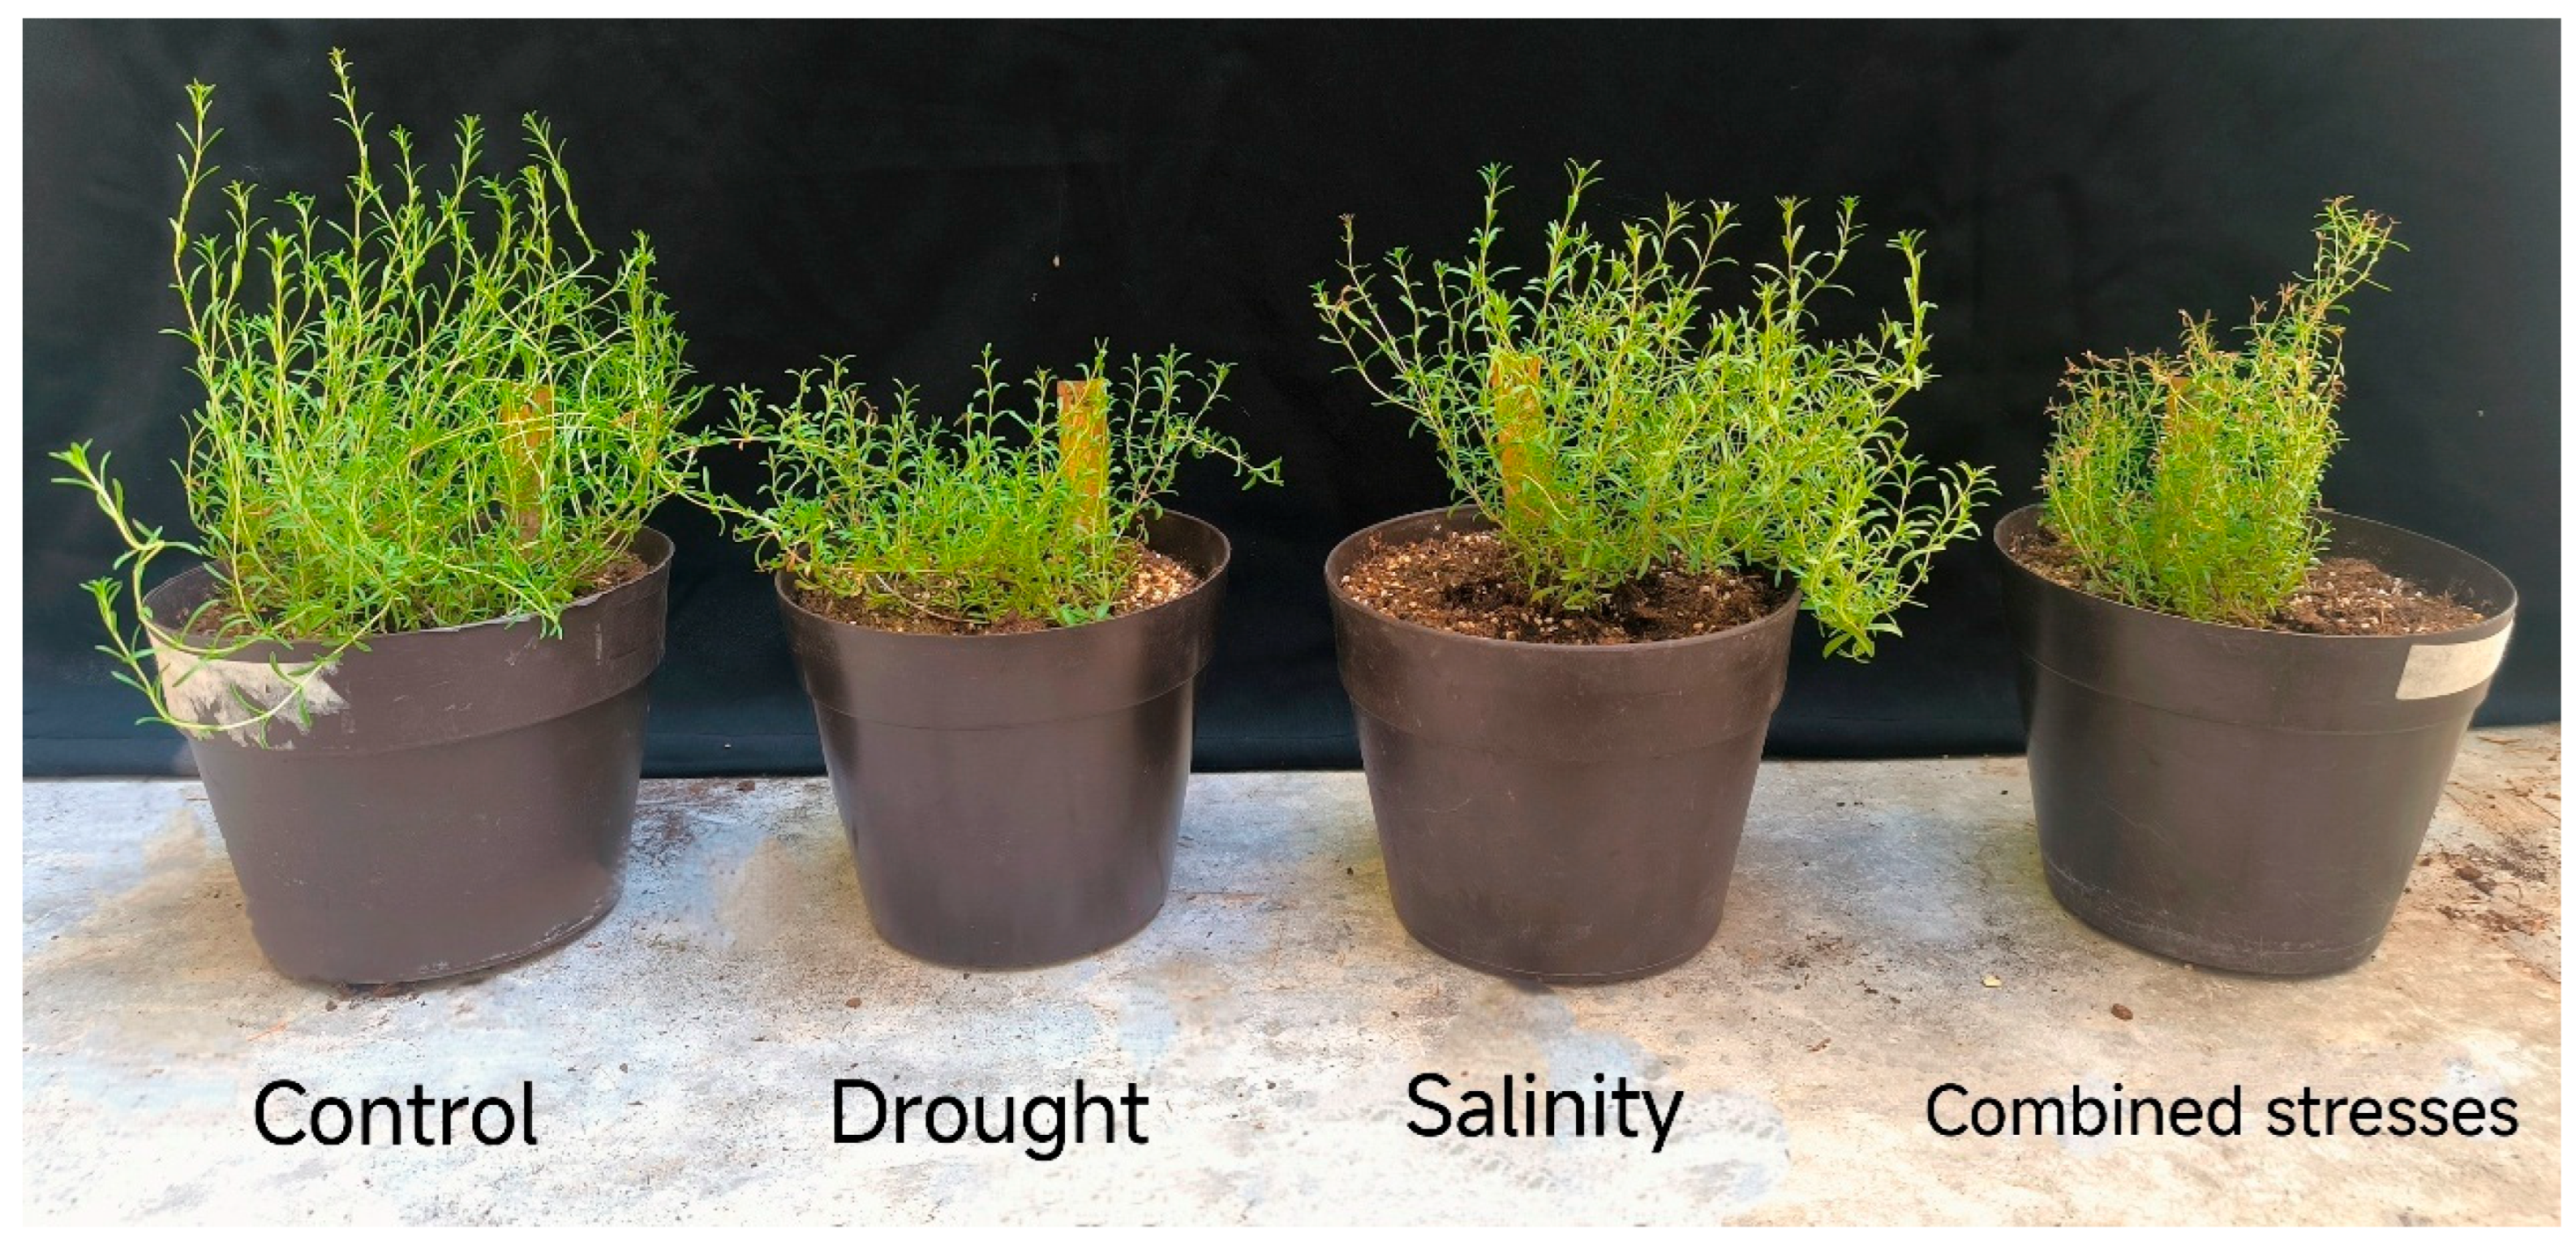
3.1. Morphological Responses of Plants to Stress Conditions

3.1.1. Shoot Parameters

Under normal conditions, T. capitatus exhibits the highest mean shoot height (27 cm), as shown in Table 3, which differs significantly (p < 0.05) from all other treatments, except for salinity stress, where shoot height remains relatively stable. Drought stress reduces this parameter to 22.25 cm, and the combined stress (drought + salinity) further lowers it to 20.70 cm, though the difference between these two conditions is not statistically significant.
Drought and salinity stress significantly reduced the average number of shoots per plant in T. capitatus compared to the control, where the highest count was recorded (29.25 shoots per plant). The combined stress (drought + salinity) led to an even greater reduction, showing the lowest average shoot number, though this difference was not statistically significant when compared to drought stress alone (Table 3).
Fresh shoot weight declined significantly across all stressed treatments relative to the control. A similar trend was observed for dry shoot weight, except under salinity stress, which did not differ significantly from the control (Table 3). Overall, the combination of drought and salinity stress had the most severe impact, suggesting that T. capitatus struggles to adapt to the simultaneous presence of these stress factors. Figure 1 provides visual evidence for these results, demonstrating the adverse effects of the applied stresses on plant morphology.

3.1.2. Root Parameters

The measured root parameters of T. capitatus are summarized in Table 4. All stress conditions significantly reduced root length by 39%, 32%, and 42% under drought, salinity, and combined stress treatments, respectively, compared to the control, which exhibited the longest roots (39.53 cm). This reduction is clearly visualized and evidenced in Figure 2.
Similarly, fresh and dry root weights decreased significantly across all stress treatments, with no significant differences among them (Table 4). This suggests that the application of individual stress factors induced similar reductions in root development, comparable to their combined effect (40% soil water content + 90 mM NaCl). The absence of an intensified effect under combined stress indicates that T. capitatus may reach a physiological threshold in root growth limitation.

3.2. Physiological Responses of Plants to Stress Conditions

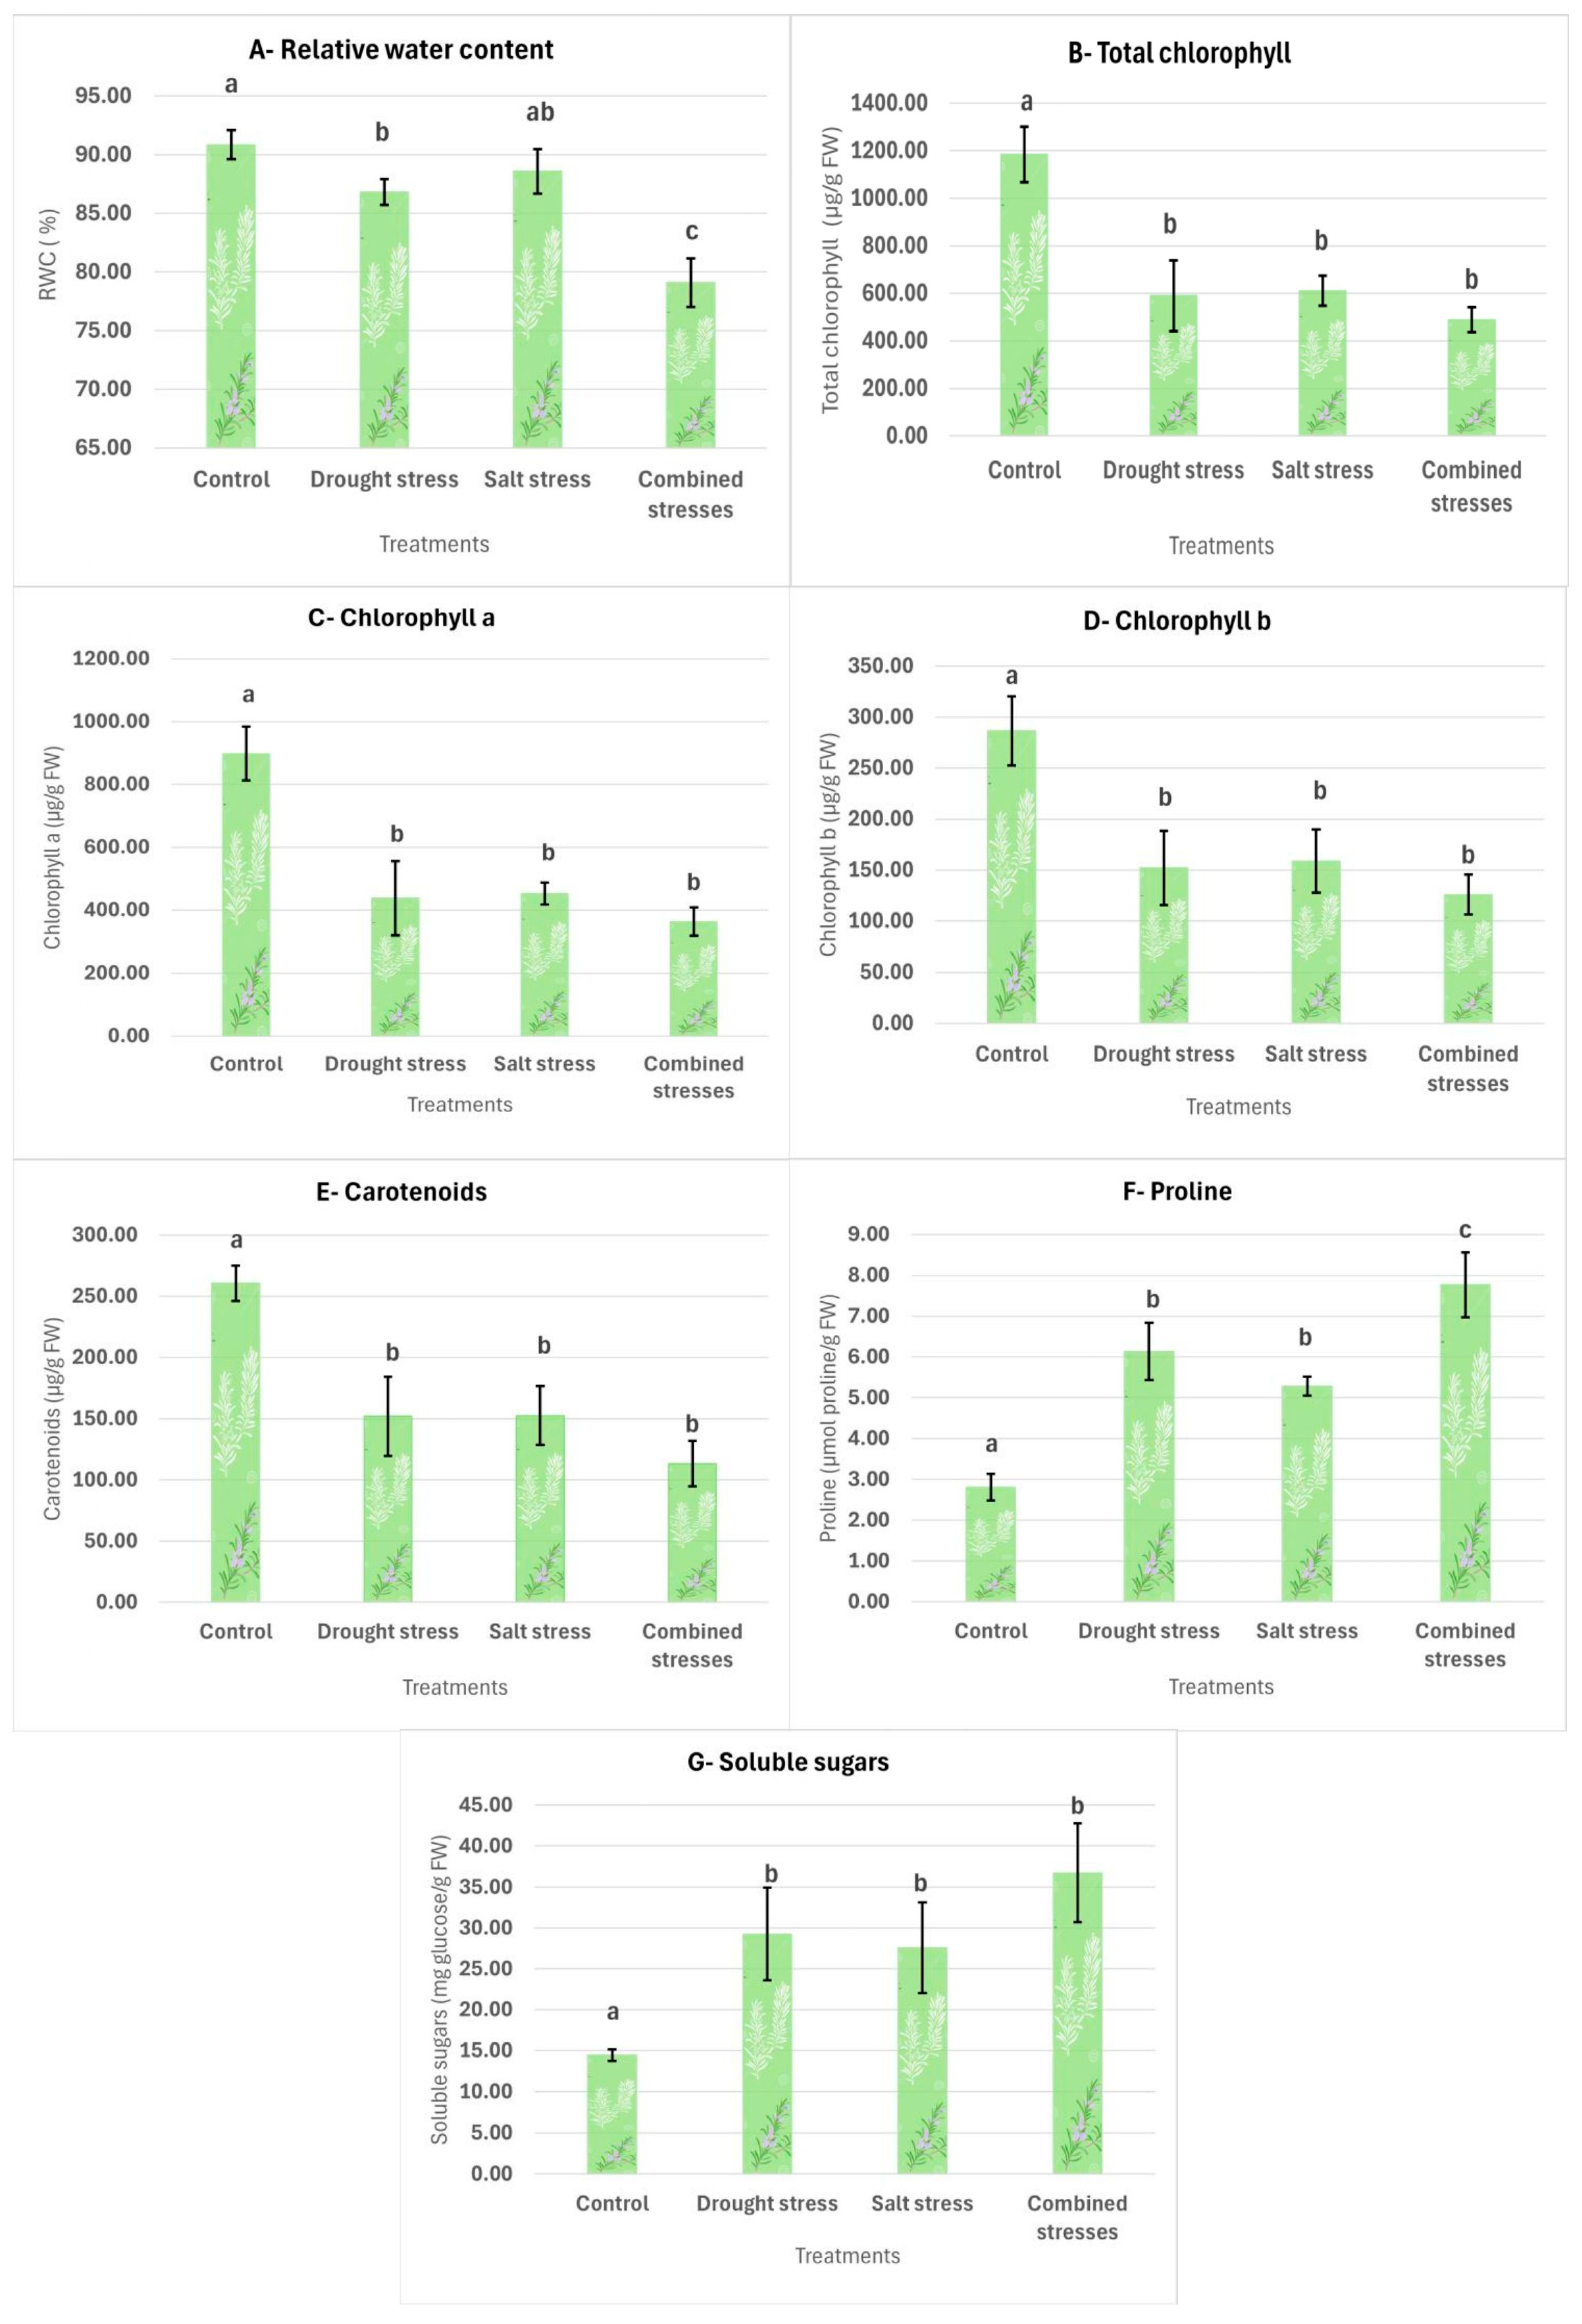
3.2.1. Relative Water Content (RWC)

Graph A in Figure 3 illustrates the changes in RWC across treatments. The control exhibits the highest RWC (90.84%), which does not differ statistically from the salinity stress (88.57%) treatment, suggesting that salt stress does not significantly reduce RWC compared to unstressed plants. Drought stress alone leads to a significant decrease in RWC (86.82%), though it does not differ strongly from the salinity treatment. However, the combination of drought and salinity stress has the most severe negative impact, causing the greatest reduction in RWC (79.9%) among all treatments.

3.2.2. Chlorophyll and Carotenoids

The determination of total chlorophyll, chlorophyll a, and chlorophyll b is presented in Graphs B, C, and D, respectively, in Figure 3. All these parameters were significantly influenced by the applied stress conditions. Total chlorophyll content was the highest in the control group (1184.07 µg/g FW) but showed a marked decline under drought (589.61 µg/g FW), salinity (610.75 µg/g FW), and combined stress (488.79 µg/g FW), respectively. A similar trend was observed for chlorophyll a and chlorophyll b. Notably, no significant differences were detected among the three stress treatments, suggesting that the negative effects of drought and salinity on chlorophyll content in T. capitatus are comparable and that their combination does not intensify the degradation beyond individual stress effects.
The carotenoid level, as shown in graph E in Figure 3, also peaked under normal conditions, (260.52 µg/g FW), with a statistically significant difference from the stress treatments. However, they are statistically similar to each other where, again, the combined stress shows the lowest content, suggesting that the simultaneous effect of drought and salinity does not cause a further statistically significant decline.

3.2.3. Proline

The proline content analysis is presented in Graph F in Figure 3. The control group (2.80 µmol proline/g FW) exhibited the lowest proline content, significantly differing from all stress treatments. Proline levels increased by 119%, 89%, and 177% under drought, salinity, and combined stress, respectively. While drought and salinity stress individually resulted in statistically similar proline accumulation, their combination led to the highest levels, significantly surpassing all other treatments. This suggests an adaptive response in T. capitatus to cope with intensified stress conditions.

3.2.4. Total Soluble Sugars

The total soluble sugar content of T. capitatus across treatments is presented in Graph G of Figure 3. The control (14.43 mg glucose/g FW) exhibited the lowest levels, significantly differing from all other treatments: drought stress (29.27 mg glucose/g FW), salt stress (27.59 mg glucose/g FW), and combined stresses (36.74 mg glucose/g FW). While the statistical similarity between individual and combined stresses suggests that both drought and salinity independently trigger a comparable increase in total soluble sugars, the highest value recorded under combined stress indicates a slight upward trend, suggesting a potential cumulative effect.

3.3. Biochemical Responses of Plants to Stress Conditions

3.3.1. Essential Oil Content (EOC)

The essential oil content of T. capitatus is presented in Graph A of Figure 4. Under normal cultivation conditions, the highest EOC was recorded (3.22 mL/100 g DW), which was significantly higher (p < 0.05) than all stress treatments. Salinity stress (90 mM NaCl) resulted in a moderate decrease in EOC (2.57 mL/100 g DW), also significantly different (p < 0.05) from all other treatments. However, the lowest EOC values were observed under drought stress (2.26 mL/100 g DW) and combined stress (2.13 mL/100 g DW), both significantly lower than the control and salinity treatments. This suggests that drought and combined stresses have a stronger negative impact on essential oil production compared to salinity stress.

3.3.2. Essential Oil Composition

The GC–MS analysis identified 10 volatile compounds in the essential oil of T. capitatus, as shown in Table 5, classified into three major groups: monoterpene hydrocarbons, oxygenated monoterpenes, and sesquiterpene hydrocarbons. These groups exhibited distinct variations in response to the stress treatments applied, as shown in Table 5.
The most dominant group, oxygenated monoterpenes, includes carvacrol, thymol, borneol, and linalool, all accounting for approximately four-fifths of the identified compounds in each treatment. Carvacrol, the principal constituent of T. capitatus, constituted 78.86% of the essential oil in control plants and increased significantly under stress, reaching 80.73% in drought-stressed plants, 79.59% in salt-stressed plants, and peaking at 82.58% under combined stress. Other oxygenated monoterpenes showed distinct responses: thymol remained stable across treatments, while linalool and borneol increased under stress, particularly in drought and salinity treatments (Table 5). The elevated levels of these oxygenated monoterpenes suggest an adaptive strategy, enhancing the plant’s defense against oxidative stress.
Monoterpene hydrocarbons, the second major group, comprising α-pinene, β-myrcene, α-terpinene, p-cymene, and γ-terpinene, exhibited a contrasting trend, decreasing under stress conditions, with the most pronounced decline under combined stress. α-Pinene, the most affected, dropped from 0.49% in control plants to 0.11% under combined stress, representing a 77.5% reduction. This suggests that drought and salinity strongly suppress the biosynthesis of these compounds, potentially due to metabolic reallocation favoring stress-protective compounds.
The only sesquiterpene hydrocarbon detected, β-caryophyllene, displayed a notable increase under combined stress, rising from 2.10% in control plants to 3.10% (Table 5). This shift again suggests an adaptive response to stress conditions.

3.3.3. Total Polyphenols

The total polyphenol content in T. capitatus is presented in Graph B of Figure 4. As clearly shown, individual stress treatments, drought (107.41 mg GAE/g DW) and salinity (108.94 mg GAE/g DW) resulted in statistically similar TPC levels to the control (111.26 mg GAE/g DW). However, the simultaneous application of both stresses led to a significant increase, with TPC peaking at 123.29 mg GAE/g DW, surpassing all other treatments. This suggests that T. capitatus enhances polyphenol synthesis primarily under severe, combined stress conditions rather than in response to single stress factors.

3.3.4. Antioxidant Capacity

The antioxidant capacity results are presented in Graph C of Figure 4. The control group exhibited the highest antioxidant capacity (102.75 mg AAE/g DW), significantly different (p < 0.05) from salt stress (78.18 mg AAE/g DW) and combined stresses (72.80 mg AAE/g DW), which displayed statistically similar and the lowest values. Drought stress (85.88 mg AAE/g DW) did not significantly differ from the control or the salt and combined stress treatments but remained between them, suggesting an intermediate effect.

3.3.5. Hydrogen Peroxide

The effects of the applied treatments on H2O2 accumulation in T. capitatus are illustrated in Graph D of Figure 4. The control group exhibited the lowest H2O2 content, which was significantly different (p < 0.05) from all stress treatments. Under stress conditions, H2O2 levels increased by 190% under salt stress, 237% under drought stress, and 326% under combined stresses. While individual stress treatments resulted in statistically similar H2O2 levels, their combination led to a significant peak compared to all other treatments. The highest H2O2 accumulation under combined stress suggests an intensified oxidative stress response, indicating that simultaneous exposure to drought and salinity imposes the greatest oxidative stress on the plant.

3.4. Stress Susceptibility and Tolerance Indexes

The SSI and STI values for the different stress conditions are presented in Table 6. As shown, salinity stress exhibited a moderate SSI (0.730 < 1), indicating some level of resistance to this stress. The highest STI recorded under salinity stress suggests that plants sustain better growth in saline conditions compared to drought stress, while still performing statistically (p < 0.05) better than under combined stress.
Drought stress resulted in a high SSI (0.987 < 1) but remained moderate, indicating that plants experience significant stress under drought conditions. The intermediate STI value reflects moderate growth under stress, with no significant difference in SSI and STI compared to salt and combined stress. This suggests that drought exerts an intermediate effect, being more severe than salinity stress but less damaging than combined stress.
Under combined stress, plants were classified as susceptible (SSI = 1.282 ≥ 1), meaning they suffered the highest level of stress. The lowest STI value (0.514) further confirms that plant growth is most negatively affected when drought and salinity occur simultaneously. This was significantly different only from salinity stress, reinforcing that combined stress imposes the greatest pressure on plant performance.

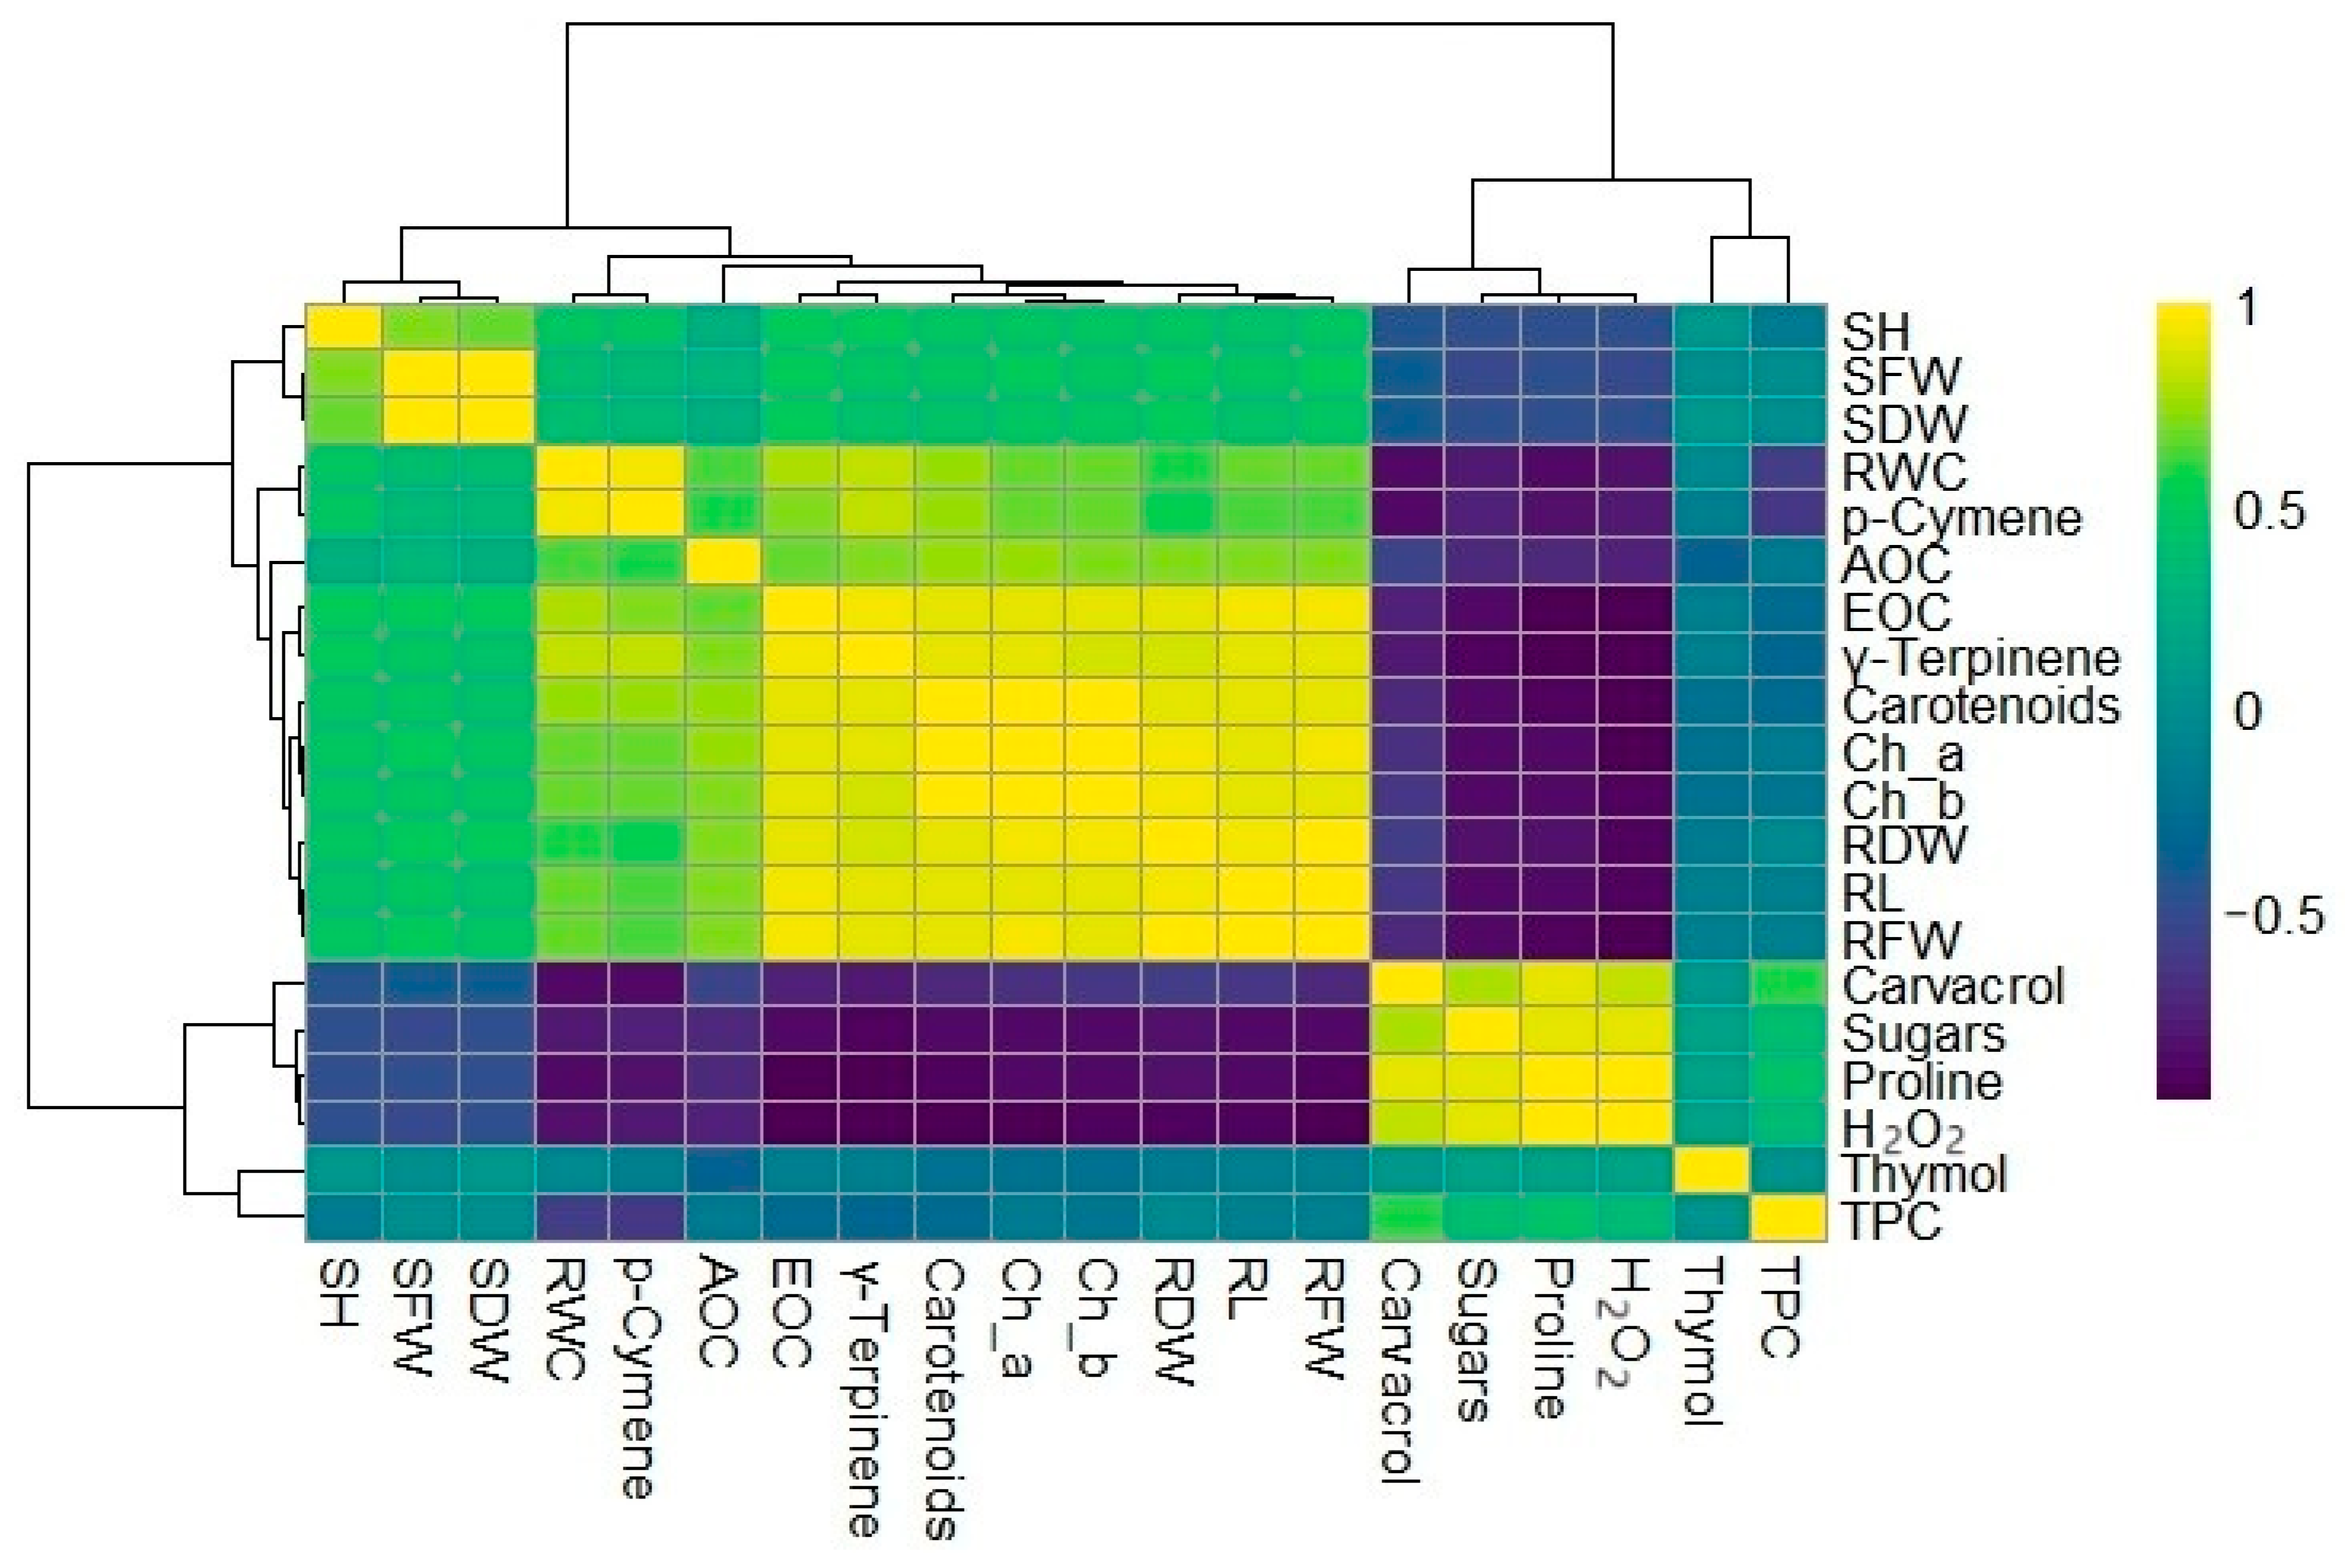
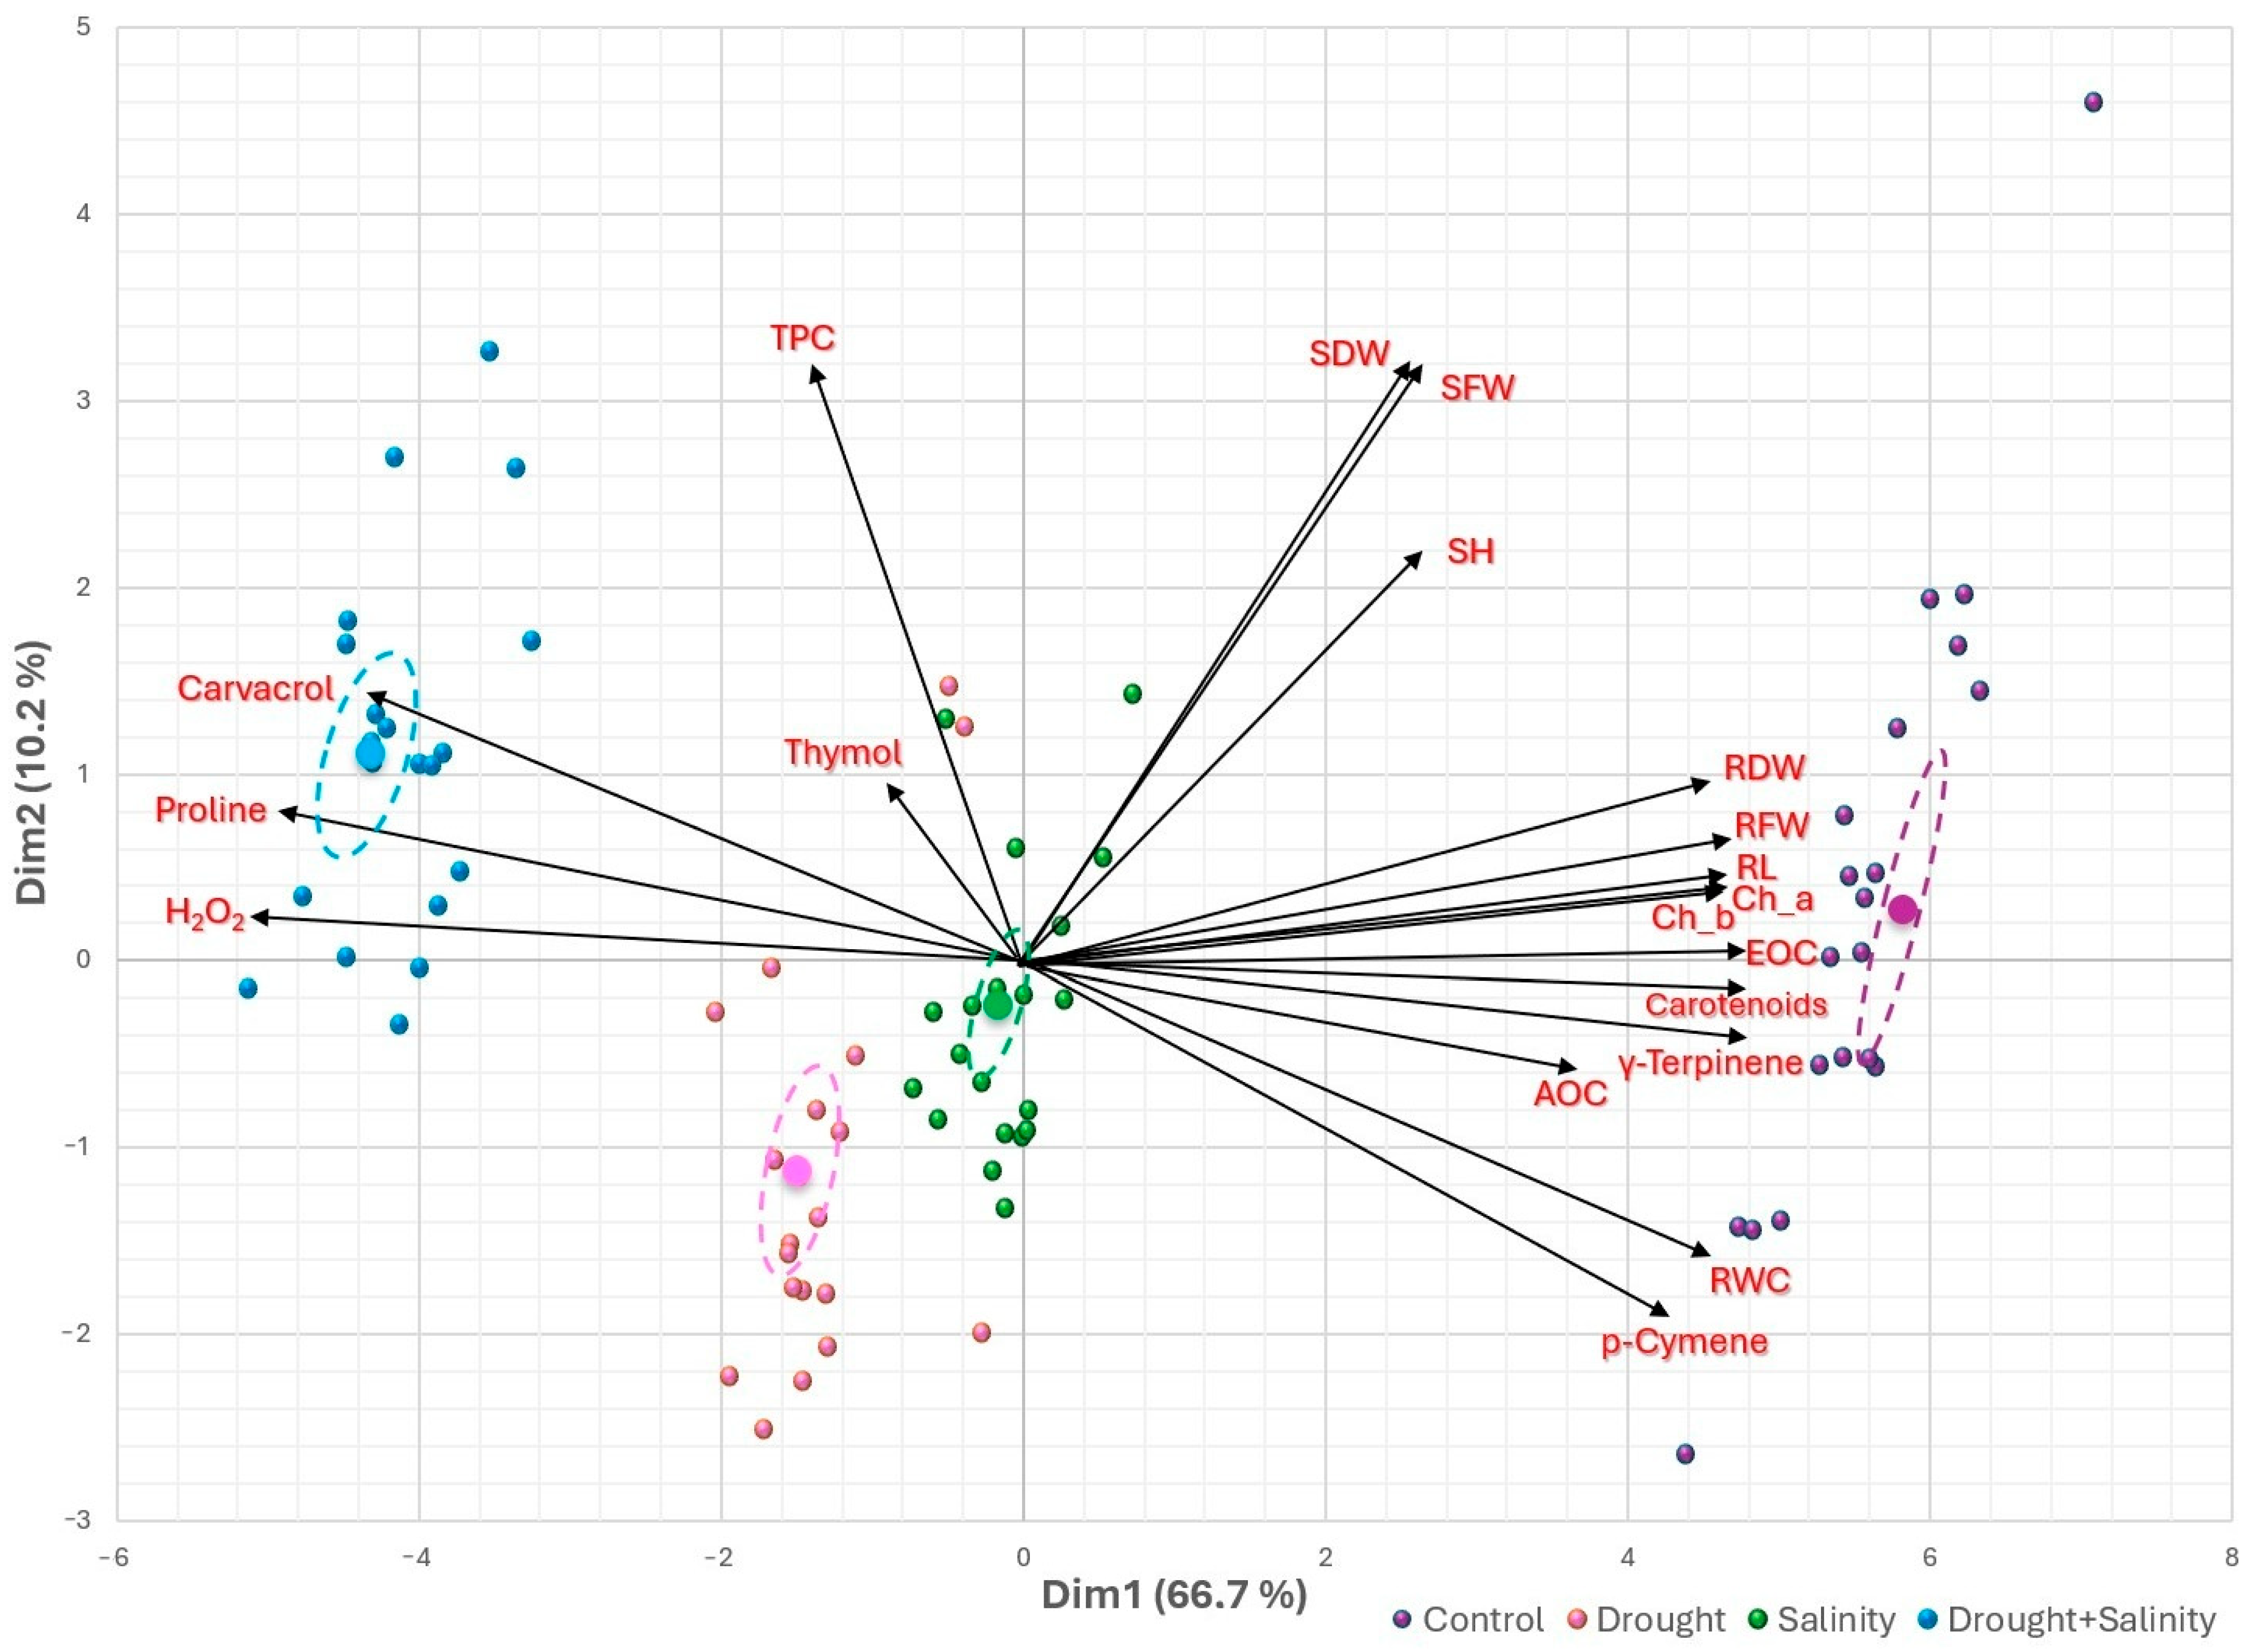
3.5. Heatmap Clusters and Principal Component Analysis

The clustered heatmap in Figure 5 offers a comprehensive visualization of the correlations between morphological, physiological, and biochemical traits of T. capitatus under different stress conditions. As shown in the heatmap, SH, SFW, SDW, RDW, RL, RFW, RWC, chlorophyll a, chlorophyll b, carotenoids, EOC, p-cymene and γ-terpinene exhibit a strong positive correlation, suggesting that plants with greater biomass production also maintain higher chlorophyll content and an enriched essential oil profile, particularly in p-cymene, γ-terpinene, and likely other monoterpene hydrocarbons identified by GC–MS.
In contrast, a distinct cluster comprising carvacrol, total soluble sugars, proline, hydrogen peroxide, thymol, and total polyphenol content also demonstrates a strong positive correlation. Specifically, when plants undergo stress, reflected by an increase in H2O2, they simultaneously elevate the production of osmoprotectants (proline, sugars) and antioxidant molecules (carvacrol, thymol, TPC) as a defense mechanism. Notably, these stress-related compounds show a negative correlation with the growth-associated traits of the first cluster (SH, SFW, SDW, etc.), supporting the idea that stress-induced metabolic shifts prioritize survival over biomass accumulation. Furthermore, the observed upregulation of carvacrol and thymol under stress highlights their role as stress-responsive metabolites, suggesting that their synthesis in T. capitatus is actively triggered by stress conditions.
The PCA biplot in Figure 6 offers a comprehensive perspective on how different stress treatments (drought, salinity, and combined stresses) influence the morphological, physiological, and biochemical traits of T. capitatus. The control group is closely associated with biomass-related parameters, including shoot and root growth (SFW, SDW, SH, RFW, RDW, RL), chlorophyll a, chlorophyll b, carotenoids, RWC, EOC, p-cymene, and γ-terpinene. This clustering suggests that plants under optimal conditions prioritize biomass accumulation, photosynthetic efficiency, and essential oil production, particularly rich in monoterpene hydrocarbons. The tight ellipse around control replicates reflects low variation and high trait consistency under non-stress conditions.
In contrast, drought-treated plants are distinctly separated from the control group, positioned opposite to biomass-related traits, with no direct association with secondary metabolites. Their well-separated ellipse illustrates the strong divergence in response to water stress. This confirms that drought stress severely restricts growth. However, plants under salinity stress deviate from the control group to a lesser extent than drought-treated plants, indicating that salt stress moderately impacts growth while maintaining a balance between biomass production and stress adaptation. The ellipse for salinity-treated plants partly overlaps with control and drought groups, supporting this intermediate behavior.
The combined stress treatment exhibits a pronounced association with proline, hydrogen peroxide and carvacrol, which are key indicators of oxidative stress and osmotic adjustment. This suggests that plants exposed to both drought and salinity simultaneously activate strong protective mechanisms, including the production of osmoprotectants and antioxidants. Notably, total polyphenol content and thymol levels also increase under stress; however, they are not exclusively linked to drought or salinity alone, indicating a broader stress response. The distinct ellipse for combined stress highlights this unique adaptive profile.

4. Discussion

T. capitatus possesses a remarkable array of medicinal properties, highlighting its importance in both traditional and modern medicine. Its essential oils and extracts are rich in bioactive compounds, primarily carvacrol, which is well-known for its potent antimicrobial and antioxidant activities. These properties contribute to its traditional and potential medicinal applications, including managing high cholesterol, diabetes, respiratory diseases, and heart conditions [15,44,45]. Additionally, T. capitatus is valued for its benefits in skin and muscle treatments, fever reduction, and its antifungal, antiparasitic, antiviral, anti-inflammatory, and anticancer effects [46,47]. However, to fully exploit the medicinal benefits of T. capitatus essential oils and extracts, the plants must be cultivated under adequate conditions. This remains a challenge, especially in the face of climate change, where abiotic stresses such as drought and salinity, often occurring simultaneously in nature, adversely impact plant growth and development. This research highlights how these environmental stresses impact the overall growth of T. capitatus.
Our findings proved that salinity stress has a moderate impact on shoot parameters, particularly shoot height and dry shoot weight. However, it leads to a reduction in the average number of shoots per plant and fresh shoot weight, similar to drought stress, which negatively affects all shoot parameters. Combined stress imposes the most severe impact, resulting in the lowest shoot measurements, though the differences remain statistically insignificant compared to drought stress alone. Previous studies support these findings. T. capitatus has demonstrated tolerance to salinity levels ranging from 0 to 100 mM NaCl [48], aligning with our results. Similarly, García-Caparrós et al. [49] reported that under drought conditions T. capitatus experiences a significant decline in fresh weight, indicating reduced shoot biomass compared to well-watered plants.
Root length, as well as fresh and dry root weight, were significantly reduced under all stress treatments, with no statistical difference between drought, salinity, and their combination. This confirms that the combined stress of 40% SWC with 90 mM NaCl exerts the same impact as when these stressors are applied separately. The lack of an intensified effect under combined stress suggests that the plant reaches a physiological limit in root growth restriction. Similar findings have been reported in Saccharum officinarum L., where drought stress led to decreased root length, dry weight, and surface area [50]. Likewise, in T. vulgaris water scarcity was shown to reduce both fresh and dry root weights [51].
The reduction in the average number of shoots per plant and fresh shoot and root weight, dry root weight and root length under salinity stress suggests that salt accumulation disrupts water uptake and hormonal balance [52,53]; yet T. capitatus still maintains some shoot and root formation. Drought, on the other hand, restricts water availability, limiting cell division and elongation, leading to reduced shoot initiations and root development [54,55,56]. This growth limitation is further compounded by the reduced nutrient uptake associated with both drought and salinity stress [57]. When both stresses are combined, T. capitatus struggles to cope with simultaneous osmotic stress (drought) and ion toxicity (salinity), resulting in the strongest inhibition of shoot and root formation.
T. capitatus appears capable of maintaining RWC under salinity stress to some extent, likely through osmotic adjustments such as the accumulation of osmolytes. However, a slight reduction compared to the control is still observed. In contrast, drought stress alone significantly decreases RWC due to reduced soil water availability, leading to cell dehydration and potential loss of turgor pressure. When combined with salinity, the sharp decline in RWC suggests an additive or synergistic effect, where the simultaneous presence of drought and salinity imposes extreme stress that the plant is unable to compensate for. This indicates severe osmotic stress, where water uptake is heavily restricted due to both limited soil moisture (drought) and increased osmotic pressure from Na+ accumulation [58,59,60]. Precisely, abscisic acid signaling, rapidly triggered under both drought and salinity stress, leads to stomatal closure and the activation of stress-responsive genes, and key ion and water transporter genes [61]. Simultaneously, ROS accumulate, acting as secondary messengers that regulate defense responses [62]. Together, these signaling pathways modulate the expression of crucial transporters, such as salt overly sensitive (SOS1, for Na+ exclusion), high affinity K+ transporters (HAKs, for K+ retention), and aquaporins (for water movement), which are essential for maintaining ionic and water balance under stress [63,64,65].
Most studies corroborate our findings, indicating that stresses such as salinity and drought significantly reduce RWC, which in turn negatively affects the overall physiological health of T. vulgaris L. [66]. Drought stress, in particular, has been shown to diminish RWC in various thyme species, with T. vulgaris exhibiting greater sensitivity compared to Thymus kotschyanus [67].
All stress conditions significantly reduced chlorophyll a, chlorophyll b, and total chlorophyll and carotenoid levels compared to the control. The fact that the combined stress did not induce an additional decline beyond individual stressors suggests that T. capitatus reaches a physiological limit in its ability to maintain chlorophyll levels under harsh conditions. Carotenoids followed a similar trend to chlorophyll, despite their role in protecting chlorophyll and photosynthetic proteins from oxidative stress. Their reduction under stress conditions suggests that T. capitatus may experience higher oxidative damage, further compromising its ability to tolerate drought and salinity. This aligns with the findings of Mohammadi et al. [68] and Mohammadzadeh and Pirzad [69], who reported a decline in chlorophyll pigments in T. vulgaris under drought stress. Similarly, Tátrai et al. [70] observed a reduction in chlorophyll content in Thymus x citriodorus when exposed to drought conditions. In fact, stress factors lead to an overproduction of ROS, such as superoxide radicals and H2O2, as seen in our study. Excessive ROS can break down chlorophyll by triggering lipid peroxidation, which disrupts ATP and NADPH production, ultimately restricting photosynthesis and limiting plant growth [71,72,73].
Stress indicators, including proline, soluble sugars, and hydrogen peroxide, showed significant increases under all stress conditions compared to normal conditions. Drought and salinity stress induced similar increases in these indicators, whereas their combination resulted in the highest proline and hydrogen peroxide accumulation. However, total soluble sugars remained statistically similar between individual stresses and their combination, but the levels were slightly higher under combined stress, suggesting a cumulative effect of both stresses. Increasing the levels of these substances under stress has been widely observed in most of the higher plants [74,75,76].
Under stress conditions, plants close their stomata to minimize water loss, which also restricts CO2 uptake. This limitation disrupts chloroplast function, ultimately leading to increased H2O2 production. Similarly, in mitochondria, electron leakage contributes to H2O2 formation [77,78,79,80]. In turn, H2O2 plays a key role in regulating the expression of genes responsible for proline and sugar production. [81,82]. The accumulation of proline and soluble sugars under stress serves several protective functions: they promote osmotic balance, help stabilize proteins and cell membranes, and function as antioxidants to neutralize ROS, reducing oxidative damage and strengthening the plant’s tolerance to stress [83,84,85,86,87].
These findings indicate that T. capitatus experiences a significant reduction in essential oil yield under stress, with drought and combined stress exhibiting the most severe effects, while salinity stress has a comparatively milder impact. Since essential oils are secondary metabolites, their biosynthesis may be downregulated under extreme stress conditions, as the plant shifts its resources toward survival mechanisms such as osmotic adjustment and antioxidative defense [73,88]. In this study, T. capitatus responds to drought and salinity stress by shifting its essential oil profile in favor of bioactive compounds with antioxidant and protective roles. The significant increase in carvacrol, alongside the enhanced presence of linalool, borneol, and β-caryophyllene under stress, highlights a metabolic shift towards stress resilience. In contrast, the significant reduction in monoterpene hydrocarbons (α-Pinene, ß-Myrcene, α-Terpinene, p-Cymene and γ-Terpinene) suggests a metabolic prioritization, where resources are redirected toward compounds that better support stress adaptation, such as oxygenated monoterpenes. This occurs through modifications of metabolic pathways to counteract the harmful effects of ROS [89]. The most pronounced alterations occurred under combined stress, reinforcing the idea that simultaneous drought and salinity impose the strongest selective pressure on the plant’s metabolic pathways.
These results align with those of Etri et al. [38] on Thymus pannonicus, where drought, alone or combined with salinity (60 mM NaCl), significantly reduced EOC. Similarly, Alavi-Samani et al. [90] reported a decline in EOC under drought stress in T. daenensis, although specific compounds like carvacrol and γ-terpinene increased. In contrast, Emami Bistgani et al. [91] found that mild drought conditions led to the highest EOC in T. daenensis. Nevertheless, all the EOC values recorded in our experiment across all treatments, including the lowest (2.13 mL/100 g DW) under combined stress, remain well above the minimum standard of 0.30 mL/100 g DW set by the European Pharmacopoeia 11.0 [37]. This confirms the effectiveness of T. capitatus essential oil even under 40% SWC, 90 mM NaCl stress, or their combination. In addition, its antimicrobial activity is expected to remain efficient, as observed in T. capitatus from the same region where our plant seeds were originally collected, which displayed a similar carvacrol content (75.79%) [92].
The dominance of carvacrol in our essential oils is also consistent with previous findings by Bounatirou et al. [1], who reported carvacrol levels between 62% and 83% in Tunisian T. capitatus samples. Stress-induced increase in specific compounds has also been observed in T. eriocalyx, where thymol, carvacrol, and trans-caryophyllene levels rose under drought stress [21]. However, our findings contrast with those of Németh-Zámbori et al. [93], who reported an increase in terpinene type components at the expense of key compounds in thymol and carvacrol in T. vulgaris under drought stress. Similarly, Mkaddem et al. [94] showed that T. capitatus from the south of Tunisia has higher thymol content and lower carvacrol, suggesting the presence of a new chemotype of T. capitatus. Since the plants in this study are from northern Tunisia (Mediterranean climate), while those in the study of Mkaddem et al. [94] were from southern Tunisia (arid climate), it highlights the impact of climate on the variation of chemotypes within the same species [10], suggesting the possibility of a new chemotype.
Total polyphenol content remains relatively stable under drought and salinity stress when applied individually, whereas a significant increase is observed under combined stress. This suggests that T. capitatus does not strongly trigger its defense mechanisms in response to a single stress factor but activates polyphenol accumulation when facing more severe environmental challenges.
A study on T. vulgaris found that heat stress and limited water availability initially increased polyphenol levels; however, when these stresses persisted over the next two years, TPC declined [95]. Unlike our findings, another study reported a significant increase in TPC under salinity stress alone [96]. Our results further confirm that TPC positively correlates with proline, total soluble sugars, and carvacrol, reinforcing its role in stress mitigation. This indicates that stress conditions activate the phenylpropanoid pathway, leading to increased polyphenol accumulation as part of the plant’s adaptive response to mitigate oxidative stress [97].
Our results demonstrate that salt and combined stresses significantly reduce antioxidant capacity, indicating that these conditions weaken the plant’s ability to counteract oxidative damage. In contrast, drought stress does not cause a sharp decline in antioxidant capacity, possibly because T. capitatus maintains a moderate antioxidant defense. The pronounced reduction in antioxidant capacity under salt and combined stress suggests that the plant’s antioxidant system is overwhelmed by the severity of oxidative stress in these conditions.
This finding contrasts with Raza et al.’s [75] study, which reported that under saline conditions thyme seedlings exhibited enhanced activity of antioxidant enzymes, like superoxide dismutase (SOD) and catalase (CAT), effectively reducing ROS accumulation. However, our results align with those of Khosh-Khui et al. [98], who demonstrated that prolonged drought stress (an 8-day irrigation interval) led to a significant decline in antioxidant activity and total phenolic content in T. vulgaris. Similarly, Kulbat and Leszczyńska [99] observed that as heavy metal concentrations increased, antioxidant capacity correspondingly decreased. Notably, despite the significant rise in TPC and volatile compounds such as carvacrol under combined stress, their antioxidant potential appears insufficient to counteract the excessive ROS accumulation. This suggests that enzymatic antioxidants, including SOD, CAT, and ascorbate peroxidase (APX) may be either depleted or downregulated, making it harder for the plant to neutralize oxidative stress effectively [100].
The SSI and STI results classify the treatments as follows: salinity stress (90 mM NaCl) and drought (40% SWC) cause moderate susceptibility, with drought being slightly more severe, while combined stresses lead to high susceptibility. This demonstrates that T. capitatus better tolerates salinity or drought compared to combined stress. Furthermore, STI rankings indicate that plants are most vulnerable to combined stress, followed by drought, while salinity stress exerts the least harmful effect, allowing for better growth. These findings align with our actual results on the growth, physiological, and biochemical responses of T. capitatus to drought and salt stress, whether applied individually or simultaneously.

5. Conclusions

T. capitatus shows a strong ability to endure environmental challenges while maintaining its medicinal potential. Our study highlights the significant impact of drought and salinity stress on its growth, physiology, and biochemical responses, with combined stress causing the most severe effects. Despite reductions in biomass, relative water content, chlorophyll, and essential oil yield, T. capitatus adapts by accumulating protective compounds and adjusting its biochemical processes to improve its stress tolerance. Notably, the stress-induced shift in essential oil composition, particularly the increased biosynthesis of carvacrol and other bioactive compounds, suggests a natural defense mechanism that may preserve its medicinal efficacy under difficult conditions. The ability of T. capitatus to retain essential oil concentrations with medicinal properties, even under combined stress, supports its potential for sustainable cultivation in saline environments, specifically until the level of 90 mM NaCl, as tested in our study.
From an agronomic perspective, implementing regulated deficit irrigation, improving soil structure with organic amendments, and applying biostimulants could mitigate the adverse effects of abiotic stress. Moreover, physiological markers, such as RWC and chlorophyll pigments, could serve as early indicators for stress management decisions in the field.
Future research should explore these strategies further to optimize both biomass production and phytochemical profiles, ensuring the continued valorization of T. capitatus in medicinal and industrial applications under climate-resilient farming systems.

Author Contributions

Conceptualization, K.E. and Z.P.; methodology, K.E., B.G. and Z.P.; software K.E.; validation, K.E., B.G. and Z.P.; formal analysis, K.E., B.G. and Z.P.; resources, Z.P.; data curation, K.E.; software, K.E.; writing—original draft preparation, K.E. and Z.P.; writing—review and editing, K.E. and Z.P.; visualization, K.E.; supervision, Z.P.; project administration, Z.P. All authors have read and agreed to the published version of the manuscript.

Funding

This research received no external funding.

Data Availability Statement

Data is contained within the article.

Conflicts of Interest

The authors declare no conflict of interest.

References

  1. Bounatirou, S.; Smiti, S.; Miguel, M.G.; Faleiro, L.; Rejeb, M.N.; Neffati, M.; Costa, M.M.; Figueiredo, A.C.; Barroso, J.G.; Pedro, L.G. Chemical Composition, Antioxidant and Antibacterial Activities of the Essential Oils Isolated from Tunisian Thymus Capitatus Hoff. et Link. Food Chem. 2007, 105, 146–155. [Google Scholar] [CrossRef]
  2. El Ajjouri, M.; Satrani, B.; Ghanmi, M.; Aafi, A.; Farah, A.; Rahouti, M.; Amarti, F.; Aberchane, M. Activité Antifongique Des Huiles Essentielles de Thymus Bleicherianus Pomel et Thymus capitatus (L.) Hoffm. & Link Contre Les Champignons de Pourriture Du Bois d’œuvre. Biotechnol. Agron. Soc. Environ. 2008, 12, 345–351. [Google Scholar]
  3. Džamić, A.M.; Nikolić, B.J.; Giweli, A.A.; Mitić-Ćulafić, D.S.; Soković, M.D.; Ristić, M.S.; Knežević-Vukčević, J.B.; Marin, P.D. Libyan Thymus Capitatus Essential Oil: Antioxidant, Antimicrobial, Cytotoxic and Colon Pathogen Adhesion-inhibition Properties. J. Appl. Microbiol. 2015, 119, 389–399. [Google Scholar] [CrossRef]
  4. Skoula, M.; Grayer, R.J.; Kite, G.C.; Skoula, M.; Grayer, R.J.; Kite, G.C. Surface Flavonoids in Coridothymus Capitatus and Thymbra calostachya (Lamiaceae). Biochem. Syst. Ecol. 2004, 32, 1197–1200. [Google Scholar] [CrossRef]
  5. Morales, R. The History Botany and Taxonomy of the Genus Thymus. In Thyme–The Genus Thymus; Stahl-Biskup, E., Saez, F., Eds.; Taylor & Francis: London, UK, 2002; pp. 11–43. [Google Scholar]
  6. Ben El Hadj Ali, I.; Guetat, A.; Boussaid, M. Genetic Diversity of Wild Thymus capitatus (Lamiaceae) in Tunisia Using Molecular Markers. Dendrobiology 2012, 68, 89–100. [Google Scholar]
  7. Tawaha, K.A.; Hudaib, M.M. Chemical Composition of the Essential Oil from Flowers, Flower Buds and Leaves of Thymus Capitatus Hoffmanns. & Link from Jordan. J. Essent. Oil Bear. Plants 2012, 15, 988–996. [Google Scholar] [CrossRef]
  8. Bouyahya, A.; Chamkhi, I.; Guaouguaou, F.E.; Benali, T.; Balahbib, A.; El Omari, N.; Taha, D.; El-Shazly, M.; El Menyiy, N. Ethnomedicinal Use, Phytochemistry, Pharmacology, and Food Benefits of Thymus Capitatus. J. Ethnopharmacol. 2020, 259, 112925. [Google Scholar] [CrossRef]
  9. Tagnaout, I.; Zerkani, H.; Hadi, N.; El Moumen, B.; El Makhoukhi, F.; Bouhrim, M.; Al-Salahi, R.; Nasr, F.A.; Mechchate, H.; Zair, T. Chemical Composition, Antioxidant and Antibacterial Activities of Thymus Broussonetii Boiss and Thymus capitatus (L.) Hoffmann and Link Essential Oils. Plants 2022, 11, 954. [Google Scholar] [CrossRef]
  10. Etri, K.; Pluhár, Z. Exploring Chemical Variability in the Essential Oils of the Thymus Genus. Plants 2024, 13, 1375. [Google Scholar] [CrossRef]
  11. Amakran, A.; Hamoudane, M.; Pagniez, F.; Lamarti, A.; Picot, C.; Figueredo, G.; Nhiri, M.; Le Pape, P. Chemical Composition, Antifungal, Antioxidant, and Hemolytic Activities of Moroccan Thymus Capitatus Essential Oil. Chem. Biodivers. 2024, 21, e202300563. [Google Scholar] [CrossRef]
  12. Zaïri, A.; Nouir, S.; Zarrouk, A.; Haddad, H.; Khélifa, A.; Achour, L.; Tangy, F.; Chaouachi, M.; Trabelsi, M. Chemical Composition, Fatty Acids Profile and Biological Properties of Thymus capitatus (L.) Hoffmanns, Essential Oil. Sci. Rep. 2019, 9, 20134. [Google Scholar] [CrossRef] [PubMed]
  13. Benoutman, A.; Erbiai, E.H.; Edderdaki, F.Z.; Cherif, E.K.; Saidi, R.; Lamrani, Z.; Pintado, M.; Pinto, E.; Esteves da Silva, J.C.G.; Maouni, A. Phytochemical Composition, Antioxidant and Antifungal Activity of Thymus Capitatus, a Medicinal Plant Collected from Northern Morocco. Antibiotics 2022, 11, 681. [Google Scholar] [CrossRef] [PubMed]
  14. Maniki, E.; Kostoglou, D.; Paterakis, N.; Nikolaou, A.; Kourkoutas, Y.; Papachristoforou, A.; Giaouris, E. Chemical Composition, Antioxidant, and Antibiofilm Properties of Essential Oil from Thymus Capitatus Plants Organically Cultured on the Greek Island of Lemnos. Molecules 2023, 28, 1154. [Google Scholar] [CrossRef]
  15. Bajes, H.; Bustanji, Y.; Bustanji, Y. Phytochemical Analysis, In Vitro Assessment of Antioxidant Properties and Cytotoxic Potential of Thymus Capitatus Essential Oil. Res. J. Pharm. Technol. 2023, 16, 1100–1108. [Google Scholar] [CrossRef]
  16. Nehme, R.; Gini, C.; Vanbergue, E.; Even, S.; Biscarini, F.; Andrés, S.; Rault, L.; Noel, F.; Hardit, V.; Bouhallab, S.; et al. The Effects of Thymus Capitatus Essential Oil Topical Application on Milk Quality: A Systems Biology Approach. Sci. Rep. 2024, 15, 4627. [Google Scholar] [CrossRef]
  17. Hosseini, N.; Ghorbanpour, M.; Mostafavi, H. Habitat Potential Modelling and the Effect of Climate Change on the Current and Future Distribution of Three Thymus Species in Iran Using MaxEnt. Sci. Rep. 2024, 14, 3641. [Google Scholar] [CrossRef]
  18. Kaur, S.; Kumar, P. Morpho-Physiological and Biochemical Response of Plants under Drought Stress. J. Pharmacogn. Phytochem. 2020, 9, 352–357. [Google Scholar]
  19. Aroca, R. Plant Responses to Drought Stress: From Morphological to Molecular Features; Springer: Berlin, Heidelberg, 2013; pp. 1–466. [Google Scholar] [CrossRef]
  20. Bistgani, Z.E.; Hashemi, M.; Akbari, P.; Mumivand, H. Influence of Drought Stress and Foliar Application of Chitosan on Nutrient Accumulation and Phenolic Composition of Thymus Daenensis Celak. Crop Sci. 2023, 63, 921–935. [Google Scholar] [CrossRef]
  21. Amiri, H.; Dousty, B.; Hosseinzedeh, S.R. Water Stress-Induced Changes of Morphological, Physiological and Essential Oil Compounds in Thymus Eriocalyx from Iran. J. Essent. Oil Bear. Plants 2018, 21, 1210–1223. [Google Scholar] [CrossRef]
  22. Abd El-Maboud, M.M.; Elshalakany, W. ANTIOXIDANTS RESPONSE TO SEASONAL CHANGES IN THYMUS CAPITATUS (L.). Egypt. J. Desert Res. 2022, 72, 215–229. [Google Scholar] [CrossRef]
  23. Sara, K.; Hossein, A.; Masoud, S.J.; Hassan, M. Effects of Water Deficit and Chitosan Spraying on Osmotic Adjustment and Soluble Protein of Cultivars Castor Bean (Ricinus communis L.). J. Stress Physiol. Biochem. 2012, 8, 160–169. [Google Scholar]
  24. Cheeseman, J.M. Hydrogen Peroxide and Plant Stress: A Challenging Relationship. Plant Stress 2007, 1, 4–15. [Google Scholar]
  25. Morales, M.; Munné-Bosch, S. Malondialdehyde: Facts and Artifacts. Plant Physiol. 2019, 180, 1246–1250. [Google Scholar] [CrossRef] [PubMed]
  26. Isayenkov, S.V.; Maathuis, F.J.M. Plant Salinity Stress: Many Unanswered Questions Remain. Front. Plant Sci. 2019, 10, 435515. [Google Scholar] [CrossRef]
  27. Hao, S.; Wang, Y.; Yan, Y.; Liu, Y.; Wang, J.; Chen, S. A Review on Plant Responses to Salt Stress and Their Mechanisms of Salt Resistance. Horticulturae 2021, 7, 132. [Google Scholar] [CrossRef]
  28. Bistgani, Z.E.; Hashemi, M.; DaCosta, M.; Craker, L.; Maggi, F.; Morshedloo, M.R. Effect of Salinity Stress on the Physiological Characteristics, Phenolic Compounds and Antioxidant Activity of Thymus Vulgaris L. and Thymus Daenensis Celak. Ind. Crops Prod. 2019, 135, 311–320. [Google Scholar] [CrossRef]
  29. Sun, C.; Chen, J.; Wang, L.; Li, J.; Shi, Z.; Yang, L.; Yu, X. Thymol Deploys Multiple Antioxidative Systems to Suppress ROS Accumulation in Chinese Cabbage Seedlings under Saline Stress. Agronomy 2024, 14, 1059. [Google Scholar] [CrossRef]
  30. Khalil, S.E. Alleviating Salt Stress in Thymus Capitatus Plant Using Plant Growth-Promoting Bacteria (PGPR). Int. J. Chemtech Res. 2016, 9, 140–155. [Google Scholar]
  31. Reynolds, S.G. The Gravimetric Method of Soil Moisture Determination Part I A Study of Equipment, and Methodological Problems. J. Hydrol. 1970, 11, 258–273. [Google Scholar] [CrossRef]
  32. Orsini, F.; Cascone, P.; De Pascale, S.; Barbieri, G.; Corrado, G.; Rao, R.; Maggio, A. Systemin-Dependent Salinity Tolerance in Tomato: Evidence of Specific Convergence of Abiotic and Biotic Stress Responses. Physiol. Plant 2010, 138, 10–21. [Google Scholar] [CrossRef]
  33. Mackinney, G. ABSORPTION OF LIGHT BY CHLOROPHYLL SOLUTIONS. J. Biol. Chem. 1941, 140, 315–322. [Google Scholar] [CrossRef]
  34. Bates, L.S.; Waldren, R.P.; Teare, I.D. Rapid Determination of Free Proline for Water-Stress Studies. Plant Soil. 1973, 39, 205–207. [Google Scholar] [CrossRef]
  35. Trevelyan, W.E.; Harrison, J.S. Studies on Yeast Metabolism. 1. Fractionation and Microdetermination of Cell Carbohydrates. Biochem. J. 1952, 50, 298. [Google Scholar] [CrossRef] [PubMed]
  36. Tamás, P.; Hilda, K.S.; Anita, N.; Csaba, H.; Imre, B. (Eds.) Pharmacopoea Hungarica VIII (Ph. Hg. VIII), 8th ed.; Medicina Könyvkiadó Rt.: Budapest, Hungary, 2006; Volume 2, pp. 2359–2360. [Google Scholar]
  37. European Pharmacopoeia (Ph. Eur.), 11th ed.; EDMQ: Strasbourg, France, 2023.
  38. Etri, K.; Gosztola, B.; Végvári, G.; Ficzek, G.; Radácsi, P.; Simon, G.; Pluhaŕ, Z. Unravelling the Impact of Drought and Salt Stresses on Thymus Pannonicus: Morpho-Physiological and Biochemical Insights. Plant Stress 2024, 13, 100557. [Google Scholar] [CrossRef]
  39. Singleton, V.L.; Rossi, J.A. Colorimetry of Total Phenolics with Phosphomolybdic-Phosphotungstic Acid Reagents. Am. J. Enol. Vitic. 1965, 16, 144–158. [Google Scholar] [CrossRef]
  40. Benzie, I.F.F.; Strain, J.J. The Ferric Reducing Ability of Plasma (FRAP) as a Measure of “Antioxidant Power”: The FRAP Assay. Anal. Biochem. 1996, 239, 70–76. [Google Scholar] [CrossRef]
  41. Patterson, B.D.; MacRae, E.A.; Ferguson, I.B. Estimation of Hydrogen Peroxide in Plant Extracts Using Titanium(IV). Anal. Biochem. 1984, 139, 487–492. [Google Scholar] [CrossRef]
  42. Fischer, R.A.; Maurer, R. Drought Resistance in Spring Wheat Cultivars. I. Grain Yield Responses. Aust. J. Agric. Res. 1978, 29, 897–912. [Google Scholar] [CrossRef]
  43. Fernandez, G.C. Effective Selection Criteria for Assessing Plant Stress Tolerance. In Adaptation of Food Crops to Temperature and Water Stress: Proceedings of an International Symposium; Kuo, C.G., Ed.; AVRDC: Shanhua, Taiwan, 13–18 August 1992; pp. 257–270. [Google Scholar]
  44. Xylia, P.; Chrysargyris, A.; Tomou, E.M.; Goumenos, C.; Skaltsa, H.; Tzortzakis, N. Quality Characteristics and Essential Oil Properties of Thymus Capitatus, Mentha Piperita, and Sideritis Cypria Dried under Different Conditions. Plants 2024, 13, 3150. [Google Scholar] [CrossRef]
  45. Tamma, N.; Benchikha, N.; Messaoudi, M.; Caruso, G.; Bin Emran, T.; Atoki, A.V.; Adeniyi, A.I. Chemical Composition and Biological Properties of Thymus Capitatus Plants from Algerian High Plains: A Comparative and Analytical Study. Open Chem. 2024, 22, 20230192. [Google Scholar] [CrossRef]
  46. Saoulajan, C.; Boujida, N.; El Mihyaoui, A.; El Baakili, A.; Alshahrani, M.M.; Lee, L.H.; Bouyahya, A. Phytochemistry, Pharmacological Investigations, Industrial Applications, and Encapsulation of Thymbra Capitata L., a Review. Trends Food Sci. Technol. 2022, 129, 463–491. [Google Scholar] [CrossRef]
  47. Anwar, F.; Mahrye, I.; Khan, R.; Qadir, R.; Saadi, S.; Gruczynska-Sekowska, E.; Saari, N.; Hossain Brishti, F. Exploring the Biochemical and Nutra-Pharmaceutical Prospects of Some Thymus Species–A Review. Chem. Biodivers. 2024, 21, e202400500. [Google Scholar] [CrossRef] [PubMed]
  48. Kim, M.J.; Eom, S.H. Growth and Abscisic Acid Changes of Creeping Thyme in the Exposure of NaCl and Drought. Korean J. Med. Crop Sci. 2009, 17, 328–334. [Google Scholar]
  49. García-Caparrós, P.; Romero, M.J.; Llanderal, A.; Cermeño, P.; Lao, M.T.; Segura, M.L. Effects of Drought Stress on Biomass, Essential Oil Content, Nutritional Parameters, and Costs of Production in Six Lamiaceae Species. Water 2019, 11, 573. [Google Scholar] [CrossRef]
  50. Jangpromma, N.; Thammasirirak, S.; Jaisil, P.; Songsri, P. Effects of Drought and Recovery from Drought Stress on above Ground and Root Growth, and Water Use Efficiency in Sugarcane (“Saccharum officinarum” L.). Aust. J. Crop Sci. 2012, 6, 1298–1304. [Google Scholar]
  51. Abd Elbar, O.H.; Farag, R.E.; Shehata, S.A. Effect of Putrescine Application on Some Growth, Biochemical and Anatomical Characteristics of Thymus vulgaris L. under Drought Stress. Ann. Agric. Sci. 2019, 64, 129–137. [Google Scholar] [CrossRef]
  52. Forni, C.; Duca, D.; Glick, B.R. Mechanisms of Plant Response to Salt and Drought Stress and Their Alteration by Rhizobacteria. Plant Soil 2016, 410, 335–356. [Google Scholar] [CrossRef]
  53. Arif, Y.; Singh, P.; Siddiqui, H.; Bajguz, A.; Hayat, S. Salinity Induced Physiological and Biochemical Changes in Plants: An Omic Approach towards Salt Stress Tolerance. Plant Physiol. Biochem. 2020, 156, 64–77. [Google Scholar] [CrossRef]
  54. Farooq, M.; Wahid, A.; Kobayashi, N.; Fujita, D.; Basra, S.M.A. Plant Drought Stress: Effects, Mechanisms and Management. Sustain. Agric. 2009, 29, 153–188. [Google Scholar] [CrossRef]
  55. Litvin, A.G.; Van Iersel, M.W.; Malladi, A. Drought Stress Reduces Stem Elongation and Alters Gibberellin-Related Gene Expression during Vegetative Growth of Tomato. J. Am. Soc. Hortic. Sci. 2016, 141, 591–597. [Google Scholar] [CrossRef]
  56. Brunner, I.; Herzog, C.; Dawes, M.A.; Arend, M.; Sperisen, C. How Tree Roots Respond to Drought. Front. Plant Sci. 2015, 6, 152207. [Google Scholar] [CrossRef] [PubMed]
  57. Ashraf, M.; Shahbaz, M.; Ali, Q. Drought-Induced Modulation in Growth and Mineral Nutrients in Canola (Brassica napus L.). Pak. J. Bot. 2013, 45, 93–98. [Google Scholar]
  58. Nazari, M.; Ghasemi-Soloklui, A.A.; Kordrostami, M.; Abdel Latef, A.A.H. Deciphering the Response of Medicinal Plants to Abiotic Stressors: A Focus on Drought and Salinity. Plant Stress 2023, 10, 100255. [Google Scholar] [CrossRef]
  59. Johal, N.; Goyal, P. Drought and Salinity Stress: An Overlapping Osmotic Resistance. In Salinity and Drought Tolerance in Plants Physiological Perspective; Springer: Singapore, 2023; pp. 87–96. [Google Scholar] [CrossRef]
  60. Ozturk, M.; Turkyilmaz Unal, B.; García-Caparrós, P.; Khursheed, A.; Gul, A.; Hasanuzzaman, M. Osmoregulation and Its Actions during the Drought Stress in Plants. Physiol. Plant 2021, 172, 1321–1335. [Google Scholar] [CrossRef]
  61. Muhammad Aslam, M.; Waseem, M.; Jakada, B.H.; Okal, E.J.; Lei, Z.; Saqib, H.S.A.; Yuan, W.; Xu, W.; Zhang, Q. Mechanisms of Abscisic Acid-Mediated Drought Stress Responses in Plants. Int. J. Mol. Sci. 2022, 23, 1084. [Google Scholar] [CrossRef] [PubMed]
  62. Angon, P.B.; Tahjib-Ul-Arif, M.; Samin, S.I.; Habiba, U.; Hossain, M.A.; Brestic, M. How Do Plants Respond to Combined Drought and Salinity Stress?—A Systematic Review. Plants 2022, 11, 2884. [Google Scholar] [CrossRef]
  63. Yang, T.; Lu, X.; Wang, Y.; Xie, Y.; Ma, J.; Cheng, X.; Xia, E.; Wan, X.; Zhang, Z. HAK/KUP/KT Family Potassium Transporter Genes Are Involved in Potassium Deficiency and Stress Responses in Tea Plants (Camellia sinensis L.): Expression and Functional Analysis. BMC Genom. 2020, 21, 556. [Google Scholar] [CrossRef]
  64. Liang, L.; Guo, L.; Zhai, Y.; Hou, Z.; Wu, W.; Zhang, X.; Wu, Y.; Liu, X.; Guo, S.; Gao, G.; et al. Genome-Wide Characterization of SOS1 Gene Family in Potato (Solanum tuberosum) and Expression Analyses under Salt and Hormone Stress. Front. Plant Sci. 2023, 14, 1201730. [Google Scholar] [CrossRef]
  65. Mahajan, S.; Pandey, G.K.; Tuteja, N. Calcium- and Salt-Stress Signaling in Plants: Shedding Light on SOS Pathway. Arch. Biochem. Biophys. 2008, 471, 146–158. [Google Scholar] [CrossRef]
  66. Mahmoud, A.W.M.; Esmail, S.E.A.; El-Attar, A.B.; Othman, E.Z.; El-Bahbohy, R.M. Prospective Practice for Compound Stress Tolerance in Thyme Plants Using Nanoparticles and Biochar for Photosynthesis and Biochemical Ingredient Stability. Agronomy 2022, 12, 1069. [Google Scholar] [CrossRef]
  67. Ashrafi, M.; Azimi-Moqadam, M.R.; Mohsenifard, E.; Shekari, F.; Jafary, H.; Moradi, P.; Pucci, M.; Abate, G.; Mastinu, A. Physiological and Molecular Aspects of Two Thymus Species Differently Sensitive to Drought Stress. BioTech. 2022, 11, 8. [Google Scholar] [CrossRef] [PubMed]
  68. Mohammadi, H.; Ghorbanpour, M.; Brestic, M. Exogenous Putrescine Changes Redox Regulations and Essential Oil Constituents in Field-Grown Thymus vulgaris L. under Well-Watered and Drought Stress Conditions. Ind. Crops Prod. 2018, 122, 119–132. [Google Scholar] [CrossRef]
  69. Mohammadzadeh, S.; Pirzad, A. Biochemical Responses of Mycorrhizal-Inoculated Lamiaceae (Lavender, Rosemary and Thyme) Plants to Drought: A Field Study. Soil. Sci. Plant Nutr. 2021, 67, 41–49. [Google Scholar] [CrossRef]
  70. Tátrai, Z.A.; Sanoubar, R.; Pluhár, Z.; Mancarella, S.; Orsini, F.; Gianquinto, G. Morphological and Physiological Plant Responses to Drought Stress in Thymus Citriodorus. Int. J. Agron. 2016, 2016, 4165750. [Google Scholar] [CrossRef]
  71. Killi, D.; Raschi, A.; Bussotti, F. Lipid Peroxidation and Chlorophyll Fluorescence of Photosystem II Performance during Drought and Heat Stress Is Associated with the Antioxidant Capacities of C3 Sunflower and C4 Maize Varieties. Int. J. Mol. Sci. 2020, 21, 4846. [Google Scholar] [CrossRef]
  72. Yalcinkaya, T.; Uzilday, B.; Ozgur, R.; Turkan, I.; Mano, J. Lipid Peroxidation-Derived Reactive Carbonyl Species (RCS): Their Interaction with ROS and Cellular Redox during Environmental Stresses. Environ. Exp. Bot. 2019, 165, 139–149. [Google Scholar] [CrossRef]
  73. Hussain, S.; Rao, M.J.; Anjum, M.A.; Ejaz, S.; Zakir, I.; Ali, M.A.; Ahmad, N.; Ahmad, S. Oxidative Stress and Antioxidant Defense in Plants Under Drought Conditions. In Plant Abiotic Stress Tolerance Agronomic, Molecular and Biotechnological Approaches; Springer: Cham, Switzerland, 2019; pp. 207–219. [Google Scholar] [CrossRef]
  74. Ghosh, U.K.; Islam, M.N.; Siddiqui, M.N.; Cao, X.; Khan, M.A.R. Proline, a Multifaceted Signalling Molecule in Plant Responses to Abiotic Stress: Understanding the Physiological Mechanisms. Plant Biol. 2022, 24, 227–239. [Google Scholar] [CrossRef]
  75. Raza, A.; Charagh, S.; Abbas, S.; Hassan, M.U.; Saeed, F.; Haider, S.; Sharif, R.; Anand, A.; Corpas, F.J.; Jin, W.; et al. Assessment of Proline Function in Higher Plants under Extreme Temperatures. Plant Biol. 2023, 25, 379–395. [Google Scholar] [CrossRef]
  76. Atteya, A.K.G.; El-Serafy, R.S.; El-Zabalawy, K.M.; Elhakem, A.; Genaidy, E.A.E. Exogenously Supplemented Proline and Phenylalanine Improve Growth, Productivity, and Oil Composition of Salted Moringa by Up-Regulating Osmoprotectants and Stimulating Antioxidant Machinery. Plants 2022, 11, 1553. [Google Scholar] [CrossRef]
  77. Gill, S.S.; Tuteja, N. Reactive Oxygen Species and Antioxidant Machinery in Abiotic Stress Tolerance in Crop Plants. Plant Physiol. Biochem. 2010, 48, 909–930. [Google Scholar] [CrossRef]
  78. Rao, M.J.; Duan, M.; Zhou, C.; Jiao, J.; Cheng, P.; Yang, L.; Wei, W.; Shen, Q.; Ji, P.; Yang, Y.; et al. Antioxidant Defense System in Plants: Reactive Oxygen Species Production, Signaling, and Scavenging During Abiotic Stress-Induced Oxidative Damage. Horticulturae 2025, 11, 477. [Google Scholar] [CrossRef]
  79. Hasanuzzaman, M.; Raihan, M.R.H.; Masud, A.A.C.; Rahman, K.; Nowroz, F.; Rahman, M.; Nahar, K.; Fujita, M. Regulation of Reactive Oxygen Species and Antioxidant Defense in Plants under Salinity. Int. J. Mol. Sci. 2021, 22, 9326. [Google Scholar] [CrossRef] [PubMed]
  80. Demidchik, V. ROS-Activated Ion Channels in Plants: Biophysical Characteristics, Physiological Functions and Molecular Nature. Int. J. Mol. Sci. 2018, 19, 1263. [Google Scholar] [CrossRef]
  81. Liu, L.; Huang, L.; Lin, X.; Sun, C. Hydrogen Peroxide Alleviates Salinity-Induced Damage through Enhancing Proline Accumulation in Wheat Seedlings. Plant Cell Rep. 2020, 39, 567–575. [Google Scholar] [CrossRef]
  82. Couée, I.; Sulmon, C.; Gouesbet, G.; El Amrani, A. Involvement of Soluble Sugars in Reactive Oxygen Species Balance and Responses to Oxidative Stress in Plants. J. Exp. Bot. 2006, 57, 449–459. [Google Scholar] [CrossRef] [PubMed]
  83. Tiwari, Y.K. Proline as a Key Player in Heat Stress Tolerance: Insights from Maize. Discov. Agric. 2024, 2, 121. [Google Scholar] [CrossRef]
  84. Li, W.; Meng, R.; Liu, Y.; Chen, S.; Jiang, J.; Wang, L.; Zhao, S.; Wang, Z.; Fang, W.; Chen, F.; et al. Heterografted Chrysanthemums Enhance Salt Stress Tolerance by Integrating Reactive Oxygen Species, Soluble Sugar, and Proline. Hortic. Res. 2022, 9, uhac073. [Google Scholar] [CrossRef]
  85. Shafi, A.; Zahoor, I.; Mushtaq, U. Proline Accumulation and Oxidative Stress: Diverse Roles and Mechanism of Tolerance and Adaptation Under Salinity Stress. Salt Stress Microbes Plant Interact. Mech. Mol. Approaches 2019, 2, 269–300. [Google Scholar] [CrossRef]
  86. Mansour, M.M.F.; Salama, K.H.A. Proline and Abiotic Stresses: Responses and Adaptation. In Plant Ecophysiology and Adaptation Under Climate Change: Mechanisms and Perspectives II: Mechanisms of Adaptation and Stress Amelioration; Springer: Singapore, 2020; pp. 357–397. [Google Scholar] [CrossRef]
  87. Suprasanna, P.; Nikalje, G.C.; Rai, A.N. Osmolyte Accumulation and Implications in Plant Abiotic Stress Tolerance. In Osmolytes and Plants Acclimation to Changing Environment: Emerging Omics Technologies; Springer: New Delhi, India, 2016; pp. 1–12. [Google Scholar] [CrossRef]
  88. Wu, S.; Tian, J.; Ren, T.; Wang, Y. Osmotic Adjustment and Antioxidant System Regulated by Nitrogen Deposition Improve Photosynthetic and Growth Performance and Alleviate Oxidative Damage in Dwarf Bamboo Under Drought Stress. Front. Plant Sci. 2022, 13, 819071. [Google Scholar] [CrossRef]
  89. Wang, Q.; Du, B.; Bai, Y.; Chen, Y.; Li, F.; Du, J.; Wu, X.; Yan, L.; Bai, Y.; Chai, G. Saline-Alkali Stress Affects the Accumulation of Proanthocyanidins and Sesquiterpenoids via the MYB5-ANR/TPS31 Cascades in the Rose Petals. Hortic. Res. 2024, 11, uhae243. [Google Scholar] [CrossRef]
  90. Alavi-Samani, S.M.; Ghasemi Pirbalouti, A.; Ataei Kachouei, M.; Hamedi, B. The Influence of Reduced Irrigation on Herbage, Essential Oil Yield and Quality of Thymus Vulgaris and Thymus Daenensis. J. Med. Herbs 2013, 4, 109–113. [Google Scholar]
  91. Emami Bistgani, Z.; Siadat, S.A.; Bakhshandeh, A.; Ghasemi Pirbalouti, A.; Hashemi, M. Interactive Effects of Drought Stress and Chitosan Application on Physiological Characteristics and Essential Oil Yield of Thymus Daenensis Celak. Crop J. 2017, 5, 407–415. [Google Scholar] [CrossRef]
  92. Tammar, S.; Salem, N.; Bettaieb Rebey, I.; Sriti, J.; Hammami, M.; Khammassi, S.; Marzouk, B.; Ksouri, R.; Msaada, K. Regional Effect on Essential Oil Composition and Antimicrobial Activity of Thymus Capitatus L. J. Essent. Oil Res. 2019, 31, 129–137. [Google Scholar] [CrossRef]
  93. Németh-Zámbori, É.; Szabó, K.; Pluhár, Z.; Radácsi, P.; Inotai, K. Changes in Biomass and Essential Oil Profile of Four Lamiaceae Species Due to Different Soil Water Levels. J. Essent. Oil Res. 2016, 28, 391–399. [Google Scholar] [CrossRef]
  94. Mkaddem, M.G.; Romdhane, M.; Ibrahim, H.; Ennajar, M.; Lebrihi, A.; Mathieu, F.; Bouajila, J. Essential Oil of Thymus Capitatus Hoff. et Link. from Matmata, Tunisia: Gas Chromatography-Mass Spectrometry Analysis and Antimicrobial and Antioxidant Activities. J. Med. Food 2010, 13, 1500–1504. [Google Scholar] [CrossRef]
  95. Laftouhi, A.; Eloutassi, N.; Ech-Chihbi, E.; Rais, Z.; Abdellaoui, A.; Taleb, A.; Beniken, M.; Nafidi, H.A.; Salamatullah, A.M.; Bourhia, M.; et al. The Impact of Environmental Stress on the Secondary Metabolites and the Chemical Compositions of the Essential Oils from Some Medicinal Plants Used as Food Supplements. Sustainability 2023, 15, 7842. [Google Scholar] [CrossRef]
  96. Razavizadeh, R.; Mohagheghiyan, N. An Investigation of Changes in Antioxidant Enzymes Activities and Secondary Metabolites of Thyme (Thymus Vulgaris) Seedlings under in Vitro Salt Stress. J. Plant Biol. Sci. 2015, 7, 41–58. [Google Scholar]
  97. Naikoo, M.I.; Dar, M.I.; Raghib, F.; Jaleel, H.; Ahmad, B.; Raina, A.; Khan, F.A.; Naushin, F. Role and Regulation of Plants Phenolics in Abiotic Stress Tolerance: An Overview. In Plant Signaling Molecules: Role and Regulation Under Stressful Environments; Woodhead Publishing: Daryaganj, New Delhi, 2019; pp. 157–168. [Google Scholar] [CrossRef]
  98. Khosh-Khui, M.; Ashiri, F.; Saharkhiz, M. Effects of Irrigation Regimes on Antioxidant Activity and Total Phenolic Content of Thyme (Thymus vulgaris L.). Med. Aromat Plants 2012, 1, 1–4. [Google Scholar] [CrossRef]
  99. Kulbat, K.; Leszczyńska, J. Antioxidants as a Defensive Shield in Thyme (Thymus vulgaris L.) Grown on the Soil Contaminated with Heavy Metals. Biotechnol. Food Sci. 2016, 80, 109–117. [Google Scholar] [CrossRef]
  100. Thakur, K.; Garg, N. Oxidative Stress and Antioxidant Enzymes in Cereals Under Abiotic Stress. In Sustainable Remedies for Abiotic Stress in Cereals; Springer: Singapore, 2022; pp. 51–82. [Google Scholar] [CrossRef]
Figure 1. T. capitatus plants under different stress treatments applied.
Agronomy 15 01449 g001
Figure 2. Effect of the applied treatments on root development in T. capitatus.
Agronomy 15 01449 g002
Figure 3. Effects of the applied treatments on the physiological parameters of T. capitatus. The data are displayed as average values ± standard deviations. Bars with different letters (a, b, c) signify statistically significant differences between the treatments (p < 0.05).
Agronomy 15 01449 g003
Figure 4. Effect of the applied treatments on the essential oil contents, total polyphenols, antioxidant capacity and hydrogen peroxide levels of T. capitatus. The data are displayed as average values ± standard deviations. Bars with different letters (a, b, c) signify statistically significant differences between the treatments (p < 0.05).
Agronomy 15 01449 g004
Figure 5. Hierarchical clustering heatmap of morphological, physiological and biochemical parameters of T. capitatus. SH = Shoot height; SFW = Shoot fresh weight; SDW = Shoot dry weight; RWC = Relative water content; AOC = Antioxidant capacity; EOC = Essential oil content; Ch_a = Chlorophyll a; Ch_b = Chlorophyll b; RDW = Root dry weight; RL = Root length; RFW = Root fresh weight; H2O2 = hydrogen peroxide; TPC = Total polyphenol content.
Agronomy 15 01449 g005
Figure 6. Biplot of principal component analysis (PCA) illustrating the relationships among the studied parameters of T. capitatus when subjected to various stress conditions. Dim = dimension. SDW = Shoot dry weight; SFW = Shoot fresh weight; SH = Shoot height; RDW = Root dry weight; RFW = Root fresh weight; RL = Root length; Ch_a = Chlorophyll a; Ch_b = Chlorophyll b; EOC = Essential oil content; AOC = Antioxidant capacity; RWC = Relative water content; H2O2 = hydrogen peroxide; TPC = Total polyphenol content.
Agronomy 15 01449 g006
Table 1. Origin and characteristics of the peat moss and potting soil used.
ComponentOriginpHN (m/m%)P2O5 (m/m%)K2O (m/m%)Dry Matter Content (m/m%)Organic Matter Content (m/m%)
Peat mossKekkilä Professional, Estonia5.90 ± 0.500.300.100.10 70.00
Potting soilAGRO CS, Slovakia5.50 ± 0.500.100.010.0330.0075.00
Table 2. Chemical and physical characteristics of tap water.
pHElectric Conductivity (EC)Sodium Ions (Na+)Chloride Ions (Cl)Sodium Chloride (NaCl)
7.33494 µS/cm20.31 mg/L40.23 mg/L60.54 mg/L~1.037 mM
Table 3. Impact of different treatments applied on the shoot characteristics of T. capitatus.
TreatmentsShoots Height (cm)Number of Shoots (Pcs/Plant)Weight of Fresh Shoots (g/Plant)Weight of Dry Shoots (g/Plant)
Control27.50 ± 5.52 a29.25 ± 2.49 a12.69 ± 6.09 a2.61 ± 1.16 a
Drought Stress22.25 ± 4.17 bc17.00 ± 3.85 bc7.94 ± 3.31 b1.52 ± 0.67 b
Salinity Stress25.50 ± 3.71 ab19.50 ± 4.37 b9.18 ± 3.05 b2.09 ± 0.68 ab
Combined Stresses20.70 ± 3.84 c14.25 ± 3.53 c6.53 ± 2.86 b1.44 ± 0.52 b
Data are presented as mean ± standard deviation. Different lowercase letters (a, b, c) within the same column indicate significant differences between treatments (p < 0.05).
Table 4. Effect of treatments applied on the root parameters of T. capitatus.
TreatmentsLength of the Roots (cm)Weight of Fresh Roots (g)Weight of Dry Roots (g)
Control39.53 ± 1.25 a4.36 ± 0.45 a0.74 ± 0.10 a
Drought Stress23.98 ± 1.84 b1.65 ± 0.40 b0.23 ± 0.05 b
Salinity Stress26.75 ± 4.34 b2.03 ± 0.75 b0.29 ± 0.10 b
Combined Stresses23.00 ± 2.94 b1.33 ± 0.25 b0.18 ± 0.08 b
Data are presented as mean ± standard deviation. Different lowercase letters (a, b) within the same column indicate significant differences between treatments (p < 0.05).
Table 5. GC–MS results of the analyzed essential oils of T. capitatus across different stress treatments.
Essential Oil CompoundsRTLRIRelative Percentages of Compounds (%)
ControlDrought StressSalt StressCombined Stresses
α-Pinene5.569380.49 ± 0.05 a0.29 ± 0.15 b0.26 ± 0.07 bc0.11 ± 0.08 c
ß-Myrcene6.999951.52 ± 0.02 a1.20 ± 0.01 a1.20 ± 0.11 a0.77 ± 0.23 b
α-Terpinene7.7910181.65 ± 0.07 a1.24 ± 0.02 bc1.34 ± 0.10 ab0.90 ± 0.25 c
p-Cymene8.0910265.25 ± 0.11 a4.94 ± 0.15 a4.93 ± 0.11 a3.89 ± 0.64 b
γ-Terpinene9.2010565.86 ± 0.35 a4.22 ± 0.04 bc4.61 ± 0.11 b3.34 ± 0.69 c
Linalool10.7610971.07 ± 0.04 a1.62 ± 0.02 b1.70 ± 0.03 b1.50 ± 0.25 b
Borneol13.4311620.38 ± 0.02 a0.55 ± 0.03 c0.61 ± 0.01 c0.48 ± 0.01 b
Thymol18.8112900.16 ± 0.020.16 ± 0.020.19 ± 0.010.18 ± 0.01
Carvacrol19.20130078.86 ± 0.65 a80.73 ± 0.58 ab79.59 ± 0.48 b82.58 ± 1.43 b
ß-Caryophyllene23.6814202.10 ± 0.04 a2.56 ± 0.12 ab2.43 ± 0.33 a3.10 ± 0.32 b
Total identified (%) 97.3397.5196.8596.85
The data are displayed as average values ± standard deviation. Within the same row, values that are followed by different letters (a, b, c) signify statistically significant differences between them. RT = Retention time; LRI = Linear retention index.
Table 6. Stress susceptibility indexes and stress tolerance indexes for the stressed treatment of T. capitatus.
TreatmentsSSISTI
Drought Stress0.987 ± 0.689 ab0.626 ± 0.261 ab
Salinity Stress0.730 ± 0.636 a0.723 ± 0.241 a
Combined Stresses1.282 ± 0.597 b0.514 ± 0.226 b
The data are displayed as average values ± standard deviation. Within the same column, values that are followed by different letters (a, b, c) signify statistically significant differences between them. Susceptibility categories stress: if SSI ≥ 1: Susceptible, if 0.5 < SSI < 1: Moderate, if SSI < 0.5: Tolerant, [42].
Disclaimer/Publisher’s Note: The statements, opinions and data contained in all publications are solely those of the individual author(s) and contributor(s) and not of MDPI and/or the editor(s). MDPI and/or the editor(s) disclaim responsibility for any injury to people or property resulting from any ideas, methods, instructions or products referred to in the content.

