Article

Status Identification and Restoration Zoning of Ecological Space in Maowusu Sandy Land Based on Temporal and Spatial Characteristics of Land Use

1
Yinshanbeilu Grassland Eco-Hydrology National Observation and Research Station, China Institute of Water Resources and Hydropower Research, Beijing 100038, China
2
Institute of Water Resources for Pastoral Area, Ministry of Water Resources, Hohhot 010020, China
*
Author to whom correspondence should be addressed.
These authors contributed equally to this work.
Agronomy 2025, 15(6), 1445; https://doi.org/10.3390/agronomy15061445
Submission received: 13 April 2025 / Revised: 6 June 2025 / Accepted: 10 June 2025 / Published: 13 June 2025
(This article belongs to the Section Precision and Digital Agriculture)

Abstract

:
Maowusu sandy land is characterized by a fragile ecological environment and extreme sensitivity to external disturbances such as climate change and human activities. Identifying and zoning ecological spaces in this region are crucial for maintaining eco-environmental safety and promoting sustainable regional development. With Maowusu sandy land as the study object, the temporal and spatial characteristics of land use and the driving forces were explored via spatial analysis technology—the geographic information system. Then, a 2D relation judgment matrix was constructed by evaluating the importance of ecosystem service functions and ecological sensitivity. Next, restoration zoning of natural ecological space was performed, and relevant restoration suggestions were put forward accordingly. Results show that the land use in Maowusu sandy land has significantly changed in the past 30 years, with construction land and forest continuously expanding, cropland and grassland being squeezed, and some areas of unutilized land being transformed into other land use types. Ecosystem service functions tend to weaken from southwest to northeast, whereas the ecologically sensitive zones are mainly distributed in the middle of Maowusu sandy land. The high-importance and high-sensitivity zones of natural ecological space account for 3.60% of the total area of natural ecological space, mainly distributed near Ejin Horo Banner. A comprehensive restoration project of soil and water conservation should be conducted in this zone to alleviate soil erosion and maintain the management and restoration of ecological protection red lines. Moderately important sensitive zones account for the largest proportion (80.42%) of the total area of natural ecological space, being widely distributed. In such zones, water resources should be taken as constraints, with emphasis on ecological protection and improvement measures. Low-importance and low-sensitivity zones account for the smallest proportion, in which ecosystem protection, near-natural restoration, and moderate development and utilization should be carried out. This study aims to provide a scientific basis for reasonably protecting natural ecological resources and promoting the healthy and ordered development of natural ecosystems.

1. Introduction

As one of the four major sandy lands in China, Maowusu sandy land is an important ecological security barrier in the sand control belt in northern China and is an important area for the development of national land space in the country. The sustainable development of Maowusu sandy land has a far-reaching effect on exerting the function of the ecological barrier and promoting social and economic development [1,2]. With rapid economic and social development, the advancement of urbanization, and the construction of resource-based industrial bases in China, the area of Maowusu sandy land has become a hotspot to undertake industrial transfer in the eastern region [3]. However, this area is characterized by a fragile ecological environment and is highly sensitive to external disturbances such as climate change and human activities [4,5]. Driven by economic development and policy implementation [6], Maowusu sandy land is undergoing drastic economic and social transformation and land use change [7], accompanied by the increasingly prominent contradiction between ecological space and construction demand and the frequent occurrence of a series of ecological security problems, such as ecological structure destruction and functional degradation [8]. Therefore, identifying the ecological space of Maowusu sandy land and performing restoration zoning will be of great significance to the sustainable development of this area [9,10].
Many countries have realized reasonable zoning of ecological space by spatial planning. For example, Germany took the lead in dividing national space into different regions and implementing spatial planning at the beginning of the 20th century [11], closely followed by countries in Europe, America, and Asia. For instance, in the early 20th century, the United States addressed land issues by implementing a land use zoning system tailored to the specific challenges of different periods. By the 21st century, the focus shifted toward marine resources, as evidenced by the introduction of initiatives like the Oceans Blueprint for the 21st Century and the National Ocean Policy Implementation Plan. These efforts emphasize the protection, sustainable development, and utilization of marine resources [12,13,14]. In Europe, the research on ecological space zoning tends to be quantitative. For example, Dutch scholar Janne Soininen conducted quantitative research on ecological space through the analysis of social space structure [15], and French scholar Govaert Lynn took into consideration the importance of ecology and evolution to population and community for ecological evolution zoning [16]. The research on zoning of natural ecological space in China began with the protection of cropland [17]. To improve the quality of cropland and promote the sustainable utilization of land resources [18,19,20], China divided land into three types—cropland, construction land, and unutilized land—and then carried out more refined classification management in the protection of forest, water, and marine resources [21,22]. The current research on the zoning of natural ecological space in China mainly focuses on the identification and structural optimization of ecological space, the imbalance and reconstruction of ecological space, and the evolution and planning of ecological space [23,24].
The existing research provides a robust theoretical basis and technical support for the management of natural ecological space and can be a valuable reference for future studies. However, most of the research has concentrated on macro levels, and the spatial characteristics regarding the importance of ecosystem service functions in space and sensitivity to ecological environment have been less considered. Scientifically identifying the spatial stratified heterogeneity of ecosystem service function and ecological sensitivity and carrying out ecological restoration zoning based on this is the key path to achieving regional ecological–social coordinated development and maintaining ecosystem stability.
As a typical ecologically fragile area in northern China, Maowusu sandy land shows significant spatial stratified heterogeneity of land use and ecosystem. This heterogeneity leads to severe challenges to regional ecological protection and restoration. In view of this scientific problem, this study deeply explored the spatial stratified heterogeneity pattern of ecosystem service function and ecological sensitivity in the study area and constructed a spatial zoning system for ecological restoration. The research results can provide a scientific basis for the precise management of ecological resources in Maowusu sandy land and have important theoretical and practical value for promoting the healthy and stable development of regional ecosystems.

2. Materials and Methods

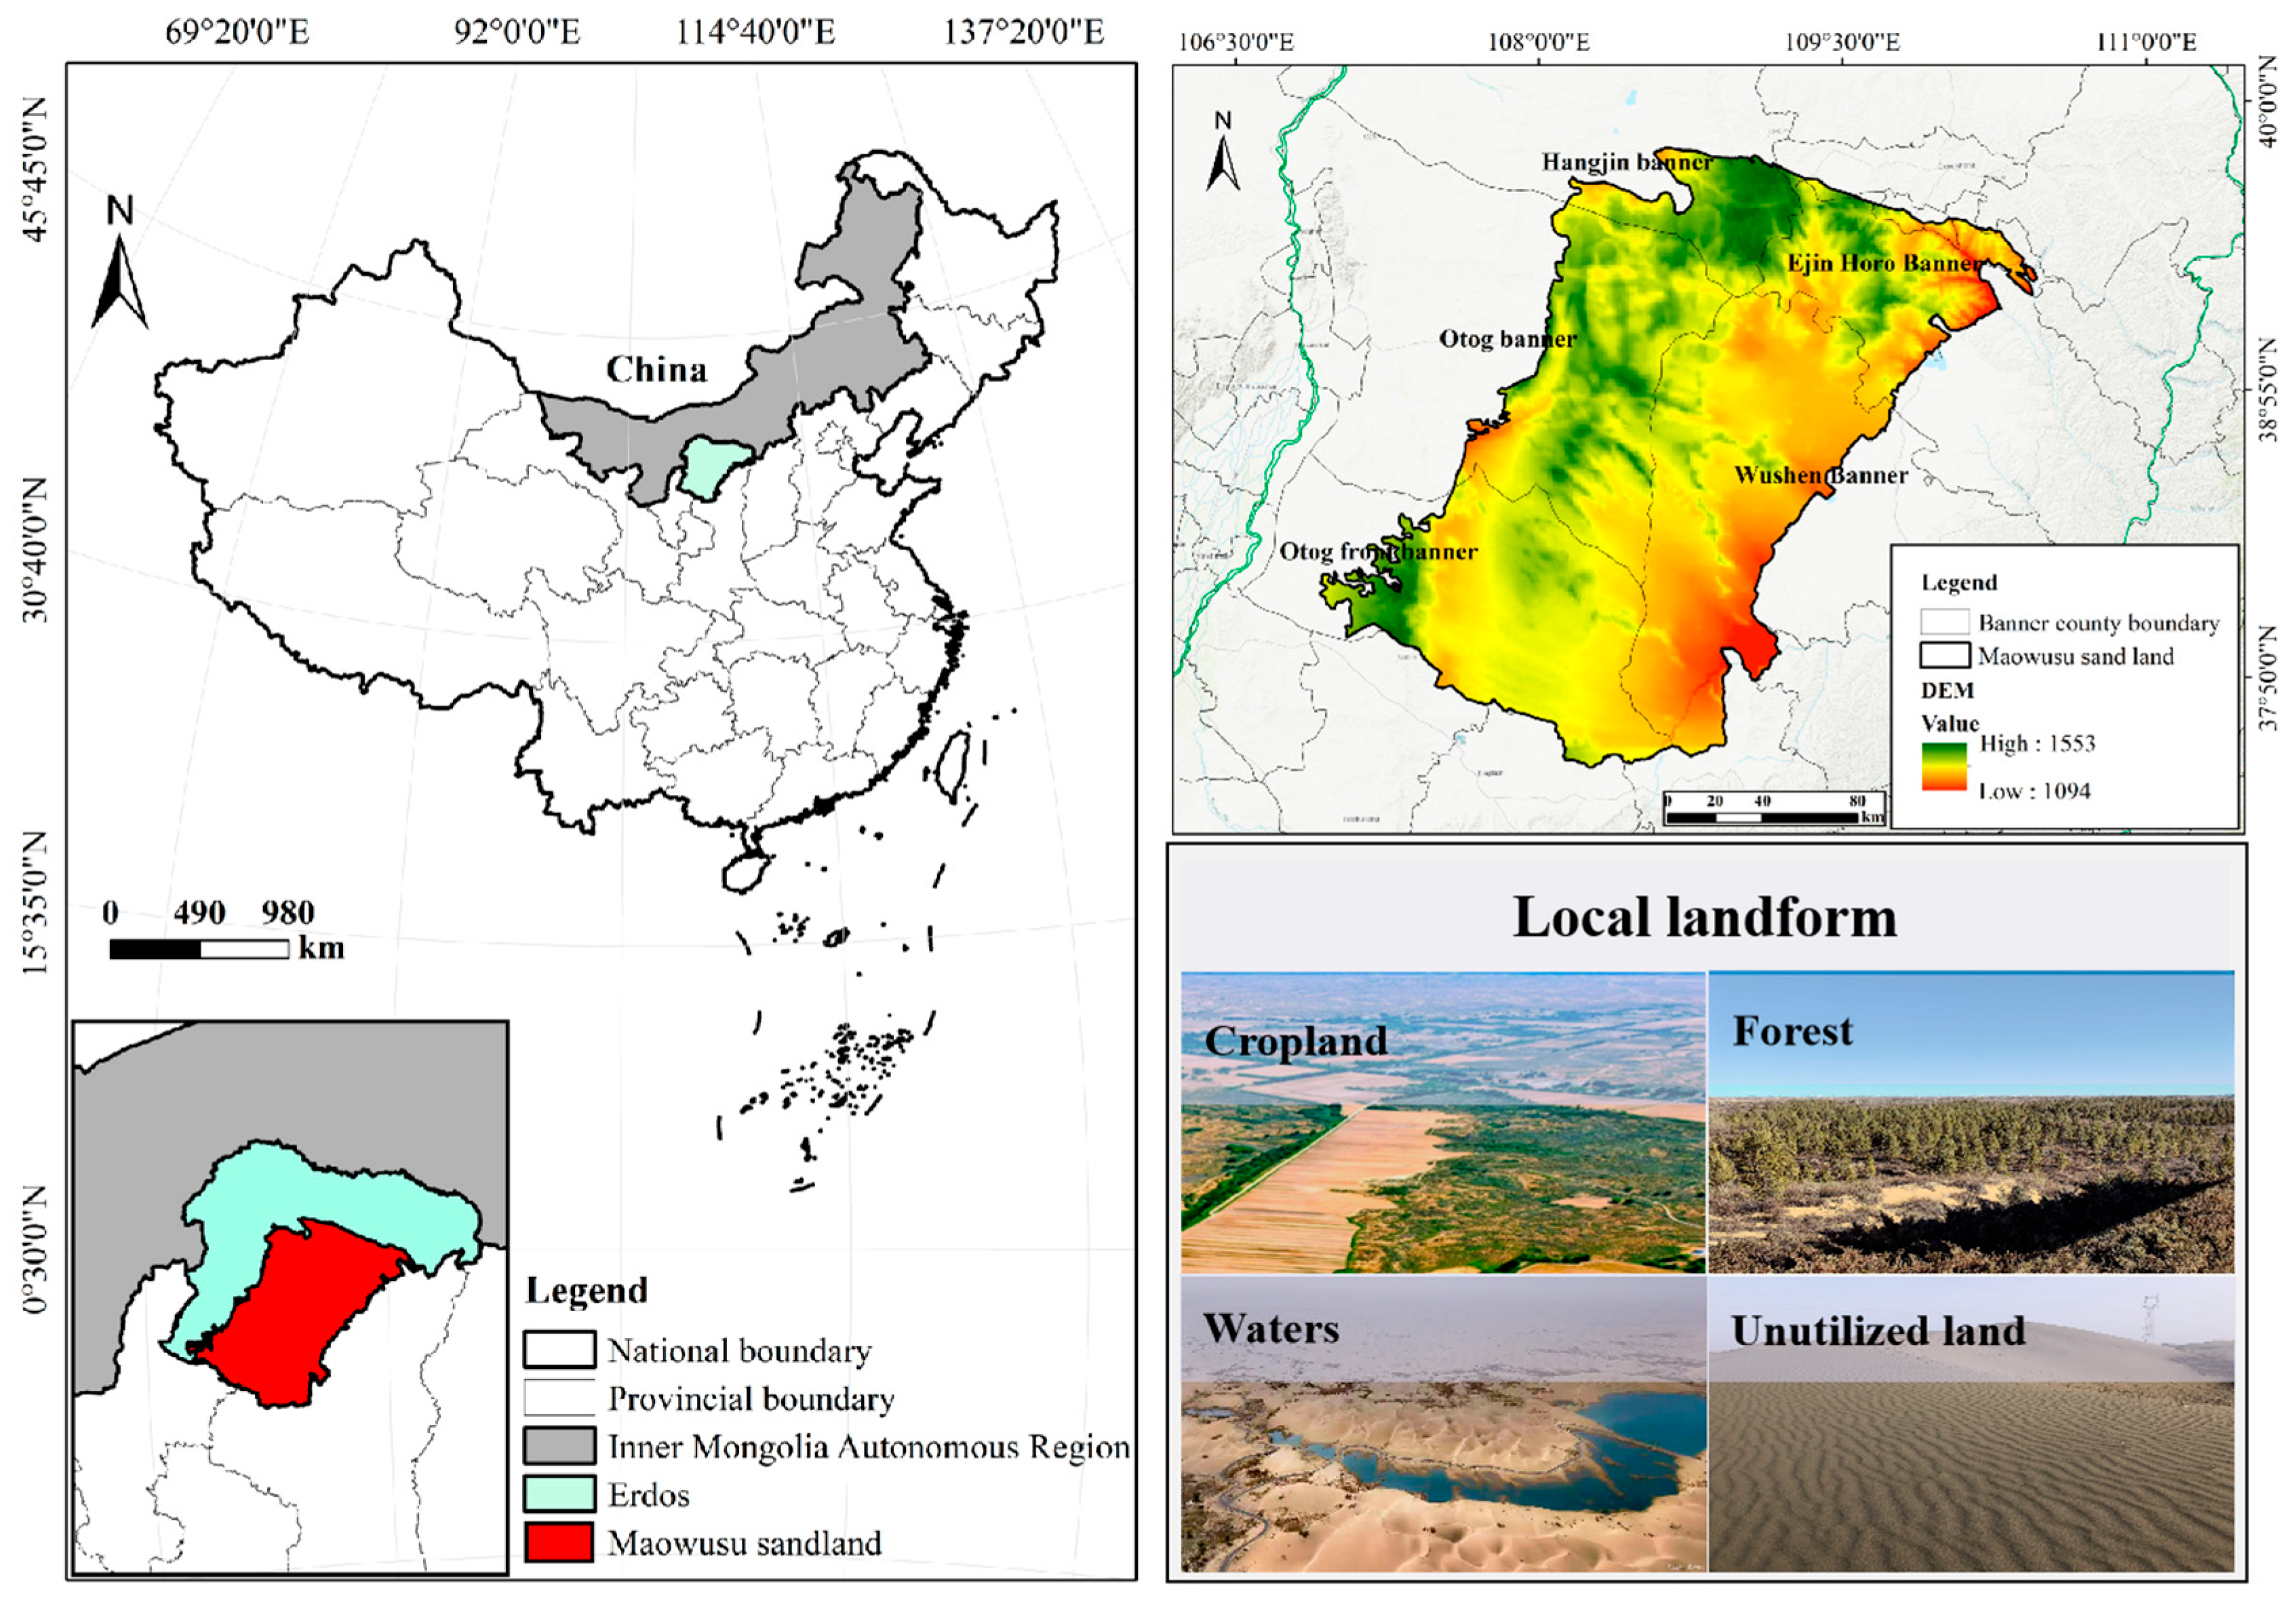
2.1. Overview of the Study Area

Maowusu sandy land, which is one of the four major sandy lands in China, is located at the southeast of Ordos Plateau and lies, as a whole, in the zigzag bend of the Yellow River (37°27.5′–39°22.5′ N, 107°20′–111°30′ E), with a total area of about 38,000 km2. In the north and west are denuded highlands, and it transits to the Loess Plateau in the east and south [25,26]. It is high in the northwest and low in the southeast, with an elevation of 1094–1553 m (Figure 1). In addition, this area belongs to the typical temperate continental semi-arid climate, with an average annual temperature of 6.8–9.2 °C, annual precipitation of about 250–440 mm, and annual evaporation of 1800–2500 mm. Zonal chestnut soil and non-zonal aeolian sandy soil are dominant soil types [27,28]. The scarcity of precipitation seriously affects the growth of regional vegetation, with broad-leaved forests in the south and southeast, dry grasslands in the middle and east, and desert grasslands at the northern edge [29].

2.2. Data Sources and Preprocessing

The data needed in this study included remote sensing data such as normalized difference vegetation index (NDVI), net primary productivity (NPP) over years, soil type, meteorology, digital elevation model (DEM), and land use, as well as socioeconomic and water resources data such as surface water, groundwater, total population, per capita income of farmers and herdsmen, and livestock production. Among them, the socioeconomic and water resources data were collected according to the counties involved in Maowusu sandy land, and the characterization values of the overall level of the study area were obtained using arithmetic average calculation; remote sensing data need to be pre-processed in ArcGIS 10.7, such as projection, mask extraction, and resampling, and all data are uniformly projected into WGS 1984 UTM Zone 49N. Data sources and basic information are shown in Table 1.

2.3. Analysis Methods for Land Use Changes and Driving Forces

(1) Land use transfer matrix
The land use data in four periods—1990, 2000, 2010, and 2020—were subjected to spatial analysis via ArcGIS10.7, and a land use transfer matrix was established [30], as follows (1):
S i j = S 11 S 12 S 1 n S 21 S 22 S 2 n S n 1 S n 2 S n n ,
where S denotes land use area; n represents the number of land use types before and after the transfer; i (i = 1, 2, 3… n) represents the land use type before the transfer; j (j = 1, 2, 3… n) represents the land use type after the transfer; and Sij is the land use area transformed from type i before the transfer into type j after the transfer. The row of the matrix denotes the flow of information from the area of type i before the transfer to the area of various land types after the transfer, and the column of the matrix denotes the source of the area of type j after the transfer from the area of various land types before the transfer.
(2) Land use dynamic degree
Land use dynamic degree is an index reflecting the dynamic change degree of land use types, including single and comprehensive land use dynamic degrees [31,32]. The single land use dynamic degree (LU) is expressed as follows (2):
L U = U b U a U b × 1 T × 100 % ,
where Ub and Ua represent the area of a single land use type at the end and beginning of one period, respectively; and T stands for the time frame.
The comprehensive land use dynamic degree (LC) is solved as follows (3):
L C = i = 1 n L U i j 2 j = 0 n L U i × 1 T × 100 % ,
where LUi-j is the absolute value of the area transformed from type i to type j within time T.
(3) Gray relational model
The water resource status in the study area was reflected by selecting the water supply of surface water, groundwater, and other water sources. The socioeconomic characteristics were reflected by the total population, the per capita income of farmers and herdsmen, and the output of livestock products. The natural climatic features were characterized by the annual precipitation, annual mean temperature, and annual mean evaporation. The above indexes all served as the indicator values for the driving factors of the model.
X0 = {X0 (1), X0 (2), …, X0 (n)} was set as the reference series, and Xi = {Xi (1), Xi (2), …, Xi (n)} was set as the compared series, where i = 1, 2, …, m. The correlation coefficient of Xi with X0 at point k is expressed [33] as follows (4):
ξ i = i m i n k m i n X 0 ( k ) X i ( k ) + ρ i m a x k m a x X 0 ( k ) X i ( k ) X 0 ( k ) X i ( k ) + ρ i m a x k m a x X 0 ( k ) X i ( k ) .
The relational degree of Xi to X0 is solved as follows (5):
r i = 1 n k = 1 n ξ i ( k ) ( i = 1 , 2 , , m ) ,
where ρ is the resolution coefficient ρ = 0.5. The values of r1, r2, …, rm were compared, and the relational order was acquired.

2.4. Evaluation of Ecosystem Service Functions and Ecological Sensitivity

The ecosystem service function refers to all the benefits that human beings derive from the ecosystem. It is not only the basis of social development and human well-being but also a bridge between socioeconomic systems and natural ecosystems [34]. Ecological sensitivity refers to the difficulty or probability of regional ecological environment problems under the influence of the same intensity of human activities or external forces [35]. The ecosystem service function evaluation is usually evaluated by the ecosystem service function composite index (IESE). Because the parameters selected by previous researchers in the study area were different, this study comprehensively considered the actual situation of the study area and the availability of data. When calculating IESE, the NPP quantitative index evaluation method was used to calculate the importance index of the water conservation function (WR), the importance index of the soil and water conservation function (Spre), and the biodiversity protection function index (Sbio). The Carbon module in the InVEST model was used to calculate the carbon sequestration service function importance index (Ctotal). The ecological sensitivity evaluation is usually evaluated by the ecological sensitivity comprehensive index (SSI). Because land desertification in the study area is more serious, the land desertification sensitivity index (D) and the soil erosion sensitivity index (SSW) were used to evaluate the SSI.
The calculation process of IESE is shown in Equation (6), where WR is the importance index of the water conservation function, Spre is the importance index of soil and water conservation function, Sbio is the biodiversity conservation function index, and Ctotal is the importance index of the carbon sequestration service function.
I E S E = W R + S p r e + S b i o + C t o t a l
The calculation process of SSI is shown in Equation (7), in which SSW is the sensitivity index of soil erosion and D is the sensitivity index of land desertification.
S S I = S S w + D
The specific calculation process of the indicators required to calculate IESE and SSI [36,37] is shown in Table 2. Each variable in the annotation was calculated with reference to the basic data collected in previous studies. IESE was divided into four grades: generally important, moderately important, important, and extremely important, according to its index by cluster analysis. SSI was divided into four grades: generally sensitive, moderately sensitive, sensitive, and extremely sensitive, according to its index.

2.5. Natural Ecological Restoration Zoning

According to the existing natural ecological space restoration zoning method [38], cluster merging and convergence analysis were performed on the evaluation results of ecosystem service functions and eco-environmental sensitivity. According to the function index, ecosystem service functions were divided into four types: generally important, moderately important, important, and extremely important. Ecological sensitivity was divided into four types: generally sensitive, moderately sensitive, sensitive, and extremely sensitive. On this basis, the natural ecological space was classified and zoned using the 2D relation judgment matrix method, as shown in Table 3.

3. Results

3.1. Analysis of Temporal and Spatial Characteristics of Land Use and Driving Forces

3.1.1. Temporal and Spatial Characteristics of Land Use

Using LU and LC (Figure 2 and Figure 3a) to analyze the change range of land use types in Maowusu sandy land revealed an upward trend in the LC. The values were 0.03%, 0.11%, and 0.13% for 1990–2000a, 2000–2010a, and 2010–2020a, respectively. The LU of forest and construction land in these three time periods was positive, whereas the LU of other land use types showed fluctuating changes. In particular, the single dynamic degree of cropland decreased at an annual rate of −0.38% in 1990–2000a, increased at a rate of 1.04% in 2000–2010a, and decreased at a rate of −1.09% in 2010–2020a. The single dynamic degree of grassland increased at an annual rate of 0.05% in 1990–2000a, decreased at a rate of −0.38% in 2000–2010a, and increased at a rate of 0.17% in 2010–2020a. The single dynamic degree of waters increased at an annual rate of 0.08% in 1990–2000a, decreased at a rate of −0.56% in 2000–2010a, and increased at a rate of 0.60% in 2010–2020a. The unutilized land, that is, land that has not been developed or is difficult to use, showed an upward trend in 1990–2000a and 2000–2010a, increasing at a rate of 0.12% and 0.20% per year, respectively, but decreased at a rate of −0.37% in 2010–2020a.
As shown in Figure 2 and Figure 3b,c, the distribution of construction land expanded continuously from the east and northeast edges of Maowusu sandy land to the west and southwest over 30 years, with a total increase of 1961.1 km2 affected by human activities, and the area ratio increased from 2.6% in 1990a to 4.0% in 2020a. After long-term management of Maowusu sandy land, the area of forest increased by 829.3 km2, the proportion of forest increased from 4.5% in 1990a to 5.1% in 2020a, and the distribution of forest gradually expanded from the marginal area to the center. Cropland was mainly distributed at the southeast and northeast edges, with a small amount at the west edge. With time, the cropland area showed a decreasing trend, with a total decrease of 1211.1 km2, and the area ratio decreased from 15.1% in 1990a to 14.3% in 2020a. The grassland area initially increased, then decreased, and increased again; it increased by 402.2 km2 in 1900–2000a, decreased by 3152.7 km2 in 2000–2010a, and increased by 1324.4 km2 in 2010–2020a, with a total decrease of 1426.2 km2, and the area ratio decreased from 55.0% in 1990a to 50% in 2020a. The area of unutilized land increased initially and then decreased. From 1990 to 2020a, the area of unutilized land decreased by 185.5 km2, and the area ratio decreased from 20.2% in 1990a to 20.0% in 2020a. In 1990–2020a, the land use types in Maowusu sandy land significantly changed (Figure 3d). The unutilized land area mainly came from grassland, the construction land mainly came from cropland and forest, and the reduced part of the waters was converted into unutilized land.
Overall, the distribution of land use types in Maowusu sandy land has notably changed in the past 30 years. Construction land and forest areas have continuously expanded, whereas the space occupied by cropland and grassland has been reduced. This period has also seen severe grassland degradation in some areas and increased potential desertification risk, and some areas of unutilized land are being transformed into other land use types. Land use changes present a complicated pattern of “co-existence of ecological recovery and degradation”, making it necessary to pertinently strengthen natural ecological restoration.

3.1.2. Driving Force Analysis

The influencing degree of each influencing factor on the land use changes in Maowusu sandy land was quantitatively analyzed via the gray relational model, with the results listed in Table 4. Among various land use types, cropland, forest, grassland, waters, and unutilized land were highly related to the annual mean temperature and annual mean evaporation; the relational degree with annual mean temperature was 0.97, 0.98, 0.98, 0.98, and 0.99, respectively, and the relational degree with annual mean evaporation was 0.96, 0.98, 0.97, 0.97, and 0.98, respectively. Construction land showed the highest relational degree with a total population of 0.96. The driving factor with the minimum relational degree with land use types was always the per capita income of farmers and herdsmen, and the relational degrees of cropland, forest, grassland, waters, construction land, unutilized land, and per capita income of farmers and herdsmen were 0.65, 0.65, 0.64, 0.64, 0.67, and 0.65, respectively. Analysis of the relational degree of land use types with each driving factor indicated that natural driving factors were the dominant factors influencing the changes in the natural ecological space of Maowusu sandy land, with the driving levels of annual mean temperature and annual mean evaporation being higher than those of other driving factors. Total population and natural driving factors were the main factors influencing the changes in construction land of Maowusu sandy land, with the driving level of total population being higher than that of natural driving factors, indicating that the development and utilization of construction land were significantly affected by human activities.
The selected driving factors all affected the dynamic change degree of land use in Maowusu sandy land to a certain extent. However, due to the prominent problem of land desertification in the region, the explanatory power of the selected driving factors on land use change is relatively limited, and the policy intervention of the Chinese government regarding the ecological management of Maowusu sandy land may be the key driving force for land use transformation in the region.

3.2. Evaluation of Ecosystem Service Functions

3.2.1. Evaluation of Water Conservation Function

The higher the importance index of the water conservation function, the higher the requirement and value of the ecosystem service function, and the greater the constraint intensity on construction and development. The zoning results (Figure 4a) showed that the water conservation function of Maowusu sandy land showed an obvious spatial distribution trend, being strong in the central region and relatively weak in the south and north. Judging from the importance index, the high-value zones accounted for 36.07% of Maowusu sandy land, mainly concentrated in the south of Wushen Banner and the east of Otog Banner. The reason is mainly attributed to the remarkable improvement of the vegetation coverage rate by ecological restoration measures implemented in recent years, thereby enhancing the water conservation capacity. The proportion of low-value zones was only 1.28%, and they were relatively scattered. The importance index of water conservation function in such zones was low because of the serious land desertification and steep terrains, which are not good for water conservation.

3.2.2. Evaluation of Water and Soil Conservation Function

The soil and water conservation function refers to the function of reducing soil erosion caused by water erosion through the interaction between its own structure and process in the ecosystem. The zoning results (Figure 4b) indicated that the high-value zones accounted for the smallest proportion and were distributed in the northeast of Maowusu sandy land. The zones with the importance index of soil and water conservation function of 35.0–101.1 accounted for the largest proportion (71.68%) of the total area. These zones were distributed in Hangjin Banner, Otog Banner, and Wushen Banner, and the distribution area was large in Wushen Banner. The extensive distribution area of such zones means that the water and soil conservation capacity of the study area is still in a weak state, and it is necessary to further strengthen the implementation of water and soil conservation engineering measures. The water and soil loss is the result of the relatively loose soil texture, which impedes water storage.

3.2.3. Evaluation of Biodiversity Conservation Function

The biodiversity conservation function reflects the ability to maintain the diversity of species and ecosystems. According to the zoning results (Figure 4c), the total area of zones with biodiversity conservation function indexes of 0–0.2 and 0.2–0.5 was similar, accounting for 35.72% and 33.27% of the total area, respectively, and the two zones together accounted for about 70% of the total area. Thus, the overall biodiversity conservation ability of Maowusu sandy land is poor. This may be attributed to the degradation of ecosystems and the expansion of desertification, resulting in the rapid disappearance of many animal and plant species in Maowusu sandy land or the sharp decline of their population. At the same time, land desertification in this area is serious, making it difficult to maintain biodiversity.

3.2.4. Evaluation of Carbon Sequestration Service Function

The carbon sequestration service function is the function of fixing carbon in plants or soil. The zoning results (Figure 4d) showed that the carbon sequestration service function of Maowusu sandy land presented significant spatial stratified heterogeneity. The zones with the importance index of carbon sequestration service function of 243.8–747.5 occupied a relatively large area, accounting for 57.56%, and they were mainly concentrated around Wushen Banner. Carbon sequestration could be effectively realized because of the relatively perfect ecosystems in such zones. High-value zones exhibited more prominent carbon sequestration capacity, but they only accounted for 18.18% of the total area and were mainly distributed in Otog Banner, Otog Front Banner, and the northern part of Maowusu sandy land. Most of these zones are typical grasslands and desert grasslands. Because of their rich vegetation types, the carbon reserve is significantly higher than that of zones mainly dominated by food crops and economic crops. On the whole, the carbon sequestration capacity of Maowusu sandy land is greatly influenced by ecological types, and grassland and desert grassland areas provide favorable carbon storage conditions.

3.2.5. Comprehensive Evaluation of Ecosystem Service Functions

Regarding the distribution of different ecosystem service functions (Figure 4), the high-value areas of water conservation function, soil and water conservation function, biodiversity protection function, and carbon sequestration service function partially overlapped. The reason for this is that areas with good vegetation coverage and suitable terrain conditions can not only effectively intercept precipitation and enhance infiltration to achieve water conservation but also reduce soil erosion by virtue of vegetation root soil fixation and then play the role of soil and water conservation. At the same time, these areas provide relatively stable habitats and water sources for organisms, which is conducive to maintaining biodiversity. Vegetation is the core subject of carbon sequestration in terrestrial ecosystems. It absorbs a large amount of carbon dioxide through photosynthesis, so the carbon sequestration capacity is also prominent in these regions.
As shown in Figure 5, the ecosystem service function of Maowusu sandy land showed a weakening trend from southwest to northeast as a whole, and its distribution was consistent with the water conservation function, indicating that the water conservation function plays a leading role in the ecosystem service function of Maowusu sandy land. The generally important area and moderately important area in the ecosystem service function accounted for a large proportion (47.67% and 47.83% of the total area, respectively). The important zones accounted for a relatively small proportion (4.25%) of the total area, and the extremely important zones accounted for the smallest proportion (0.25%) of the total area. Thus, the overall ecosystem service function of the study area is weak, and ecological protection projects still need to be actively promoted for environmental protection and ecological construction.

3.3. Evaluation of Ecological Sensitivity

3.3.1. Water and Soil Loss Sensitivity

The sensitivity of Maowusu sandy land to water loss and soil erosion was comprehensively evaluated using the equation model of soil erosion. The evaluation results (Figure 6a) showed that the high-value zones accounted for 27.31% of the total area of the study area, mainly distributed in the middle of the sandy land. The reason for the high sensitivity of this area lies in the low vegetation cover and the imbalance of ecological environment caused by overgrazing and unreasonable land use. The low-value zones accounted for the smallest proportion (8.52%) of the total area, mainly distributed in the northern part of the sandy land, where the vegetation cover is relatively high. The zones with a water loss and soil erosion sensitivity index of 0.18–0.22 accounted for 40.61% of the total area of the study area. Overall, water loss and soil erosion remain severe in Maowusu sandy land.

3.3.2. Land Desertification Sensitivity

As revealed by the spatial distribution of land desertification sensitivity (Figure 6b), the land desertification status of Maowusu sandy land is still serious. The zones with the land desertification sensitivity indexes of 0.5–1.1 accounted for the largest proportion (49.97%) of the total area of the study area; the high-value zones accounted for the smallest proportion (2.02%) of the total area. Land desertification is greatly affected by wind, and wind erosion damage is mainly caused by the decline in groundwater level, vegetation degradation, and low vegetation cover. The proportion of high-value zones was the smallest, meaning that the implementation effect of sand control engineering measures has been improved compared with previous years. The zones with land desertification sensitivity indexes of 0.5–1.1 and 1.1–1.3 accounted for a high proportion, meaning that restoration work remains to be strengthened.

3.3.3. Comprehensive Evaluation of Ecological Sensitivity

The comprehensive evaluation result of ecological sensitivity was acquired by combining water loss and soil erosion sensitivity and land desertification sensitivity and dividing into four grades in descending order (Figure 6c). In the study area, sensitive zones were mainly distributed in the center of Maowusu sandy land, and extremely sensitive zones accounted for 2.05% of the total area, and moderately sensitive zones reached 42.43%. The above analysis indicates the relatively high ecological sensitivity of the study area, requiring relevant departments to enhance ecological protection in this area.

3.4. Restoration Zoning of Natural Ecological Space

According to the Measures for the Control of the Use of Natural Ecological Space (Trial) in China, data with natural attributes, including grassland, forest, lake, river, beach, and other natural ecological space types, were extracted to form a natural ecological space (Figure 7a). The natural ecological space of the study area was zoned by combining the evaluation of the importance of ecosystem service functions (Figure 7b) and ecological sensitivity (Figure 7c) in the study area.

3.4.1. High-Importance and High-Sensitivity Zones

High-importance and high-sensitivity zones refer to zones with extremely high ecosystem service function and ecological sensitivity. The evaluation results (Figure 7d) showed that the high-importance and high-sensitivity zones accounted for 3.60% of the total area of natural ecological space, mainly distributed near Ejin Horo Banner. These zones have relatively more construction land with a more complicated distribution of forest and grassland, which results in a relatively fragile ecological environment, serious water loss and soil erosion, and prominent resource–environment contradiction. To cope with this situation, water and soil conservation capacity and water conservation capacity should be strengthened by implementing comprehensive government projects, thereby improving the ecosystem service capacity of this area. Efforts should also be made to strengthen biodiversity conservation in natural reserves and manage and restore ecological protection red lines, ensuring the sustainable development of ecosystems.

3.4.2. Moderately Important and Sensitive Zones

Moderately important and sensitive zones refer to zones with moderate ecosystem service function and ecological sensitivity. These zones accounted for the largest proportion (80.42%) of the total area of natural ecological space in this area, presenting a widely spatial distribution. Overall, the eco-environmental status in such zones is good, and these zones play the role of important ecological corridors connecting the ecosystems in high-importance and high-sensitivity zones with those in low-importance and low-sensitivity zones. However, the water conservation function in such zones is general, and water loss, soil erosion, and land desertification are prominent, making it especially important to manage and protect water resources. Therefore, water resources should be taken as important constraints, and emphasis should be laid on ecological protection regarding land use and production activities, ensuring the maintenance and improvement of ecological functions.

3.4.3. Low-Importance and Low-Sensitivity Zones

Low-importance and low-sensitivity zones are those with low levels of ecosystem service functions and ecological sensitivity. Such zones accounted for 15.97% of the total area of natural ecological space, accompanied by general carbon sequestration service function and extreme sensitivity to water loss and soil erosion. Accordingly, focus should be on vegetation recovery. On the precondition of not destroying the ecological environment and giving priority to protection, scientific governance should be implemented to realize protection and near-natural restoration of desert ecosystems.

4. Discussion

Since the end of the 20th century, driven by the implementation of the project “Returning Farmland to Forest and Grassland” in China [39], the grassland area of Maowusu sandy land has been greatly enlarged [40]. However, grassland degradation in some areas is still severe, the potential desertification risk is aggravated [41], and land use change presents a complex pattern of “co-existence of ecological restoration and degradation”. The study of land use change and its driving forces is helpful to deeply understand the present situation and variation trend of regional land use and determine the internal mechanism and basic process of land use changes [42,43]. Land use change is a dynamic process influenced by many factors, such as nature and society. Among the natural factors, climate and hydrology are the basic conditions that affect land use change, and they are the main driving forces of ecological land use change, exerting a cumulative effect in a long time series [44,45].
This study found that land use types of cropland, forest, grassland, waters, and unutilized land are closely related to the driving factors of annual average temperature and annual average evaporation. The reason for this is that regional hydrothermal conditions directly regulate the photosynthetic efficiency of vegetation, the length of the growing season, the boundary of species distribution, and the intensity of the hydrological cycle and thus determine the adaptive distribution of the above land use types to the demand and stress response of light, heat, and water resources [46]. The correlation between per capita income of farmers and herdsmen and various land use types is the smallest, which is related to the fact that Maowusu sandy land is located in an ecologically fragile area. The formation and evolution of its land use pattern are mainly subject to the rigid constraints of the natural ecological environment and ecological restoration policies. The relative fluctuation of per capita income of farmers and herdsmen means it is difficult to break through the ecological threshold at the regional scale or significantly change established land use types [47,48]. The construction land has the greatest correlation with the total population. This is because population agglomeration not only represents the labor supply but also promotes and supports the activities of the secondary and tertiary industries. These economic activities are highly dependent on the use of land for construction, such as factories, shopping malls, and warehouses, as spatial carriers [49]. In summary, natural driving factors are the dominant factors affecting the spatial change of natural ecology in Maowusu sandy land, and the development and utilization of construction land are significantly affected by human activities.
Natural ecological space refers to the space with natural attributes that can provide ecological products or take ecological functions as the leading function [50]. Natural ecological space restoration aims to reasonably protect natural ecological resources, improve the ecological environment, realize the sustainable utilization of resources, alleviate the contradiction between the excessive expansion of construction space and ecological protection, and promote the sustainable development of cities [51]. Therefore, the restoration zoning of natural ecological space can serve as strong support for ecological protection planning, land use planning, and urban development planning to ensure the healthy development of the ecological environment in the study area during the economic transformation period [52,53,54].
Through the evaluation and classification of ecosystem service functions and ecological sensitivity, the results show that the four selected important ecosystem service function zones are different in spatial distribution. The extremely important zones of water conservation function are concentrated in the middle of Maowusu sandy land, namely, Wushen Banner and Otog Banner; the extremely important zones of soil and water conservation function are concentrated in the north of Maowusu sandy land, namely, Yijin Horo Banner; the extremely important zones of biodiversity are concentrated in the north of Maowusu sandy land, accounting for a relatively small proportion; and the extremely important zones of carbon sequestration service function are widely distributed, mainly in Otog Front Banner and Otog Banner. The spatial distribution of water loss and soil erosion sensitivity and land desertification sensitivity is different. The zones sensitive and extremely sensitive to water loss and soil erosion account for a large proportion and are widely distributed, whereas the high-value zones of land desertification sensitivity are relatively scattered. The main reason for this is that these zones experience low annual mean precipitation and lack groundwater, leading to low vegetation cover and susceptibility to wind erosion [55]. Moreover, unreasonable land use and abuse of water resources by humans have aggravated water loss, soil erosion, and land desertification [56]. Overall, differences in the distribution of importance and sensitivity of ecosystem service functions reflect the challenges faced by this area in terms of ecological protection and sustainable socioeconomic development.
At present, researchers have established a national spatial planning system in terms of supply and demand of ecosystem services [57], red line delineation of ecological protection [58], optimal allocation of land use [59], and ecological restoration of national space [60]. In the process of natural ecological space restoration zoning, this study fully considers the ecological sensitivity and ecosystem service function of Maowusu sandy land and coordinates the natural ecological space attributes. In order to ensure the scientific nature of natural ecological space restoration zoning, it also refers to the “natural ecological space use control method”, the “Inner Mongolia Autonomous Region Ecological Protection Red Line Delimitation Results”, and the social and economic data of the counties involved in Maowusu sandy land. It can be seen that the results of natural ecological space control zoning are more reliable. In addition, this study proposes different control measures and restoration strategies for different restoration zones, which provides scientific support for land use planning in Maowusu sandy land and has important reference value for achieving ecological protection and restoration goals and regional sustainable development.

5. Conclusions

Natural ecological space restoration zoning is an important way to seek sustainable and healthy development of regional ecological environments. This study found that the construction land and forest in Maowusu sandy land have continued to expand during the past 30 years, and the cropland and grassland space has been squeezed; the overall ecosystem service function shows a trend of weakening from southwest to northeast. Generally important zones and moderately important zones account for a large proportion, accounting for 47.67% and 47.83% of the total area, respectively. Important zones account for a relatively small proportion, accounting for 4.25% of the total area, and extremely important zones account for the smallest proportion, accounting for 0.25% of the total area. Ecologically sensitive zones are mainly distributed in the middle of Maowusu sandy land. Extremely sensitive zones only account for 2.05% of the total area of the study area, while moderately sensitive zones account for 42.43%.
The results of natural ecological space zoning show that the high-importance and high-sensitivity zones account for 3.60% of the total area of natural ecological space, which is mainly distributed near Yijinhuoluo Banner. The problem of soil erosion in this area is serious, and the contradiction between resources and environment is prominent. We should strictly abide by the red line of ecological protection and carry out comprehensive management of soil and water conservation projects. Moderately important and sensitive zones account for 80.42% of the total area of natural ecological space, accounting for the largest proportion. The water conservation function of this area is general, and the management and protection of water resources should be strengthened. The proportion of low-importance and low-sensitivity zones is 15.97%, and its ecosystem service function and ecological sensitivity are low. Ecosystem protection and near-natural restoration should be carried out, and moderate development and utilization should be carried out.
The research results provide a theoretical basis for the restoration of natural ecological space and the formulation of corresponding management measures in the region. However, whether the theory can be applied in practical work and whether it can produce the expected effect still needs to be verified by practice, which is also the focus of future research.

Author Contributions

T.Z., conceptualization, formal analysis, investigation, methodology, supervision, visualization, writing—original draft, and writing—review and editing; P.X., investigation, writing—original draft, data curation, and formal analysis; Z.Y., investigation, methodology, and visualization; J.G., investigation, methodology, and visualization. All authors have read and agreed to the published version of the manuscript.

Funding

This study was conducted with the support of the Inner Mongolia Autonomous Region’s Science and Technology Fund under the Prosper Mongolia Action Key Project (2022EEDSKJXM003), the National Key Research and Development Program of China (No. 2023YFF1305104), and the National Natural Science Foundation project (42307463).

Data Availability Statement

The original contributions presented in this study are included in the article; further inquiries can be directed to the corresponding author.

Conflicts of Interest

The authors declare that the research was conducted in the absence of any commercial or financial relationships that could be construed as potential conflicts of interest.

References

  1. Liang, P.; Yang, X.P. Landscape spatial patterns in the Maowusu Sandy Land, northern China and their impact factors. Catena 2016, 145, 321–333. [Google Scholar] [CrossRef]
  2. Gao, W.D.; Zheng, C.; Li, X.H. NDVI-based vegetation dynamics and their responses to climate change and human activities from 1982 to 2020: A case study in the Maowusu Sandy Land, China. Ecol. Indic. 2022, 137, 108745. [Google Scholar] [CrossRef]
  3. Chen, X.; Yu, L.; Du, Z. Distribution of ecological restoration projects associated with land use and land cover change in China and their ecological impacts. Sci. Total Environ. 2022, 825, 153938. [Google Scholar] [CrossRef]
  4. Lin, M.; Hou, L.; Qi, Z.; Wan, L. Impacts of climate change and human activities on vegetation NDVI in China’s Maowusu Sandy Land during 2000–2019. Ecol. Indic. 2022, 142, 109164. [Google Scholar] [CrossRef]
  5. Sun, Z.H.; Mao, Z.A.; Yang, L.Y. Impacts of climate change and afforestation on vegetation dynamic in the Maowusu Desert, China. Ecol. Indic. 2021, 129, 108020. [Google Scholar] [CrossRef]
  6. Karnieli, A.; Qin, Z.H.; Wu, B. Spatio-Temporal Dynamics of Land-Use and Land-Cover in the Maowusu Sandy Land, China, Using the Change Vector Analysis Technique. Remote Sens. 2014, 6, 9316–9339. [Google Scholar] [CrossRef]
  7. Li, S.; Wang, T.; Yan, C. Assessing the Role of Policies on Land-Use/Cover Change from 1965 to 2015 in the Maowusu Sandy Land, Northern China. Sustainability 2017, 9, 1164. [Google Scholar] [CrossRef]
  8. Zhang, M.M.; Wu, X.L. The rebound effects of recent vegetation restoration projects in Maowusu Sandy land of China. Ecol. Indic. 2020, 113, 106228. [Google Scholar] [CrossRef]
  9. Sadeghi, S.H.; Chamani, R.; Silabi, M.Z. Watershed health and ecological security zoning throughout Iran. Sci. Total Environ. 2023, 905, 167123. [Google Scholar] [CrossRef]
  10. Li, F.; Chen, X.C.; Li, X.; Hu, Y.; Han, J.; Hu, P. Method and control measures of ecological space zoning in Pearl River Delta urban agglomeration. Acta Ecol. Sin. 2021, 41, 5233–5241. [Google Scholar] [CrossRef]
  11. Wen, L.J.; Zhang, J.J. Land space control, land unbalanced development and externality research: Review and prospect. Land Sci. China 2015, 29, 4–12. [Google Scholar]
  12. Ellickson, R.C. Alternatives to Zoning: Covenants, Nuisance Rules, and Fines as Land Use Controls. Univ. Chic. Law Rev. 1973, 40, 681. [Google Scholar] [CrossRef]
  13. Chapman, M.R.; Kramer, D.L. Gradients in coral reef fish density and size across the Barbados Marine Reserve boundary: Effects of reserve protection and habitat characteristics. Mar. Ecol. Prog. Ser. 1999, 181, 81–96. [Google Scholar] [CrossRef]
  14. Rosenberg, A.A. Changing U.S. Ocean Policy Can Set a New Direction for Marine Resource Management. Ecol. Soc. 2009, 14, 6. [Google Scholar] [CrossRef]
  15. Soininen, J. Spatial structure in ecological communities–a quantitative analysis. Oikos 2015, 125, 160–166. [Google Scholar] [CrossRef]
  16. Govaert, L.; Pantel, J.H.; Meester, L.D. Eco-evolutionary partitioning metrics: Assessing the importance of ecological and evolutionary contributions to population and community change. Ecol. Lett. 2016, 19, 839–853. [Google Scholar] [CrossRef]
  17. Liu, Y.; Wu, K.; Li, X.; Li, X.; Cao, H. Adaptive Management of cropland Use Zoning Based on Land Types Classification: A Case Study of Henan Province. Land 2022, 11, 346. [Google Scholar] [CrossRef]
  18. Zhao, R.; Li, J.Y.; Wu, K.N. Cropland Use Zoning Based on Soil Function Evaluation from the Perspective of Black Soil Protection. Land 2021, 10, 605. [Google Scholar] [CrossRef]
  19. Zhao, R.; Zhang, X.D.; Gabriel, J.L. Classification of agricultural land consolidation types based on soil security to improve limiting factors adapted to local soil conditions. Land Degrad. Dev. 2023, 34, 3098–3113. [Google Scholar] [CrossRef]
  20. Zhang, A.L.; Wang, S.L.; Zhang, Z.P. Classification and Evaluation of Marginal Land for Potential Cultivation in Northwest China Based on Contiguity and Restrictive Factors. Agronomy 2024, 14, 2413. [Google Scholar] [CrossRef]
  21. Zhai, H.B.; Zhao, Z.N.; Zhang, Y.S. Research on the reform of forest resource asset use control system. For. Resour. Manag. 2014, 12, 16–20. [Google Scholar] [CrossRef]
  22. Dong, Y.E.; Xu, W.; Teng, X. Research on GIS-based marine functional zoning implementation evaluation method. Ocean Dev. Manag. 2014, 31, 27–31. [Google Scholar]
  23. Wu, Z.; Chen, S.J.; Xu, K. Ecological network resilience evaluation and ecological strategic space identification based on complex network theory: A case study of Nanjing city. Ecol. Indic. 2024, 158, 111604. [Google Scholar] [CrossRef]
  24. Zhang, J.; Yan, C.; Zhu, C. Identification of Potential Land-Use Conflicts between Agricultural and Ecological Space in an Ecologically Fragile Area of Southeastern China. Land 2021, 10, 1011. [Google Scholar] [CrossRef]
  25. Zhang, Y.Z.; Zheng, T.Y.; Chen, Y. Multi-Perspective Analysis of Land Changes in the Transitional Zone between the Maowusu Desert and the Loess Plateau in China from 2000 to 2020. Land 2023, 12, 1103. [Google Scholar] [CrossRef]
  26. Li, J.; Yu, L.; Wang, X.H. Exploring the Spatial-Temporal Patterns, Drivers, and Response Strategies of Desertification in the Maowusu Desert from Multiple Regional Perspectives. Sustainability 2024, 16, 9154. [Google Scholar] [CrossRef]
  27. Huang, Y.G.; Wang, N.A.; He, T.B. Historical desertification of the Maowusu Desert, Northern China: A multidisciplinary study. Geomorphology 2009, 110, 108–117. [Google Scholar] [CrossRef]
  28. Zhang, C.X.; Wang, X.M.; Li, J.C. Identifying the effect of climate change on desertification in northern China via trend analysis of potential evapotranspiration and precipitation. Ecol. Indic. 2020, 112, 106141. [Google Scholar] [CrossRef]
  29. Zhu, Z.C.; Shao, M.G.; Jia, X.X. Rainfall partitioning characteristics and simulation of typical shelter forest in Chinese Maowusu Sandy Land. Sci. Total Environ. 2024, 945, 174091. [Google Scholar] [CrossRef]
  30. Wang, C.D.; Wang, Y.T.; Wang, R.Q. Modeling and evaluating land-use/land-cover change for urban planning and sustainability: A case study of Dongying city, China. J. Clean. Prod. 2018, 172, 1529–1534. [Google Scholar] [CrossRef]
  31. Chen, M.; Wu, C.; Wu, J. Spatiotemporal changes of coastal land use land cover and its drivers in Shanghai, China between 1989 and 2015. Ocean Coast. Manag. 2023, 244, 106802. [Google Scholar] [CrossRef]
  32. Song, W.; Deng, X.Z. Land-use/land-cover change and ecosystem service provision in China. Sci. Total Environ. 2017, 576, 705–719. [Google Scholar] [CrossRef]
  33. Wang, Z.Y.; Zhang, H.J.; Wang, Y.Y. Corrigendum to “Deficit irrigation decision-making of indigowoad root based on a model coupling fuzzy theory and grey relational analysis” [Agric. Water Manag. 275 (2023) 107983]. Agric. Water Manag. 2023, 277, 108133. [Google Scholar] [CrossRef]
  34. Zou, J.J.; Zou, Y.Z. Evaluation and influencing factors of forest ecosystem service function in Yunnan Province. J. Resour. Ecol. 2025, 16, 297–305. [Google Scholar]
  35. Chai, S.S.; Liu, Y.; Ren, Y.M. Ecological sensitivity evaluation and zoning study of the proposed photovoltaic base in ecologically fragile areas-a case study of Qilian County. Ecology 2025, 1, 1–13. [Google Scholar] [CrossRef]
  36. Xiao, P.; Qin, F.C.; Yang, Z.Q. Study on functional evaluation and regulation zoning of ecological space in Inner Mongolia section of the Yellow River Basin. J. Southwest For. Univ. (Nat. Sci.) 2025, 45, 93–101. [Google Scholar]
  37. Qi, J.; Yuan, X.Z.; Liu, H. Spatio-temporal evolution characteristics of ecosystem services in important functional areas of water conservation in the Three Gorges Reservoir area of Chongqing. Soil Water Conserv. Bull. 2015, 35, 256–260+266+365. [Google Scholar] [CrossRef]
  38. Huang, X.Y.; Zhao, X.M.; Guo, X. Research on natural ecological space control zoning based on ecosystem service function and ecological sensitivity. Acta Ecol. Sin. 2020, 40, 1065–1076. [Google Scholar]
  39. Wang, B.; Gao, P.; Niu, X. Policy-driven China’s Grain to Green Program: Implications for ecosystem services. Ecosyst. Serv. 2017, 27, 38–47. [Google Scholar] [CrossRef]
  40. Li, Y.R.; Cao, Z.; Long, H.L. Dynamic analysis of ecological environment combined with land cover and NDVI changes and implications for sustainable urban–rural development: The case of Maowusu Sandy Land, China. J. Clean. Prod. 2017, 142, 697–715. [Google Scholar] [CrossRef]
  41. Zhang, D.; Deng, H. Historical human activities accelerated climate-driven desertification in China’s Maowusu Desert. Sci. Total Environ. 2020, 708, 134771. [Google Scholar] [CrossRef]
  42. Tessema, M.W.; Abebe, B.G.; Bantider, A. Physical and socioeconomic driving forces of land use and land cover changes: The case of Hawassa City, Ethiopia. Front. Environ. Sci. 2024, 12, 1203529. [Google Scholar] [CrossRef]
  43. Sharma, B.; Kumar, J.; Collier, N. Quantifying Carbon Cycle Extremes and Attributing Their Causes Under Climate and Land Use and Land Cover Change From 1850 to 2300. J. Geophys. Res. Biogeosci. 2022, 127, e2021JG006738. [Google Scholar] [CrossRef]
  44. Mgalula, M.E.; Majule, A.E.; Saria, A.E. Land use and land cover changes and their driving forces in selected forest reserves in Central Tanzania. Trees For. People 2024, 16, 100584. [Google Scholar] [CrossRef]
  45. Xu, J.; Meng, M.H.; Liu, Y.B. Assessing 30-Year Land Use and Land Cover Change and the Driving Forces in Qianjiang, China, Using Multitemporal Remote Sensing Images. Water 2023, 15, 3322. [Google Scholar] [CrossRef]
  46. Engida, T.G.; Nigussie, T.A.; Aneseyee, A.B.; Barnabas, J.; Abakumov, E. Land Use/Land Cover Change Impact on Hydrological Process in the Upper Baro Basin, Ethiopia. Appl. Environ. Soil Sci. 2021, 2021, 6617541. [Google Scholar] [CrossRef]
  47. Behnoosh, A.; Jesse, A.; Jeffrey, H.C. Incorporating Social and Policy Drivers into Land-Use and Land-Cover Projection. Sustainability 2023, 15, 14270. [Google Scholar] [CrossRef]
  48. Jin, X.; Jiang, P.; Li, M.; Gao, Y.; Yang, L. Mapping Chinese land system types from the perspectives of land use and management, biodiversity conservation and cultural landscape. Ecol. Indic. 2022, 141, 108981. [Google Scholar] [CrossRef]
  49. Zhu, X.; Yao, D.; Shi, H.; Qu, K.; Tang, Y.; Zhao, K. The Evolution Mode and Driving Mechanisms of the Relationship between Construction Land Use and Permanent Population in Urban and Rural Contexts: Evidence from China’s Land Survey. Land 2022, 11, 1721. [Google Scholar] [CrossRef]
  50. Gao, J.X.; Xu, D.L.; Qing, Q. Research on the construction and planning theory of natural ecological spatial pattern. Acta Ecol. Sin. 2020, 40, 749–755. [Google Scholar]
  51. Martin, D.M.; Mazzotta, M.; Bousquin, J. Combining ecosystem services assessment with structured decision making to support ecological restoration planning. Environ. Manag. 2018, 62, 608–618. [Google Scholar] [CrossRef]
  52. Zhang, Y.; Hu, Z.; Han, J.; Liu, X.; Feng, Z.; Zhang, X. Spatiotemporal Relationship between Ecological Restoration Space and Ecosystem Services in the Yellow River Basin, China. Land 2023, 12, 730. [Google Scholar] [CrossRef]
  53. Wessels, N.; Sitas, N.; Farrell, P.J. Inclusion of ecosystem services in the management of municipal natural open space systems. People Nat. 2023, 6, 301–320. [Google Scholar] [CrossRef]
  54. Zuo, L.Y.; Gao, J.B.; Du, F.J. The pairwise interaction of environmental factors for ecosystem services relationships in karst ecological priority protection and key restoration areas. Ecol. Indic. 2021, 131, 108125. [Google Scholar] [CrossRef]
  55. Fan, L.; Hou, G.C.; Tao, Z.P. The relationship between groundwater characteristics and vegetation distribution in the Salawusu Formation of the Maowusu Desert. J. Soil Water Conserv. 2018, 32, 151–157. [Google Scholar] [CrossRef]
  56. Bai, Z.Z.; Cui, J.X. Desertification and its causes in Maowusu Desert in recent 2000a. China Desert 2019, 39, 177–185. [Google Scholar]
  57. Zhou, J.; Feng, Z.X. Systematic conservation planning by integrating ecosystem services and biodiversity. Acta Ecol. Sin. 2023, 43, 522–533. [Google Scholar] [CrossRef]
  58. Ma, M.X.; Zhang, H.; Gao, J.X. Different methods comparison of delineating the ecological protection red line for biodiversity conservation. Acta Ecol. Sin. 2019, 39, 6959–6965. [Google Scholar] [CrossRef]
  59. Phinyoyang, A.; Ongsomwang, S. Optimizing Land Use and Land Cover Allocation for Flood Mitigation Using Land Use Change and Hydrological Models with Goal Programming, Chaiyaphum, Thailand. Land 2021, 10, 1317. [Google Scholar] [CrossRef]
  60. Chen, W.C.; Gu, T.C.; Xiang, J.W. Ecological restoration zoning of territorial space in China: An ecosystem health perspective. J. Environ. Manag. 2024, 364, 121371. [Google Scholar] [CrossRef]
Figure 1. Map of the study area.
Agronomy 15 01445 g001
Figure 2. Land use type distribution of Maowusu sandy land during 1990–2020a.
Agronomy 15 01445 g002
Figure 3. Statistical land use changes of Maowusu sandy land during 1990–2020a. Among them, (a) is the dynamic degree of land use, (b) is the proportion of different land use areas, (c) is the proportion of each land use type, and (d) is the land use transfer matrix.
Agronomy 15 01445 g003
Figure 4. Ecosystem service function indexes of Maowusu sandy land. Among them, (a) is the importance index of water conservation function, (b) is the importance index of water and soil conservation function, (c) is the importance Index of biodiversity conservation function, and (d) is the importance index of carbon sequestration service function.
Agronomy 15 01445 g004
Figure 5. Importance evaluation of ecosystem service functions.
Agronomy 15 01445 g005
Figure 6. Evaluation of ecological sensitivity. Among them, (a) is the water and soil loss sensitivity index, (b) is the land desertification sensitivity index, (c) is the evaluation of ecological sensitivity.
Agronomy 15 01445 g006
Figure 7. Restoration zoning of natural ecological space. Among them, (a) is the natural ecological space types, (b) is the importance evaluation of ecosystem service functions, (c) is the evaluation of ecological sensitivity, and (d) is the restoration zoning of natural ecological space.
Agronomy 15 01445 g007
Table 1. Data sources and preprocessing.
Data TypeSourceResolutionPreprocessing
NDVIMODI3Q1 products provided by the National Aeronautics and Space Administration (NASA) of the United States (http://lpdaac.usgs.gov, accessed on 5 March 2025), USA250 mProjection and resampling
NPPCarnegie–Ames–Stanford Approach (CASA) model30 mMaximum value composite, protection, and mask extraction
Soil typeHarmonized World Soil Database (HWSD), FAO1:100,000Mask extraction and resampling
MeteorologicalNational Earth System Science Data Center (http://www.geodata.cn, accessed on 8 March 2025), China1 kmMask extraction and resampling
DEM topographicGeographic spatial data cloud (http://www.gscloud.cn/, accessed on 10 March 2025), China30 mSplicing and projection
Land useScientific Data Center of Resources and Environment, the Chinese Academy of Sciences, China30 mProjection and mask extraction
Surface water, groundwaterWater Resources Bulletin of Inner Mongolia Autonomous Region Water Resources Department (https://www.nmg.gov.cn/, accessed on 1 April 2025), China\\
Total population,
Per capita income of farmers and herdsmen, output of livestock products
Inner Mongolia Statistical Comprehensive Data Platform (https://tj.nmg.gov.cn/, accessed on 1 April 2025), China\\
Table 3. Natural ecological restoration zoning.
Zoning ResultGenerally Important ZonesModerately Important ZonesImportant and Extremely Important Zones
Generally sensitive zonesLow-importance and low-sensitivity zonesLow-importance and low-sensitivity zonesModerately important and sensitive zones
Moderately sensitive zonesLow-importance and low-sensitivity zonesModerately important and sensitive zonesModerately important and sensitive zones
Sensitive and extremely sensitive zonesModerately important and sensitive zonesModerately important and sensitive zonesHigh-importance and high-sensitivity zones
Table 2. IESE and SSI calculation formula of each index.
Composite Index TypeCalculation Formula of Each IndexAnnotation
IESE W R = N P P m e a n · F s i c · F p r e · 1 F s l o N P P m e a n is the net primary productivity over years, F s i c   is the soil filtration capacity factor, F p r e is the annual mean precipitation factor, and F s l o is the slope factor.
S p r e = N P P m e a n · 1 K · 1 F s l o N P P m e a n is the annual mean primary productivity, K is the soil erodibility value, and F s l o is the slope factor.
S b i o = N P P m e a n · F p r e · F t e m · 1 F d e m F t e m is the average temperature over years, and F d e m is the elevation factor.
C t o t a l = C a b o v e + C b e l o w + C s o i l + C d e a d C t o t a l , C a b o v e , C b e l o w , C s o i l , and C d e a d represent the total carbon reserve, aboveground carbon reserve, underground carbon reserve, and dead organic carbon reserve, respectively.
SSI S S w = R · K · L S · C 4 R is the rainfall erosion factor, K is the soil erodibility, L S is the topographic relief factor, and C is the vegetation cover factor.
D = I · W · K · C 4 I is the dryness index factor, and W indicates the number of sandy and windy days.
Table 4. Gray relational coefficient.
Driving FactorsCroplandForestGrasslandWaterConstruction LandUnutilized Land
Relational DegreeBillingRelational DegreeBillingRelational DegreeBillingRelational DegreeBillingRelational DegreeBillingRelational DegreeBilling
Surface water0.79 60.81 60.80 60.80 60.78 70.80 6
Groundwater0.88 40.89 40.88 40.88 40.90 50.89 4
Total population0.92 30.94 30.91 30.91 30.95 10.92 3
Per capita income of farmers and herdsmen0.65 80.65 80.64 80.64 80.67 80.65 8
Output of livestock products0.71 70.72 70.70 70.70 70.78 60.71 7
Annual mean precipitation0.88 50.89 50.86 50.86 50.95 20.87 5
Annual mean temperature0.97 10.98 20.98 10.98 10.91 40.99 1
Annual mean evaporation0.96 20.98 10.97 20.97 20.92 30.98 2
Disclaimer/Publisher’s Note: The statements, opinions and data contained in all publications are solely those of the individual author(s) and contributor(s) and not of MDPI and/or the editor(s). MDPI and/or the editor(s) disclaim responsibility for any injury to people or property resulting from any ideas, methods, instructions or products referred to in the content.

